comparison of gas turbine degradations employed at five natural gas … · the gas turbine...
TRANSCRIPT

Presented at the 21st Symposium on Industrial Application of Gas Turbines (IAGT)
Banff, Alberta, Canada – October 19-21, 2015
The IAGT Committee is sponsored by the Canadian Gas Association. The IAGT Committee shall not be
responsible for statements or opinions advanced in technical papers or in Symposium or meeting discussions. 1
21st SYMPOSIUM OF THE INDUSTRIAL APPLICATION OF GAS TURBINES COMMITTEE
BANFF, ALBERTA, CANADA
OCTOBER 19-21, 2015
2015-IAGT-201
Comparison of Gas Turbine Degradations Employed at Five Natural
Gas Compressor Station Sites
K.K. Botros, C. Hartloper NOVA Chemicals, Centre for Applied Research
and
H. Golshan, D. Rogers
TransCanada PipeLines Limited
Calgary, Alberta, Canada
Key Words: Gas Turbine Degradation, Engine Soak Wash, Gas Pipeline, Compressor Station, Turbine
Performance.
Abstract
Gas Turbines employed in natural gas compressor stations are subject to recoverable and under-recoverable
degradation mostly manifested in the decrease in the isentropic efficiency of the air compressor part of the
engines. To counteract these decreases in compressor efficiency, it is standard procedure to ‘wash’ the engine
from time to time. In compressor stations on gas transmission systems, engine washes are performed off-line
and are scheduled in such intervals to optimize the maintenance procedure. This optimization requires accurate
prediction of the performance degradation of the engine over time. A methodology is developed to evaluate
the gas turbine degradation of all parts of the engine, and particularly the air compressor since it is most prone
to fouling and degradation. This methodology combines Gas Path Analysis (GPA) to evaluate the
thermodynamic parameters over the engine cycle followed by parameter estimation based on the Bayesian
Error-in-Variable Model (EVM) to filter the data of possible noise due to measurement errors. The
methodology quantifies the engine-performance degradation over time, and indicates the effectiveness of each
engine wash. In the present paper, the methodology is applied to assess both recoverable and un-recoverable
degradations of five gas turbine engines employed on TransCanada’s pipeline system in Canada. These
engines are: three GE LM2500+, one RR RB211-24G, and one GE LM1600 gas turbines. Hourly data were
collected over the past 5-7 years, and engine health parameters were extracted to delineate the respective
engine degradation and recovery post respective offline washes. The impacts of engine loading, site air quality
conditions and site elevation on engine-air-compressor isentropic efficiency are compared between the five
engines.

Presented at the 21st Symposium on Industrial Application of Gas Turbines (IAGT)
Banff, Alberta, Canada – October 19-21, 2015
The IAGT Committee is sponsored by the Canadian Gas Association. The IAGT Committee shall not be
responsible for statements or opinions advanced in technical papers or in Symposium or meeting discussions. 2
1. Introduction
Degradation in gas turbines (GT) is of great importance to industrial users for engine performance reliability
and operating costs. Degradation refers to a drop in the performance of the GT engine indicated by a loss of
available power and increased heat rate (or reduced thermal efficiency). In essence, degradation of the overall
engine is a combined effect of the degradation contribution from each of its components, although each
component of the engine degrades at a different rate [1]. Significant development has been made in
determining the mechanisms of engine degradation [1-3]. Fouling, corrosion, and impingement of foreign
objects on both the compressor and turbine blades are some of the mechanisms that cause engine degradation
[1]. These factors contribute towards reduced tip clearance, change in blade geometry and surface roughness
[2,3], which are manifested in a reduction in shaft power output and increase in the overall heat rate of the
engine.
From a maintenance and operational standpoint, engine wash is a standard procedure to both prevent the
engine from permanent damage and aid in performance recovery [3]. Correct scheduling of the engine wash is
extremely important to ensure optimal operation and maintenance of the engine [4], and this is only possible if
the degradation behavior of the engine can be accurately tracked over time. It is also important to establish the
effectiveness of each wash and its corresponding performance recovery during the operational period.
The main objective of this paper is to extend the methodology of degradation analysis, which was previously
applied to a single-spool GE LM2500+ engine [5], to twin-spool RR RB211-24G and GE LM1600 engines in
order to quantify the degree of engine-air-compressor degradation. The engine-air-compressor degradation is
tracked through changes in the isentropic efficiency of the air compressor of the respective engine. Five
engines employed at five different compressor station sites on TransCanada Pipeline system in Canada were
assessed. The operational data on which the analysis is performed was acquired for operating hours spanned
as far back as 2007-2009 through to August 2015.
2. Degradation Prediction Model
Gas Path Analysis (GPA) and an Error-in-Variables Model (EVM) were used to track the engine degradation
over time in a manner similar to that described by Botros et al. [5]. These methods will be described in the
following two subsections.
i) Gas Path Analysis
GPA refers to fundamental thermodynamic calculations to evaluate the properties (such as pressures,
temperatures, fuel flow rate, etc.) of the air and the products of combustion as they pass through the various
components of the engine [6]. For the GPA, three types of parameters are defined, namely:
1. Engine Parameters (y), such as pressure, temperature, fuel flow rate, shaft power etc. However, what is
read by the sensors at the plant are the Measured Engine Parameters (m), which are the true engine
parameters (y) distorted with noise (ε) due to instrumentation inaccuracies. (m = y + ε )
2. External Input Parameters (u), such as properties of the gas path, Lower Heating Value (LHV) of the fuel,
spool speeds, mechanical efficiencies of the components, etc.
Presented at the 21st Symposium on Industrial Application of Gas Turbines (IAGT)
Banff, Alberta, Canada – October 19-21, 2015
The IAGT Committee is sponsored by the Canadian Gas Association. The IAGT Committee shall not be
responsible for statements or opinions advanced in technical papers or in Symposium or meeting discussions. 3
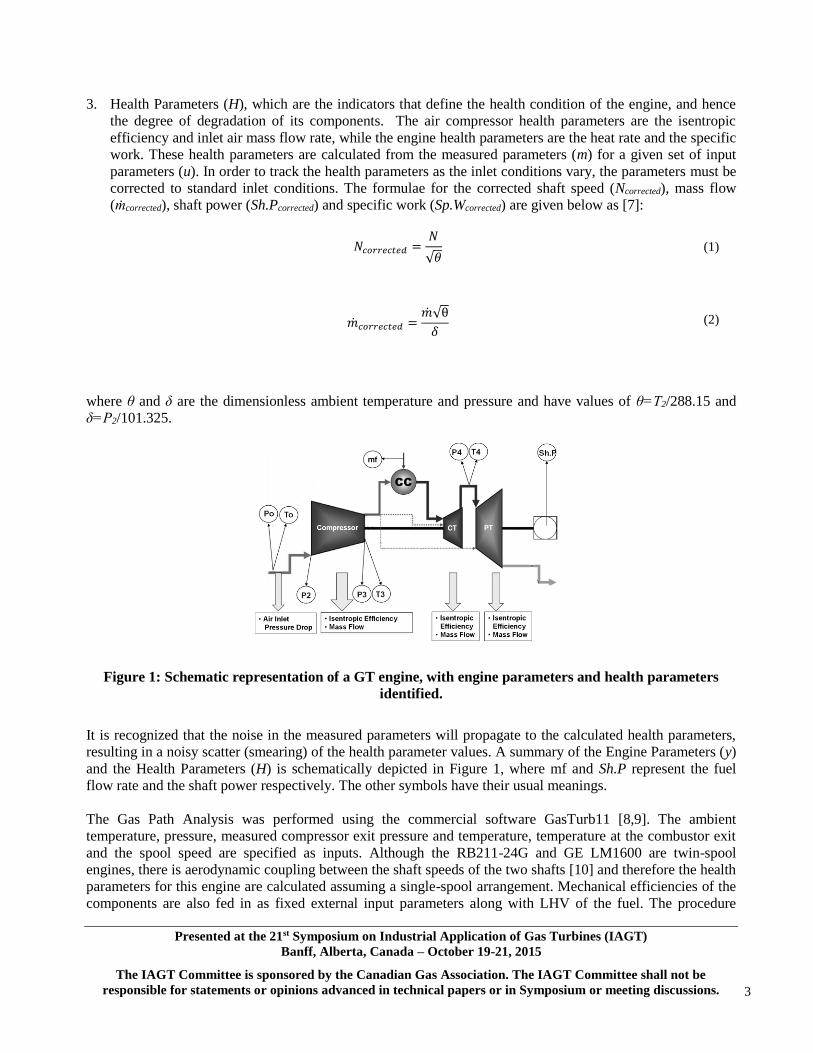
3. Health Parameters (H), which are the indicators that define the health condition of the engine, and hence
the degree of degradation of its components. The air compressor health parameters are the isentropic
efficiency and inlet air mass flow rate, while the engine health parameters are the heat rate and the specific
work. These health parameters are calculated from the measured parameters (m) for a given set of input
parameters (u). In order to track the health parameters as the inlet conditions vary, the parameters must be
corrected to standard inlet conditions. The formulae for the corrected shaft speed (Ncorrected), mass flow
(mcorrected), shaft power (Sh.Pcorrected) and specific work (Sp.Wcorrected) are given below as [7]:
𝑁𝑐𝑜𝑟𝑟𝑒𝑐𝑡𝑒𝑑 =𝑁
√𝜃 (1)
��𝑐𝑜𝑟𝑟𝑒𝑐𝑡𝑒𝑑 =��√θ
𝛿 (2)
where θ and δ are the dimensionless ambient temperature and pressure and have values of θ=T2/288.15 and
δ=P2/101.325.
Figure 1: Schematic representation of a GT engine, with engine parameters and health parameters
identified.
It is recognized that the noise in the measured parameters will propagate to the calculated health parameters,
resulting in a noisy scatter (smearing) of the health parameter values. A summary of the Engine Parameters (y)
and the Health Parameters (H) is schematically depicted in Figure 1, where mf and Sh.P represent the fuel
flow rate and the shaft power respectively. The other symbols have their usual meanings.
The Gas Path Analysis was performed using the commercial software GasTurb11 [8,9]. The ambient
temperature, pressure, measured compressor exit pressure and temperature, temperature at the combustor exit
and the spool speed are specified as inputs. Although the RB211-24G and GE LM1600 are twin-spool
engines, there is aerodynamic coupling between the shaft speeds of the two shafts [10] and therefore the health
parameters for this engine are calculated assuming a single-spool arrangement. Mechanical efficiencies of the
components are also fed in as fixed external input parameters along with LHV of the fuel. The procedure

Presented at the 21st Symposium on Industrial Application of Gas Turbines (IAGT)
Banff, Alberta, Canada – October 19-21, 2015
The IAGT Committee is sponsored by the Canadian Gas Association. The IAGT Committee shall not be
responsible for statements or opinions advanced in technical papers or in Symposium or meeting discussions. 4
completes the thermodynamic cycle of the engine operation and calculates the health parameters. However,
these health parameters, as calculated by GasTurb11, are also contaminated with noise that has propagated
from the measured parameters. Therefore, additional steps must be taken before data analysis is possible.
ii) Parameter Estimation – Bayesian Error-in-Variables Model (EVM)
EVM is commonly used in data modeling for obtaining point estimates of unknown parameters where all the
involved variables have inherent uncertainty in them [11]. EVM finds direct relevance to the problem in hand
in which all the measured variables and the health parameters from the GPA model are subject to varying
degrees of inaccuracies. Ordinary Least Squares method would not be suitable for the present problem as it
only corrects the dependent variable assuming the other variables to be error free [12]. Also, unlike in
Ordinary Least Squares, EVM models are dependent on prior knowledge of the error structure in each and the
vector of coefficient parameters used in the objective functions as of the variables involved [11] allowing
more accurate estimates. Detailed discussions on EVM can be found in Keeler and Reilly [11] and Seber and
Wild [13].
The EVM analysis involves defining the vector of variables involved, which must be conditioned off the
noise, as:
�� =
(
𝑃2𝑃3𝑇2𝑇3
𝑁1,𝑐𝑜𝑟𝑟𝑒𝑐𝑡𝑒𝑑𝜂𝑖𝑠 )
(3)
where P2 and P3 are the compressor suction and discharge pressure, T2 and T3 are the compressor suction and
discharge temperature, N1,corrected is the corrected compressor shaft speed and ηis is the compressor isentropic
efficiency. Similarly vector Ytrue contains the true values of the variables in Y in the same order. Next, a vector
of objective functions is defined as:
𝐹1 = 𝜂𝑖𝑠 − [𝑐0 + 𝑐1Ψ+ 𝑐2Ψ2] = 0 (4)
𝐹2 = 𝜂𝑖𝑠 −
𝑇2 [(𝑃3𝑃2⁄ )
𝑘−1𝑘− 1]
𝑇3 − 𝑇2= 0
(5)
where Ψ is the compressor head coefficient [10] and is defined as:
𝛹 =𝐻
𝑁1,𝑐𝑜𝑟𝑟𝑒𝑐𝑡𝑒𝑑2 𝛹 =
1
𝑁1,𝑐𝑜𝑟𝑟𝑒𝑐𝑡𝑒𝑑2
𝑍𝑅𝑇2(𝑘 − 1)/𝑘
[(𝑃3𝑃2)
𝑘−1𝑘− 1] (6)
where H, Z, R and k are the air-compressor enthalpy rise, average compressibility factor, gas constant and
isentropic exponent, respectively. The vector of the coefficient parameters used in the objective function is:
Presented at the 21st Symposium on Industrial Application of Gas Turbines (IAGT)
Banff, Alberta, Canada – October 19-21, 2015
The IAGT Committee is sponsored by the Canadian Gas Association. The IAGT Committee shall not be
responsible for statements or opinions advanced in technical papers or in Symposium or meeting discussions. 5
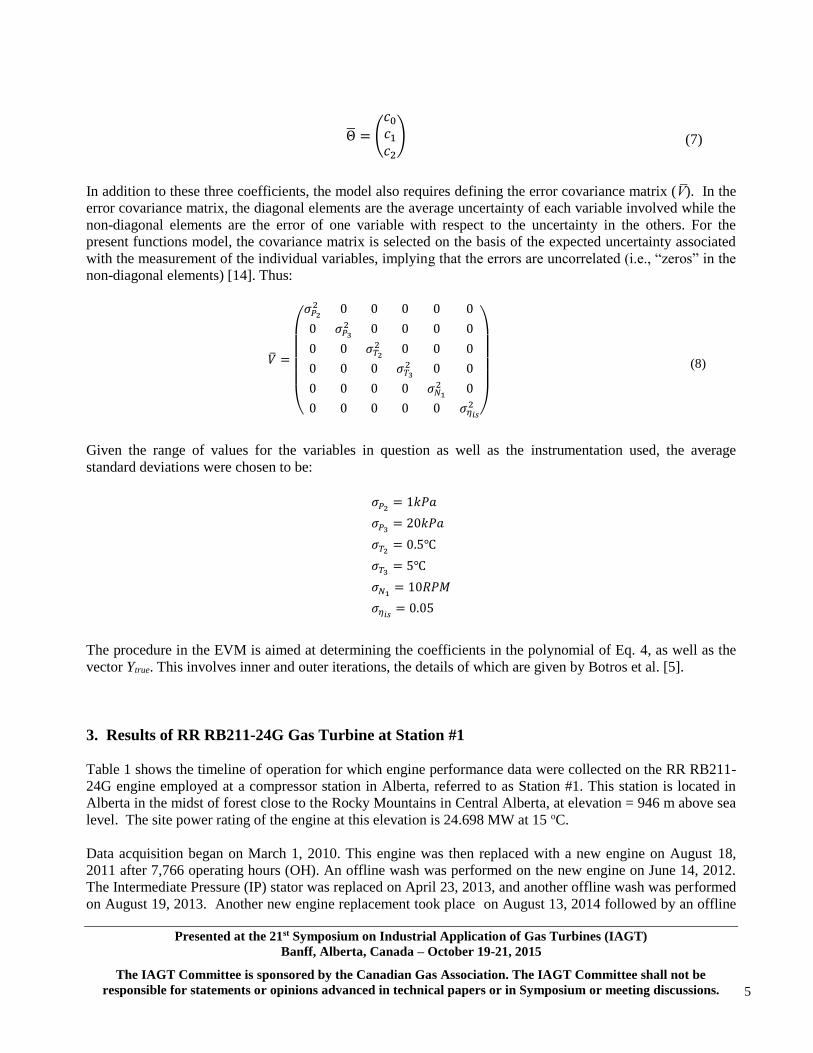
Θ = (
𝑐0𝑐1𝑐2) (7)
In addition to these three coefficients, the model also requires defining the error covariance matrix (V). In the
error covariance matrix, the diagonal elements are the average uncertainty of each variable involved while the
non-diagonal elements are the error of one variable with respect to the uncertainty in the others. For the
present functions model, the covariance matrix is selected on the basis of the expected uncertainty associated
with the measurement of the individual variables, implying that the errors are uncorrelated (i.e., “zeros” in the
non-diagonal elements) [14]. Thus:
�� =
(
𝜎𝑃22 0 0 0 0 0
0 𝜎𝑃32 0 0 0 0
0 0 𝜎𝑇22 0 0 0
0 0 0 𝜎𝑇32 0 0
0 0 0 0 𝜎𝑁12 0
0 0 0 0 0 𝜎𝜂𝑖𝑠2)
(8)
Given the range of values for the variables in question as well as the instrumentation used, the average
standard deviations were chosen to be:
𝜎𝑃2 = 1𝑘𝑃𝑎
𝜎𝑃3 = 20𝑘𝑃𝑎
𝜎𝑇2 = 0.5℃
𝜎𝑇3 = 5℃
𝜎𝑁1 = 10𝑅𝑃𝑀
𝜎𝜂𝑖𝑠 = 0.05
The procedure in the EVM is aimed at determining the coefficients in the polynomial of Eq. 4, as well as the
vector Ytrue. This involves inner and outer iterations, the details of which are given by Botros et al. [5].
3. Results of RR RB211-24G Gas Turbine at Station #1
Table 1 shows the timeline of operation for which engine performance data were collected on the RR RB211-
24G engine employed at a compressor station in Alberta, referred to as Station #1. This station is located in
Alberta in the midst of forest close to the Rocky Mountains in Central Alberta, at elevation = 946 m above sea
level. The site power rating of the engine at this elevation is 24.698 MW at 15 oC.
Data acquisition began on March 1, 2010. This engine was then replaced with a new engine on August 18,
2011 after 7,766 operating hours (OH). An offline wash was performed on the new engine on June 14, 2012.
The Intermediate Pressure (IP) stator was replaced on April 23, 2013, and another offline wash was performed
on August 19, 2013. Another new engine replacement took place on August 13, 2014 followed by an offline

Presented at the 21st Symposium on Industrial Application of Gas Turbines (IAGT)
Banff, Alberta, Canada – October 19-21, 2015
The IAGT Committee is sponsored by the Canadian Gas Association. The IAGT Committee shall not be
responsible for statements or opinions advanced in technical papers or in Symposium or meeting discussions. 6
wash on June 16, 2015 and data continued to be collected until August 18, 2015 (end of data acquisition). To
track the effect the engine IP stator and GG replacements, as well as the offline washes, the timeline has been
separated into seven distinct periods as shown in Table 1. The OH in each period is also indicated spanning
the aforementioned dates of respective events.
Table 1: Timeline of data acquisition for the RR RB211-24G engine at compressor station #1.
The engine degradation and recovery (or un-recovery) is assessed based on evaluation of one of the engine
health parameters shown in Fig. 1, namely, the isentropic efficiency of the air compressor. This was found to
be most prone to engine degradation among other health parameters [15-17]. The approach used is that the air
compressor isentropic efficiency during the last 500 OH of one period is mapped as a function of compressor
pressure ratio (Pr=P3/P2) and corrected low pressure compressor spool speed (N1,corrected), and compared to the
first 500 OH of the subsequent period. It should be noted that the corrected spool speed (N1,corrected) is that of
the low pressure compressor in the case of twin spool engines. The power turbine speed is not considered here
since the health parameter under consideration in the present paper is chosen to be the isentropic efficiency of
the air compression section of the gas generator through the axial compressor (single spool or twin spool).
Contour maps of N1,corrected vs. Pr colour-coded by engine-air-compressor isentropic efficiency are used to track
the compressor degradation between data sets. These comparisons across each event (hardware replacements
or engine washes) are shown chronologically in Fig. 2.
It is evident that the engine replacement on August 18, 2011 and August 13, 2014 significantly improved the
isentropic efficiency (contrast the last 500 hrs and first 500 hrs in Figs. 2a and 2e). Figure 2c shows the effects
Date Event Event #
March 1, 2010 Start of Data Acquisition
August 18, 2011 New Engine Replacement E1
June 14, 2012 Offline Soak Wash E2
April 23, 2013 New IP Stator Replacement E3
August 19, 2013 Offline Soak Wash E4
August 13, 2014 New Engine Replacement E5
June 16, 2015 Offline Soak Wash E6
August 18, 2015 End of Data Acquisition
Period 7 (OH = 1475)
Period 6 (OH = 6994)
Period 1 (OH = 7766)
Period 2 (OH = 4984)
Period 3 (OH = 7161)
Period 4 (OH = 2188)
Period 5 (OH = 8158)
Presented at the 21st Symposium on Industrial Application of Gas Turbines (IAGT)
Banff, Alberta, Canada – October 19-21, 2015
The IAGT Committee is sponsored by the Canadian Gas Association. The IAGT Committee shall not be
responsible for statements or opinions advanced in technical papers or in Symposium or meeting discussions. 7
of the IP stator replacement indicating only slight improvement in the isentropic efficiency. Figures 2b, 2d and
2f show the effects of the three soak washes of the engine, respectively, where it can be observed that these
washes have little effect on improving the isentropic efficiency. A trend noticed in all of the contour maps is
the very narrow relationship observed between Pr and N1,corrected. From the typical compressor characteristic
map shown in Figure 3 [18], it can be discerned that along the maximum efficiency line there is only one
N1,corrected for a given Pr. Therefore, the tight relationship between Pr and N1,corrected for this engine air
compressor implies that the engine is being run very close to its maximum efficiency.
To quantitatively determine the degradation during periods as well as the improvement (or lack of) between
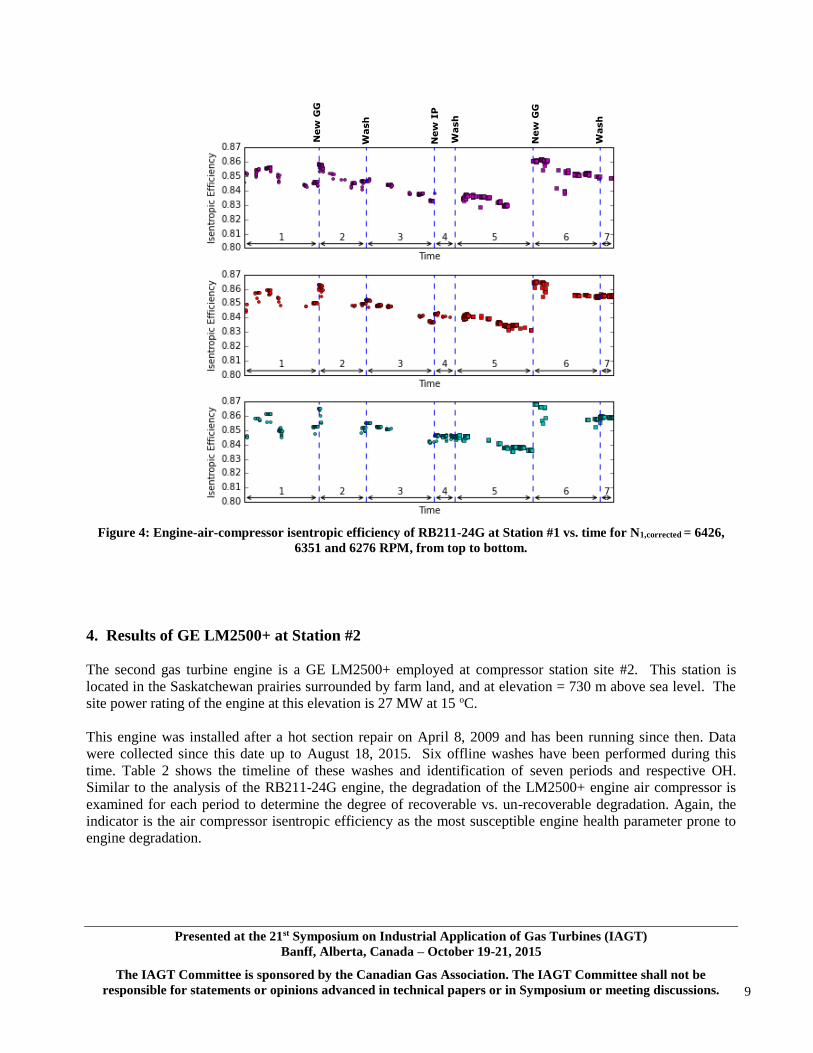
periods, the isentropic efficiency is tracked over time for constant N1,corrected and Pr. Figure 4 shows the time-
history of engine air compressor isentropic efficiency for three selected N1,corrected of 6426, 6351 and 6276
RPM, where the following general trends can be observed. The following observations can be made:
In period 1, the compressor isentropic efficiency degrades from the beginning of the data acquisition
until the engine replacement, after which the isentropic efficiency improves by approximately 1.2
percentage points.
In period 2, the isentropic efficiency begins to degrade immediately, and continues to degrade at a
constant rate through to the end of period 3, decreasing by 2.5 percentage points in the 12,145 total
OH of periods 2 and 3 combined. Note that the first offline wash only slightly improves the isentropic
efficiency, with an increase of 0.3 percentage points.
The IP replacement between periods 3 and 4 improves the isentropic efficiency by approximately 0.5
percentage points.
Periods 4 and 5 (combined) show a decrease in the isentropic efficiency by approximately 1.0
percentage point over a relatively long OH of 10346 hours. Again the second offline wash of the
engine did not result in significant improvement in the isentropic efficiency.
The new engine replacement on August 13, 2014 resulted in a significant recovery of compressor
isentropic efficiency of approximately 0.33 percentage points, while the last offline wash on June 16,
2015 again did not seem to recover the degradation that occurred during period 6. Note that the above-
mentioned trends are consistent across all three N1,corrected.

Presented at the 21st Symposium on Industrial Application of Gas Turbines (IAGT)
Banff, Alberta, Canada – October 19-21, 2015
The IAGT Committee is sponsored by the Canadian Gas Association. The IAGT Committee shall not be
responsible for statements or opinions advanced in technical papers or in Symposium or meeting discussions. 8
Figure 2: Contour map of engine air compressor isentropic efficiency changes before and after each
event of the RB211-24G engine employed at Station #1.
Figure 3: Typical axial compressor characteristic map [18].
Last 500 hrs of Period 1 First 500 hrs of Period 2
(Fig. 2a)
Last 500 hrs of Period 2 First 500 hrs of Period 3
(Fig. 2b)
Last 500 hrs of Period 3 First 500 hrs of Period 4
(Fig. 2c)
Last 500 hrs of Period 4 First 500 hrs of Period 5
(Fig. 2d)
Last 500 hrs of Period 5 First 500 hrs of Period 6
(Fig. 2e)
Last 500 hrs of Period 6 First 500 hrs of Period 7
(Fig. 2f)
Entropy (s)
Tota
l E
nth
alp
y (
h)
1
2
2’P1
P2
11
)(1
11
'
2k
k
rav
isen P
k
k
RTZhhH
)( 12 hhHactual
)(
)(
12
1
'
2
hh
hh
H
H
actual
isenisen
where:
Hisen - isentropic head across the compressor
k - average isentropic exponent of the compressed gas
Pr - pressure ratio
R - gas constant
T1 - upstream gas temperature
Zav - average compressibility factor across the compressor
isen - Compressor adiabatic efficiency
Presented at the 21st Symposium on Industrial Application of Gas Turbines (IAGT)
Banff, Alberta, Canada – October 19-21, 2015
The IAGT Committee is sponsored by the Canadian Gas Association. The IAGT Committee shall not be
responsible for statements or opinions advanced in technical papers or in Symposium or meeting discussions. 9
Figure 4: Engine-air-compressor isentropic efficiency of RB211-24G at Station #1 vs. time for N1,corrected = 6426,
6351 and 6276 RPM, from top to bottom.
4. Results of GE LM2500+ at Station #2
The second gas turbine engine is a GE LM2500+ employed at compressor station site #2. This station is
located in the Saskatchewan prairies surrounded by farm land, and at elevation = 730 m above sea level. The
site power rating of the engine at this elevation is 27 MW at 15 oC.
This engine was installed after a hot section repair on April 8, 2009 and has been running since then. Data
were collected since this date up to August 18, 2015. Six offline washes have been performed during this
time. Table 2 shows the timeline of these washes and identification of seven periods and respective OH.
Similar to the analysis of the RB211-24G engine, the degradation of the LM2500+ engine air compressor is
examined for each period to determine the degree of recoverable vs. un-recoverable degradation. Again, the
indicator is the air compressor isentropic efficiency as the most susceptible engine health parameter prone to
engine degradation.
New
GG
Wash
New
IP
New
GG
Wash
Wash
Presented at the 21st Symposium on Industrial Application of Gas Turbines (IAGT)
Banff, Alberta, Canada – October 19-21, 2015
The IAGT Committee is sponsored by the Canadian Gas Association. The IAGT Committee shall not be
responsible for statements or opinions advanced in technical papers or in Symposium or meeting discussions. 10
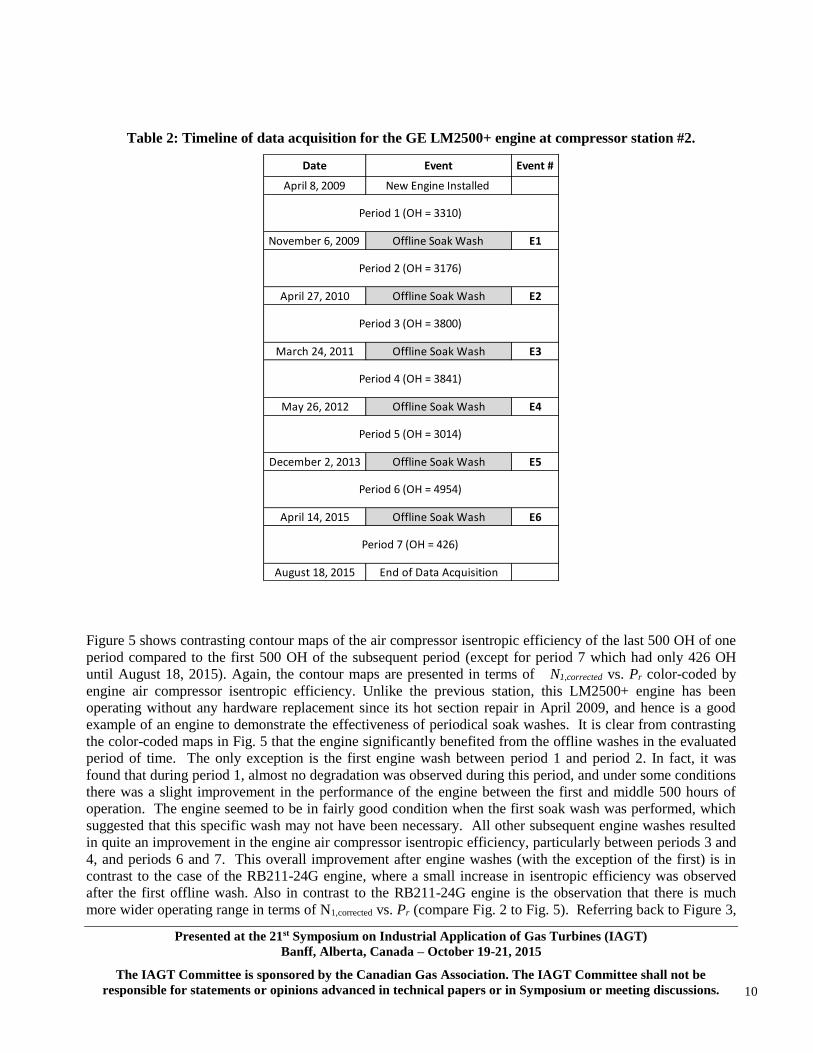
Table 2: Timeline of data acquisition for the GE LM2500+ engine at compressor station #2.
Figure 5 shows contrasting contour maps of the air compressor isentropic efficiency of the last 500 OH of one
period compared to the first 500 OH of the subsequent period (except for period 7 which had only 426 OH
until August 18, 2015). Again, the contour maps are presented in terms of N1,corrected vs. Pr color-coded by
engine air compressor isentropic efficiency. Unlike the previous station, this LM2500+ engine has been
operating without any hardware replacement since its hot section repair in April 2009, and hence is a good
example of an engine to demonstrate the effectiveness of periodical soak washes. It is clear from contrasting
the color-coded maps in Fig. 5 that the engine significantly benefited from the offline washes in the evaluated
period of time. The only exception is the first engine wash between period 1 and period 2. In fact, it was
found that during period 1, almost no degradation was observed during this period, and under some conditions
there was a slight improvement in the performance of the engine between the first and middle 500 hours of
operation. The engine seemed to be in fairly good condition when the first soak wash was performed, which
suggested that this specific wash may not have been necessary. All other subsequent engine washes resulted
in quite an improvement in the engine air compressor isentropic efficiency, particularly between periods 3 and
4, and periods 6 and 7. This overall improvement after engine washes (with the exception of the first) is in
contrast to the case of the RB211-24G engine, where a small increase in isentropic efficiency was observed
after the first offline wash. Also in contrast to the RB211-24G engine is the observation that there is much
more wider operating range in terms of N1,corrected vs. Pr (compare Fig. 2 to Fig. 5). Referring back to Figure 3,
Date Event Event #
April 8, 2009 New Engine Installed
November 6, 2009 Offline Soak Wash E1
April 27, 2010 Offline Soak Wash E2
March 24, 2011 Offline Soak Wash E3
May 26, 2012 Offline Soak Wash E4
December 2, 2013 Offline Soak Wash E5
April 14, 2015 Offline Soak Wash E6
August 18, 2015 End of Data Acquisition
Period 7 (OH = 426)
Period 5 (OH = 3014)
Period 6 (OH = 4954)
Period 1 (OH = 3310)
Period 2 (OH = 3176)
Period 3 (OH = 3800)
Period 4 (OH = 3841)

Presented at the 21st Symposium on Industrial Application of Gas Turbines (IAGT)
Banff, Alberta, Canada – October 19-21, 2015
The IAGT Committee is sponsored by the Canadian Gas Association. The IAGT Committee shall not be
responsible for statements or opinions advanced in technical papers or in Symposium or meeting discussions. 11
this wider range implies that the LM2500+ engine air compressor is not operating at the maximum isentropic
efficiency. Additionally, since this engine is operating in the midst of a farm land in the Saskatchewan
prairies, the air quality is prone to be not as pure as that in the mountain forest (i.e. Station #1). Hence, engine
washes seem to be effective in Station #2 than in Station #1.
Similarly, to quantitatively determine the degradation during periods as well as the improvement following
each wash, the isentropic efficiency is tracked over time for constant N1,corrected and Pr. Figure 6 shows the
time-history of compressor isentropic efficiency for N1,corrected of 9669, 9594 and 9519 RPM, where the
following general trends can be observed:
Between periods 1 and 2, there is hardly any improvement, but between periods 2 and 3 there is a gain
of 1.2 percentage points after the engine wash.
Between periods 3 and 4, after the third offline wash, the isentropic efficiency increases by 2.2
percentage points.
During period 4, the efficiency degrades by 1 percentage point, and subsequently recovers 1
percentage point before the fourth offline wash. Similar trend is observed in period 5.
As for the offline wash between periods 5 and 6, it appears that the engine lost one percentage point of
isentropic efficiency as is also demonstrated in the contour maps in Fig. 5e.
The last soak wash after period 6 shows a recovery of 1.1 percentage point in isentropic efficiency.
Note that all of the above mentioned trends are consistent across all three N1,corrected.

Presented at the 21st Symposium on Industrial Application of Gas Turbines (IAGT)
Banff, Alberta, Canada – October 19-21, 2015
The IAGT Committee is sponsored by the Canadian Gas Association. The IAGT Committee shall not be
responsible for statements or opinions advanced in technical papers or in Symposium or meeting discussions. 12
Figure 5: Contour map of engine air compressor isentropic efficiency changes before and after each
event of the LM2500+ engine employed at Station #2.
Last 500 hrs of Period 1 First 500 hrs of Period 2
(Fig. 5a)
Last 500 hrs of Period 2 First 500 hrs of Period 3
(Fig. 5b)
(Fig. 5c)
Last 500 hrs of Period 3 First 500 hrs of Period 4
(Fig. 5d)
Last 500 hrs of Period 4 First 500 hrs of Period 5
(Fig. 5e)
Last 500 hrs of Period 6 First 426 hrs of Period 7
(Fig. 5f)

Presented at the 21st Symposium on Industrial Application of Gas Turbines (IAGT)
Banff, Alberta, Canada – October 19-21, 2015
The IAGT Committee is sponsored by the Canadian Gas Association. The IAGT Committee shall not be
responsible for statements or opinions advanced in technical papers or in Symposium or meeting discussions. 13
Figure 6: Engine-air-compressor isentropic efficiency of LM2500+ at Station #2 vs. time for N1,corrected=
9669, 9594 and 9519 RPM, from top to bottom.
5. Results of GE LM2500+ at Station #3
The third gas turbine engine is also a GE LM2500+ employed at compressor station site #3. This station is
located in the forested area in Ontario, and at elevation = 741 m above sea level. The site power rating of the
engine at this elevation is 27.25 MW at 15 oC.
Data were collected from January 1, 2008 through to August 18, 2015. The total number of OH during this
almost 7 years is 16,883 hours. Two offline washes have been performed during this time. Table 3 shows the
timeline of these washes and identification of three periods and respective breakdown of the OH. Similar to
the analysis of the previous two engines, the degradation of the engine air compressor is examined for each
period to determine the degree of degradation levels during each of the three periods.
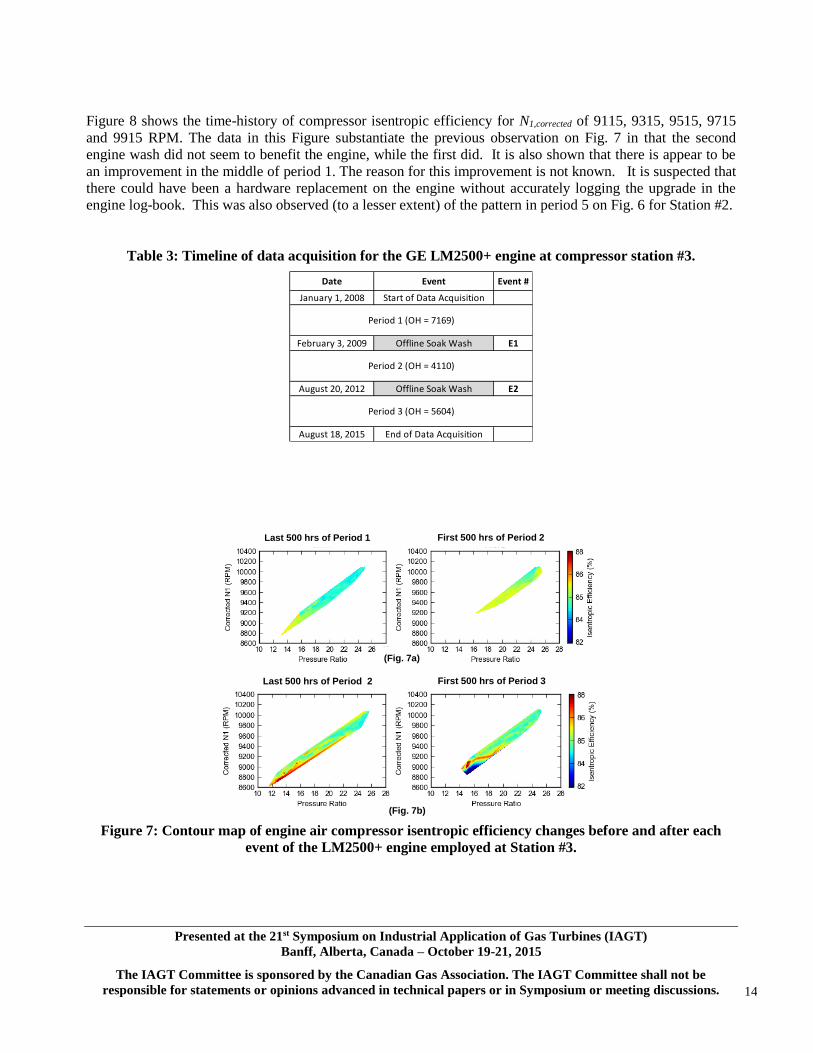
Figure 7 shows contrasting contour maps of the air compressor isentropic efficiency of the last 500 OH of one
period compared to the first 500 OH of the subsequent period. It is shown that period 1 has the longest OH
that the engine has been operating without a wash. As a result, there is 1.0-1.5 percentage points decrease in
the air-compressor isentropic efficiency during this period. The second wash that followed after 4,110 OH in
the period 2 did not seem to have benefited the engine as is seen from contrasting the color-coded maps in Fig.
7b.
Wash
Wash
Wash
Wash
Wash
Wash
Presented at the 21st Symposium on Industrial Application of Gas Turbines (IAGT)
Banff, Alberta, Canada – October 19-21, 2015
The IAGT Committee is sponsored by the Canadian Gas Association. The IAGT Committee shall not be
responsible for statements or opinions advanced in technical papers or in Symposium or meeting discussions. 14
Figure 8 shows the time-history of compressor isentropic efficiency for N1,corrected of 9115, 9315, 9515, 9715
and 9915 RPM. The data in this Figure substantiate the previous observation on Fig. 7 in that the second
engine wash did not seem to benefit the engine, while the first did. It is also shown that there is appear to be
an improvement in the middle of period 1. The reason for this improvement is not known. It is suspected that
there could have been a hardware replacement on the engine without accurately logging the upgrade in the
engine log-book. This was also observed (to a lesser extent) of the pattern in period 5 on Fig. 6 for Station #2.
Table 3: Timeline of data acquisition for the GE LM2500+ engine at compressor station #3.
Figure 7: Contour map of engine air compressor isentropic efficiency changes before and after each
event of the LM2500+ engine employed at Station #3.
Date Event Event #
January 1, 2008 Start of Data Acquisition
February 3, 2009 Offline Soak Wash E1
August 20, 2012 Offline Soak Wash E2
August 18, 2015 End of Data Acquisition
Period 1 (OH = 7169)
Period 2 (OH = 4110)
Period 3 (OH = 5604)
Last 500 hrs of Period 1 First 500 hrs of Period 2
(Fig. 7a)
Last 500 hrs of Period 2 First 500 hrs of Period 3
(Fig. 7b)

Presented at the 21st Symposium on Industrial Application of Gas Turbines (IAGT)
Banff, Alberta, Canada – October 19-21, 2015
The IAGT Committee is sponsored by the Canadian Gas Association. The IAGT Committee shall not be
responsible for statements or opinions advanced in technical papers or in Symposium or meeting discussions. 15
Figure 8: Engine-air-compressor isentropic efficiency of LM2500+ at Station #3 vs. time for N1,corrected =
9115, 9315, 9515, 9715 and 9915 RPM, from top to bottom.
6. Results of GE LM2500+ at Station #4
The fourth gas turbine engine is also a GE LM2500+ employed at compressor station site #4. This station is
located in a forested area in southern Alberta, and at the highest elevation of all of the five engines examined
in this paper (elev. = 1,359 m above sea level). The site power rating of the engine at this elevation is 24.881
MW at 15 oC.
Data were collected from December 23, 2013 through to August 18, 2015. Two washes were conducted on
this engine since the time of the start of the data acquisition. Table 4 shows the timeline of these two washes
and identification of three periods and the respective breakdown of the OH.
Wash
Wash
Presented at the 21st Symposium on Industrial Application of Gas Turbines (IAGT)
Banff, Alberta, Canada – October 19-21, 2015
The IAGT Committee is sponsored by the Canadian Gas Association. The IAGT Committee shall not be
responsible for statements or opinions advanced in technical papers or in Symposium or meeting discussions. 16
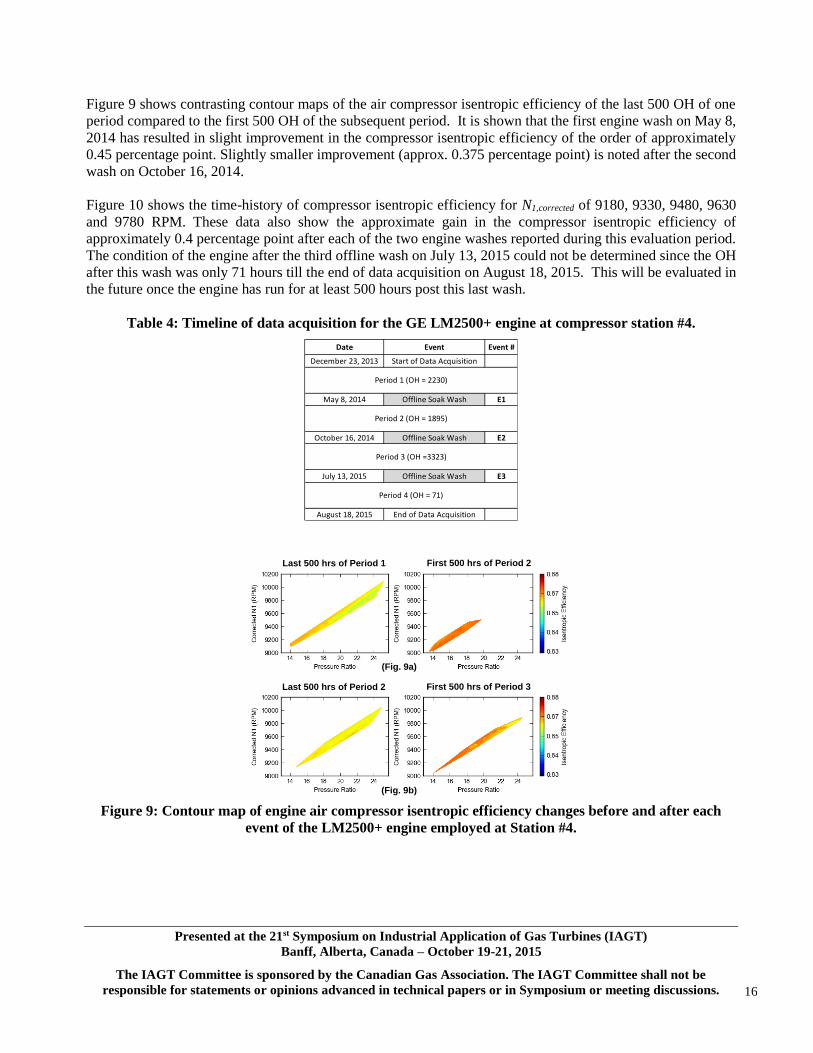
Figure 9 shows contrasting contour maps of the air compressor isentropic efficiency of the last 500 OH of one
period compared to the first 500 OH of the subsequent period. It is shown that the first engine wash on May 8,
2014 has resulted in slight improvement in the compressor isentropic efficiency of the order of approximately
0.45 percentage point. Slightly smaller improvement (approx. 0.375 percentage point) is noted after the second
wash on October 16, 2014.
Figure 10 shows the time-history of compressor isentropic efficiency for N1,corrected of 9180, 9330, 9480, 9630
and 9780 RPM. These data also show the approximate gain in the compressor isentropic efficiency of
approximately 0.4 percentage point after each of the two engine washes reported during this evaluation period.
The condition of the engine after the third offline wash on July 13, 2015 could not be determined since the OH
after this wash was only 71 hours till the end of data acquisition on August 18, 2015. This will be evaluated in
the future once the engine has run for at least 500 hours post this last wash.
Table 4: Timeline of data acquisition for the GE LM2500+ engine at compressor station #4.
Figure 9: Contour map of engine air compressor isentropic efficiency changes before and after each
event of the LM2500+ engine employed at Station #4.
Date Event Event #
December 23, 2013 Start of Data Acquisition
May 8, 2014 Offline Soak Wash E1
October 16, 2014 Offline Soak Wash E2
July 13, 2015 Offline Soak Wash E3
August 18, 2015 End of Data Acquisition
Period 1 (OH = 2230)
Period 2 (OH = 1895)
Period 3 (OH =3323)
Period 4 (OH = 71)
Last 500 hrs of Period 1 First 500 hrs of Period 2
(Fig. 9a)
Last 500 hrs of Period 2 First 500 hrs of Period 3
(Fig. 9b)

Presented at the 21st Symposium on Industrial Application of Gas Turbines (IAGT)
Banff, Alberta, Canada – October 19-21, 2015
The IAGT Committee is sponsored by the Canadian Gas Association. The IAGT Committee shall not be
responsible for statements or opinions advanced in technical papers or in Symposium or meeting discussions. 17
Figure 10: Engine-air-compressor isentropic efficiency of LM2500+ at Station #4 vs. time for N1,corrected =
9180, 9330, 9480, 9630 and 9780 RPM, from top to bottom.
Wash
Wash
Presented at the 21st Symposium on Industrial Application of Gas Turbines (IAGT)
Banff, Alberta, Canada – October 19-21, 2015
The IAGT Committee is sponsored by the Canadian Gas Association. The IAGT Committee shall not be
responsible for statements or opinions advanced in technical papers or in Symposium or meeting discussions. 18
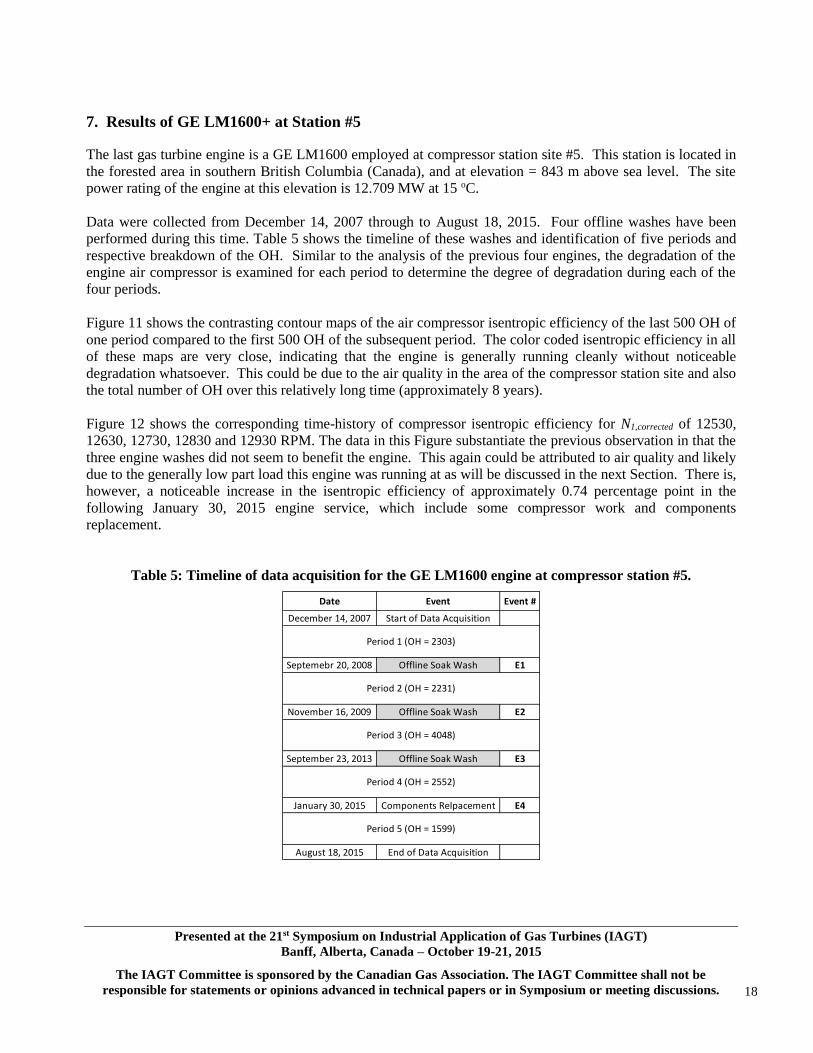
7. Results of GE LM1600+ at Station #5
The last gas turbine engine is a GE LM1600 employed at compressor station site #5. This station is located in
the forested area in southern British Columbia (Canada), and at elevation = 843 m above sea level. The site
power rating of the engine at this elevation is 12.709 MW at 15 oC.
Data were collected from December 14, 2007 through to August 18, 2015. Four offline washes have been
performed during this time. Table 5 shows the timeline of these washes and identification of five periods and
respective breakdown of the OH. Similar to the analysis of the previous four engines, the degradation of the
engine air compressor is examined for each period to determine the degree of degradation during each of the
four periods.
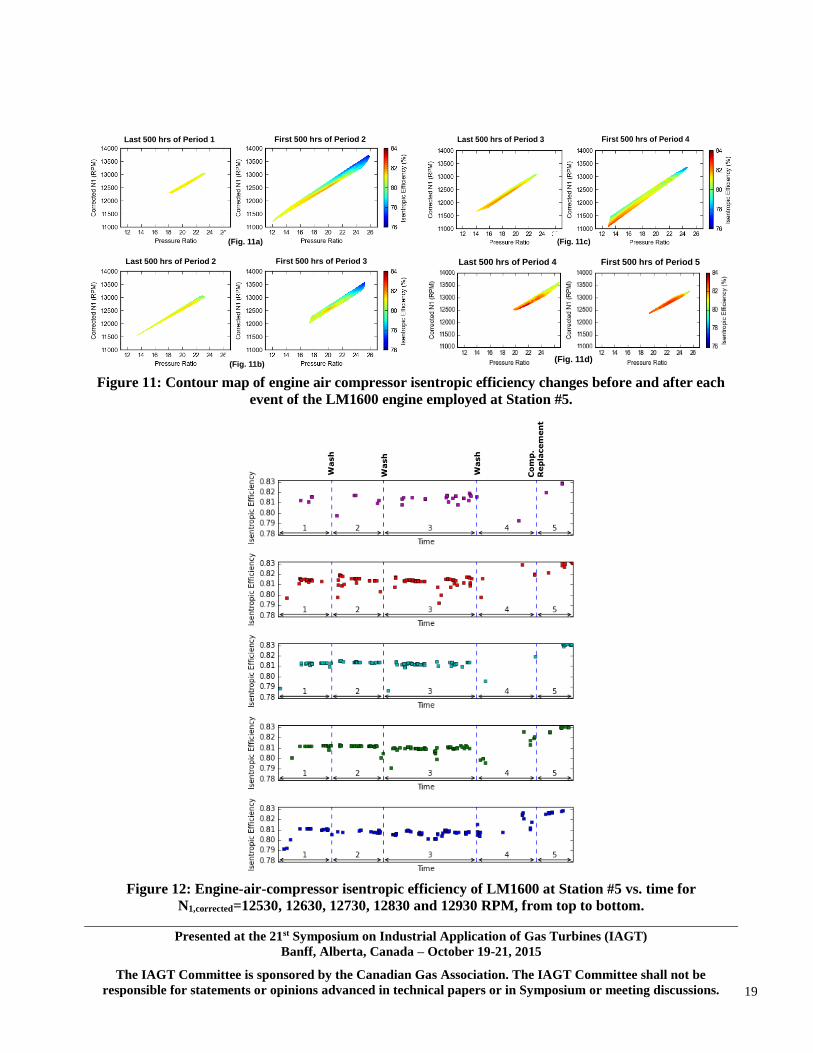
Figure 11 shows the contrasting contour maps of the air compressor isentropic efficiency of the last 500 OH of
one period compared to the first 500 OH of the subsequent period. The color coded isentropic efficiency in all
of these maps are very close, indicating that the engine is generally running cleanly without noticeable
degradation whatsoever. This could be due to the air quality in the area of the compressor station site and also
the total number of OH over this relatively long time (approximately 8 years).
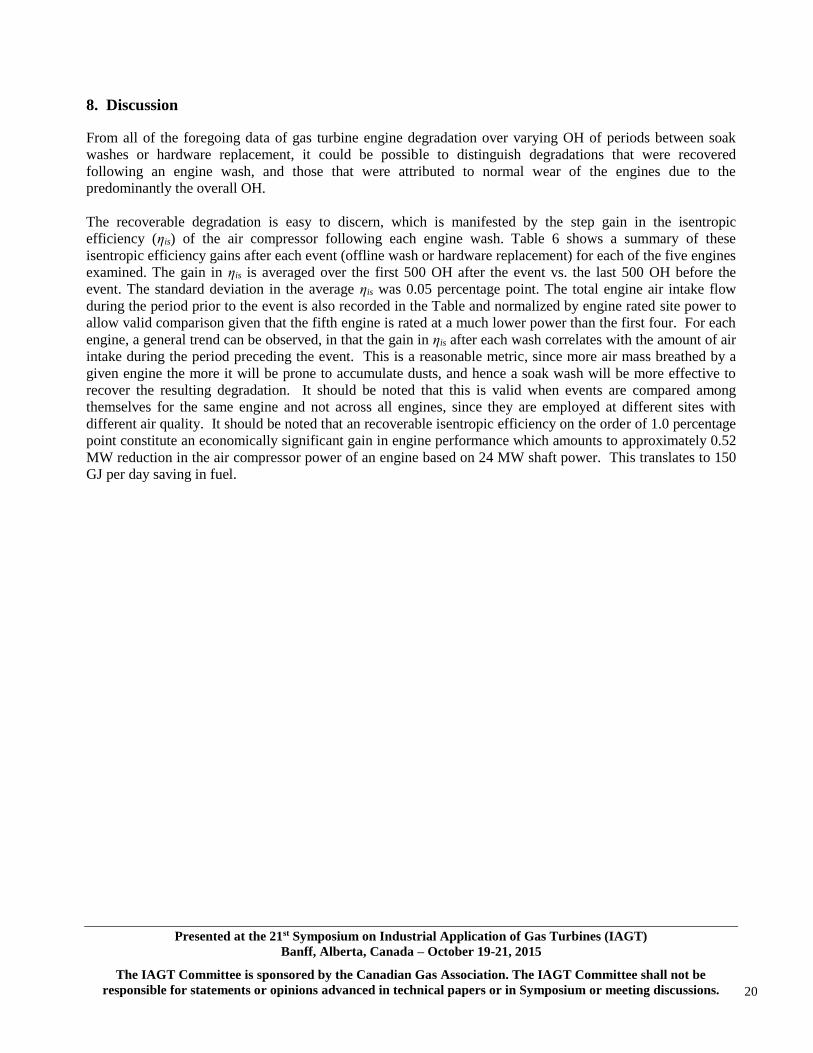
Figure 12 shows the corresponding time-history of compressor isentropic efficiency for N1,corrected of 12530,
12630, 12730, 12830 and 12930 RPM. The data in this Figure substantiate the previous observation in that the
three engine washes did not seem to benefit the engine. This again could be attributed to air quality and likely
due to the generally low part load this engine was running at as will be discussed in the next Section. There is,
however, a noticeable increase in the isentropic efficiency of approximately 0.74 percentage point in the
following January 30, 2015 engine service, which include some compressor work and components
replacement.
Table 5: Timeline of data acquisition for the GE LM1600 engine at compressor station #5.
Date Event Event #
December 14, 2007 Start of Data Acquisition
Septemebr 20, 2008 Offline Soak Wash E1
November 16, 2009 Offline Soak Wash E2
September 23, 2013 Offline Soak Wash E3
January 30, 2015 Components Relpacement E4
August 18, 2015 End of Data Acquisition
Period 1 (OH = 2303)
Period 2 (OH = 2231)
Period 3 (OH = 4048)
Period 4 (OH = 2552)
Period 5 (OH = 1599)
Presented at the 21st Symposium on Industrial Application of Gas Turbines (IAGT)
Banff, Alberta, Canada – October 19-21, 2015
The IAGT Committee is sponsored by the Canadian Gas Association. The IAGT Committee shall not be
responsible for statements or opinions advanced in technical papers or in Symposium or meeting discussions. 19
Figure 11: Contour map of engine air compressor isentropic efficiency changes before and after each
event of the LM1600 engine employed at Station #5.
Figure 12: Engine-air-compressor isentropic efficiency of LM1600 at Station #5 vs. time for
N1,corrected=12530, 12630, 12730, 12830 and 12930 RPM, from top to bottom.
Last 500 hrs of Period 1 First 500 hrs of Period 2
(Fig. 11a)
Last 500 hrs of Period 2 First 500 hrs of Period 3
(Fig. 11b)
Last 500 hrs of Period 3 First 500 hrs of Period 4
(Fig. 11c)
Last 500 hrs of Period 4 First 500 hrs of Period 5
(Fig. 11d)
Wash
Wash
Wash
Co
mp
. R
ep
lacem
en
t
Presented at the 21st Symposium on Industrial Application of Gas Turbines (IAGT)
Banff, Alberta, Canada – October 19-21, 2015
The IAGT Committee is sponsored by the Canadian Gas Association. The IAGT Committee shall not be
responsible for statements or opinions advanced in technical papers or in Symposium or meeting discussions. 20
8. Discussion
From all of the foregoing data of gas turbine engine degradation over varying OH of periods between soak
washes or hardware replacement, it could be possible to distinguish degradations that were recovered
following an engine wash, and those that were attributed to normal wear of the engines due to the
predominantly the overall OH.
The recoverable degradation is easy to discern, which is manifested by the step gain in the isentropic
efficiency (ηis) of the air compressor following each engine wash. Table 6 shows a summary of these
isentropic efficiency gains after each event (offline wash or hardware replacement) for each of the five engines
examined. The gain in ηis is averaged over the first 500 OH after the event vs. the last 500 OH before the
event. The standard deviation in the average ηis was 0.05 percentage point. The total engine air intake flow
during the period prior to the event is also recorded in the Table and normalized by engine rated site power to
allow valid comparison given that the fifth engine is rated at a much lower power than the first four. For each
engine, a general trend can be observed, in that the gain in ηis after each wash correlates with the amount of air
intake during the period preceding the event. This is a reasonable metric, since more air mass breathed by a
given engine the more it will be prone to accumulate dusts, and hence a soak wash will be more effective to
recover the resulting degradation. It should be noted that this is valid when events are compared among
themselves for the same engine and not across all engines, since they are employed at different sites with
different air quality. It should be noted that an recoverable isentropic efficiency on the order of 1.0 percentage
point constitute an economically significant gain in engine performance which amounts to approximately 0.52
MW reduction in the air compressor power of an engine based on 24 MW shaft power. This translates to 150
GJ per day saving in fuel.

Presented at the 21st Symposium on Industrial Application of Gas Turbines (IAGT)
Banff, Alberta, Canada – October 19-21, 2015
The IAGT Committee is sponsored by the Canadian Gas Association. The IAGT Committee shall not be
responsible for statements or opinions advanced in technical papers or in Symposium or meeting discussions. 21
Table 6: Comparison of the recoverable degradation of the five engines evaluated in the present work.
The un-recoverable degradation can also be determined from the data analysis presented earlier for each
engine. An un-recoverable degradation in terms of the loss in the air compressor isentropic efficiency over a
period can be determined from the difference in isentropic efficiency immediately after each successive event.
If the difference is negative, it is indicative of un-recoverable degradation, and if the difference is positive it is
indicative of a gain likely due to an engine repair or hardware replacement. Table 7 shows the results of these
Gain in ηis
Air Intake during the
period prior to the event
Average Site
Rated Power
Air Intake / Average
Site Rated Power
(% points) (106 kg) (MW) (10
6 kg/MW)
E1* 7766 1.2 1949 25.8 75.6
E2 4984 0.3 1304 26.8 48.6
E3 7161 0.5 1816 26.7 68.0
E4 2188 0.1 515 24.4 21.1
E5* 8158 3.3 2023 26.4 76.5
E6 6994 0.07 1797 26.5 67.8
E1 3310 ? 856 27.9 30.7
E2 3176 1.2 868 30.4 28.6
E3 3800 2.2 1025 30.0 34.2
E4 3841 0.2 969 29.4 33.0
E5 3014 0.5 706 28.2 25.1
E6 4954 1.1 1126 29.3 38.4
E1 7169 1.3 1744 30.1 57.9
E2 4110 0.2 1003 30.5 32.9
E1 2230 0.45 312 27.9 11.2
E2 1895 0.375 251 25.3 9.9
E1 2303 0 308 12.9 23.9
E2 2231 0 320 12.5 25.6
E3 4048 0 564 12.4 45.5
E4* 2552 0.3 374 13.8 27.1
OH from
Previous
Period
Event
* Engine replacement
Station #1
Station #2
Station #3
Station #4
Station #5
Presented at the 21st Symposium on Industrial Application of Gas Turbines (IAGT)
Banff, Alberta, Canada – October 19-21, 2015
The IAGT Committee is sponsored by the Canadian Gas Association. The IAGT Committee shall not be
responsible for statements or opinions advanced in technical papers or in Symposium or meeting discussions. 22
un-recoverable degradations during the various periods between events for the five engines evaluated in terms
of loss of isentropic efficiency per 1000 OH. It is shown that, for the most part, the unrecoverable degradation
(per 1000 OH) becomes more pronounced as the engine loading increases. The strange positive un-recoverable
degradation shown for period 4 of for Station #2 is attributed to the previous offline wash being not effective.
The rate of recoverable and unrecoverable degradation for the five engines is found to be correlated to the
engine location and operating mode (% load and operating range). As indicated earlier, station #2 is located in
the prairie with potential for air-borne dust to be breathed into the Engine. This is in contrast to the other
stations located in the forest with much cleaner air. Hence recoverable degradation appears to be more
pronounced for the engine in Station #2 than the rest. On the other hand, the RB211-24G is constantly running
near capacity (i.e., base-loaded), the engine parts are likely to wear out. The un-recoverable degradation of this
engine seems to be the highest, and hence it was subject to an IP stator replacement and a GG change out in
three years (see Table 1).
An alternate explanation for the type of degradation that each engine experiences is based on the operating
hours between offline washes. For the RB211-24G engine, there are more operating hours between engine
washes. If there is air-borne dust breathed into the engine air compressor, operating the engine for too long
between offline washes may result in prolonged contact between the dust and engine parts, thus resulting in
the wearing down of engine parts (unrecoverable degradation). However, if there are less operating hours
between offline washes, as is the case for the LM2500+ and LM1600 engines, then air-borne dust will be
washed before it has a chance to wear down the engine parts, thus avoiding unrecoverable degradation.

Presented at the 21st Symposium on Industrial Application of Gas Turbines (IAGT)
Banff, Alberta, Canada – October 19-21, 2015
The IAGT Committee is sponsored by the Canadian Gas Association. The IAGT Committee shall not be
responsible for statements or opinions advanced in technical papers or in Symposium or meeting discussions. 23
Table 7: Comparison of the un-recoverable degradation of the five engines evaluated in the present
work.
Un-recoverable
Deg. (Loss in ηis)
Average Shaft Load
During the Period
Site Rated
Power
Average Shaft Power /
Rated Power
Period(% points / 1000
OH)(MW) (MW) -
2 -0.19 21.697 26.815 0.81
3 -0.13 21.157 26.715 0.79
4 -0.05 18.275 24.437 0.75
6 -0.14 21.4 26.5 0.81
1 0 21.799 27.882 0.78
2 0 24.831 30.391 0.82
3 -0.08 21.959 30.005 0.73
4* 0.09 21.093 29.386 0.72
5 -0.28 20.065 28.152 0.71
6* 0.17 21.1 29.3 0.72
1 - 20.718 30.126 0.69
2 -0.17 20.174 30.483 0.66
1 0.72 13.938 27.946 0.50
2 0.03 12.186 25.265 0.48
1 - 8.716 12.863 0.68
2 -0.18 9.595 12.509 0.77
3 -0.09 9.263 12.388 0.75
4** 0.74 10.1 13.8 0.73
** Engine service on January 30, 2015
* Previous wash was ineffective
Station #1
Station #2
Station #3
Station #4
Station #5
Presented at the 21st Symposium on Industrial Application of Gas Turbines (IAGT)
Banff, Alberta, Canada – October 19-21, 2015
The IAGT Committee is sponsored by the Canadian Gas Association. The IAGT Committee shall not be
responsible for statements or opinions advanced in technical papers or in Symposium or meeting discussions. 24
9. Conclusions
The following five main conclusions can be drawn from the present investigation:
1. For a given gas turbine engine, recoverable degradation (recoverable by means of soak wash) correlates
well with cumulative engine air intake between soak washes for that engine at the specific site condition.
2. The rate of un-recoverable degradation in terms of permanent loss in compressor isentropic efficiency per
1000 OH correlates well with engine loading (defined as hourly averaged shaft power / site rated power).
3. The RB211-24G engine installed at Station 1 is base-loaded and operated on a tight range along the
maximum compressor efficiency line, while the LM2500+ and LM1600 engines installed at other
Stations are operated over relatively wider ranges at part loads. As such, RB211-24G engine seems to be
subjected to un-recoverable degradation more than the rest and needed to be overhauled after three years.
4. Engines employed in compressor stations in a forested area degraded (from recoverable sense) at a much
lower rate than engines located in the prairies. Hence, frequency of engine washes is not critical for the
former as compared to the latter.
5. An extension of the current work (i.e. future work) could include assessment of the air filtration
performance on each engine, and their impact on respective engine degradation (recoverable vs. un-
recoverable), particularly since the five engines examined in the present work are located at different sites
of different air quality and environment.
10. Acknowledgments
The authors wish to acknowledge the discussion and technical dialogue with Ken Meszaros, Landen Stein and
Curtis Phinney on the operation of the five engines discussed in this paper. The support of TCPL Technology
Management; Thomas Robinson, Anthony Tse and Tracy Cairns during the course of this work is greatly
appreciated. This paper is part of a research program sponsored by TransCanada Pipelines Ltd., and
permission to publish is gratefully acknowledged.
NOMENCLATURE
c0-c2 coefficients of objective function F1
F vector of objective functions
GG gas generator
H engine health parameter vector, or air-compressor
enthalpy rise (equation 8)
IP intermediate pressure
k isentropic exponent
m measured engine parameter vector
m engine-air-compressor air inlet flow rate (kg/s)
N1 engine-air-compressor low shaft speed (rpm)
P2 engine-air-compressor suction pressure (kPa)
P3 engine-air-compressor discharge pressure (kPa)
Pr engine-air-compressor pressure ratio

Presented at the 21st Symposium on Industrial Application of Gas Turbines (IAGT)
Banff, Alberta, Canada – October 19-21, 2015
The IAGT Committee is sponsored by the Canadian Gas Association. The IAGT Committee shall not be
responsible for statements or opinions advanced in technical papers or in Symposium or meeting discussions. 25
R gas constant (kJ/mol-K)
Sh.P shaft output power (kW)
T2 engine-air-compressor suction temperature (K)
T3 engine-air-compressor discharge temperature (K)
u external input parameters
V error covariance matrix
y true engine parameters
Z average compressibility factor
δ corrected pressure
ε random error or noise
ηis engine-air-compressor isentropic efficiency
θ corrected temperature
Θ vector of fitting parameters
σ standard deviation in measured parameters
Ψ compressor head coefficient
11. References
1. R. Kurz and K. Brun, "Degradation in gas turbine systems,” J Eng Gas Turb Pwr - Transactions of the ASME,
vol. 123, no. 1, pp. 70-77, 2001.
2. R. Kurz, K. Brun and M. Wollie, "Degradation Effects on Industrial Gas Turbines,” J Eng Gas Turb Pwr -
Transactions of the ASME, vol. 131, no. 6, 2009.
3. M. Morini, M. Pinelli, P. R. Spina and M. Venturini, "Numerical Analysis of the Effects of Nonuniform Surface
Roughness on Compressor Stage Performance,” J Eng Gas Turb Pwr - Transactions of the ASME, vol. 133, no.
7, 2011.
4. M. Fast, M. Assadi and S. De, "Condition based maintenance of gas turbines using simulation data and artificial
neural network: A demonstration of feasibility,” in Proceedings of the ASME Turbo Expo 2008, Berlin,
Germany, 2008.
5. K. K. Botros, H. Goldshan and D. Rogers, "Effects of Engine Wash Frequency on GT Degradation in Natural
Gas Compressor Stations,” in Proceedings of ASME Turbo Expo 2013, San Antonio, USA, 2013.
6. Y. Li, "Gas Turbine Performance and Health Status Estimation Using Adaptive Gas Path Analysis,” J Eng Gas
Turb Pwr - Transactions of the ASME, vol. 132, no. 4, 2010.
7. A. J. Volponi, "Gas Turbine Parameter Corrections,” J Eng Gas Turb Pwr - Transactions of the ASME, vol. 121,
pp. 613-621, 1999.
8. J. Kurzke, "Effects of inlet flow distortion on the performance of aircraft gas turbines,” J Eng Gas Turb Pwr -
Transactions of the ASME, vol. 130, no. 4, 2008.
9. J. Kurzke, "About simplifications in gas turbine performance calculations,” in Proceedings of the ASME Turbo
Expo 2007, Montreal, Canada, 2007.
10. H. I. H. Saravanamutto, G. Rogers, H. Cohen and P. V. Straznicky, Gas Turbine Theory, 6th ed., Pearson
Prentice Hall, 2009.
11. S. E. Keeler and P. M. Reilly, "The error-in-variables model applied to parameter-estimation when the error
covariance matrix is unknown,” Can. J. Chem. Eng., vol. 69, no. 1, pp. 27-34, 1991.
12. P. M. Reilly and H. Patino-Leal, "A bayesian study of the error-in-variables model,” Technometrics, vol. 23, no.
3, pp. 221-231, 1981.
13. G. A. F. Seber and C. J. Wild, Nonlinear Regression, New York: John Wiley and Sons, 1989.
14. P. Valko and S. Vajda, "An extended marquardt-type procedure for fitting error-in-variables models,” Computer
Chem. Eng., vol. 11, no. 1, pp. 37-43, 1987.
15. C. Hartloper, K.K. Botros, H. Golshan, D. Rogers, and Z. Samoylove: "Comparison of Degradation of two
Different Gas Turbine Engines in Natural Gas Compressor Stations,” Proceedings of the ASME 2014
International Pipeline Conference, IPC-2014-33015, September 29-October 3, 2014, Calgary, Alberta, Canada.
Presented at the 21st Symposium on Industrial Application of Gas Turbines (IAGT)
Banff, Alberta, Canada – October 19-21, 2015
The IAGT Committee is sponsored by the Canadian Gas Association. The IAGT Committee shall not be
responsible for statements or opinions advanced in technical papers or in Symposium or meeting discussions. 26
16. Botros, K.K., Hartloper, C., Golshan, H. and Rogers, D.: "Assessment of Recoverable vs. Unrecoverable
Degradations of Gas Turbines Employed in Five Natural Gas Compressor Stations", Proceedings of ASME
Turbo Expo 2015: Turbine Technical Conference and Exposition, Montréal, Canada, June 15 - 19, 2015.
17. Botros, K.K., Hartloper, C., Golshan, H. and Rogers, D.: "Recoverable vs. Unrecoverable Degradations of Gas
Turbines Employed in Five Natural Gas Compressor Stations", ASME J. Eng. Gas Turbines Power (in press),
2015.
18. N. A. Cumpsty, Compressor Aerodynamics, John Wiley & Sones, 1989.