comparison of crisp and standard fruit texture in …
TRANSCRIPT

1
COMPARISON OF CRISP AND STANDARD FRUIT TEXTURE IN SOUTHERN HIGHBUSH BLUEBERRY USING INSTRUMENTAL AND SENSORY PANEL
TECHNIQUES
By
KENDRA M. BLAKER
A DISSERTATION PRESENTED TO THE GRADUATE SCHOOL OF THE UNIVERSITY OF FLORIDA IN PARTIAL FULFILLMENT
OF THE REQUIREMENTS FOR THE DEGREE OF DOCTOR OF PHILOSOPHY
UNIVERSITY OF FLORIDA
2013

2
© 2013 Kendra M. Blaker

3
To my grandmother: Lillian Detweiler
4
ACKNOWLEDGMENTS
I am especially grateful to my advisor, Dr. James Olmstead, who gave me the
opportunity to pursue this degree and participate in the blueberry breeding program.
Thank you for allowing me so much freedom with this project while always being
available and ready to offer help and a word of encouragement along the way! I thank
the members of my committee for their willingness to invest their time and expertise in
me and my research: Dr. Don Huber, Dr. Harry Klee, Dr. Steve Sargent and Dr. Wilfred
Vermerris. I am also grateful to Dr. Paul Lyrene, Dr. José Chaparro, and Dr. Wayne
Sherman: plant breeders and mentors that I have had the privilege and honor to work
with since first coming to the University of Florida for my master’s degree.
I am grateful to David Norden and Werner Collante for their help in the field and in
the laboratory. I thank the many members of my lab and office for their friendship,
encouragement, and participation in my research studies: Patricia Hilda-Rodriguez,
Rachel Itle, Silvia Marino, Gerardo Nunez, Jessica Gilbert, Sarah Taber, Aparna
Krishnamurthy, Elton Goncalves, and Piyasha Ghosh. I have so much enjoyed working
along side you all! I am grateful for the assistance of Micah Weiss, Rachel Odom,
Elizabeth Thomas, Dana Ciullo, Catherine Cellon, Kyle Guerrero, Alexandra Rucker,
Shane Dluzneski, and Ashley Leonard for their help on this project. Many hands make
light (and more pleasant) work! For the use of field space and plant material, I thank
Alto Straughn and his staff.
The love and care of my church community, dear friends, and wonderful family
makes my life truly rich, and I am so grateful for them. And to the Lord Jesus, whose
loving-kindness towards me is undeserved, but so gratefully and gladly enjoyed.

5
TABLE OF CONTENTS page
ACKNOWLEDGMENTS .................................................................................................. 4
LIST OF TABLES ............................................................................................................ 8
LIST OF FIGURES .......................................................................................................... 9
ABSTRACT ................................................................................................................... 10
CHAPTER
1 INTRODUCTION .................................................................................................... 12
Florida Blueberries .................................................................................................. 12 Taxonomy ......................................................................................................... 12
Breeding and Early Cultivation ......................................................................... 13 Flowering and Fruit Development ..................................................................... 14 Harvest ............................................................................................................. 16
Postharvest Storage and Marketing ................................................................. 18 Crisp Texture .......................................................................................................... 19
Germplasm ....................................................................................................... 19 Sensory Perception .......................................................................................... 20 Texture Measurement ...................................................................................... 21
Cell Structure .................................................................................................... 23
Modification of Cell Structure ............................................................................ 28
Current Research ................................................................................................... 32
2 CORRELATION BETWEEN SENSORY AND INSTRUMENTAL MEASUREMENTS OF CRISP TEXTURED BLUEBERRIES ................................. 34
Literature Review .................................................................................................... 34 Methods .................................................................................................................. 37
Plant Material ................................................................................................... 37 Sensory Analyses ............................................................................................. 37 Instrumental Analyses ...................................................................................... 38 Data Analyses .................................................................................................. 39
Results .................................................................................................................... 40
Genotypes ........................................................................................................ 40 Sensory Analyses ............................................................................................. 41 Instrumental Analyses ...................................................................................... 42 Sensory x Instrumental Correlations ................................................................ 44
Discussion .............................................................................................................. 44
6
3 EFFECTS OF PREHARVEST APPLICATIONS OF 1-METHYLCYCLOPROPENE ON FRUIT FIRMNESS IN SOUTHERN HIGHBUSH BLUEBERRY ...................................................................................... 61
Literature Review .................................................................................................... 61 Materials and Methods............................................................................................ 63 Results and Discussion........................................................................................... 64
4 STONE CELL FREQUENCY AND CELL SIZE VARIATION OF CRISP AND SOFT TEXTURED FRUITS FROM NINE SOUTHERN HIGHBUSH BLUEBERRY CULTIVARS ..................................................................................... 67
Literature Review .................................................................................................... 67 Methods .................................................................................................................. 70
Plant Material ................................................................................................... 70 Microscopy ....................................................................................................... 70 Image Analysis ................................................................................................. 71
Statistical Analysis ............................................................................................ 72 Results and Discussion........................................................................................... 72
5 CELL WALL COMPOSITION OF THE MESOCARP AND EPIDERMAL TISSUE OF CRISP AND SOFT TEXTURED BLUEBERRY GENOTYPES DURING POST HARVEST STORAGE .................................................................................. 84
Literature Review .................................................................................................... 84 Methods .................................................................................................................. 87
Plant Material ................................................................................................... 87 Postharvest Storage Treatment ........................................................................ 88
Instrumental Analysis ....................................................................................... 89 Sample Preparation .......................................................................................... 89 Alcohol Insoluble Residue (AIR) Isolation......................................................... 89
Uronic Acid (UA) and Neutral Sugar (NS) Measurement.................................. 89 Statistical Analysis ............................................................................................ 91
Results and Discussion........................................................................................... 91
6 SENSORY AND INSTRUMENTAL MEASUREMENTS OF CRISP TEXTURED BLUEBERRIES IN AN F1 POPULATION .............................................................. 103
Literature Review .................................................................................................. 103
Methods ................................................................................................................ 104 Plant Material ................................................................................................. 104 Phenotypic Evaluation .................................................................................... 105
Data Analyses ................................................................................................ 106 Results and Discussion......................................................................................... 106
7 CONCLUSION ...................................................................................................... 115
LIST OF REFERENCES ............................................................................................. 120

7
BIOGRAPHICAL SKETCH .......................................................................................... 130

8
LIST OF TABLES
Table page 2-1 Parents of genotypes of southern highbush blueberry cultivars and advanced
selections evaluated by sensory panel and instrumental analysis. ..................... 50
2-2 Comparison of sensory and instrumental P-values of replicated southern highbush blueberry genotypes evaluated on two harvest dates. ........................ 52
2-3 Mean scores for sensory and instrumental measurements of southern highbush blueberry genotypes evaluated in 2010. ............................................. 53
2-4 Mean scores for sensory and instrumental measurements of southern highbush blueberry genotypes evaluated in 2011. ............................................. 55
2-5 R values for correlation between sensory and quantitative scores for all southern highbush blueberry. ............................................................................. 57
2-6 R values for correlation between sensory and instrumental scores for all southern highbush blueberry genotypes e. ......................................................... 58
4-1 Average cell area for each cell layer of soft and crisp-textured genotypes at the mature green and ripe blue stages of development. ..................................... 76
4-2 Mean number of stone cells per fruit at the mature green and ripe blue stages of maturity for genotypes with soft and crisp-textured berries. ................ 77
5-1 Changes in dry weight and alcohol insoluble residue (AIR) of flesh and skin tissue from crisp and soft-textured southern highbush blueberry genotypes. ... 101
5-2 Differences between southern highbush blueberry genotypes for uronic acids and neutral sugars in the flesh and skin tissue. ................................................ 102
6-1 Segregation data for crisp texture in five F1 southern highbush blueberry populations tested to fit expected single-gene segregation ratios. ................... 112
9
LIST OF FIGURES
Figure page 1-1 Blue fruit of ‘Sweetcrisp’. .................................................................................... 33
2-1 Principal component analysis (PCA) biplot of sensory evaluation of 36 southern highbush blueberry cultivars and hybrids. ............................................ 59
2-2 Principal component analysis (PCA) biplot of sensory evaluation of 49 southern highbush blueberry cultivars and hybrids ............................................. 60
3-1 Average fruit firmness and standard error of ‘Sweetcrisp’ and ‘Star’ blueberry fruit. .................................................................................................................... 66
4-1 Images of mature green fruits from soft-textured genotypes .............................. 78
4-2 Images of mature green fruits from crisp-textured genotypes ............................ 79
4-3 Images of ripe blue fruits from soft-textured genotypes ...................................... 80
4-4 Images of ripe blue fruits from crisp-textured genotypes .................................... 81
4-5 Images of mature green and ripe blue fruits from crisp and soft-textured genotypes. .......................................................................................................... 82
4-6 Images of stone cells in crisp and non-crisp genotypes. .................................... 83
5-1 Weight loss (%) of four crisp (black) and three soft (gray) textured southern highbush blueberry genotypes............................................................................ 97
5-2 Bioyield force measurements (N) of fruit at pink, ripe, 7, 14, and 32 days storage at 3 ºC .................................................................................................... 98
5-3 Bioyield force measurements (N) of four crisp (black) and three soft (gray) textured southern highbush blueberry genotypes ............................................... 99
5-4 Bioyield force measurements (N) of combined crisp and soft-textured southern highbush blueberry fruits at five maturity and postharvest stages. .... 100
6-1 Distribution of mean sensory scores for seedlings from five F1 southern highbush blueberry populations. ....................................................................... 113
6-2 Distribution of bioyield force (N) of seedlings from the FL 98-325 x ‘Sweetcrisp’ F1 southern highbush blueberry population. ................................. 114

10
Abstract of Dissertation Presented to the Graduate School of the University of Florida in Partial Fulfillment of the Requirements for the Degree of Doctor of Philosophy
COMPARISON OF CRISP AND STANDARD FRUIT TEXTURE IN SOUTHERN HIGHBUSH BLUEBERRY USING INSTRUMENTAL AND SENSORY PANEL
TECHNIQUES
By
Kendra M. Blaker
August 2013
Chair: James Olmstead Major: Horticultural Sciences
A novel texture most often described as “crisp” has been identified in the
southern highbush blueberry (SHB, Vaccinium corymbosum L. hybrids) germplasm at
the University of Florida (UF). Two releases from the UF SHB breeding program,
‘Bluecrisp’, and ‘Sweetcrisp’, possess this crisp fruit texture, and many advanced
seedling selections have been subjectively identified. Berries with this crisp texture are
of particular interest due to their enhanced eating quality, prolonged postharvest life,
and potential value for mechanical harvesting for fresh marketed blueberries. The
objective of this research was to use compression and bioyield force measures to
characterize crisp and soft-textured SHB genotypes determined by a trained sensory
panel, evaluate how genotypes of these texture classes varied in ethylene sensitivity,
cellular structure, and cell wall composition. The sensory and instrumental tools
developed were then used to phenotype seedling populations from putative crisp
parents to determine segregation patterns of crisp texture in SHB.
Instrumental measures of compression and bioyield forces correlated with
sensory scores for bursting energy, flesh firmness, and skin toughness. Compression
11
firmness was then measured in crisp and soft-textured genotypes after preharvest
treatment with an ethylene inhibitor, 1-methylecyclopropene, which proved ineffective at
increasing firmness in either genotype. Cell type, size, shape, packing, and peel
thickness were analyzed by light microscopy in four soft, four crisp, and one
intermediate-textured genotype, which were found to vary in cellular structure traits
between genotypes, but not between textural classes. Cell wall composition was
evaluated in berry skin and flesh from three soft, three crisp, and one intermediate-
textured genotype at two maturity stages (pink and ripe fruit) and after three postharvest
durations at 3ºC. No differences between texture classes were found for total alcohol
insoluble residue which contained primarily cell wall material, uronic acids, or neutral
sugars. Sensory and instrumental methods of phenotyping were used to evaluate
segregation patterns in five F1 populations, and four of the five populations fit expected
segregation ratios for single gene inheritance with incomplete dominance in an
autotetraploid.
12
CHAPTER 1 INTRODUCTION
Florida Blueberries
Taxonomy
Blueberry is a member of the heath family (Ericaceae), and belongs to the genus
Vaccinium. The Ericaceae is the largest family within the Ericales and is composed of
116-125 genera, with as many as 3,500 species worldwide (Walters and Keil, 1996). It
is a family of small trees, shrubs, and woody vines that grow well in extreme climates
including nutrient poor or acid soils (Walters and Keil, 1996; Fralish and Franklin, 2002).
Members of this family have perfect flowers with five fused petals and 10 stamens.
Their leaves are simple, entire, and evergreen or deciduous depending on location
(Fralish and Franklin, 2002).
The genus Vaccinium has traditionally been divided into two subgenera:
Oxycoccus and Vaccinium. Subgenera Oxycoccus represents the cranberries and
Vaccinium, in which cultivated blueberry species are found, is composed of
approximately 20 sections that are defined by having thicker, woody shoots and bell-
shaped flowers. Commercial blueberries belong to the section Cyanococcus that
includes approximately 16 species (Uttal, 1987). However, opinion about the division of
taxa varies due to the high degree of interbreeding that occurs within these widely
diverse populations (Camp, 1942; Vander Kloet, 1983; Uttal, 1987). Ten species are
native to Florida: one from section Polycodium (V. stamineum L.), one from section
Batodendron (V. arboreum Marsh.), and eight species from section Cyanococcus (V.
myrsinites Lam., V. darrowii Camp, V. tenellum Aiton, V. amoenum Aiton, V. virgatum
Aiton (formerly V. ashei), V. fuscatum Aiton (or V. corymbosum L.), V. australe Small,

13
and V. elliottii Chapm.) (Ward, 1974; Lyrene, 1997). Within the section Cyanococcus,
species range from diploid (2x) to hexaploid (6x), and cultivated highbush blueberries
(V. corymbosum) are considered to be autotetraploid (Lyrene, 2003).
Breeding and Early Cultivation
The first breeding efforts toward the cultivation of wild blueberries was begun by
Frederick Coville in 1911 using ‘Brooks’ (a wild V. corymbosum selection from the
mountains of southern New Hampshire) and ‘Russell’ (a wild V. angustifolium Aiton
selection from New Hampshire) to produce the first artificial hybrid (Coville, 1937). The
first cultivars from Coville’s work were introduced in 1920: ‘Pioneer’, ‘Cabot’, and
‘Katherine’.
Rabbiteye blueberries (V. virgatum) growing wild in the panhandle of Florida were
collected and grown commercially in Florida in the 1920s, but with little success due to
the small fruit size and lack of uniformity associated with wild seedlings (Moore, 1965).
The first breeding efforts in Florida began in 1940 and resulted in the release of two
rabbiteye cultivars (‘Coastal’ and ‘Calloway’) in 1950. A breeding program was begun at
the University of Florida (UF) in 1949 to develop low-chill highbush cultivars with the
high quality and short fruit development period (FDP) of northern highbush species and
low chill adaptability from Florida native species of several ploidal levels, including V.
myrsinites (4x), V. darrowii (2x), and V. virgatum (6x) (Moore, 1965; Sharpe, 1953:
Lyrene, 1997). In 1976, ‘Sharpblue’ was released as the first southern highbush
blueberry (SHB, V. corymbosum interspecific hybrids) cultivar (Sharpe and Sherman,
1976). After 64 years of breeding at UF, over 30 SHB cultivars have been released and
now support a substantial blueberry industry in Florida (U.S. Department of Agriculture
(USDA), 2013).
14
Flowering and Fruit Development
Flower bud initiation occurs during the summer, and buds develop during the fall
and winter to produce fruit the following spring (Shutak and Marucci, 1966). Growth
slows in the fall in response to lower temperatures and short day lengths, and the plant
enters a period of dormancy in which tissues become increasingly acclimated or
hardened in areas where temperatures drop below freezing (Gough, 1983; Darnell et al.,
1992). After the chilling requirement of dormancy is satisfied, heat units are
accumulated that enable buds to swell and bud break to occur (Darnell et al., 1992). In
Florida, where prolonged cold temperature periods are not frequent, the chilling
accumulation can be less than 300 hours (between 0-7 °C).
Fruit is produced on one-year-old wood, with the general trend of fruit size
increasing as wood diameter increases (Shutak and Marucci, 1966). Single flowers are
attached by the pedicel to the peduncle to form a cluster (Gough, 1983). Flowers are
white or pink in color and consist of five petals fused into a corolla, five fused sepals
surrounding an inferior ovary, ten stamens, and a pistil (of greater length than the
stamens) which together are inverted and resemble the shape of a bell or urn (Shutak
and Marucci, 1966; Gough, 1983). Pollen is shed as tetrads that are able to produce
four pollen tubes (Darnell et al., 1992). Honey bees and bumble bees are the principal
pollinators of blueberries, and are attracted to nectar produced by nectaries located at
the base of the corolla (Shutak and Marucci, 1966). Temperatures below 13 °C, winds
above 15 mph, rain, and humidity, are all factors affecting bee activity and pollination
(Gough, 1983). Cultivars should be planted in alternating rows or coupled rows to
facilitate cross pollination due to reduced yield and berry size that results from the
15
parthenocarpic fruits of self pollinations (Shutak and Marucci, 1966; Cano-Medrano and
Darnell, 1997).
The fruit development period, from petal abscission to berry ripening is variable
depending on cultivar and location, but can be as short as 50 to 60 days (Shutak and
Marucci, 1966). Blueberry exhibits a double-sigmoid growth pattern characterized by a
rapid increase in pericarp size (stage I), rapid embryo development and slowed pericarp
growth (stage II), and a final surge in pericarp expansion that coincides with fruit
ripening (stage III) (Godoy et al., 2008). The corolla, stamens, and style abscise during
the initial stage, leaving a circular scar on the tissue inside the berry calyx (which
remains attached to the fruit), along with a dot in its center where the corolla and style
respectively were formerly attached (Gough, 1994). Ripening in blueberry begins
simultaneous with anthocyanin development or when green fruits initially begin to show
pink coloration (Gough, 1994). Shutak et al. (1980) described the stages of ripening
according to berry color: immature green, mature green, green pink, blue pink, blue,
and ripe. As berries ripen from immature green to the ripe stage, the sugar content
increases from 7 to 15%, acidity drops, and size increases due to cell expansion
(Gough, 1983). Respiration and ethylene are reported to increase and reach a
climacteric peak at the initial stages of coloration and then decrease as berries change
from pink to blue (Windus et al., 1976). Ethylene production ranges from 0.5 to 2 μL kg-1
h-1 for northern highbush to 10 μL kg-1 h-1 for rabbiteye blueberry (Gross, 2004). Vicente
et al. (2007) showed that the greatest change in blueberry firmness also occurred at the
onset of color when fruits transitioned from green to 25% blue.

16
Harvest
At a time when labor costs are increasing and availability is decreasing, the
blueberry industry is looking for more affordable ways to harvest their crops while
maintaining a high standard of fruit quality that continues to demand a high price when
sold for the fresh market (Mehra et al., 2013). The replacement of current hand
harvesting practices with machine harvesters offers a substantial economic advantage
for growers. Currently, most commercial blueberry cultivars in Florida are not well-suited
for mechanical harvest techniques (Mehra et al., 2013). Many factors would need to be
considered in order to develop cultivars suitable to mechanical harvest.
Factors that affect the quality of fruit obtained by mechanical harvest include fruit
detachment force (FDF), fruit abscission zone, plant architecture, fruit firmness, and the
uniformity of fruit ripening. When FDF was measured on mature green, unripe red, and
fully ripe blue fruits from ten SHB genotypes, Sargent et al. (2010) found that green
fruits have a higher FDF (1.8 to 3.5 N) than blue fruits (0.7 to 1.5 N). Red fruits had a
lower FDF than green fruits in two genotypes and a higher FDF in one genotype
evaluated (Sargent et al., 2010). In blueberry, fruit abscission occurs primarily at the
pedicel-peduncle junction, which can result in “stemmy” fruit that is unmarketable
(Vashisth et al., 2012). Variability has been observed among cultivars for both the force
required to detach fruits and the degree to which stems are retained in detached fruits
using a hand held shaking device (Malladi, 2013). Abscission agents such as methyl
jasmonate and ethephon, have been found effective in facilitating fruit detachment in
rabbiteye and SHB (Malladi et al., 2012). The goal of these studies was to identify
abscission agents in conjunction with cultivars of decreased stem retention and
appropriate detachment force that would be suitable for harvest by machine.

17
Efforts to incorporate architecture and root traits from V. arboreum into
commercial quality SHB cultivars that could be harvested by machine are being pursued
using grafting and hybridization methods (Darnell et al., 2010). Vaccinium arboreum
(section Batodendron), commonly referred to as “sparkleberry”, is a diploid blueberry
species that is native to Florida. Plants from this species have a deep root system
adapted to the pH of Florida soils and their architecture resembles that of a tree having
a monopodial base rather than multiple canes like most SHB cultivars which would
make it more conducive to the designs of current machine harvesters (Lyrene, 2011).
Fruit firmness is perhaps the greatest factor affecting the fruit quality of
mechanically harvested berries (Mehra et al., 2013). When comparing firmness of
rabbiteye blueberries that were hand harvested and those harvested using a machine
harvester, NeSmith et al. (2002) found that 20-30% firmness (measured by compression
force) was lost in those harvested by machine. When comparing firmness after two
weeks cold storage at 1ºC in SHB that were harvested by hand and those with a
machine harvester, a study at UF found 6% and 53% soft fruits respectively. The
percent of unmarketable soft fruit that was harvested with a machine harvester from 12
SHB genotypes ranged from 1 to 12% (Olmstead, Sargent, and Williamson, personal
communication). Appearance, percent shrivel, and percent decay were also measured
in SHB harvested by hand and by machine, and showed a decline in each of these fruit
quality parameters when harvested by machine (Olmstead, Sargent, and Williamson,
personal communication). In the same study, 6 to 30% of fruit harvested by machine
was too under-ripe to be marketed, suggesting that plants with increased uniformity in
ripening and appropriate FDF may decrease losses due to detachment of immature and
under ripe fruits.

18
Postharvest Storage and Marketing
Berry firmness remains a top priority during postharvest storage. NeSmith et al.,
(2002) reported a 10-15% loss of firmness in blueberry fruit during the grading and
sorting process. Mechanized packing lines are often equipped with a soft berry and
color sorter that removes these berries by airflow from the packing line (NeSmith et al.,
2002). More targeted detection of soft or damaged fruit has been advanced through the
development of sensor technology to nondestructively test fruit firmness and also detect
three of the most common postharvest diseases: gray mold, anthracnose, and
Alternaria. (Li et al. 2010; Li et al., 2011).
Temperature is well known to affect fruit firmness and postharvest shelf life, and
in blueberry, increased benefits to fruit quality are observed as storage temperature is
decreased to an optimum low of 1ºC (Ballinger et al., 1978). Blueberry respiration rates
range from 2-10 mg CO2 kg-1 h-1 at 0ºC to 78-124 mg CO2 kg-1 h-1 at 25-27ºC (Gross,
2004). Paniagua et al. (2013) attributed changes in fruit firmness primarily to
postharvest moisture loss and suggested that changes in turgor pressure may be the
primary cause of fruit softening. To reduce respiration and desiccation, relative humidity
should be kept at approximately 95% (Tetteh et al., 2004). Postharvest storage is not
recommended to exceed two weeks for low and highbush blueberry and four weeks for
rabbiteye cultivars (Gross, 2004).
Elevated carbon dioxide is known to suppress fungal decay, but the levels
necessary to suppress decay in blueberry approaches the limit at which excessive
carbon dioxide can cause off flavor, odor formation, and even increased decay (Zheng
et al., 2008). Oxygen levels are often lowered to suppress ethylene and decrease the
rate of ripening, but low oxygen storage has been shown to have very little effect on

19
blueberry fruits which are harvested when fully ripe (Alsmairat et al., 2011). While
others have reported improved quality of blueberry fruit under controlled atmosphere
(CA) storage at 8-15 kPa carbon dioxide and 2-4 kPa oxygen (Beaudry et al., 1998),
Hancock et al. (2008) reported that CA had little effect on blueberry fruit quality.
Controlled atmosphere storage is rarely used in commercial blueberry production,
except during extended overseas shipments (Alsmairat et al., 2011).
In 2012, Florida produced 7,756 metric tons of fresh fruit on just over 1,800 ha of
land (U.S. Department of Agriculture (USDA), 2013). Florida receives a higher price for
fresh market fruit due to the use of early ripening, low-chill cultivars that give Florida
growers an essentially unshared market window from 1 April to 10 May. While low-chill
and earliness remain important selection criteria in the UF SHB breeding program, other
important traits include increased yield and fruit size to maximize the high costs of land
and labor. Labor is especially a growing concern for the future of Florida’s blueberry
industry, and there is a growing interest in the development of cultivars with increased
firmness and adaptability to mechanical harvesting (Yu et al., 2012).
Crisp Texture
Germplasm
Two cultivars considered to have a unique crisp texture were selected from SHB
germplasm at UF and released in 1997 (‘Bluecrisp’) and 2005 (‘Sweetcrisp’) (Okie,
1999; Olmstead, 2011 ). Only two other blueberry cultivars are known to have been
described as crisp (‘Dolores’ and ‘Hortblue Poppins’), but the texture of these cultivars
has not been compared with the crisp cultivars from UF (Clark and Finn, 2010; Scalzo et
al., 2009). Many unreleased selections in the UF SHB breeding program are also
considered to have a crisp phenotype similar to ‘Bluecrisp’ and ‘Sweetcrisp’. Berries

20
with this crisp texture are of particular interest due to their potential contribution to the
development of SHB cultivars able to withstand the impacts of mechanical harvesting,
and maintain high fruit quality that can continue to be sold at a high price for the fresh
market. The crisp texture has also improved postharvest fruit quality and duration
(Mehra et al., 2013), and may appeal to consumer preferences for increased firmness.
Sensory Perception
Texture has been defined as “the sensory and functional manifestation of the
structural, mechanical, and surface properties of foods detected through the senses of
vision, hearing, touch, and kinesthetics” (Szczesniak, 2002). The structural and
mechanical properties of fresh fruits are determined by several factors governing cellular
structure, including: fruit anatomy and cellular construction, the mechanical and
physiological properties of cells, biochemical changes in the cell wall, turgor pressure,
and membrane integrity (Harker et al. 1997). These factors contribute to textural traits
such as crispness, hardness, juiciness, and mealiness (Harker et al., 1997). Crisp has
been defined as “the amount and pitch of sound generated when the sample is first
bitten with the front teeth”, with the low and high reference standards being a ripe
banana (Musa spp.) and fresh potato chip (Solanum tuberosum), respectively. (Harker
et al., 1997). The noise produced by crisp fruits is the result of cell rupture and cracking
in the tissue (Tunick, 2011). Studies have been performed in grape (Vitis vinifera L.)
and apple (Malus domestica Borkh.) using acoustic vibration to measure the degree of
crispness (Iwatani et al., 2011; King et al., 2000).
Sensory evaluations of texture are performed by consumers for hedonic
characterizations and trained panels are used for profiling and descriptive analysis
(Harker et al., 1997; Worch et al., 2010). While texture contributes to consumer

21
satisfaction as much as flavor, consumers rarely comment on texture unless they are
specifically questioned about it, or unless the texture is found to be displeasing or fails to
meet expectations (Tunick, 2011; Szczesniak, 2002). Food quality is also associated
with texture, such that crisp fruits and vegetables are indicative of freshness and are
therefore more desirable by consumers (Szczesniak, 2002). Crisp and soft-textured
genotypes of blueberry were evaluated by an untrained sensory panel that was able to
decipher between soft and crisp textured berries and give hedonic assessments about
the desirability of crisp texture in blueberry (Padley, 2005). Most panelists preferred
crisp blueberries (Padley, 2005).
The aim of sensory analysis by trained panels is to quantify the perception of food
traits, which requires both consensus between panelists and reproducibility (Worch et
al., 2010). Once texture is quantified by sensory measures, it is often correlated with
instrumental measures for the purpose of determining structural and mechanical
properties contributing to the food’s texture and predicting its sensory perception by
consumers (Harker et al., 1997)
Texture Measurement
Fruit texture has been measured in a variety of ways, including point of bioyield
tests, compression tests, tactile assessment, shearing tests, beam tests, measures of
juice content, and sensory evaluations (Harker et al., 1997). Bioyield, shear cell, and
compression tests have been most commonly used to measure firmness in blueberry
(Ehlenfeldt and Martin, 2002; Padley, 2005; Silva et al., 2005; Saftner et al., 2008).
Bioyield force measures the maximum force (N), required to puncture a berry at a
certain speed with a probe and can be measured using an Instron texture analyzer
(Instron Corporation, Canton, MA). The Kramer shear cell is a multi-bladed fixture that

22
can be attached to a texture analyzer. The blades first compress, then extrude, and
finally shear the fruit inside a metal box. Compression force can be measured with a
Firmtech devise designed by Bioworks (Wamego, KS). It measures the mean force (N)
required for a flat bottomed plate (3cm diameter) to compress a berry 2mm.
Previous studies have surveyed firmness and correlated sensory perceptions of
texture with instrumental measurements in blueberry, but none using the crisp cultivars
and advanced selections from UF (Silva et al., 2005; Saftner et al., 2008). In a survey of
87 highbush and species-introgressed blueberry cultivars, Ehlenfeldt and Martin, (2002)
found that SHB cultivars, having some V. virgatum or V. darrowii ancestry, were among
the highest in firmness based on compression force measurements, suggesting that low
chill species introgression could be a potential source of increased blueberry firmness.
The relationship between cultivar firmness and release date suggested that the average
gain in blueberry firmness per decade was 0.04 N·mm-1, and the authors speculated that
epidermal thickness might play a role in the measured firmness (Ehlenfeldt and Martin,
2002). Likewise, Silva et al., (2005) found that shear, compression, and bioyield forces
were higher in three low chill rabbiteye cultivars compared with two northern highbush
cultivars. In 2006, compression firmness was measured for the fruit of 12 blueberry
cultivars (10 northern highbush and two rabbiteye) and was compared with sensory
ratings corresponding to fruit qualities such as bursting energy (which the authors
describe as “crispness”), skin toughness, juiciness, and texture during chewing (Saftner
et al., 2008). The compression firmness values best correlated with juiciness (r = 0.48),
bursting energy (r = 0.44), and texture during chewing (r = 0.33), but did not correlate
23
with skin toughness. None of these studies, however included crisp SHB cultivars in
their analyses.
In other fruit crops, crisp texture has been more thoroughly explored. Crisp
texture is desirable for table grapes, which are cultivated primarily from the two Vitis
species V. labrusca and V. vinifera. Sato et al. (1997) showed that sensory perceptions
of crispness correlate with a small deformation and large maximum bioyield force
measurement. Using a bioyield test to measure crispness in 87 grape cultivars, it was
determined that crisp texture was limited to a small pool within V. vinifera cultivars (Sato
and Yamada, 2003). Crisp texture is also a desirable trait in apple. Apple texture was
measured by King et al. (2000) using a trained sensory panel which correlated with
penetrometer and acoustic resonance testing to measure stiffness. These results were
used to detect marker-trait associations that could be useful for marker assisted
breeding of crisp textured fruit in apple (King et al., 2000). Shear and bioyield force
measurements have been used to evaluate crisp genotypes from UF, but were not
correlated with sensory evaluations by a trained panel (Padley, 2005).
Cell Structure
Several cellular components contribute to overall fruit texture, including cell type,
size, number, shape, packing, cell-to-cell adhesion, extracellular space, and cell wall
thickness (Harker et al., 1997).
Parenchyma cells are the most numerous type of cells in the flesh of blueberry.
Parenchyma cells have a large, mostly water-filled vacuole and thin, non-lignified cell
wall that separates them from other parenchyma cells by a pectin rich middle lamella
(Harker et al., 1997). Thickened primary cell walls are found in the specialized
parenchyma cells of the epidermis and hypodermis which together form the epicarp,
24
also known as the fruit’s skin or peel (Figure 1-1). The parenchyma cells in the
epidermis are also unique in that they produce a thick lipid layer of cuticle and waxes
which coats the berry surface and functions in water regulation and pathogen resistance
(Fava et al., 2006). The epicuticular waxes of blueberry give the otherwise dark
pigmented fruit its powdery blue color and have been described to vary in form from
amorphous to that of short, narrow rods (Gough, 1994; Fava et al., 2006).
Collenchyma cells and phloem elements also have thickened primary cell walls
that provide tensile strength to surrounding tissues. Xylem and sclerenchyma cells such
as fibers and sclereids have thick and lignified secondary cell walls, and can be found
associated with vascular bundles and stone cells in the berry’s flesh (Harker et al., 1997;
Gough, 1994).
Cell size varies between fruit species from cross sectional diameters of 40 µm in
avocado (Persea americana Mill.) to 500-700 µm in watermelon (Citrullus lanatus
Thunb.) (Harker et al., 1997). Cell size also varies within species and within genotypes.
Cano-Medrano and Darnell, (1997) found that differences in blueberry fruit size between
GA treated parthenocarpic fruits and hand pollinated fruits of the same rabbiteye
blueberry genotype was a result of differences in cell size. However, Johnson et al.
(2011) found that differences in blueberry fruit size between 20 genotypes of rabbiteye
blueberry were a result of cell number and not significantly related to cell size.
Variability in cell size is more likely to play a role in fruit texture than it has been found to
contribute to fruit size (Harker et al, 1997). A study by Mann et al. (2005) compared
sensory and instrumental measurements to cell number and size in apple, and
concluded that fruits with fewer cells per unit area were more crisp than fruits with more
cells per unit area. Large cells have a smaller surface area and lower proportion of cell

25
wall material than small cells, which is considered to decrease firmness and tissue
strength (Harker et al., 1997). However, the cells of crisp-textured fruits are thought to
burst rather than separate from adjacent cells, in which case increased cell size may
increase the likelihood of cell rupture and therefore contribute to crisp texture as was
observed by Mann et al. (2005).
Cell size also varies with different cell types during ripening (Harker et al., 1997).
Shortly after anthesis, mesocarp cells stop dividing and increase only in size as the fruit
continues to develop and enlarge (Darnell et al., 1992). Cell size is much smaller in the
epidermal and hypodermal layers that together form the epicarp, where cell division
occurs over a longer period of time during fruit expansion (Harker et al., 1997).
Cell shape and packing determine the amount of contact and/or space found
between adjacent cells. A comparison between soft and crisp-textured sweet cherries
(Prunus avium L.) suggested that crisp cherries have a higher frequency of large
intercellular spaces than soft-textured cherries (Batisse et al. 1996). Twenty-five
percent of fruit volume in apple (also considered a crisp fruit) is reported to be
intercellular space (Esau, 1977). The degree to which adjacent cells separate during
chewing has an effect on its perceived texture. In the process of chewing, fruit is
compressed to the point of fracture, which can occur by separation of adjoining cells –
as is the case with soft fruits such as banana – or by individual cell rupture in crisp fruits
such as apple and watermelon (Harker et al., 1997). Whether cells separate or rupture
is dependent on cell wall strength and the degree of adhesion between cells, which is
affected by the amount of cell-to-cell contact, the strength of the pectin rich middle
lamella, and the number of plasmodesmata between cells (Harker et al., 1997).
26
Cell wall thickness and strength may be the greatest overall contributor to fruit
firmness and texture (Goulao and Oliveira, 2008; Li et al., 2010). The primary cell wall is
a complex matrix composed of approximately 30-40% cellulose, 30% hemicellulose, 15-
30% pectin, and 5-10% structural protein (Vermerris, 2008). Cellulose is made up of
approximately 36 long linear β-(1-4)-D-glucan chains that are tightly packed in parallel
and assembled by hydrogen bonding into crystalline microfibrils that can reach hundreds
of micrometers in length (Vermerris, 2008). Hemicelluloses are cross linking glycans
that hydrogen bond with cellulose microbrils to form the cell wall matrix and require
strong alkali to be extracted from the wall (Brummel, 2006; Vermerris, 2008).
Xyloglucans and Glucuronoarabinoxylans (GAXs) are the primary forms of
hemicellulose in plant cell walls (Carpita and Gibeaut, 1993). The primary wall of most
dicots contains approximately 20% xyloglucan and 5% GAX (Zablackis et al., 1995).
Glucuronoarabinoxylans (GAXs) are the primary type of hemicellulose found in
graminaceaous species, making up 20-30% of their total cell wall, but can also be found
to a lesser degree in the cell walls of dicots (Carpita and Gibeaut, 1993). Pectins are
highly hydrated and branched polysaccharides that are rich in D-galacturonic acid and
have neutral sugar side chains of rhamnose, galactose, and arabinose (Brummell,
2006). Pectins are especially abundant in the cell walls of fruit where they form a gel in
the wall matrix and middle lamella where they are more loosely bound and can be
extracted with water and chelating agents (Brummell, 2006). Pectins have been found
to comprise 30-35% of the total cell wall of blueberry, but instead of glucose being the
primary neutral sugar, xylose and arabinose were detected in greater quantity
suggesting that xylan may be the primary form of hemicellulose (Vicente et al., 2007).
27
Secondary cell walls typically have a higher proportion of cellulose, a lower
proportion of pectin, and hemicelluloses that are more abundant in xylans and
glucomannans which bind more tightly to cellulose (Knox, 2008). These factors
contribute to the fact that primary cell walls are extendable during growth whereas
secondary cell walls are non-extendable and only form after growth has occurred and
the cell shape is fixed (Lee et al., 2011). Unlike primary cell walls, secondary cell walls
contain lignin, which is a complex network of phenylpropanoids that bind tightly to
cellulose, making the cell wall rigid, strong, hydrophobic, and protected against
pathogens (Hatfield and Vermerris, 2001). Monolignols formed in the cytosol are
transported to the plant cell wall where they are polymerized by oxidative coupling
(Hatfield and Vermerris, 2001). Lignin biosynthesis occurs in fruit tissue and is
suggested to persist in fruits during postharvest storage as a stress response to
dehydration and pathogen attack (Bonghi et al., 2012).
Blueberry fruits are known to contain “stone” cells, or sclereids, which are
sclerified cells that have thick secondary walls with high lignin content. Gough (1983)
found these sclereids just beneath the epidermal cell layer in three highbush blueberry
cultivars. All three cultivars contained similar development and distribution of sclereids,
but differed in the total number found (Gough, 1983). The average size of stone cells is
approximately the same as the surrounding cells, but their wall is three to four times
thicker than neighboring parenchyma cells and is reported to increase during ripening
and postharvest storage (Gough, 1983; Allan-Wojtas, 2001). Visible pitting in the
sclereid cell wall allows for exchange of water and nutrients between cells (Gough,
1983; Tao et al., 2009). Sclereids can be found singly, doubly, or in clusters, and can
28
bind neighboring parenchyma cells, which is considered to increase structure and
firmness in the fruit (Gough, 1983; Allan-Wojtas et al., 2001; Fava et al., 2006).
Modification of Cell Structure
Ripening is a major event in fruit development affecting both texture and
firmness. Physiological and biochemical changes that occur during ripening include:
conversion of starch to sugar, pigment biosynthesis and accumulation, biosynthesis of
flavor and aromatic compounds, cell wall degradation and fruit softening (Brummell,
2006; Goulau and Oliveira, 2008). Textural modifications during fruit softening consist
mostly of changes to the mechanical strength of the cell wall and breakdown of cell-to-
cell adhesion at the middle lamella. These changes are primarily the result of the
enzyme initiated solubilization and depolymerization of pectins and hemicelluloses
(Goulao and Oliveira, 2008). Depolymerization of pectins is considered to be one of the
most substantial and yet variable factors involved in fruit softening of different fruit
species (Brummell, 2006). Depolymerization of ionically bound cyclohexane trans- 1,2-
diamine tetraacetate (CDTA)-soluble pectins is evident in avocado, but virtually absent
in pepper (Capsicum annuum L.), banana, and apple (Brummell, 2006). Sodium
carbonate soluble pectins are comprised of ester bound glycans such as
homogalacturonan, which is a primary component of the middle lamella where cell-to-
cell adhesion is maintained (Brummell, 2006). Pectin solubilization has been related to
observed swelling of the cell wall in several melting flesh fruits, but both pectin
solubilization and cell wall swelling were diminished in the crisp fruits of apple,
watermelon, and pear (Pyrus communis L.) (Redgwell et al., 1997).
Fruits are typically divided into two categories based on how they ripen.
Climacteric fruits exhibit a peak in both respiration and ethylene production that
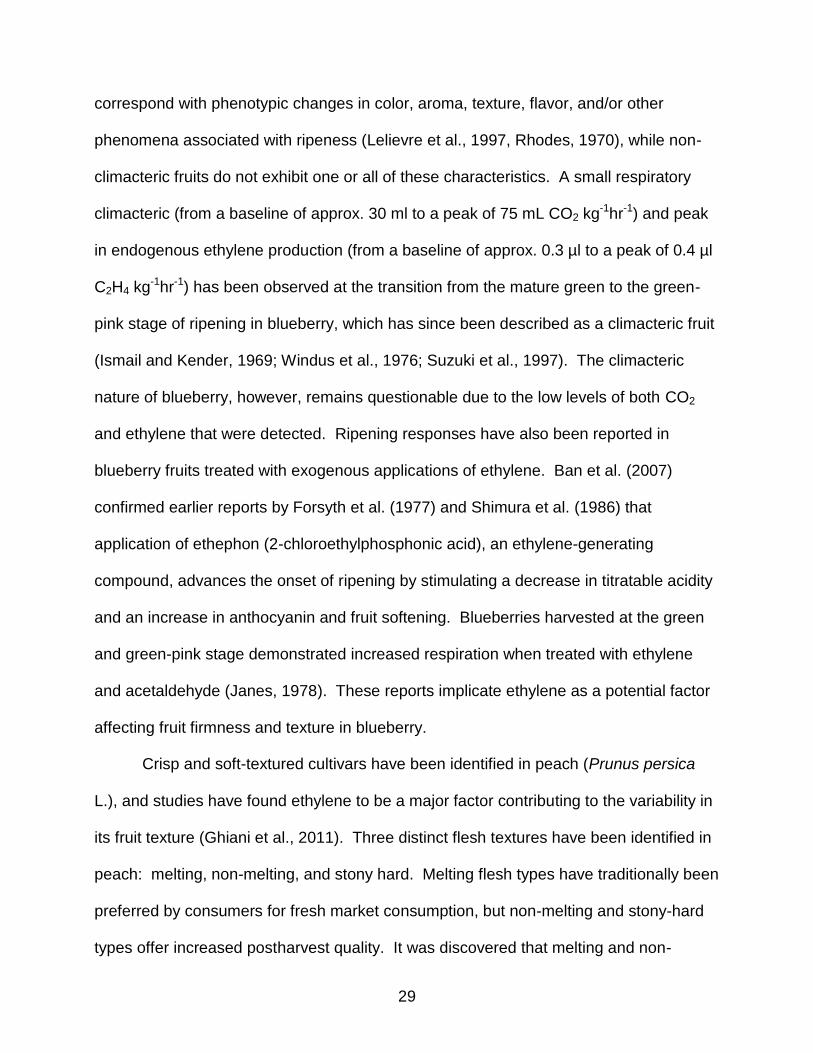
29
correspond with phenotypic changes in color, aroma, texture, flavor, and/or other
phenomena associated with ripeness (Lelievre et al., 1997, Rhodes, 1970), while non-
climacteric fruits do not exhibit one or all of these characteristics. A small respiratory
climacteric (from a baseline of approx. 30 ml to a peak of 75 mL CO2 kg-1hr-1) and peak
in endogenous ethylene production (from a baseline of approx. 0.3 µl to a peak of 0.4 µl
C2H4 kg-1hr-1) has been observed at the transition from the mature green to the green-
pink stage of ripening in blueberry, which has since been described as a climacteric fruit
(Ismail and Kender, 1969; Windus et al., 1976; Suzuki et al., 1997). The climacteric
nature of blueberry, however, remains questionable due to the low levels of both CO2
and ethylene that were detected. Ripening responses have also been reported in
blueberry fruits treated with exogenous applications of ethylene. Ban et al. (2007)
confirmed earlier reports by Forsyth et al. (1977) and Shimura et al. (1986) that
application of ethephon (2-chloroethylphosphonic acid), an ethylene-generating
compound, advances the onset of ripening by stimulating a decrease in titratable acidity
and an increase in anthocyanin and fruit softening. Blueberries harvested at the green
and green-pink stage demonstrated increased respiration when treated with ethylene
and acetaldehyde (Janes, 1978). These reports implicate ethylene as a potential factor
affecting fruit firmness and texture in blueberry.
Crisp and soft-textured cultivars have been identified in peach (Prunus persica
L.), and studies have found ethylene to be a major factor contributing to the variability in
its fruit texture (Ghiani et al., 2011). Three distinct flesh textures have been identified in
peach: melting, non-melting, and stony hard. Melting flesh types have traditionally been
preferred by consumers for fresh market consumption, but non-melting and stony-hard
types offer increased postharvest quality. It was discovered that melting and non-

30
melting flesh types are controlled by a single gene, where melting demonstrates
complete dominance at a single locus encoding polygalacturonase, which is an enzyme
involved in pectin degradation (Haji et al., 2005). Stony hard, however is a result of a
mutation in a single gene involved in ethylene production (Tataranni et al., 2010).
In blueberry, cell wall degradation is marked by pectin solubilization in the early
and intermediate stages of ripening, and increased solubilization of arabinose from
pectins and hemicelluloses in the later stages of ripening (Vicente et al., 2007). The
depolymerization of hemicelluloses was found to occur throughout all developmental
stages in blueberry (green to ripe fruits), but pectin polymers were not broken down
during fruit softening (Vicente et al., 2007). Proctor and Miesle (1991), identified
pectinmethylesterase (PME) and polygalacturonase (PG) to be present and increasing
in ripening blueberry fruit up to the red-blue stage which coincides with the period when
pectin is solubilized, anthocyanins appear, and fruit softens. Mielse et al. (1991), also
found increasing levels of peroxidase (POD) activity in ripening blueberry fruits up to the
red stage. The degree to which ethylene is involved in and/or responsible for signaling
the enzymes involved in fruit softening in blueberry remains unclear.
Ethylene sensitive (climacteric) fruits are expected to show negative responses to
ethylene inhibitors such as silver thiosulphate (STS), and 1-methylcyclopropene (1-
MCP). The use of 1-MCP as a suppressor of ethylene responses in the ripening of both
climacteric and traditionally non-climacteric fruit was summarized by Huber (2008).
Climacteric fruit treated with 1-MCP have demonstrated ripening responses such as
altered ethylene production and respiration, delayed or suppressed softening, altered or
delayed volatile emissions, and/or pigment change (Huber, 2008). Non-climacteric
fruits, such as grape and strawberry have also shown delayed or decreased ripening in

31
response to ethylene inhibitors (Tian et al., 2000; Jiang et al., 2001; Chervin et al., 2004;
Bellincontro et al., 2006; Ianetta et al., 2006) Preharvest application of 1-MCP to grape
resulted in decreased berry diameter, increased acidity, and decreased anthocyanin
accumulation (Chervin et al., 2004). Postharvest applications of 1-MCP also resulted in
an initial reduction of ethylene production and delayed anthocyanin breakdown in grape
(Bellincontro et al., 2006). Postharvest applications of 1-MCP to strawberry decreased
ethylene production, fruit softening and anthocyanin accumulation (Jiang et al., 2001).
The effect of postharvest applications of 1-MCP on blueberry is unclear. DeLong
et al., (2003) compared the percent marketable fruit among two highbush blueberry
cultivars treated at postharvest with 1-MCP, and found no effect on the shelf life of either
cultivar. MacLean and NeSmith (2011) evaluated ethylene production, firmness, TSS,
and TA in three rabbiteye cultivars treated with 1-MCP after harvest and found
increased ethylene production in all three cultivars, decreased firmness in one cultivar,
but no effect on TSS or TA content. There are no published reports on the preharvest
application of 1-MCP to blueberry fruit.
Turgor is also thought to play an important role in fruit softening (Thomas et al.,
2008). Bruce (2003) suggests that all mechanical properties of plant tissue result from
interactions between turgor and the cell wall. Turgor interacts with the cell wall, such
that when internal cell pressure is high the cell wall is more taut, stiff, and brittle, and
therefore more likely to burst when external pressure is applied (Harker et al., 1997).
When external force is applied to tissues with low turgor pressure, however, disruption
of cell-to-cell adhesion is more likely (Harker et al., 1997). As discussed previously,
cells that burst open as opposed to those that remain intact and separate from
neighboring cells have different textures which correspond to crisp and soft tissues

32
respectively (Harker et al., 1997). Shackel et al. (1991) used a pressure microprobe to
measure turgor in ripening tomato (Solanum lycopersicum L.), and found that turgor
increases prior to the onset of ripening and decreases during ripening, but reaches its
maximum 2-4 days before color change occurs, indicating that changes in turgor may
precede tissue ripening. Tong et al. (1999) compared differences between apple
genotypes that remain crisp or soften during postharvest storage and found that crisp
genotypes maintained higher turgor pressure and cell wall integrity than soft genotypes.
A study of rabbiteye blueberry demonstrated that fruits stored at a lower relative
humidity decreased in firmness as weight loss increased suggesting that water loss is a
major cause of decreases in berry firmness (Paniagua et al., 2013).
The plasma membrane regulates the transport of water and solutes in and out of
the cell and with turgor, is also closely associated with cell wall structure and
degradation (Harker et al., 1997). It remains unclear, however, whether changes in
turgor pressure and membrane integrity are prescriptive or descriptive of fruit softening
and cell wall degradation.
Current Research
The genetic and physiological basis of crispness in blueberry remains to be
uncovered. The objective of this research was 1) to use compression and bioyield force
measures to identify crisp and soft-textured genotypes determined by a trained sensory
panel, then 2) to evaluate how genotypes of these identified texture classes respond to
ethylene inhibition, 3) to investigate differences in cellular structure between genotypes,
4) to quantify differences in cell wall composition between genotypes, and 5) to
phenotype seedling populations from putative crisp parents in order to determine
segregation patterns and the genetic basis of crisp texture in blueberry.

33
Figure 1-1. Blue fruit of ‘Sweetcrisp’ (20x magnification) showing the endocarp (1) made up of 5 carpels (A), 10 locules (B), approx. 50 seed (C), and 5 placentae (D). Image 2 shows the cuticle (A), epidermis (B), and hypodermis (C), which together form the epicarp (D). The mesocarp (E) is composed of parenchyma cells, and contains rings of vascular bundles (F). Photos courtesy of Kim Backer-Kelley.
A B
C D
E
F
A
C
D
1
2
B
34
CHAPTER 2 CORRELATION BETWEEN SENSORY AND INSTRUMENTAL MEASUREMENTS OF
CRISP TEXTURED BLUEBERRIES
Literature Review
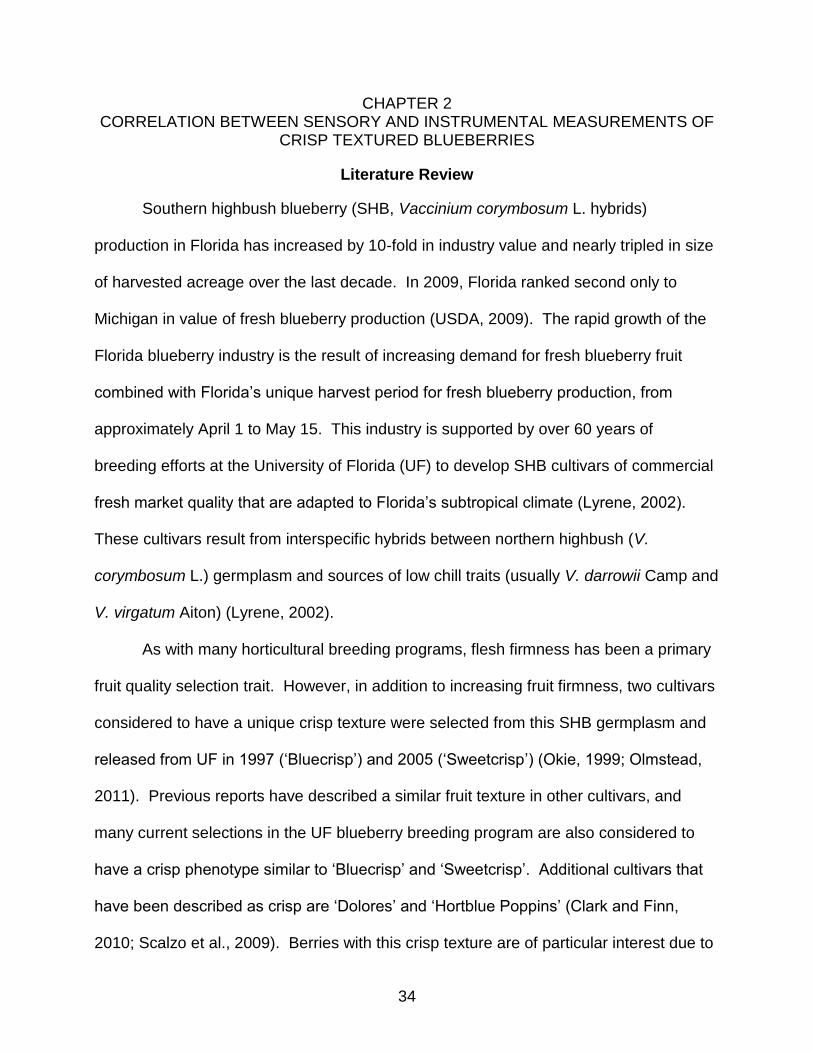
Southern highbush blueberry (SHB, Vaccinium corymbosum L. hybrids)
production in Florida has increased by 10-fold in industry value and nearly tripled in size
of harvested acreage over the last decade. In 2009, Florida ranked second only to
Michigan in value of fresh blueberry production (USDA, 2009). The rapid growth of the
Florida blueberry industry is the result of increasing demand for fresh blueberry fruit
combined with Florida’s unique harvest period for fresh blueberry production, from
approximately April 1 to May 15. This industry is supported by over 60 years of
breeding efforts at the University of Florida (UF) to develop SHB cultivars of commercial
fresh market quality that are adapted to Florida’s subtropical climate (Lyrene, 2002).
These cultivars result from interspecific hybrids between northern highbush (V.
corymbosum L.) germplasm and sources of low chill traits (usually V. darrowii Camp and
V. virgatum Aiton) (Lyrene, 2002).
As with many horticultural breeding programs, flesh firmness has been a primary
fruit quality selection trait. However, in addition to increasing fruit firmness, two cultivars
considered to have a unique crisp texture were selected from this SHB germplasm and
released from UF in 1997 (‘Bluecrisp’) and 2005 (‘Sweetcrisp’) (Okie, 1999; Olmstead,
2011). Previous reports have described a similar fruit texture in other cultivars, and
many current selections in the UF blueberry breeding program are also considered to
have a crisp phenotype similar to ‘Bluecrisp’ and ‘Sweetcrisp’. Additional cultivars that
have been described as crisp are ‘Dolores’ and ‘Hortblue Poppins’ (Clark and Finn,
2010; Scalzo et al., 2009). Berries with this crisp texture are of particular interest due to

35
their enhanced eating quality, prolonged postharvest life, and potential value for
mechanical harvesting for fresh marketed blueberries.
Fruit texture is a major factor influencing overall fruit quality. Fruit texture affects
both the postharvest life of the fruit, as well as the consumer’s eating experience (Harker
et al., 1997; Saftner et al., 2008). Additionally, due to rising labor costs and decreasing
labor availability for hand harvesting of blueberries, the industry has been looking for
ways to mechanically harvest fresh market berries (Strik and Yarborough, 2005). New
machine harvesters have been designed and tested for use in blueberry (Peterson et al.,
1997; van Dalfsen and Gaye, 1999), and research has been initiated to determine
cultural practices and cultivars best suited for mechanical harvesting (Takeda et al.,
2008). Several bush and berry traits are thought to be desirable for mechanical
harvesting methods, and berry firmness is top among them (Ehlenfeldt, 2005).
Fruit texture is determined by several factors governing cellular structure
including: fruit anatomy and cellular construction, the mechanical and physiological
properties of cells, biochemical changes in the cell wall, turgor pressure, and membrane
integrity (Harker et al., 1997). These factors contribute to textural traits such as
crispness, hardness, juiciness, and mealiness (Harker et al., 1997). Fruit texture has
been measured in a variety of ways, including bioyield tests, deformation tests, tactile
assessment, shearing tests, beam tests, measures of juice content, and sensory
evaluations (Harker et al., 1997). Sensory evaluations are performed by consumers for
hedonic characterizations and trained panels are used for profiling and descriptive
analysis (Worch et al., 2010). Correlating instrumental measures with sensory
evaluations is useful for predicting consumer responses while using instrumentation is
often desirable for quantitative assessments in breeding.
36
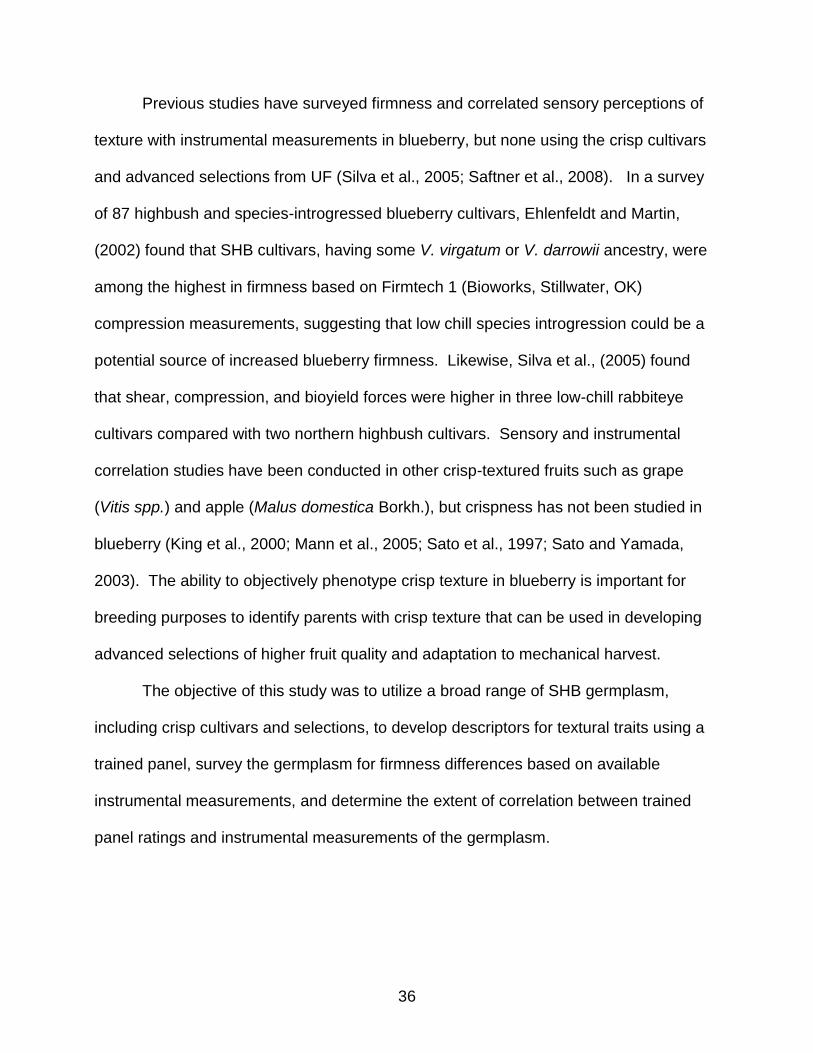
Previous studies have surveyed firmness and correlated sensory perceptions of
texture with instrumental measurements in blueberry, but none using the crisp cultivars
and advanced selections from UF (Silva et al., 2005; Saftner et al., 2008). In a survey
of 87 highbush and species-introgressed blueberry cultivars, Ehlenfeldt and Martin,
(2002) found that SHB cultivars, having some V. virgatum or V. darrowii ancestry, were
among the highest in firmness based on Firmtech 1 (Bioworks, Stillwater, OK)
compression measurements, suggesting that low chill species introgression could be a
potential source of increased blueberry firmness. Likewise, Silva et al., (2005) found
that shear, compression, and bioyield forces were higher in three low-chill rabbiteye
cultivars compared with two northern highbush cultivars. Sensory and instrumental
correlation studies have been conducted in other crisp-textured fruits such as grape
(Vitis spp.) and apple (Malus domestica Borkh.), but crispness has not been studied in
blueberry (King et al., 2000; Mann et al., 2005; Sato et al., 1997; Sato and Yamada,
2003). The ability to objectively phenotype crisp texture in blueberry is important for
breeding purposes to identify parents with crisp texture that can be used in developing
advanced selections of higher fruit quality and adaptation to mechanical harvest.
The objective of this study was to utilize a broad range of SHB germplasm,
including crisp cultivars and selections, to develop descriptors for textural traits using a
trained panel, survey the germplasm for firmness differences based on available
instrumental measurements, and determine the extent of correlation between trained
panel ratings and instrumental measurements of the germplasm.

37
Methods
Plant Material
Cultivars and selections of southern highbush blueberry were hand harvested
from field trials at Straughn Farms, Inc. near Archer, Waldo, and Windsor, FL. Berries
were collected on six dates (May 5, 13, 17, 19, and 24) in 2010 from 36 genotypes and
on seven dates (April 18, 25, 27, May 2, 5, 9, and 11) in 2011 from 49 genotypes as
fruits ripened during the harvest season (Table 2-1). Only mature, fully blue,
unblemished berries were harvested. Berries were packed in 170 g plastic vented
clamshells (Pactiv, Lake Forest, IL) , stored in coolers filled with ice and transported on
the same day to the USDA-ARS research lab in Winter Haven, FL for sensory
evaluation and to the blueberry breeding lab at UF in Gainesville, FL for instrumental
analyses. At both locations, berries were stored overnight in a cold chamber at 4ºC and
brought to room temperature on the next morning before sensory and instrumental
analyses were performed.
Sensory Analyses
Eleven to twelve panelists trained to evaluate fruit and fruit products met in four
(2010) and six (2011) one-hour sessions to discuss texture descriptors. Descriptors
were adapted from Saftner et al. (2008). A consensus was reached to define
descriptors: “bursting energy” = impression from the first bite, from mushy to crunchy;
“firmness during chewing” = firmness between the molars, from soft to firm; “skin
toughness” = amount of residual skin that needs chewing after the flesh is gone, from
thin to tough; “graininess” = texture from stone cells or seeds, from smooth to
gritty/grainy; “juiciness” = amount of juice from the flesh, from not juicy to juicy;

38
“mealiness” = pasty, dry feeling in the mouth, from not mealy to mealy; “overall flavor
intensity” = blueberry, fruity flavor, from low to high.
Each descriptor was rated on an 11-point scale (0 to 10). To compensate for fruit-
to-fruit variability, panelists were instructed to taste two berries at a time, and repeat at
least twice. Six to eight berries were presented in 120 mL soufflé cups with lids
(SOLO® Cup Company, Urbana, IL), labeled with 3-digit number codes and served at
room temperature. Six and five samples were presented per session in 2010 and 2011,
respectively, with two sessions per day. Tasting took place in booths under red lighting;
spring water and unsalted crackers were provided to panelists to rinse their mouth
between samples. To assess panelist and cultivar reproducibility within a harvest
season and between years, five cultivars and one numbered selection were evaluated
on two days with three and two replications on each day in 2010 and 2011, respectively.
Data were collected using Compusense® 5.0 data acquisition and analysis software
(Compusense Inc., Guelph, Ontario, Canada).
Instrumental Analyses
Compression and bioyield force were measured on 25 berries from each cultivar
in 2010 and 2011. For compression measurements, berries were oriented equatorially
upright (Ehlenfeldt and Martin, 2002), on a FirmTech 2 (Bioworks, Wamego, KS) fitted
with a 3 cm diameter flat bottom plate load cell. The point of compression was marked
with a permanent marker, and the same berries were rotated 90º along the equatorial
plane and punctured with a 4 mm probe in 2010 and a 3 mm probe in 2011 using an
Instron texture analyzer (Instron Corporation, Canton, MA). Compression firmness
(N·mm-1) measured the average force required to compress the berry two mm. Bioyield
39
force (N) was measured as the maximum force required to puncture a berry at a speed
of 50 mm·min-1.
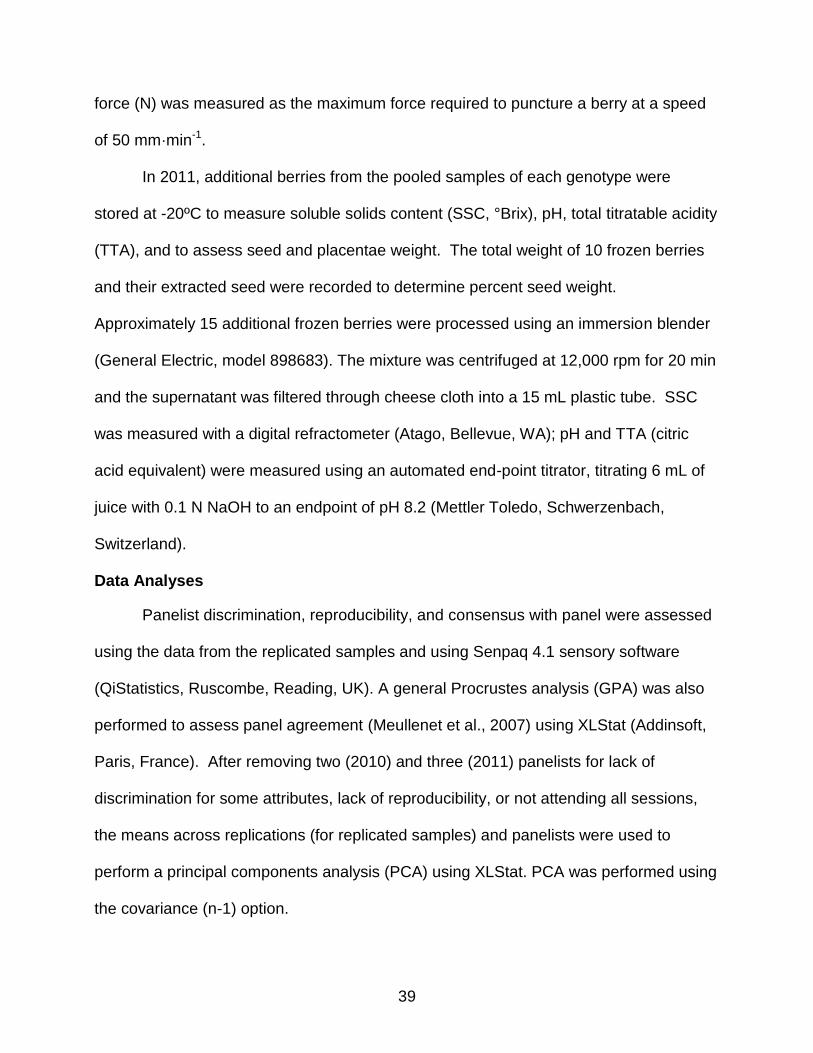
In 2011, additional berries from the pooled samples of each genotype were
stored at -20ºC to measure soluble solids content (SSC, °Brix), pH, total titratable acidity
(TTA), and to assess seed and placentae weight. The total weight of 10 frozen berries
and their extracted seed were recorded to determine percent seed weight.
Approximately 15 additional frozen berries were processed using an immersion blender
(General Electric, model 898683). The mixture was centrifuged at 12,000 rpm for 20 min
and the supernatant was filtered through cheese cloth into a 15 mL plastic tube. SSC
was measured with a digital refractometer (Atago, Bellevue, WA); pH and TTA (citric
acid equivalent) were measured using an automated end-point titrator, titrating 6 mL of
juice with 0.1 N NaOH to an endpoint of pH 8.2 (Mettler Toledo, Schwerzenbach,
Switzerland).
Data Analyses
Panelist discrimination, reproducibility, and consensus with panel were assessed
using the data from the replicated samples and using Senpaq 4.1 sensory software
(QiStatistics, Ruscombe, Reading, UK). A general Procrustes analysis (GPA) was also
performed to assess panel agreement (Meullenet et al., 2007) using XLStat (Addinsoft,
Paris, France). After removing two (2010) and three (2011) panelists for lack of
discrimination for some attributes, lack of reproducibility, or not attending all sessions,
the means across replications (for replicated samples) and panelists were used to
perform a principal components analysis (PCA) using XLStat. PCA was performed using
the covariance (n-1) option.

40
Sensory and instrumental measurements of genotypes replicated on two different
harvest dates in one season and between years were analyzed using the mixed
procedure (SAS 9.2) with dates as a fixed effect of sensory and instrumental measures
and panelists as a random factor of sensory measures.
ANOVA was performed for all genotypes in 2010 and 2011 using the GLM
procedure (SAS 9.2) with genotype as a fixed effect of instrumental force measurements
and using the GLIMMIX procedure and Kenward-Roger method (SAS 9.2) with
genotype as a fixed effect and panelists as a random factor of sensory measurements.
Tukey’s honestly significant difference (HSD) test was used to determine significant
differences (P ≤ 0.05) between genotype means. Correlation analyses were performed
using the correlation procedure (SAS 9.2).
Results
Genotypes
The genotypes selected for use in these experiments represented a wide range
of germplasm utilized by the UF SHB breeding program and included recent cultivar
releases, standard cultivars, and advanced selections still under trial (Table 2-1).
Because a primary goal was to develop descriptors for the crisp texture phenotype,
approximately equal numbers of crisp and non-crisp genotypes were selected for
analyses each year (18 crisp and 18 non-crisp, and 26 crisp and 23 non-crisp in 2010
and 2011, respectively). For this initial grouping, the determination between crisp and
non-crisp was a subjective decision made by the blueberry breeders after several years
of observation.

41
Sensory Analyses
In general, SHB genotypes will ripen over a four to six week period. To evaluate
the potential changes in sensory evaluations on multiple harvest dates, six genotypes
replicated on two different harvest dates within the 2010 and 2011 season were
compared (Table 2-2). There were significant differences in the sensory evaluation of
juiciness in ‘Emerald’, ‘Farthing’ and ‘Springhigh’ and in the bursting energy of
‘Springhigh’ when evaluated on different harvest dates in 2010, but no differences in
sensory evaluation due to harvest date in 2011 (Table 2-2). There was no significant
year interaction in the sensory evaluation of bursting energy, firmness, skin toughness,
juiciness, and mealiness of the six replicated genotypes that were evaluated in 2010 and
2011.
Significant differences between genotypes were observed for all sensory traits
evaluated by the trained panels in 2010 and 2011 (Tables 2-3 and 2-4). Bursting energy
demonstrated the broadest range of trait variability among cultivars in both 2010 (1.7 to
6.8) and 2011 (1.6 to 8.3). Eleven (2010) and fourteen (2011) Tukey groupings were
identified. Selection FL 07-449 had the highest score for bursting energy in both 2010
and 2011. Panelists were able to differentiate genotypes by firmness, skin toughness,
juiciness, mealiness, grittiness, and overall flavor but observed less variability in range
for these traits and fewer Tukey groupings were identified. Principal components
analysis was used as an exploratory technique to identify correlations among variables,
to identify groups among samples and to identify potential outliers. The first two principal
components explained 94.59 % and 81.81 % of the total variation in 2010 and 2011,
respectively. The plot of the first two components showed that juiciness was negatively
correlated with mealiness, and there were no correlations with the descriptor indicators

42
of firmness (firmness, bursting energy and skin toughness) (Figures 2-1 and 2-2). In
2011, adding the variables “graininess” and “blueberry flavor” did not change how
juiciness, mealiness, bursting energy, firmness and skin toughness related to each other
(compare Figures 2-1 and 2-2), however “blueberry flavor” correlated positively with
“juiciness” and negatively with “mealiness”. Likewise, the distribution of genotypes in the
PCA plots were similar both years. Most named commercial cultivars, except ‘Raven’,
‘Kestrel’ (2010) and ‘Southern Belle’ (2011), were on the negative side of PC1,
indicating low firmness and bursting energy, while most numbered hybrids and
‘Sweetcrisp’ were on the positive side of PC1 (Figures 2-1 and 2-2). ‘Rebel’, ‘Millennia’
and ‘Emerald’ tended to have higher mealiness (or lesser juiciness) both years, as
indicated by their position on the F2 axis. Genotypes receiving the highest scores for
perceived bursting energy, firmness, and skin toughness were also the same cultivars
subjectively identified by breeders at UF to have a unique crisp texture prior to this study
(Figures 2-1 and 2-2).
Instrumental Analyses
FirmTech 2 (compression force) and Instron (bioyield force) measures of six
genotypes were repeated on two different dates during 2010 and 2011. There was a
significant year x genotype interaction (P < 0.05), so results within each year were
analyzed separately (Table 2-2). Among the cultivars replicated within the season in
2010, compression force measurements were significantly different between the two
dates of evaluation for FL 98-325, ‘Emerald’, and ‘Farthing’, but not significantly different
for ‘Sweetcrisp’, ‘Springhigh’, and ‘Star’ (Table 2-2). Compression force measurements
were likewise significantly different between evaluation dates for FL 98-325 and
‘Emerald’ in 2011, and not significantly different for ‘Springhigh’ and ‘Star’ in 2011.

43
Bioyield force measurements in 2010 were significantly different between evaluation
dates for two cultivars (‘Farthing’ and ‘Star’), but not significantly different for ‘Emerald’
and ‘Sweetcrisp’. In 2011, ‘Emerald’ was the only cultivar for which bioyield force
measurements were significantly different between evaluation dates.
There were significant differences between genotypes for compression and
bioyield force measurements in 2010 and 2011 (Tables 2-3 and 2-4). Compression
force ranged from 1.58 to 3.03 N in 2010 and 1.71 to 2.93 N in 2011, with twenty-two
and twenty Tukey groupings identified in 2010 and 2011 respectively. Bioyield force
ranged from 1.74 to 5.04 N in 2010 and 1.00 to 2.48 N in 2011, with eighteen and
twenty-eight Tukey groupings identified in 2010 and 2011 respectively. The scale and
range of bioyield force measurements was different in 2010 and 2011 due to the use of
different sized probes, but the relationship of bioyield forces between genotypes within a
year was unaffected and therefore correlations of bioyield force with compression force
and sensory scores in 2010 and 2011 were comparable. Selection FL 07-449 required
the greatest bioyield force in both 2010 and 2011. ‘Bobolink’ had the lowest bioyield and
compression force in 2010, and ‘Snowchaser’ had the lowest bioyield and compression
force in 2011. Cultivars having the greatest bioyield and compression force
measurements were also the same cultivars subjectively identified by breeders at UF to
have crisp texture prior to this study.
Seed weight, placenta weight, SSC, pH, and TTA were measured in 2011, but
none were significantly different between genotypes. Seed weight varied from 0.0005 to
0.0149% fresh fruit weight and mean placenta weight ranged from 0.2 to 7 mg. SSC
ranged from 10.1 to 15.9%, pH ranged from 2.8 to 4.3, and TTA ranged from 0.09 to
1.2%.

44
Sensory x Instrumental Correlations
Correlations between sensory measurements of bursting energy, firmness and
skin toughness were significant at P < 0.001 in 2010 and 2011 (Tables 2-5 and 2-6).
Mealiness and juiciness were negatively correlated (P < 0.001) in 2010 and 2011. In
2011, the additional sensory categories of graininess and flavor were added to panel
evaluations. Juiciness was found to be negatively correlated with graininess (P < 0.01)
and to be positively correlated with flavor (P < 0.01) (Table 2-6). Compression and
bioyield force measurements of all cultivars and selections were correlated with an R
value of 0.78 (P < 0.001) and 0.71 (P < 0.001) in 2010 and 2011, respectively (Tables 2-
5 and 2-6). Individually, compression and bioyield force were highly correlated to
sensory perceived bursting energy, firmness, and skin toughness, but poorly correlated
to perceived juiciness, mealiness, graininess, and flavor (Tables 2-5 and 2-6).
Measurements made in 2011 for seed and placenta weight were not correlated with the
sensory evaluation of graininess. Similarly, there were no strong correlations between
sensory evaluation of flavor and measured SSC, pH, or TTA.
Discussion
Using previous definitions for texture adopted for consumer evaluations of
blueberry fruit (Saftner et al., 2008), we developed blueberry texture descriptors by a
trained panel. In the first year, the focus was to describe blueberry texture, and in
particular, include subjectively identified crisp-textured blueberry fruit, as this texture had
not been analyzed previously. Subsequently, graininess and flavor were developed as
additional descriptors by the trained panel based on comments in the first year.
Because of the short harvest window in Florida blueberry production (April-May, with an
approximately four to six week harvest period for a given genotype), and the limited

45
number of plants available for many of the advanced selections within the breeding
program, the number of replicated genotypes within a growing season that could be
provided to a trained panel was limited. Therefore, we adopted a strategy that allowed
multiple genotypes to be evaluated by the trained panel while including standard
cultivars and selections that could be evaluated multiple times by the panel. For the
most part, panelist reproducibility for the replicated cultivars and selections was
excellent. The only exceptions were in the category of bursting energy in 2010 for the
cultivar ‘Springhigh’ and in the category of juiciness in 2010, where three cultivars
(‘Emerald’, ‘Farthing’, and ‘Springhigh’) were significantly different. The differences
between those replications could be due to panelists’ inability to measure bursting
energy and juiciness in those cultivars that year, or that those cultivars were more
variable in bursting energy and juiciness between evaluation dates. It is possible that
irrigation could have been a factor affecting perceived juiciness between replication
dates. ‘Emerald’ and ‘Springhigh’ were irrigated by overhead sprinklers on a three day
rotation, while ‘Farthing’ received drip irrigation daily. It is unlikely that rain was a factor
affecting juiciness as rainfall was minimal between evaluation dates, and juiciness
increased in ‘Emerald’ but decreased in ‘Farthing’ after these light rains occurred.
With PCA, the subjectively identified crisp-textured cultivars and selections form a
relatively large group that is most closely associated with bursting energy, firmness, and
skin toughness (Figures 2-1 and 2-2). The grouping of these traits may be due to the
panelists’ inability to differentiate between them, or due to these traits being biologically
linked with one another. As one might expect, juiciness and mealiness were inversely
proportional to one another. Collectively, there was considerable overlap between
Tukey groupings (Tables 2-3 and 2-4), which could have resulted from the panelists’
46
inability to perceive crispness in a background of other varying textural traits such as
berry firmness and skin toughness. Supporting this observation is the relatively broad
distribution of subjectively identified crisp genotypes by sensory analyses, and the
overlap of the cultivars ‘Kestrel’ and ‘Raven’ with the subjectively identified crisp
genotypes. Breeder evaluations of both ‘Kestrel’ and ‘Raven’ have not included them in
the crisp category, but the results of this study warrant further examination. It remains
unclear whether crispness is in fact a new trait, or the extreme expression of already
characterized traits in blueberry such as firmness and skin toughness. Observing
segregation patterns from putative crisp parents would help to elucidate the genetic
basis of these cultivars considered to have a unique texture.
On the same day that the trained panel evaluations were performed, compression
and bioyield forces were measured on fruit harvested from the same plants and
genotypes. When these instrumental measures were analyzed, there was a significant
year x genotype interaction (Table 2-2). Compared to 2011, the 2010 harvest was
delayed by approximately three weeks due to unusually cool spring temperatures that
year, which may have been exhibited as instrumentally measured differences, while the
relative yearly differences were not apparent to the trained panel. Additionally,
significant differences were found between replicated genotypes within a season using
these precise compression and bioyield force instruments (Table 2-2). These
differences may simply result from changes in management and environmental
conditions that can occur rapidly within a growing season. That these significant
differences are not evident in the panel evaluations may not be surprising. Ross et al.
(2009) found that an analytical value differing by 0.39 N·mm-1 using a similar
compression force instrument was required before a trained sensory panel could

47
determine a significant difference in cherry firmness. Given this potential lack of
congruence between panel evaluations and instrumental measures, we used a
correlative approach to align trained panel results with common instrumental
measurements.
In a 2008 study of 12 highbush blueberry cultivars, compression firmness, also
measured with a FirmTech 2, best correlated with juiciness (R = 0.48), bursting energy
(R = 0.44) and texture during chewing (R = 0.33), but was not associated with skin
toughness (Saftner et al., 2008). The reason for lower correlations observed by Saftner
et al. (2008) could be due to differences among panels or experimental design, but
probably due to the narrow range of cultivar textures evaluated, which did not include
several crisp cultivars as was surveyed in this study.
Many of the subjectively identified crisp blueberry cultivars and selections were
perceived as having a sweeter flavor, although the correlation between rated flavor and
SSC was low (R = 0.27). Saftner et al. (2008) found similarly low correlations between
perceived flavor traits and SSC in 12 highbush blueberry cultivars and cited Kader et al.
(2003), who reported that anthocyanins (known to be rich in blueberry fruit) could
interfere with SSC measures and inaccurately represent total sugars and therefore
perceived sweetness. Rosenfeld et al., (1999), however, found strong correlations
between SSC and perceived sweetness by trained panelists evaluating blueberries. In
the present study TTA and pH were inversely correlated (R = -0.80) but individually were
poorly correlated to perceived flavor. Because overall blueberry flavor was the trait
evaluated by panelists in this study, low correlations with SSC, TTA, SSC/TTA ratio, and
pH may be due to other flavor components besides sweetness and acidity.
48
Blueberries contain five woody placentae and up to 65 seeds, both of which vary
in size by genotype (Gough, 1994). It was speculated that perceived graininess would
be related to the amount of seed and size of placentae, but correlations between
perceived graininess and measured seed weight (R = 0.28) and placentae weight (R =
0.21) were low in 2011. Like pear, the mesocarp of blueberry contains stone cells known
to give fruit a grainy texture, so it is possible that perceived graininess depends more on
the number of stone cells than the amount of seed or placentae in the fruit tissue (Tao et
al., 2009). Stone cells, also called sclereids, are cells with thickened cell walls
containing lignin. Gough (1983) found sclereids just beneath the epidermal cell layer in
three highbush cultivars, and thought these structures might contribute to berry
firmness. Sclereids can occur singly, doubly, or in clusters, and bind neighboring
parenchyma cells and serve to strengthen this tissue (Allan-Wojtas et al., 2001; Fava et
al., 2006). The correlation between perceived graininess and compression firmness (R
= -0.05) in this study, however, was low. Future work correlating number of stones cells
with perceived graininess would be necessary to determine if these lignified cells
contribute to sensory perceptions of graininess in blueberry as they have been shown to
in pear.
The objective of this study was to develop descriptors for textural traits in
blueberry using a trained sensory panel, and survey a broad range of germplasm,
including crisp cultivars and selections, to detect differences in firmness and the extent
of correlation between trained panel ranking and instrumental measurements of
blueberry texture. We found three descriptors that align sensory evaluation of fruit
texture and firmness with instrumental measures that could be used for quantitative
measurements during breeding selection. Instrumental measures of compression and
49
bioyield forces were significantly different among cultivars and correlated with sensory
scores for bursting energy, flesh firmness, and skin toughness. The results of sensory
and instrumental measures support the distinction of crisp and non-crisp cultivars in
blueberry, and suggest that crispness is related to both higher compression and bioyield
force measurements and to sensory perception of increased bursting energy, flesh
firmness, and skin toughness.
The genetic and physiological basis of crispness in blueberry remains to be
discovered. Using compression and bioyield force measures developed in this study to
identify genotypes of crisp and non-crisp texture could be used to further investigate
differences in cellular structure and/or composition between these fruit types. These
instrumental measurements could also be used to phenotype seedling populations from
putative crisp parents in order to determine segregation patterns and the genetic basis
of crisp texture in blueberry.

50
Table 2-1. Parents of genotypes of southern highbush blueberry cultivars and advanced selections evaluated by sensory panel and instrumental analysis in 2010 and/or 2011.
Genotype Female Parent Male Parent
FL 01-15 FL 98-14 FL 98-50
FL 01-25 FL 97-27 FL 92-236
FL 02-22 Bluecrisp FL 97-139
FL 03-161 FL 96-138 Corindi 95-115
FL 05-252 Sweetcrisp O.P.
FL 05-256 FL 02-07 FL 98-325
FL 06-244 FL 02-37 FL 00-19
FL 06-245 FL 02-37 FL 00-19
FL 06-300 FL 03-98 FL 90-4
FL 06-552 Sweetcrisp FL 98-325
FL 06-553 Sweetcrisp FL 98-325
FL 06-556 Sweetcrisp FL 98-325
FL 06-558 Sweetcrisp FL 98-325
FL 06-561 FL 98-325 FL 03-61
FL 06-562 FL 98-325 FL 03-61
FL 06-571 Bluecrisp FL 02-22
FL 06-572 FL 98-325 FL 03-61
FL 06-80 Sweetcrisp FL 98-325
FL 06-88 FL 98-325 FL 03-61
FL 07-100 FL 04-60 Farthing
FL 07-160 FL 04-34 Sweetcrisp
FL 07-164 Sweetcrisp FL 00-180
FL 07-176 FL 03-49 Sweetcrisp
FL 07-23 FL 03-34 Sweetcrisp
FL 07-30 FL 98-325 FL 00-180
FL 07-31 FL 03-49 Sweetcrisp
FL 07-32 FL 03-49 Sweetcrisp
FL 07-38 FL 04-64 Sweetcrisp
FL 07-43 FL 04-21 FL 00-180
FL 07-449 Sweetcrisp FL 97-136
FL 07-452 Sweetcrisp Bluecrisp
FL 07-453 Sweetcrisp FL 98-325
FL 07-87 FL 03-10 FL 00-200
FL 98-325 FL 96-27 Windsor
Bobolink FL 00-28 FL 98-365
Emerald FL 91-69 NC1528
Farthing FL 92-27 Windsor
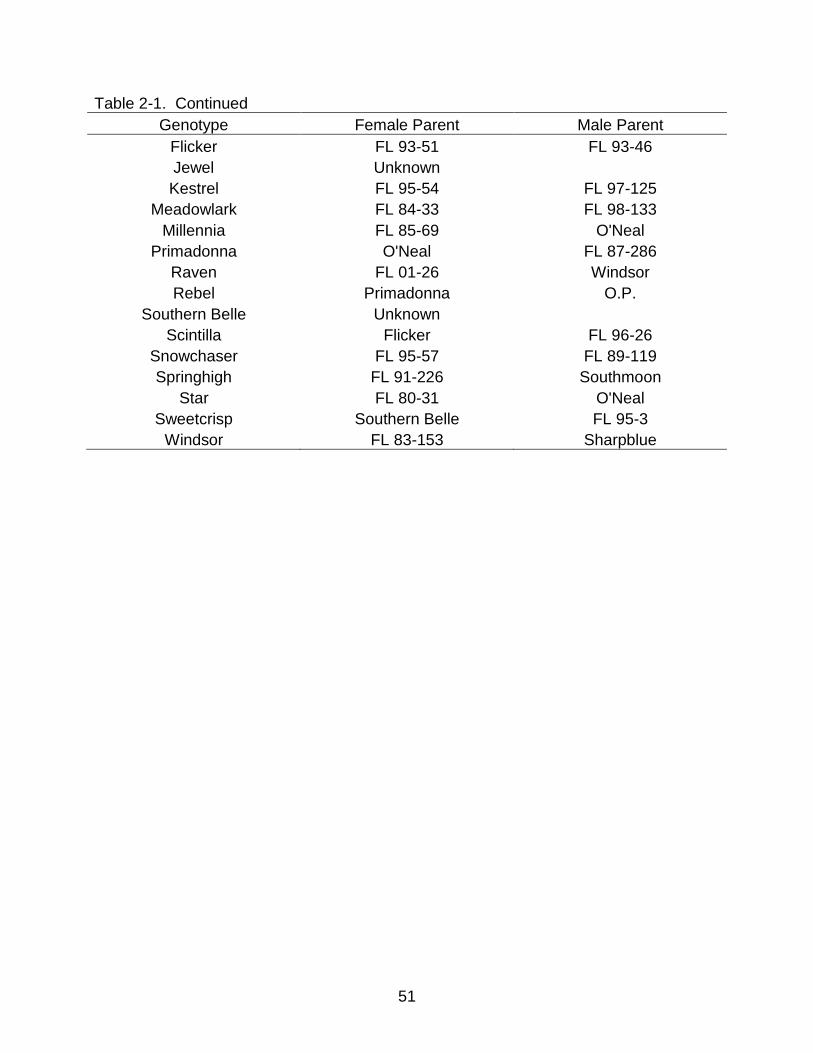
51
Table 2-1. Continued
Genotype Female Parent Male Parent
Flicker FL 93-51 FL 93-46
Jewel Unknown
Kestrel FL 95-54 FL 97-125
Meadowlark FL 84-33 FL 98-133
Millennia FL 85-69 O'Neal
Primadonna O'Neal FL 87-286
Raven FL 01-26 Windsor
Rebel Primadonna O.P.
Southern Belle Unknown
Scintilla Flicker FL 96-26
Snowchaser FL 95-57 FL 89-119
Springhigh FL 91-226 Southmoon
Star FL 80-31 O'Neal
Sweetcrisp Southern Belle FL 95-3
Windsor FL 83-153 Sharpblue

52
Table 2-2. Comparison of sensory and instrumental P-values of replicated southern highbush blueberry genotypes evaluated on two harvest dates in 2010, 2011, and between years. (P < 0.001***, P < 0.01**, P < 0.05*).
Sensory/Instrumental Measure
Genotype All Genotypes Year FL 98-325 Emerald Farthing Sweetcrisp Springhigh Star
2010
Bursting Energy 0.613 1.000 1.000 0.604 0.011 * 0.477
Firmness 0.794 0.289 0.479 0.771 0.108 0.368
Skin toughness 0.572 0.771 0.554 0.534 0.340 0.287
Juiciness 0.179 0.032 * 0.027 * 0.760 0.016 * 0.492
Mealiness 0.358 0.554 0.744 0.522 0.785 0.800
Compression Force 0.005 ** 0.001 *** 0.029 * 0.935 0.053 0.732
Bioyield Force - 0.943 0.002 ** 0.955 - ˂0.0001 ***
2011
Bursting Energy 0.566 0.764 0.588 0.909 0.051 0.634
Firmness 0.848 0.479 0.423 0.986 0.065 0.314
Skin toughness 1.000 0.411 0.361 0.639 0.280 0.631
Juiciness 0.809 1.000 0.474 0.356 0.736 0.830
Mealiness 0.683 0.929 0.684 0.200 0.215 0.563
Blueberry Flavor 0.253 0.928 0.308 0.100 0.861 0.132
Graininess 0.829 0.699 0.106 0.804 0.811 0.438
Compression Force 0.008 ** 0.011 * - - 0.098 0.210
Bioyield Force 0.491 ˂0.0001 *** 0.793 0.071 0.061 0.161
2010 x 2011
Bursting Energy 0.370
Firmness 0.645
Juiciness 0.979
Mealiness 0.723
Skin toughness 0.935
Compression Force ˂0.0001 ***

53
Table 2-3. Mean scores for sensory and instrumental measurements of southern highbush blueberry genotypes evaluated in 2010.
Sensory Instrumental
Genotype Bursting Energy
z Firmness
Skin Toughness Mealiness Juiciness
Compression Force
(N·mm-1
) Bioyield
Force (N)
FL 01-25 3.3 d-k 2.7 d-j 3.2 b-e 1.0 c 4.2 a-f 2.12 m-s 1.88 q-r
FL 05-252 6.2 ab 4.8 ab 4.1 a-e 0.9 c 3.8 a-f 2.50 g-l 2.97 f-j
FL 05-256 5.4 a-d 5.0 ab 5.0 ab 1.9 bc 3.1 a-f 2.46 g-l 2.95 f-k
FL 06-244 5.1 a-e 4.2 a-g 4.3 a-e 1.7 bc 3.1 b-f 2.53 f-l -
FL 06-300 2.8 f-k 2.6 e-j 3.2 b-e 1.5 bc 3.4 a-f 1.81 t-v -
FL 06-552 5.0 a-f 4.0 a-g 3.6 a-e 1.7 bc 3.4 a-f 2.63 c-h 3.99 bc
FL 06-553 5.0 a-f 4.9 ab 4.2 a-e 1.9 bc 3.5 a-f 2.55 d-j -
FL 06-556 4.6 a-h 4.2 a-g 4.5 a-e 2.5 a-c 2.9 c-f 2.85 a-d 2.95 f-k
FL 06-558 6.0 a-c 4.9 ab 4.9 a-c 1.2 bc 3.8 a-f 2.84 a-e -
FL 06-561 6.2 ab 4.7 a-c 4.3 a-e 1.1 c 5.3 ab 2.55 e-j -
FL 06-5621 4.5 a-i 3.2 b-j 3.3 b-e 1.5 bc 4.3 a-f 2.30 i-o 2.95 f-k
FL 06-5622 4.6 a-h 3.5 a-j 3.8 a-e 0.9 c 4.5 a-e 2.29 i-p 2.50 k-o
FL 06-5711 4.1 b-j 3.9 a-h 4.4 a-e 1.7 bc 3.9 a-f 2.51 g-l 3.76 c
FL 06-5712 4.3 b-j 3.7 a-i 3.7 a-e 1.8 bc 4.0 a-f 2.55 e-k 3.30 d-f
FL 06-572 5.0 a-f 4.9 ab 4.1 a-e 1.5 bc 3.9 a-f 2.82 a-f -
FL 06-80 6.3 ab 5.3 a 4.2 a-e 1.4 bc 4.0 a-f 3.03 a 3.56 c-e
FL 06-88 6.6 a 5.2 a 4.4 a-e 1.8 bc 2.7 d-f 2.93 ab 3.85 bc
FL 07-100 6.1 ab 4.7 a-d 4.4 a-e 1.0 c 4.9 a-c 2.97 a 4.26 b
FL 07-30 6.0 a-c 4.7 a-d 4.4 a-e 1.5 bc 4.6 a-e 2.64 b-h 3.68 cd
FL 07-449 6.8 a 4.8 a-c 5.4 a 1.2 bc 4.6 a-e 2.62 d-h 5.04 a
FL 98-3251 4.7 a-g 4.5 a-e 4.2 a-e 1.4 bc 3.0 c-f 2.27 j-p 2.74 h-m
FL 98-3252 4.8 a-g 4.3 a-f 4.3 a-e 1.7 bc 3.5 a-f 2.49 g-l -
Bobolink 1.7 k 1.7 j 3.4 b-e 4.2 a 2.1 f 1.58 v 1.74 r
Emerald1 3.5 d-k 3.0 b-j 3.8 a-e 2.5 a-c 3.6 a-f 2.11 m-s 2.37 l-p
Emerald2 3.5 d-k 3.4 a-j 3.9 a-e 2.8 a-c 2.8 c-f 2.35 h-n 2.38 l-p
Farthing1 4.2 b-j 3.4 a-j 4.3 a-e 1.6 bc 3.4 a-f 2.58 d-i 3.17 e-i
Farthing2 4.2 b-j 3.6 a-j 4.0 a-e 1.5 bc 4.2 a-f 2.36 h-m 2.72 i-n

54
Table 2-3. Continued.
Sensory Instrumental
Genotype Bursting Energy
z
Firmness
Skin Toughnes
s Mealines
s Juicines
s
Compression Force
(N·mm-1
) Bioyield
Force (N)
Flicker 3.2 d-k 3.1 b-j 3.9 a-e 1.9 bc 3.5 a-f 2.10 m-t 1.99 p-q
Jewel 2.4 h-k 2.0 h-j 2.8 de 1.4 bc 4.6 a-d 1.94 r-u 1.97 p-q
Kestrel 5.3 a-
d 3.5 a-j 4.0 a-e 1.2 c 4.5 a-e 1.95 q-u 3.24 d-g
Meadowlark 3.7 c-k 2.8 c-j 3.7 a-e 1.7 bc 4.0 a-f 2.28 j-p 2.79 g-l
Millennia 2.3 i-k 2.5 f-j 3.1 b-e 3.4 ab 2.1 f 2.05 n-t 2.12 o-r
Primadonna 2.6 g-k 2.4 f-j 2.5 e 2.2 a-c 3.8 a-f 2.03 o-t 1.91 q-r
Raven 4.7 a-
g 4.1 a-g 4.9 a-c 1.9 bc 4.1 a-f 2.92 a-c 3.20 e-h
Rebel 3.1 e-k 2.5 f-j 3.0 c-e 2.2 a-c 2.4 ef 2.25 k-q 1.98 p-q
Scintilla 2.8 f-k 2.7 c-j 3.8 a-e 1.3 bc 4.5 a-e 2.40 h-m 2.66 j-n Snowchaser 2.1 jk 1.9 ij 2.7 e 1.7 bc 3.0 c-f 1.72 uv 1.91 q-r
Springhigh1 3.4 d-k 2.8 c-j 3.3 b-e 1.1 c 4.1 a-f 1.99 p-u 2.29 m-
q
Springhigh2 2.4 h-k 2.3 g-j 2.7 e 1.0 c 5.3 a 2.12 m-s -
Star1 2.7 f-k 2.9 b-j 3.4 a-e 1.4 bc 3.6 a-f 2.26 j-p 2.67 j-n
Star2 2.8 e-k 2.5 f-j 2.9 c-e 1.4 bc 4.2 a-f 2.24 l-r 2.19 o-r
Sweetcrisp1 6.0 a-c 4.9 ab 4.8 a-d 1.3 bc 4.1 a-f 2.75 a-g 3.93 bc
Sweetcrisp2 6.2 ab 5.0 ab 4.8 a-c 1.2 c 4.0 a-f 2.76 a-g 3.93 bc
Windsor 2.3 i-k 2.7 c-j 2.9 c-e 1.5 bc 3.6 a-f 1.93 s-u 2322.2
8 n-q zDifferent letters within a column indicate significant differences between genotypes using Tukey’s test (P ≤ 0.05).

55
Table 2-4. Mean scores for sensory and instrumental measurements of southern highbush blueberry genotypes evaluated in 2011.
Sensory Instrumental
Genotype Bursting Energy
z Firmness
Skin Toughness Mealiness Juiciness
Compression Force
(N·mm-1
)
Bioyield Force
(N)
FL 01-15 4.1 g-n 2.8 f-i 3.0 de 1.6 b-d 4.4 a-c 2.50 c-j 1.26 s-A
FL 01-25 3.3 j-n 2.5 f-i 3.8 a-e 1.6 b-d 4.6 ab 2.08 m-s 1.20 y-B
FL 02-22 3.4 j-n 2.5 f-i 3.6 a-e 2.5 a-d 4.1 a-c 2.25 h-p 1.25 t-A
FL 03-161 4.5 f-l 3.1 e-i 3.3 c-e 2.9 a-d 3.8 a-c 2.19 i-q 1.36 r-z
FL 05-252 6.6 a-g 5.1 a-f 4.9 a-e 2.0 a-d 5.1 a 2.38 e-m 1.50 m-s
FL 05-256 6.9 a-f 4.9 a-g 5.6 a-d 2.5 a-d 4.1 a-c 2.27 g-p 1.48 n-u
FL 06-244 5.8 a-j 5.1 a-g 5.0 a-e 2.1 a-d 3.6 a-c 2.53 c-h 1.78 g-l
FL 06-245 2.5 k-n 2.4 f-i 3.3 a-e 2.8 a-d 2.9 a-c 1.81 st 1.03 AB
FL 06-552 7.5 a-c 6.3 a-c 3.9 a-e 1.4 b-d 4.6 ab 2.89 ab 1.95 d-i
FL 06-553 6.5 a-h 5.9 a-e 4.2 a-e 1.6 b-d 3.8 a-c 2.54 c-h 1.54 l-r
FL 06-556 6.6 a-g 5.4 a-f 3.7 a-e 2.4 a-d 2.9 a-c 2.88 ab 1.87 e-j
FL 06-558 7.4 a-d 6.5 a 6.0 ab 2.4 a-d 3.4 a-c 2.40 d-m 1.71 j-n
FL 06-561 7.3 a-d 6.1 a-c 5.4 a-e 0.8 d 4.8 ab 2.51 c-i 1.70 j-o
FL 06-562 6.5 a-h 4.6 a-g 4.2 a-e 1.4 b-d 5.6 a 2.24 h-p 1.42 p-w
FL 06-571 6.1 a-i 3.9 a-i 4.2 a-e 1.3 b-d 4.6 a-c 2.34 f-n 1.71 i-n
FL 06-572 7.8 ab 6.5 a 5.6 a-d 1.6 b-d 4.1 a-c 2.67 a-e 2.01 d-g
FL 06-80 7.1 a-e 6.0 a-d 4.0 a-e 1.6 b-d 4.3 a-c 2.62 a-f 1.80 f-k
FL 06-88 7.4 a-d 5.1 a-f 5.0 a-e 3.0 a-d 4.1 a-c 2.90 a 1.78 g-l
FL 07-100 7.3 a-d 5.8 a-e 6.1 ab 1.3 b-d 4.3 a-c - - 2.18 b-d
FL 07-160 5.8 b-j 4.5 a-g 4.4 a-e 1.3 b-d 4.5 a-c 2.27 g-p 1.85 f-k
FL 07-164 6.4 a-h 4.8 a-g 5.8 a-d 1.8 b-d 4.6 ab 2.06 n-s 1.99 d-h
FL 07-176 6.4 a-h 5.1 a-f 4.6 a-e 1.8 b-d 3.9 a-c 2.49 d-j 1.76 h-l
FL 07-23 5.8 b-j 4.8 a-g 4.3 a-e 1.9 a-d 4.5 a-c 2.42 d-l 1.49 m-t
FL 07-30 7.3 a-d 5.0 a-g 5.5 a-e 1.0 c-d 4.6 a-c 2.81 a-c 2.10 b-e
FL 07-31 3.9 h-n 3.6 c-i 4.3 a-e 2.5 a-d 4.5 a-c 2.03 n-s 1.41 q-y
FL 07-32 3.8 i-n 2.6 f-i 4.5 a-e 4.0 ab 1.9 c 2.30 g-o 1.73 i-m
FL 07-38 6.3 a-h 4.5 a-g 4.3 a-e 1.0 c-d 4.9 ab 2.12 l-s 1.61 k-q
FL 07-43 6.6 a-g 4.7 a-g 5.5 a-e 1.0 c-d 5.0 ab - - 1.99 d-h

56
Table 2-4. Continued.
Sensory Instrumental
Genotype Bursting Energy
z Firmness
Skin Toughness Mealiness Juiciness
Compression Force
(N·mm-1
)
Bioyield Force
(N)
FL 07-449 8.3 a 6.1 a-c 5.9 a-c 1.0 c-d 5.1 a 2.49 d-k 2.48 a
FL 07-452 7.3 a-d 6.0 a-d 5.3 a-e 3.4 a-d 3.3 a-c 2.71 a-d 2.32 ab
FL 07-453 6.9 a-f 5.9 a-e 5.5 a-e 2.5 a-d 4.5 a-c 2.58 b-g 1.99 d-h
FL 07-87 4.1 g-n 3.3 e-i 5.8 a-d 1.1 b-d 4.6 a-c - - 2.04 c-f
FL 98-3251 6.4 a-h 5.0 a-g 5.0 a-e 1.9 a-d 3.9 a-c 2.19 j-r 1.65 j-p
FL 98-3252 6.1 a-i 4.9 a-g 5.0 a-e 2.1 a-d 4.1 a-c 2.32 f-n 1.62 k-q
Bobolink 3.3 j-n 2.7 f-i 4.1 a-e 3.5 a-d 3.3 a-c - - 1.22 v-B
Emerald1 4.3 g-m 3.5 d-i 4.4 a-e 2.9 a-d 3.1 a-c 1.96 p-t 1.44 p-w
Emerald2 4.4 g-l 3.9 b-i 4.1 a-e 2.9 a-d 3.1 a-c 2.10 m-s 1.22 v-B
Farthing1 4.7 e-l 4.1 a-h 4.6 a-e 1.1 c-d 5.3 a 2.17 k-r 1.47 n-u
Farthing2 5.1 c-k 3.9 a-i 5.3 a-e 1.2 b-d 5.5 a - - 1.46 o-v
Jewel 2.4 l-n 1.6 h-i 3.1 de 1.3 b-d 5.1 a 2.17 l-r 1.17 y-B
Meadowlark 4.9 d-l 3.5 c-i 4.4 a-e 1.5 b-d 4.4 a-c - - 1.81 f-k
Millennia 3.9 h-n 3.0 f-i 4.0 a-e 3.8 a-c 3.3 a-c 2.16 l-r 1.23 u-B
Primadonna 4.3 g-m 2.5 f-i 4.6 a-e 2.0 a-d 3.9 a-c 1.87 r-t 1.17 y-B
Raven 6.1 a-i 5.4 a-f 6.1 a 2.9 a-d 3.9 a-c 2.93 a 1.65 j-p
Rebel 3.5 i-n 2.6 f-i 3.9 a-e 4.9 a 2.4 bc 2.30 g-o 1.21 w-B
Southern Belle 6.0 a-i 4.3 a-g 5.0 a-e 3.3 a-d 3.6 a-c - - -
Scintilla 2.9 k-n 2.8 f-i 4.0 a-e 2.0 a-d 4.8 ab 2.21 i-q 1.47 n-u
Snowchaser 1.6 n 1.5 i 2.8 de 2.0 a-d 4.6 ab 1.71 t 1.00 B
Springhigh1 1.8 mn 1.5 i 3.3 b-e 2.3 a-d 5.0 ab 1.90 q-t 1.06 AB
Springhigh2 2.5 k-n 2.1 g-i 3.8 a-e 1.8 a-d 4.5 a-c 2.04 n-s 1.15 z-B
Star1 3.1 j-n 2.5 f-i 3.3 a-e 2.2 a-d 3.7 a-c 2.10 m-s 1.07 AB
Star2 3.5 i-n 2.9 f-i 3.6 a-e 2.3 a-d 3.7 a-c 2.18 k-r 1.13 z-B
Sweetcrisp1 7.2 a-e 6.3 a-c 4.8 a-e 0.8 c-d 5.2 a - - 2.10 b-e
Sweetcrisp2 7.4 a-d 6.3 ab 5.0 a-e 1.3 b-d 4.8 ab 2.57 c-g 2.26 a-c
Windsor 4.0 g-n 3.5 d-i 4.5 a-e 1.6 b-d 4.3 a-c 2.01 o-t 1.27 s-A zDifferent letters within a column indicate significant differences between genotypes using Tukey’s test (P ≤ 0.05).
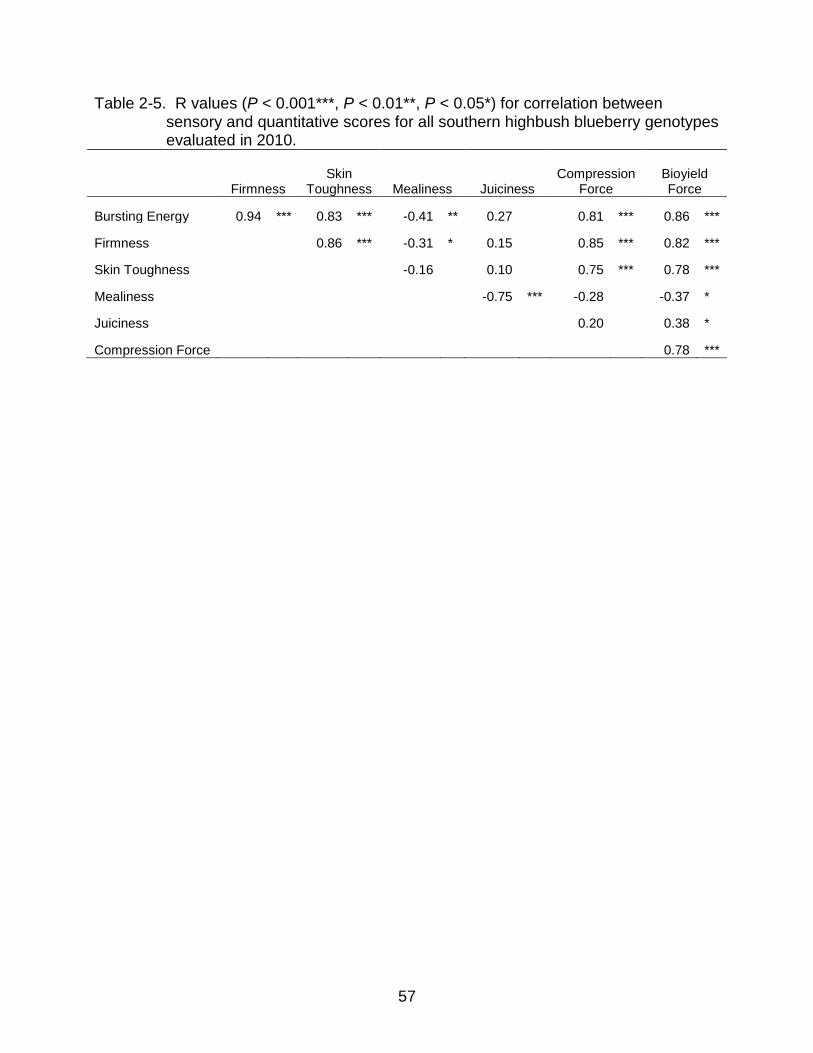
57
Table 2-5. R values (P < 0.001***, P < 0.01**, P < 0.05*) for correlation between sensory and quantitative scores for all southern highbush blueberry genotypes evaluated in 2010.
Firmness Skin
Toughness Mealiness Juiciness Compression
Force Bioyield Force
Bursting Energy 0.94 *** 0.83 *** -0.41 ** 0.27 0.81 *** 0.86 ***
Firmness 0.86 *** -0.31 * 0.15 0.85 *** 0.82 ***
Skin Toughness -0.16 0.10 0.75 *** 0.78 ***
Mealiness -0.75 *** -0.28 -0.37 *
Juiciness 0.20 0.38 *
Compression Force 0.78 ***

58
Table 2-6. R values (P < 0.001***, P < 0.01**, P < 0.05*) for correlation between sensory and instrumental scores for all southern highbush blueberry genotypes evaluated in 2011.
Firmness
Skin Toughnes
s Mealiness Juiciness Graininess Blueberry
Flavor Compressio
n Force Bioyield Force
Bursting Energy 0.96 *** 0.70 *** -0.32 * 0.18 0.24 0.01 0.75 *** 0.82
***
Firmness 0.68 *** -0.30 * 0.14 0.26 -0.03 0.74 *** 0.80 ***
Skin Toughness -0.19 0.13 0.33 * -0.01 0.46 ** 0.72 ***
Mealiness -
0.80 *** 0.19 -0.32 * -0.07
-0.35 **
Juiciness -0.35 ** 0.36
** -0.03 0.18
Compression Force 0.71
***

59
Biplot (axes F1 and F2: 94.59 %)
Bobolink
Snowchaser
Millennia
Windsor
Jewel
Primadonna
Scintilla
Star
Springhigh
FL 06-300
Flicker
Rebel
FL 01-25
Emerald
Meadowlark
FarthingFL 06-571
FL 06-556
Raven
FL 06-562
FL 98-325
FL 05-256
FL 06-553
FL 06-572FL 06-552
Kestrel
FL 06-244
Sweetcrisp
FL 05-252
FL 06-558
FL 07-30
FL 06-80
FL 07-100
FL 06-561
FL 06-88
FL 07-449
Bursting
SkinFirmness
Juiciness
Mealiness-3
-1
1
3
-10 -6 -2 2 6 10
F1 (79.56 %)
F2
(1
5.0
3 %
)
Figure 2-1. Principal component analysis (PCA) biplot of sensory evaluation of 36 southern highbush blueberry cultivars
and hybrids harvested from 5-24 May, 2010. Genotypes subjectively evaluated as having crisp texture are in italics.
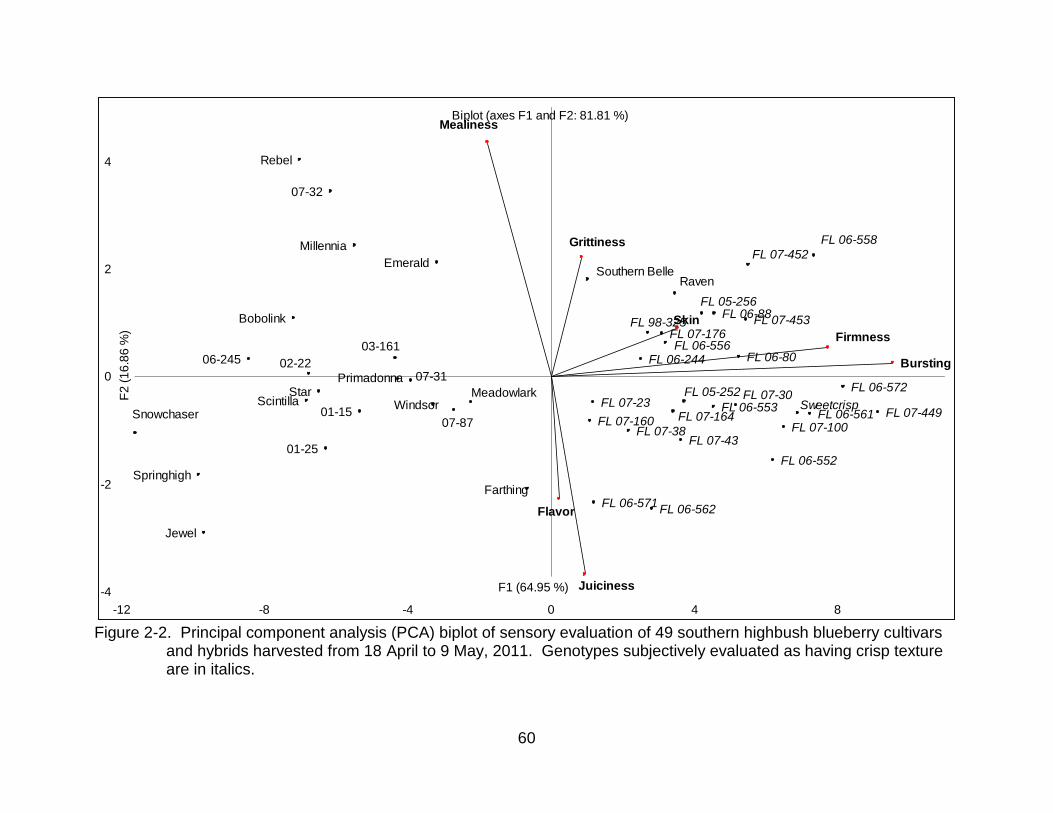
60
Biplot (axes F1 and F2: 81.81 %)
01-15
01-25
02-22
03-161
FL 05-252
FL 05-256
FL 06-24406-245
FL 06-552
FL 06-553
FL 06-556
FL 06-558
FL 06-561
FL 06-562FL 06-571
FL 06-572
FL 06-80
FL 06-88
FL 07-100FL 07-160 FL 07-164
FL 07-176
FL 07-23FL 07-30
07-31
07-32
FL 07-38FL 07-43
FL 07-449
FL 07-452
FL 07-453
07-87
FL 98-325Bobolink
Emerald
Farthing
Jewel
Meadowlark
Millennia
Primadonna
Raven
Rebel
ScintillaSnowchaser
Southern Belle
Springhigh
StarSweetcrispWindsor
Bursting
Firmness
Skin
Grittiness
Juiciness
Mealiness
Flavor
-4
-2
0
2
4
-12 -8 -4 0 4 8
F1 (64.95 %)
F2
(1
6.8
6 %
)
Figure 2-2. Principal component analysis (PCA) biplot of sensory evaluation of 49 southern highbush blueberry cultivars
and hybrids harvested from 18 April to 9 May, 2011. Genotypes subjectively evaluated as having crisp texture are in italics.

61
CHAPTER 3 EFFECTS OF PREHARVEST APPLICATIONS OF 1-METHYLCYCLOPROPENE ON
FRUIT FIRMNESS IN SOUTHERN HIGHBUSH BLUEBERRY
Literature Review
The University of Florida (UF) blueberry breeding program has been developing
southern highbush blueberry (Vaccinium corymbosum L. hybrids) cultivars for over 60
years. During this period, fruit firmness has been a primary selection trait, and a novel
texture most often described as “crisp” has recently been identified. Two releases from
the program, ‘Bluecrisp’, and ‘Sweetcrisp’, possess this crisp fruit texture, and many
advanced seedling selections have been identified (Okie, 1999; Olmstead, 2011). This
unique texture characteristic is not only promising for harvesting purposes, but also for
improving berry quality and storage potential that would keep Florida blueberries
competitive with other markets. The mechanism responsible for crisp texture remains
unclear.
Ripening is a major event in fruit development affecting both texture and
firmness. Fruits are typically divided into two categories based on their mode of
ripening. Climacteric fruits exhibit a peak in respiration and ethylene production that
correspond with phenotypic changes in color, aroma, texture, flavor, and/or other
phenomena associated with ripeness (Lelievre et al., 1997, Rhodes, 1970), while non-
climacteric fruits do not exhibit one or all of these characteristics. Blueberry has been
described as a climacteric fruit due to observations of a respiratory climacteric and peak
in endogenous ethylene production at the transition from the mature green to green-pink
stage of ripening (Ismail and Kender, 1969; Windus et al., 1976; Suzuki et al., 1997).
This designation implicates ethylene as a potential factor affecting firmness and
softening in blueberry. Crisp and soft-textured cultivars have been identified in other

62
climacteric fruits, and in peach (Prunus persica L.), ethylene has been found to be a
major factor in the variability of its fruit texture (Ghiani et al., 2011). The degree to which
ethylene is involved in the variability among fruit textures in blueberry and the overall
ripening process of blueberry, however, remains unclear.
Ethylene sensitive (climacteric) fruits are expected to show positive and negative
ripening responses to exogenous applications of ethylene and ethylene inhibitors such
as silver thiosulphate (STS), and 1-methylcyclopropene (1-MCP). Ripening responses
have been reported in blueberry fruits treated with ethylene. Preharvest application of
ethephon (2-chloroethylphosphonic acid), an ethylene generating compound, advances
the onset of ripening in blueberry as evidenced by a decrease in titratable acidity (TA)
and an increase in total soluble solids (TSS), anthocyanins, and fruit softening (Ban et
al., 2007; Eck, 1970; Forsyth et al., 1977; Warren et al., 1973). Blueberries harvested at
the green and green-pink stage demonstrated increased respiration when treated with
ethylene and acetaldehyde (Janes, 1978). The use of 1-MCP as a suppressor of
ethylene responses in the ripening of both climacteric and traditionally non-climacteric
fruit was summarized by Huber, (2008). Climacteric fruit treated with 1-MCP have
demonstrated ripening responses such as altered ethylene production and respiration,
delayed or suppressed softening, altered or delayed volatile emissions, and/or pigment
change (Huber, 2008). Non-climacteric fruits, such as grape (Vitis vinifera L.) and
strawberry (Fragaria x ananassa Duchesne) have also shown delayed or decreased
ripening in response to ethylene inhibitors (Tian et al., 2000; Jiang et al., 2001; Chervin
et al., 2004; Bellincontro et al., 2006; Ianetta et al., 2006) Preharvest application of 1-
MCP to grape resulted in decreased berry diameter, increased acidity, and decreased
anthocyanin accumulation (Chervin et al., 2004). Postharvest applications of 1-MCP

63
also resulted in an initial reduction of ethylene production and delayed anthocyanin
breakdown in grape (Bellincontro et al., 2006). Postharvest applications of 1-MCP to
strawberry decreased ethylene production, fruit softening and anthocyanin accumulation
(Jiang et al., 2001).
The response of blueberries to postharvest applications of 1-MCP has been
mixed. DeLong et al., (2003) observed no differences in the percent marketable fruit
among two highbush blueberry cultivars treated at postharvest timing with 1-MCP, and
found no effect on the shelf life of either cultivar treated. MacLean and NeSmith (2011)
evaluated ethylene production, firmness, TSS, and TA in three rabbiteye blueberry
(Vaccinium virgatum Aiton) cultivars treated with 1-MCP after harvest and found
increased ethylene production in all three cultivars, decreased firmness in one cultivar,
but no effect on TSS or TA content. There are no published reports on the preharvest
application of 1-MCP to blueberry fruit. The objective of this study was to determine if
the preharvest application of 1-MCP to pre-climacteric blueberry fruit affects fruit
firmness in two southern highbush cultivars having soft and crisp fruit texture.
Materials and Methods
Two southern highbush blueberry cultivars with soft and crisp fruit texture were
selected from Straughn Farms, Inc. in Windsor, FL for use in this study. ‘Star’ and
‘Sweetcrisp’ were developed at UF and have been evaluated by a trained sensory panel
that identified ‘Sweetcrisp’ as having more firm, crisp fruit than ‘Star’ (see Chapter 2).
Plants were established in 2009 and spaced at 0.76 m in rows 3 m apart. Any fruit that
had initiated ripening (as determined by color change) were removed from the plants
prior to the first treatment application.
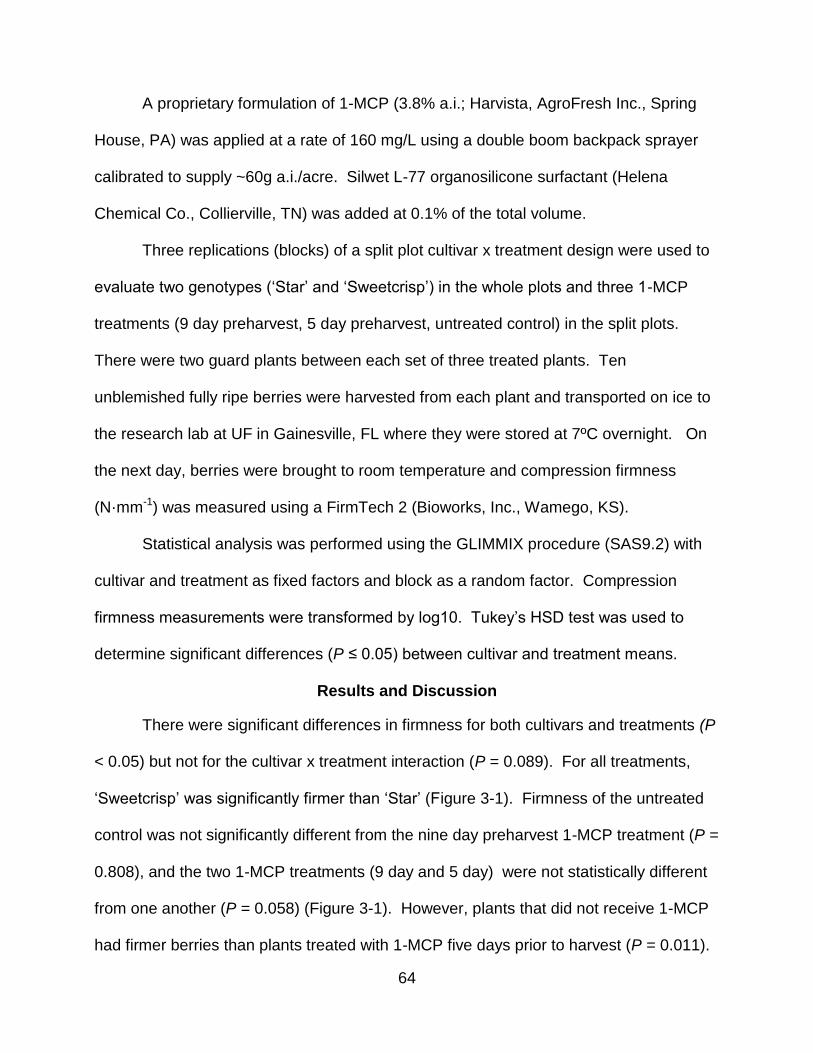
64
A proprietary formulation of 1-MCP (3.8% a.i.; Harvista, AgroFresh Inc., Spring
House, PA) was applied at a rate of 160 mg/L using a double boom backpack sprayer
calibrated to supply ~60g a.i./acre. Silwet L-77 organosilicone surfactant (Helena
Chemical Co., Collierville, TN) was added at 0.1% of the total volume.
Three replications (blocks) of a split plot cultivar x treatment design were used to
evaluate two genotypes (‘Star’ and ‘Sweetcrisp’) in the whole plots and three 1-MCP
treatments (9 day preharvest, 5 day preharvest, untreated control) in the split plots.
There were two guard plants between each set of three treated plants. Ten
unblemished fully ripe berries were harvested from each plant and transported on ice to
the research lab at UF in Gainesville, FL where they were stored at 7ºC overnight. On
the next day, berries were brought to room temperature and compression firmness
(N·mm-1) was measured using a FirmTech 2 (Bioworks, Inc., Wamego, KS).
Statistical analysis was performed using the GLIMMIX procedure (SAS9.2) with
cultivar and treatment as fixed factors and block as a random factor. Compression
firmness measurements were transformed by log10. Tukey’s HSD test was used to
determine significant differences (P ≤ 0.05) between cultivar and treatment means.
Results and Discussion
There were significant differences in firmness for both cultivars and treatments (P
< 0.05) but not for the cultivar x treatment interaction (P = 0.089). For all treatments,
‘Sweetcrisp’ was significantly firmer than ‘Star’ (Figure 3-1). Firmness of the untreated
control was not significantly different from the nine day preharvest 1-MCP treatment (P =
0.808), and the two 1-MCP treatments (9 day and 5 day) were not statistically different
from one another (P = 0.058) (Figure 3-1). However, plants that did not receive 1-MCP
had firmer berries than plants treated with 1-MCP five days prior to harvest (P = 0.011).

65
The results of this study suggest that 1-MCP application five days prior to harvest
may decrease fruit firmness of southern highbush blueberries at the time of harvest.
MacLean and NeSmith (2011) also observed decreased firmness in rabbiteye blueberry
fruits treated with a postharvest application of 1-MCP. Preharvest 1-MCP treatments
were applied to the whole plant, whereas postharvest treatments were only applied to
the detached fruits. Pre and postharvest treatments were also applied to the fruits at
different stages of maturity and may therefore have had different effects on fruit
softening. When postharvest applications of 1-MCP were compared with preharvest
applications of 1-MCP in apple (Malus domestica Borkh), preharvest treatments applied
closer to the harvest date demonstrated responses more similar to those of postharvest
treatments than preharvest treatments applied several days or weeks prior to harvest
(Elfving et al., 2007; McArtney et al., 2009). In this study, plants treated with 1-MCP
nine days prior to harvest did not differ in berry firmness from the untreated control, but
plants treated five days prior to harvest showed decreased firmness. McArtney et al.
(2009) suggested that fruits remaining attached to the plant may be capable of creating
new ethylene receptors uninhibited by previous 1-MCP treatments that would restore
ethylene response. It remains unclear, however, why ethylene inhibition would result in
decreased firmness. Regardless, it does not appear that variability in ethylene response
plays a central role in crisp blueberry texture, as neither preharvest treatment of ‘Star’
with 1-MCP resulted in a significant increase in firmness. Rather, it may be anatomical
differences that lead to crisp texture in certain blueberry genotypes.

66
0.00
0.50
1.00
1.50
2.00
2.50
0 5 9Time of Harvest (days after 1-MCP treatment)
Fir
mn
es
s (
N·m
m-1
)Sweetcrisp Star
Figure 3-1. Average fruit firmness and standard error of ‘Sweetcrisp’ and ‘Star’ blueberry
fruit harvested after untreated control (0 day), 5 day, and 9 day preharvest treatments of 1-MCP.

67
CHAPTER 4 STONE CELL FREQUENCY AND CELL SIZE VARIATION OF CRISP AND SOFT
TEXTURED FRUITS FROM NINE SOUTHERN HIGHBUSH BLUEBERRY CULTIVARS
Literature Review
Several fresh market fruit species have textures that range from soft to crisp,
including apple (Malus domestica Borkh.), grape (Vitis vinifera L.), peach (Prunus
persica L.), and sweet cherry (Prunus avium L.) (Tong et al., 1999; Sato et al., 2006;
Ghiani et al., 2001; Batisse et al., 1996). More recently, two southern highbush
blueberry cultivars (Vaccinium corymbosum L. hybrids) considered to have a unique
crisp texture were released by the University of Florida (UF) in 1997 (‘Bluecrisp’) and
2005 (‘Sweetcrisp’) (Okie, 1999; Olmstead, 2011). Previous reports have described a
similar fruit texture in the blueberry cultivars ‘Dolores’ and ‘Hortblue Poppins’ (Clark and
Finn, 2010; Scalzo et al., 2009), and many current selections in the UF blueberry
breeding program are also considered to have a crisp phenotype similar to ‘Bluecrisp’
and ‘Sweetcrisp’ (see Chapter 2). Berries with this crisp texture are of particular interest
due to their enhanced eating quality, prolonged postharvest life, and potential value for
mechanical harvesting for fresh marketed blueberries (Padley, 2005; Mehra et al., 2013,
and Takeda et al., 2013).
Several cellular components contribute to overall fruit texture, including cell type,
size, shape, packing, cell to cell adhesion, extracellular space, and cell wall thickness
(Harker et al., 1997). Parenchyma cells are the most numerous type of cells in the flesh
of blueberry fruit and have thin, non-lignified cell walls and a large, mostly water-filled
vacuole (Harker et al., 1997). The epidermis is composed of specialized parenchyma
cells that have thickened primary cell walls and are covered by a cuticle consisting of
cutin and associated waxes (Esau, 1977). Collenchyma cells and phloem elements

68
have thickened primary cell walls that provide tensile strength to surrounding tissues.
Xylem and sclerenchyma cells such as fibers and sclereids have thick and lignified
secondary cell walls that are dead at maturity and give support (Harker et al., 1997).
Cell size varies with different cell types during ripening. Fruit development in
blueberry follows a double-sigmoid growth pattern in which the pericarp initially
increases in volume (stage I), then the embryo develops while pericarp growth slows
down (stage II), and ripening occurs in conjunction with a final expansion in pericarp size
(stage III) (Godoy et al., 2008). Shortly after anthesis, mesocarp cells stop dividing and
increase only in size as the fruit continues to develop and enlarge (Darnell et al., 1992).
Cell size is much smaller in the epidermal and hypodermal layers that together form the
epicarp, where cell division occurs over a longer period of time during fruit expansion
(Harker et al., 1997). A study by Mann et al., (2005) compared instrumental and
sensory measurements to cell number and size in apple, and concluded that fruits with
fewer cells per unit area in the apple cortex (mesocarp) were crisper than fruits with
more cells per unit area. Smaller sized cells have an increased surface area and higher
proportion of cell wall material, which has been suggested to translate into greater
firmness and tissue strength, but Mann et al. (2005) suggests that larger sized cells
contribute to crispness in apple, which may be due to an increased likelihood for larger
cells to burst rather than separate from neighboring cells as is believed to occur in crisp-
textured fruits (Harker et al., 1997).
The amount of contact and/or space between neighboring cells is influenced by
the shape and packing of cells (Harker et al., 1997). Batisse et al. (1996) observed that
crisp-textured sweet cherries have more large intercellular spaces than soft-textured
sweet cherries. The degree to which adjacent cells separate during chewing also has
69
an effect on its perceived texture. In the process of chewing, force is applied to the fruit
tissue until it fractures, which can occur by cell separation – as is the case with soft fruits
such as banana (Musa spp.) – or by individual cell rupture in crisp fruits such as apple
and watermelon (Citrullus lanatus Thunb.) (Harker et al., 1997). Cell wall strength and
cell-to-cell adhesion also contribute to whether cells separate or rupture (Harker et al.,
1997).
It is important to consider blueberry fruit anatomy when searching for the basis of
crisp fruit texture. Blueberry fruits develop from an inferior ovary. The epidermis of the
berry, having originated from the flower’s calyx, is covered by a cuticle and associated
waxes that give the otherwise dark pigmented fruit its blue color (Gough, 1994).
Together, the epidermis and hypodermal layers contain pigmentation from anthocyanins
and form the epicarp, commonly referred to as the peel or skin (Gough, 1994). The
endocarp is composed of five carpels with 10 locules and five highly lignified placentae
which are attached to approximately 50 seeds (Gough, 1994). The mesocarp is located
between these layers and contains mostly parenchyma cells, along with rings of
vascular bundles and occasional sclerified “stone cells” that can be found approximately
460 to 920 µm below the epidermis (Gough, 1983). These lignified cells with thick
secondary cell walls can occur singly, doubly, or in clusters, and bind neighboring
parenchyma cells that serve to strengthen the flesh tissue (Gough, 1983; Allan-Wojtas
et al., 2001; Fava et al., 2006). Potential increased firmness just beneath the epidermal
layer where initial rupture of the berry fruit takes place suggests that stone cells may
have a role in the crispness detected in some southern highbush blueberry cultivars.
Results of a trained sensory panel that evaluated texture of several genotypes of UF
blueberry germplasm ranging from soft to crisp also suggested that the crisp texture
70
may be related to the epidermal region (see Chapter 2). Genotypes receiving high
sensory scores for crisp texture by the panel were often also rated for having a high
level of skin toughness. Together these findings suggest that crisp texture is likely
associated with differences in or near the epidermal layer of the berry. The objective of
this study was to perform a histological analysis of cell type, size, and structure of the
outermost cell layers of soft and crisp-textured fruits from nine southern highbush
blueberry genotypes.
Methods
Plant Material
Fruits were harvested from nine southern highbush blueberry genotypes grown
on commercial farms in Windsor and Waldo, FL. Genotypes were selected based on
results from sensory and instrumental measures of soft and crisp fruit texture (see
Chapter 2). Four crisp-textured genotypes (FL 06-244, FL 98-325, FL 07-100, and
‘Sweetcrisp’) and four soft-textured genotypes (FL 06-245, ‘Windsor’, Springhigh’, and
‘Star’) were harvested at the mature green and ripe stages of development as described
by Shutak et al. (1980). ‘Raven’ was also included in the study as it has very firm
texture, but had not been subjectively evaluated as crisp prior to trained panel
evaluations. Genotypes of unique genetic background were preferentially selected;
however, one full sib pair (FL 06-244 and FL 06-245) was evaluated to compare cellular
structure of a crisp and non-crisp genotype from the same genetic background.
Microscopy
A 0.23 mm width steel razor was used to remove the calyx and stem end of each
fruit before being immersed and stored in FAA solution (10 formaldehyde : 5 acetic acid

71
: 35 alcohol). Fruits were stored in fixative for 1-3 months and the fixative was
refreshed several times during this period.
Radial sections (approximately 3 mm width) were taken using a 0.23 mm width
steel razor and sections were dehydrated in a graded ethanol series (30, 40, 50, 60, 70,
80, 90, 95, and 100% for 45 min.) followed by paraffin infiltration and embedding using
tert-butyl alcohol as an intermediate solvent (Ruzin, 1999).
Sections of 12-14 µm were obtained using a 0.25 mm steel microtome blade on a
rotary microtome and were mounted on glass slides. The mounted sections were de-
parafinized with Histoclear II, stained with Safranin O and Aniline Blue, and were
permanently mounted with a cover glass using DePex Mounting Medium.
A Leitz Ortholux light microscope (Leica Microsystems, Wetzlar, Germany) was
used to visualize samples using the 10x and 40x objectives. Images were captured with
a Moticam 1000 1.3 M pixel camera (Motic, Inc., Hong Kong, China) and visualized
using Motic Images Plus 2.0 ML software.
Image Analysis
The total number of stone cells within 1,200 µm of the epidermis was counted in a
whole section of four berries from each maturity stage and genotype. Stone cells were
identified as cells with a thick cell wall that was darkly stained with Safranin O. Cell size
was measured using the ruler function in Adobe Photoshop CS5 (Adobe Systems, Inc.,
San Jose, CA). Cell height and width were used to calculate the cell area of 40 cells in
the outer four cell layers of mature green fruits from each genotype and 40 cells in the
outer three cell layers of ripe fruits from each genotype.

72
Statistical Analysis
Data was analyzed for ANOVA and means separation with SAS 9.2 (SAS
Institute, Inc., Cary, NC) using Proc GLM and Tukey’s HSD test (P ≤ 0.05).
Results and Discussion
There was a visible difference between genotypes in the number of cell layers
that formed the epicarp of mature green and ripe fruits (Figure 4-1, 4-2, 4-3, 4-4). ‘Star’
was unique in having a very thin peel that appeared to consist only of the epidermal cell
layer. The other eight genotypes had an epicarp consisting of the epidermis and one or
two hypodermal cell layers. In other textural studies involving the separation of the peel
from the berry flesh, it was noted that ‘Star’ was more difficult to peel than the other
genotypes, which is consistent with the histological findings that its epicarp contains
fewer cell layers.
Cell shape appeared to vary by genotype as well. The biggest change in cell
shape between the epidermis and first layer of hypodermis of ripe fruits was detected in
‘Springhigh’ and ‘Sweetcrisp’ (Figure 4-1, 4-2). Despite ‘Springhigh’ cells in the first
layer of hypodermis becoming much longer than they were observed to be in the
epidermis, these cells were still more round in shape than any other genotype within
those two cell layers. The shape of ‘Sweetcrisp’ cells also changed dramatically
between the epidermal and first hypodermal layer, such that these cells were more
round/square than most other genotypes in the epidermal layer, but more long and
rectangular than any other genotype in the first layer of hypodermis. The least change
in shape within the outer three cell layers of ripe fruits was observed in ‘Star’. The cells
of ‘Star’ maintained the same basic proportions as they increased in size between cell
layers. The two cell layers below the epidermis, which were not considered hypodermis

73
in ‘Star’ whose peel consisted of a single cell layer, were more round in shape than
other genotypes. The epidermis of ‘Star’, however, had the longest cells when
compared to the epidermal layer of all other genotypes.
Evidence of intercellular spaces was observed in all genotypes at the mature
green and ripe stage of development (Figure 4-5). Genotypes appeared to vary in the
amount and size of space between cells, and was most evident in the numerous and
large intercellular spaces detected in ‘Star’. The large round shape of cells in ‘Star’ may
account for the increased space observed between cells. ‘Star’ also demonstrated a
less structured pattern of cell packing than other genotypes whose cells had a more
layered pattern of organization. The lack of layered structure in ‘Star’ may be due to the
subepidermal cells beneath its single layered epicarp, which are considered to belong to
the mesocarp and have completed cell division sooner and undergone a longer period of
cell expansion than cells in the epicarp.
Average cell size ranged from 436 µm2 to 718 µm2 in the outermost cell layer of
mature green fruit and from 429 µm2 to 668 µm2 in the outermost cell layer of ripe blue
fruit (Table 4-1). This suggests that there is not a dramatic increase of cell size in the
epidermal layer of berries as they ripen from mature green to fully ripe fruits, which is
consistent with previous results suggesting that cell division persists in the epicarp, while
mesocarp cells stop dividing and increase only in size during the latter stages of ripening
(Harker et al., 1997).
For all genotypes, average cell size successively increased in the second, third,
and fourth outer cell layers of both mature green and ripe blue fruits (Figure 4-1, 4-2, 4-
3, 4-4; Table 4-1). The berries of FL 06-244 and ‘Star’, when compared with all other
genotypes of mature green and ripe fruits, respectively, had the largest difference in

74
average cell size between the epidermis and first layer of hypodermis. However,
differences in cell size between outermost cell layers measured did not appear to
correspond to soft and crisp textured genotypes. For example, the crisp genotype FL 07-
100 was grouped with genotypes having the smallest cell size in the two outermost cell
layers of mature green fruits and the outermost cell layer of ripe fruits, while the crisp
genotype FL 06-244 was grouped with genotypes having the largest cell sizes (Table 4-
1) There was a significant difference in cell size between cultivars, but there was no
significant difference between the cell size of crisp and soft-textured genotypes in any
cell layer of either fruit maturity stage.
The difference in cell size between ripe blue and mature green fruits is indicative
of cell expansion during the ripening process. While cell size could not be measured in
the same fruit during ripening, we observed that the largest differences in the epidermal
cell layer between mature green and ripe fruits were in three soft-textured genotypes (FL
06-245, ‘Springhigh’ and ‘Star’). By contrast, the average size of epidermal cells in
mature green fruits of three crisp genotypes (FL 06-244, FL 07-100, and ‘Raven’) was
greater than in ripe fruits, suggesting prolonged cell division and a lesser degree of cell
expansion in these genotypes during ripening (Table 4-1). ‘Raven’ was included in the
study as a genotype having a texture somewhere between soft and crisp. A trained
sensory panel, however, found it to be as equally crisp as the crisp genotype FL 98-325,
and firmness measurements of ‘Raven’ exceeded those of FL 98-325 (see Chapter 2).
While these observations are not conclusive, they offer a possible explanation of how
cell division and cell expansion in the epidermal layer of crisp and soft-textured
blueberry occurs during ripening, and may be worth further exploration.

75
Stone cells were observed in the mesocarp tissue of some southern highbush
genotypes (‘Springhigh’, FL06-245, ‘Windsor’, ‘Raven’, FL 06-244, and ‘Sweetcrisp’) that
we evaluated (Table 4-2). Stone cells were found singly or in pairs as previously
reported (Gough, 1983; Allan-Wojtas et al., 2001; Fava et al., 2006), but no clusters
were detected (Figure 4-6). The average number of stone cells in a single berry ranged
from 0 to 95 (Table 4-2). Two crisp genotypes (FL 98-325 and FL 07-100) did not have
any stone cells, while ‘Sweetcrisp’ had a moderate number of stone cells (an average of
seven per green fruit and 17 per ripe fruit). The crisp genotype FL 06-244 had more
stone cells/berry than any other genotype evaluated. Two full sibs, FL 06-244 (crisp)
and FL 06-245 (soft textured), both demonstrated a high frequency of stone cells (Table
4-2), which suggests that this trait is genetically regulated, but may not be correlated
with crisp texture. As a whole, the crisp genotypes that were evaluated here did not
have a higher frequency of stone cells than non-crisp genotypes, suggesting that stone
cells are not correlated with crisp texture in blueberry. With the lack of obvious
anatomical differences that correlate with crisp fruit texture, a more detailed examination
of the composition of epicarp cells is warranted.

76
Table 4-1. Average cell area (µm2) for each cell layer of soft and crisp-textured genotypes at the mature green and ripe blue stages of development. The epidermal cell layer is represented as 1, the 2nd outermost cell layer is marked 2, and the 3rd and 4th layers are 3 and 4 respectively.
Average Cell Area (µm2)
Mature Green Blue Ripe
Texture Genotype 1 2 3 4 1 2 3
Soft Springhigh 558 BZ 1148 B 1429 B 2483 BC 661 A 1147 B 1380 C
FL 06-245 436 D 1083 BC 1901 A 3555 A 614 AB 1302 B 1653 BC
Star 576 B 972 BCD 1563 AB 2164 C 689 A 1706 A 2610 A
Windsor 536 BC 998 BC 1393 B 2715 BC 582 AB 1256 B 1689 BC
Raven 561 B 929 CD 1307 B 2224 C 521 BC 1126 B 1837 B
Crisp FL 06-244 718 A 1417 A 1782 A 3157 AB 668 A 1306 B 1866 B
FL 98-325 584 B 1112 BC 1586 AB 2698 BC 610 AB 1264 B 1873 B
Sweetcrisp 525 BC 1130 BC 1570 AB 2453 BC 595 AB 1312 B 1681 BC
FL 07-100 470 CD 774 D 1418 B 2703 BC 429 C 787 C 1275 C ZTukey-Kramer grouping for Least Square Means (α=0.05). LS means with the same letter within a column are not significantly different.
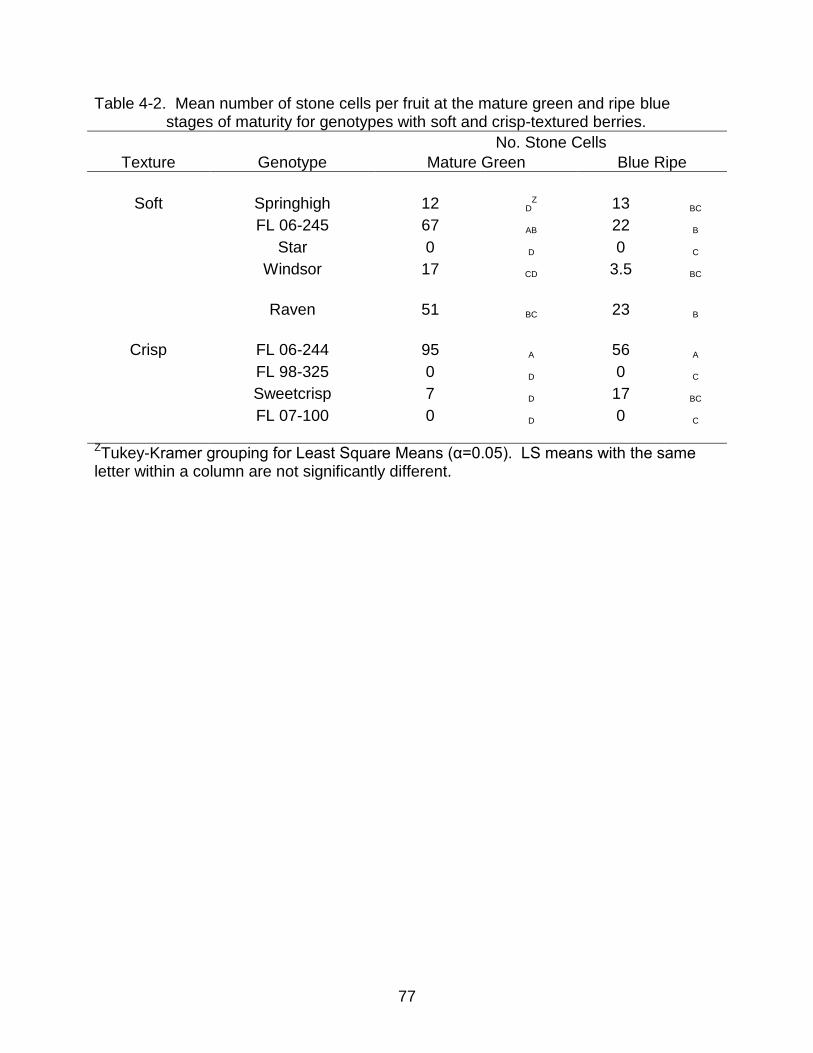
77
Table 4-2. Mean number of stone cells per fruit at the mature green and ripe blue stages of maturity for genotypes with soft and crisp-textured berries.
No. Stone Cells
Texture Genotype Mature Green Blue Ripe
Soft Springhigh 12 DZ 13 BC
FL 06-245 67 AB 22 B
Star 0 D 0 C
Windsor 17 CD 3.5 BC
Raven 51 BC 23 B
Crisp FL 06-244 95 A 56 A
FL 98-325 0 D 0 C
Sweetcrisp 7 D 17 BC
FL 07-100 0 D 0 C
ZTukey-Kramer grouping for Least Square Means (α=0.05). LS means with the same letter within a column are not significantly different.

78
Figure 4-1. Images of mature green fruits from soft-textured genotypes (100x
magnification). A) ‘Springhigh’, B) ‘Windsor’, C) ‘Star’, D) FL 06-245, E) ‘Raven’. Photos courtesy of Kendra Blaker.
D)
E)
A)
C)
B) 100 µm

79
Figure 4-2. Images of mature green fruits from crisp-textured genotypes (100x
magnification): A) FL 98-325, B) ‘Sweetcrisp’, C) FL 07-100, D) FL 06-244. Photos courtesy of Kendra Blaker.
A)
C) D)
B) 100 µm

80
Figure 4-3. Images of ripe blue fruits from soft-textured genotypes (100x magnification).
A) ‘Springhigh’, B) ‘Windsor’, C) ‘Star’, D) FL 06-245, E) ‘Raven’. Photos courtesy of Kendra Blaker.
E)
C) D)
B) A) 100 µm

81
Figure 4-4. Images of ripe blue fruits from crisp-textured genotypes (100x
magnification). A) FL 98-325, B) ‘Sweetcrisp’, C) FL 07-100, D) FL 06-244. Photos courtesy of Kendra Blaker.
A) B)
C) D)
100 µm

82
Figure 4-5. Images of mature green (A and D) and ripe blue (B, C, E, F) fruits from crisp (A-C) and soft-textured (D-F) genotypes
(400x magnification). A) FL 06-244, B) FL 07-100, C) ‘Sweetcrisp’, D) FL 06-245, E) Star, F) Springhigh. Arrows indicate intercellular space. Photos courtesy of Kendra Blaker.

83
Figure 4-6. Images of stone cells in crisp and non-crisp genotypes. A) Crisp genotype
FL 06-244. B) Non-crisp genotype FL 06-245, a full sib of FL 06-244 (100x magnification). Arrows indicate stone cells. The thickened cell walls of stone cells are pink after staining with Safranin O. Note that the stone cells occur singly or in pairs, and are located just below the epidermal cells of the fruit. Photos courtesy of Kendra Blaker.
A)
B)
100 µm

84
CHAPTER 5 CELL WALL COMPOSITION OF THE MESOCARP AND EPIDERMAL TISSUE OF
CRISP AND SOFT TEXTURED BLUEBERRY GENOTYPES DURING POST HARVEST STORAGE
Literature Review
Two southern highbush blueberry (Vaccinium corymbosum L. hybrids) cultivars –
‘Bluecrisp’ and ‘Sweetcrisp’ – released by the University of Florida (UF) in 1997 and
2005, respectively, are considered to have a unique crisp texture (Okie, 1999;
Olmstead, 2011). Many current selections in the UF blueberry breeding program are
also considered to have a similar crisp phenotype (see Chapter 2). Berries with this
crisp texture are of particular interest due to their enhanced and perhaps novel eating
quality, prolonged postharvest life, and potential value for mechanical harvesting for
fresh marketed blueberries (Padley, 2005; Mehra et al., 2013; Takeda et al., 2013).
Understanding the physiological basis of this trait would therefore be useful for
predicting the potential benefits that crisp texture may contribute to blueberry production,
and potentially aid in selection and improvement of the trait through breeding efforts.
The strength and thickness of cell walls have been considered to have the
greatest overall impact on fruit firmness and texture (Goulao and Oliveira, 2008; Li et al.,
2010), and the crisp phenotype in blueberries may be related to some aspect of cell wall
architecture. Parenchyma cells are the most numerous type of cell in the flesh of
blueberry fruit and have thin, non-lignified cell walls (Gough, 1994). The epidermis is
composed of specialized parenchyma cells that have thickened primary cell walls
infused with other substances such as cutin, waxes, suberin, and lignin (Gough, 1994;
Fava et al., 2006). Xylem and sclerenchyma cells such as fibers and sclereids have

85
thick and lignified secondary cell walls, and can be found associated with vascular
bundles and stone cells in blueberry flesh (Gough, 1994).
Primary cell walls form a complex matrix of approximately 30-40% cellulose, 30%
hemicellulose, 15-30% pectin, and 5-10% structural protein (Vermerris, 2008). Carpita
and Gibeaut (1993) have described two types of primary cell walls. Most non-
commelinoid flowering plants have Type I cell walls composed of xyloglucan-rich
hemicelluloses with pectin-rich matrices, while members of the grass family (Poaceae)
have Type II cell walls made of glucuronoarabinoxylan (GAX) rich hemicelluloses and
lesser amounts of pectin. In blueberry, pectins were found to comprise 30-35% of the
total cell wall as would be expected of most non-graminaceous plants, but xylose
exceeded glucose content enough to suggest the presence of xylans rather than
xyloglucans as the principal hemicellulosic component (Vicente et al., 2007).
Secondary cell walls typically have a higher proportion of cellulose, a lower
proportion of pectin, and hemicellusloses that are more abundant in xylans and
glucomannans which bind more tightly to cellulose (Knox, 2008). These factors
contribute to the fact that primary cell walls are extendable during growth whereas
secondary cell walls are non-extendable and only form after growth has occurred and
the cell shape is fixed (Lee et al., 2011). Unlike most primary cell walls, secondary cell
walls contain lignin, which is a complex network of phenylpropanoids that confers
rigidity, strength, hydrophobicity, protection against pathogens, facilitation of water
transport, and also prevents further enlargement of the cell (Hatfield and Vermerris,
2001).
Blueberry is known to contain stone cells with thick secondary walls and a high
content of lignin which may provide increased firmness to the berry fruit tissue (Gough,

86
1983; Allan-Wojtas et al., 2001; Fava et al., 2006). Gough (1983) found sclereids just
beneath the epidermal cell layer in three highbush blueberry cultivars. All three cultivars
contained similar development and distribution of sclereids, but differed in the total
number of sclereids (Gough, 1983). Sclereids bind neighboring parenchyma cells and
can occur individually, in pairs, or in clusters, (Gough, 1983; Allan-Wojtas et al., 2001;
Fava et al., 2006). Because secondary cell walls can be rich in xylan, it is possible that
stone cells may account for the increased levels of xylose observed by Vicente et al.
(2007) in the walls of ripening blueberry fruits (Knox, 2008). However, our previous
experiments did not find any association between number or location of sclereids and
the crisp blueberry texture (see Chapter 4).
Physiological and biochemical changes that occur during ripening include:
conversion of starch to sugar, pigment biosynthesis and accumulation, biosynthesis of
flavor and aromatic compounds, cell wall degradation and fruit softening. (Brummell,
2006; Goulau and Oliveira, 2008). Textural modifications during fruit softening consist
mostly of changes to the mechanical strength of the cell wall and adhesion between
cells at the middle lamella (Goulao and Oliveira, 2008). These changes are primarily the
result of the enzyme initiated solubilization and depolymerization of pectins and
hemicelluloses (Goulao and Oliveira, 2008). Depolymerization of hemicelluloses is
considered to be one of the most influential and yet variable factors involved in fruit
softening of different fruit species (Brummell, 2006; Vermerris, 2008). For example,
depolymerization of ionically bound cyclohexane diamine tetraacetic acid (CDTA)-
soluble pectins is evident in avocado (Persea americana Mill.), but virtually absent in
pepper (Capsicum annuum L.), banana (Musa spp.), and apple (Malus domestica
Borkh.) (Brummell, 2006). Sodium carbonate soluble pectins are composed of ester

87
bound glycans such as homogalacturonan, which is a primary component of the middle
lamella where cell-to-cell adhesion is maintained (Brummell, 2006). Pectin solubilization
has been related to swelling of the cell wall in several melting flesh fruits, but both pectin
solubilization and cell wall swelling were diminished in the crisp fruits of apple,
watermelon (Citrullus lanatus Thunb.), and pear (Pyrus communis L.) (Redgwell et al.,
1997).
In blueberry, cell wall degradation is marked by pectin solubilization in the early
and intermediate stages of ripening, and increased solubilization of arabinose from
pectins and hemicelluloses in the later stages of ripening (Vicente et al., 2007). The
depolymerization of hemicelluloses was detected in all ripening stages (green to ripe
fruits), but Vicente et al. (2007) did not find evidence of pectin depolymerization during
fruit softening.
Several fresh market fruit species having textures that range from soft to crisp,
have been identified and studied, including apple, grape (Vitis vinifera L), peach (Prunus
persica L.), and sweet cherry (Prunus avium L.) (Tong et al., 1999; Sato et al., 2006;
Ghiani et al., 2001; Batisse et al., 1996). Little is known, however, about the
physiological basis of crisp texture in blueberry. The objective of this study was to
compare bioyield force, dry weight, total cell wall material, total pectins, and neutral
sugars between crisp and soft-textured blueberry genotypes at two stages of
developmental maturity and after three durations of postharvest storage.
Methods
Plant Material
Seven southern highbush blueberry genotypes having soft (‘Springhigh’, ‘Star’,
Windsor’) and crisp (‘Sweetcrisp’, FL 06-561, FL 06-562, and FL 98-325) fruit texture

88
were selected for use in this study. The texture of these genotypes was determined
from a previous study in which bioyield force measurements using a texture analyzer
were correlated with sensory score ratings made by a trained sensory panel to identify
soft and crisp textured genotypes (see Chapter 2).
Experiments followed an incomplete block design in which three replications from
five developmental and postharvest stages were collected from seven genotypes at two
field locations (out of five possible locations). Location varied by genotype due to limited
availability of multiple plants for the selections identified for use based on texture.
Cultivars and selections were hand harvested from three field trials at Straughn Farms,
Inc. near Waldo and Windsor, FL, and from two fields at the University of Florida Plant
Science Research and Education Unit near Citra, FL.
Each replication consisted of approximately 250 g of fruit. Unblemished berries
were collected at two stages of maturity. Berries having uniformly pink and blue color
represented fruits at the onset and fully ripe stage of maturity, respectively. Berries
were harvested in white plastic 4 L buckets, stored in coolers filled with ice, and
transported on the same day to the blueberry breeding lab at the University of Florida in
Gainesville, FL for postharvest treatments and instrumental analyses. All berries were
frozen in liquid nitrogen and stored at -80ºC for later analysis.
Postharvest Storage Treatment
The weight (within closest proximity to 150 g) of unblemished ripe fruits was
recorded, and berries were packed in 170 g plastic clamshells (Pactiv, Lake Forest, IL)
for postharvest storage at 3ºC. Berries were removed from the cooler after 7, 14, and
32 days. Weight loss, counts of soft/moldy fruit, and bioyield force were measured.
89
Instrumental Analysis
Bioyield was measured on 25 berries from each replicate. Individual berries
were oriented equatorially upright (Ehlenfeldt and Martin, 2002) and punctured with a 4
mm probe using a TA.HD plus Texture Analyzer (Texture Technologies, Corp.,
Scarsdale, New York). Bioyield (N) was measured as the maximum force required to
puncture a berry at a speed of 50 mm·min-1.
Sample Preparation
Fruits were peeled by hand and endocarp was removed from the flesh. Skins and
flesh were stored at -80ºC prior to freeze drying with a Freezone 1 freeze drier
(Labconco Corporation, Kansas City, MO). Dry weight was calculated from freeze dried
samples and powders were obtained by grinding with a mortar and pestle.
Alcohol Insoluble Residue (AIR) Isolation
The isolation was performed using the procedure described by Vicente et al.
(2007) with the following changes. Approximately 30 mL of 95% ethanol was added to
approximately 2 and 6 g of powder from berry skins and flesh respectively.
Suspensions were boiled for 45 min to inactivate enzymes, centrifuged (17,000 g, for 20
min), and the insoluble residue was washed 3x with approximately 30 mL of 95 %
ethanol, followed by chloroform/methanol (1:1 v/v), and finally acetone. The weight of
the alcohol insoluble residue (AIR) was recorded after drying overnight at 37ºC.
Uronic Acid (UA) and Neutral Sugar (NS) Measurement
Following the basic methods of Ahmed and Labavitch (1977), 2.5 mg of AIR was
weighed into 16x100mm disposable glass culture tubes and placed in ice on a shaker.
Two mL of chilled 95% H2SO4 was added to each tube by small increasing amounts
over the course of 30 minutes.
90
The amounts of uronic acids (UA) and neutral sugars (NS) were measured using
microtiter plate methodology as described by Van den Hoogen et al (1998) and
Laurentin and Edwards (2003), respectively. For the measurement of UA, a 96 well
microtiter plate (Costar, Corning, NY) was kept on ice, and each well was filled with 40
µL of sample and 200 µL of 95% H2SO4 containing 120 mM sodium tetraborate that had
been mixed overnight using a stir bar and plate. Each plate contained 24 samples, a
blank, and seven standards of galacturonic acid (0.5, 1, 1.5, 2, 4, 6, and 8 µg) in
triplicate. The plate was covered with an adhesive plate sealer and placed in a water
bath for one hour at 85ºC. The plate was cooled and centrifuged at low speed for 30 s.
Background absorbance was measured at 520 nm using a Synergy HT microplate
reader and Gen5 microplate software for Windows (BioTek, Winooski, VT). The reaction
was initiated with 40 µL of m-hydroxydiphenyl solution (100 µL of 100 mg/mL m-
hydroxydiphenyl in dimethyl sulfoxide stored away from light at 4ºC was mixed with 4.9
mL 80% H2SO4 just prior to use). The plate was covered with adhesive plate sealer and
inverted several times to mix the sample, and centrifuged at low speed for 30 s.
Absorbance was measured after 10 min at 520 nm.
For the measurement of NS, 40 µL of sample was added to each well of a 96 well
microtiter plate with removable 1x8 strip assemblies (Immulon 4 HBX, Milford, MA) while
on ice. Each plate contained 24 samples, a blank, and seven glucose standards (0.5, 1,
1.5, 2, 4, 7, and 10 µg) in triplicate. The reaction was initiated with 100 µL anthrone
solution (2 g·L-1 anthrone in 95% H2SO4), the plate was covered with plate sealer, and
mixed gently using a vortex. The wells were removed from the plate and suspended in a
water bath at 92ºC for 3 min., and then cooled in a water bath at room temperature for 5
min. The plate was centrifuged for 30 s at low speed and after 20 min from when the
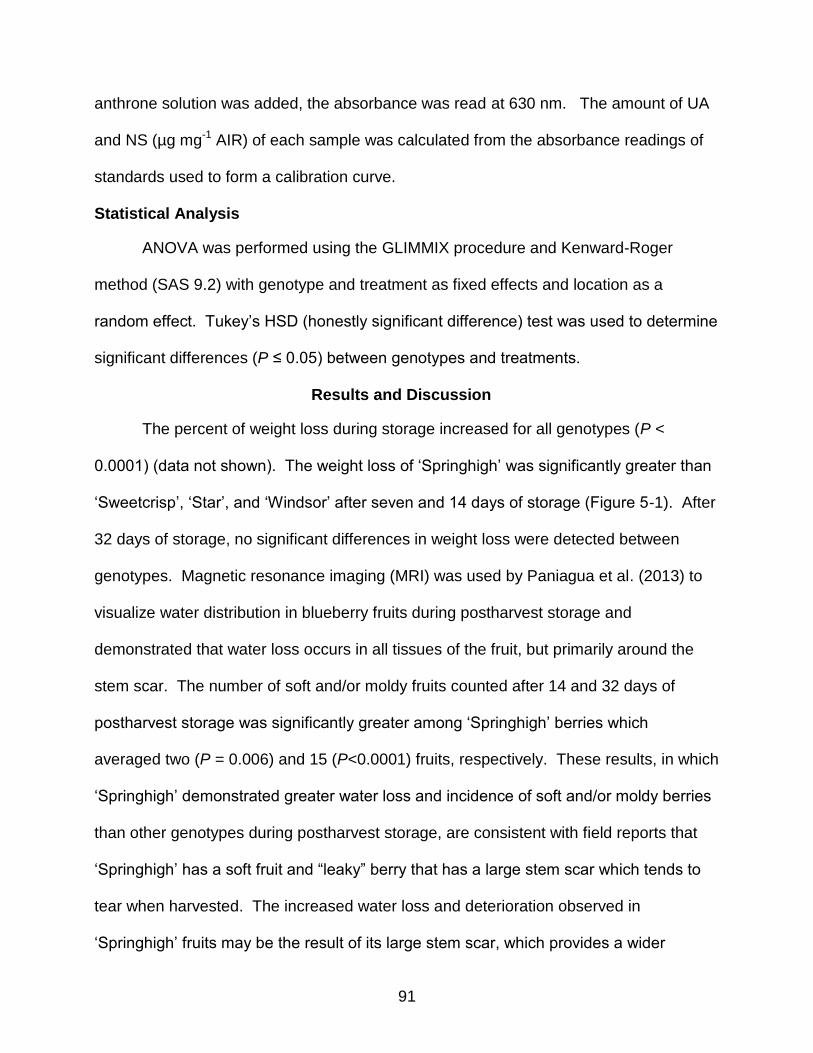
91
anthrone solution was added, the absorbance was read at 630 nm. The amount of UA
and NS (µg mg-1 AIR) of each sample was calculated from the absorbance readings of
standards used to form a calibration curve.
Statistical Analysis
ANOVA was performed using the GLIMMIX procedure and Kenward-Roger
method (SAS 9.2) with genotype and treatment as fixed effects and location as a
random effect. Tukey’s HSD (honestly significant difference) test was used to determine
significant differences (P ≤ 0.05) between genotypes and treatments.
Results and Discussion
The percent of weight loss during storage increased for all genotypes (P <
0.0001) (data not shown). The weight loss of ‘Springhigh’ was significantly greater than
‘Sweetcrisp’, ‘Star’, and ‘Windsor’ after seven and 14 days of storage (Figure 5-1). After
32 days of storage, no significant differences in weight loss were detected between
genotypes. Magnetic resonance imaging (MRI) was used by Paniagua et al. (2013) to
visualize water distribution in blueberry fruits during postharvest storage and
demonstrated that water loss occurs in all tissues of the fruit, but primarily around the
stem scar. The number of soft and/or moldy fruits counted after 14 and 32 days of
postharvest storage was significantly greater among ‘Springhigh’ berries which
averaged two (P = 0.006) and 15 (P<0.0001) fruits, respectively. These results, in which
‘Springhigh’ demonstrated greater water loss and incidence of soft and/or moldy berries
than other genotypes during postharvest storage, are consistent with field reports that
‘Springhigh’ has a soft fruit and “leaky” berry that has a large stem scar which tends to
tear when harvested. The increased water loss and deterioration observed in
‘Springhigh’ fruits may be the result of its large stem scar, which provides a wider
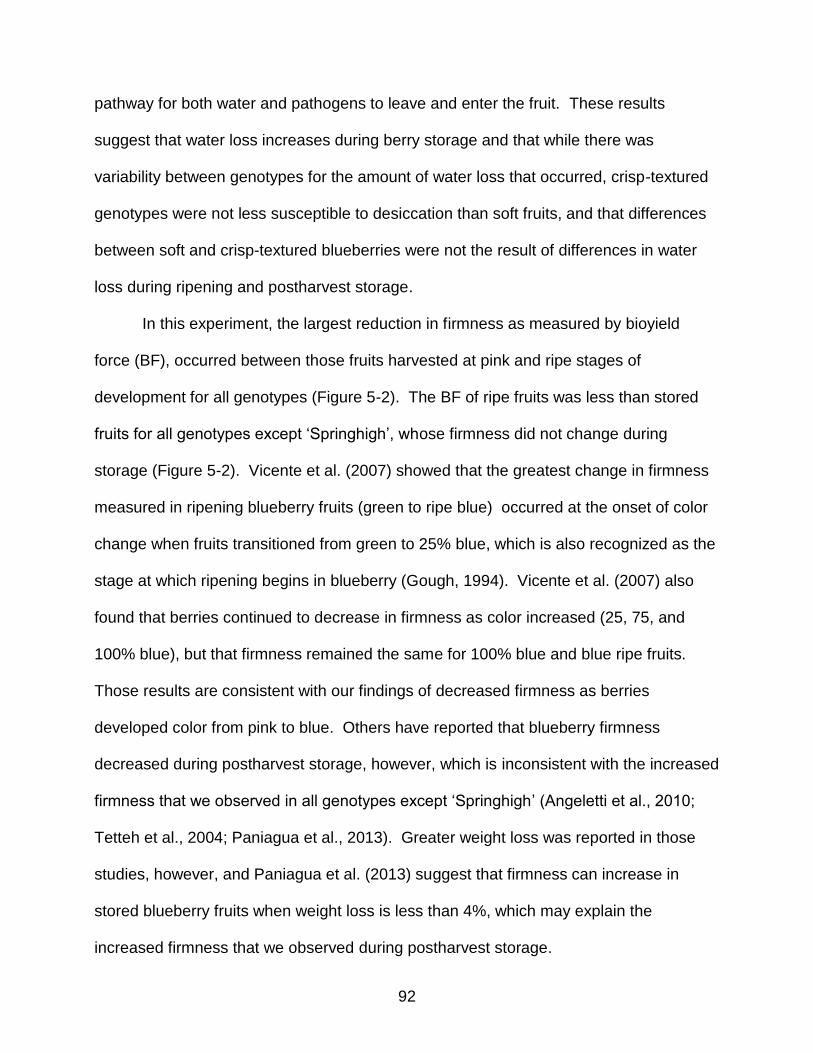
92
pathway for both water and pathogens to leave and enter the fruit. These results
suggest that water loss increases during berry storage and that while there was
variability between genotypes for the amount of water loss that occurred, crisp-textured
genotypes were not less susceptible to desiccation than soft fruits, and that differences
between soft and crisp-textured blueberries were not the result of differences in water
loss during ripening and postharvest storage.
In this experiment, the largest reduction in firmness as measured by bioyield
force (BF), occurred between those fruits harvested at pink and ripe stages of
development for all genotypes (Figure 5-2). The BF of ripe fruits was less than stored
fruits for all genotypes except ‘Springhigh’, whose firmness did not change during
storage (Figure 5-2). Vicente et al. (2007) showed that the greatest change in firmness
measured in ripening blueberry fruits (green to ripe blue) occurred at the onset of color
change when fruits transitioned from green to 25% blue, which is also recognized as the
stage at which ripening begins in blueberry (Gough, 1994). Vicente et al. (2007) also
found that berries continued to decrease in firmness as color increased (25, 75, and
100% blue), but that firmness remained the same for 100% blue and blue ripe fruits.
Those results are consistent with our findings of decreased firmness as berries
developed color from pink to blue. Others have reported that blueberry firmness
decreased during postharvest storage, however, which is inconsistent with the increased
firmness that we observed in all genotypes except ‘Springhigh’ (Angeletti et al., 2010;
Tetteh et al., 2004; Paniagua et al., 2013). Greater weight loss was reported in those
studies, however, and Paniagua et al. (2013) suggest that firmness can increase in
stored blueberry fruits when weight loss is less than 4%, which may explain the
increased firmness that we observed during postharvest storage.
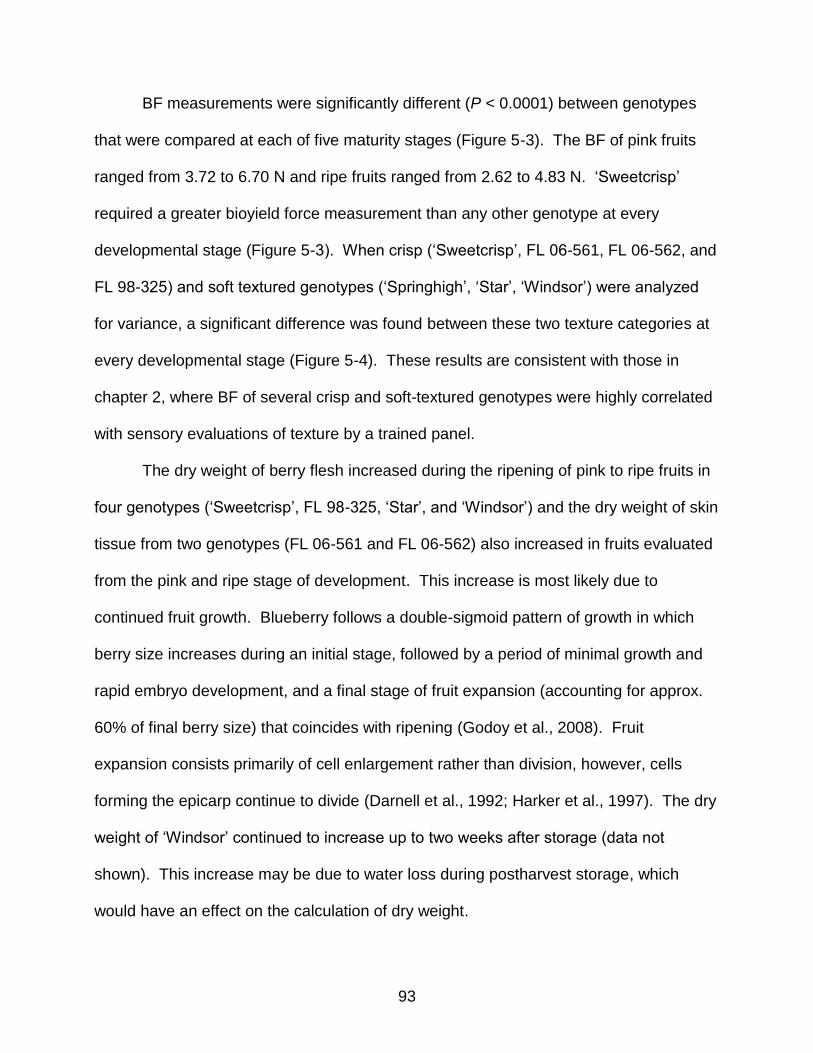
93
BF measurements were significantly different (P < 0.0001) between genotypes
that were compared at each of five maturity stages (Figure 5-3). The BF of pink fruits
ranged from 3.72 to 6.70 N and ripe fruits ranged from 2.62 to 4.83 N. ‘Sweetcrisp’
required a greater bioyield force measurement than any other genotype at every
developmental stage (Figure 5-3). When crisp (‘Sweetcrisp’, FL 06-561, FL 06-562, and
FL 98-325) and soft textured genotypes (‘Springhigh’, ‘Star’, ‘Windsor’) were analyzed
for variance, a significant difference was found between these two texture categories at
every developmental stage (Figure 5-4). These results are consistent with those in
chapter 2, where BF of several crisp and soft-textured genotypes were highly correlated
with sensory evaluations of texture by a trained panel.
The dry weight of berry flesh increased during the ripening of pink to ripe fruits in
four genotypes (‘Sweetcrisp’, FL 98-325, ‘Star’, and ‘Windsor’) and the dry weight of skin
tissue from two genotypes (FL 06-561 and FL 06-562) also increased in fruits evaluated
from the pink and ripe stage of development. This increase is most likely due to
continued fruit growth. Blueberry follows a double-sigmoid pattern of growth in which
berry size increases during an initial stage, followed by a period of minimal growth and
rapid embryo development, and a final stage of fruit expansion (accounting for approx.
60% of final berry size) that coincides with ripening (Godoy et al., 2008). Fruit
expansion consists primarily of cell enlargement rather than division, however, cells
forming the epicarp continue to divide (Darnell et al., 1992; Harker et al., 1997). The dry
weight of ‘Windsor’ continued to increase up to two weeks after storage (data not
shown). This increase may be due to water loss during postharvest storage, which
would have an effect on the calculation of dry weight.

94
The dry weight of flesh tissue from ripe berries of each genotype ranged from
14.1 to 17.1% fresh weight (FW) and from 21.9 to 27.5% FW for skin tissue (Table 5-1).
Variation of flesh dry weight was observed between genotypes, but no difference
between skin dry weights was detected (Table 5-1). Flesh dry weight of ‘Sweetcrisp’
was greater than other genotypes and supported expectations that crisp fruit would have
more dry matter accounting for their increased firmness. However, the flesh dry weight
of crisp genotypes FL 06-561 and FL 06-562, were the same or significantly less than
those of soft-textured genotypes (Table 5-1). Skin dry weights were not significantly
different between genotypes at the pink, ripe, and 7 day postharvest maturity stages.
The skins of FL 98-325 and ‘Springhigh’, representing crisp and soft genotypes,
respectively, had higher dry weights than other genotypes after 14 days postharvest
storage. The dry weight of flesh and skin tissue was not significantly different between
classes of crisp and soft texture.
AIR was expressed in milligrams per 100 mg FW and ranged from 1.31 to 1.56
mg·100mg-1 in the flesh of ripe fruits and from 5.83 to 10.13 mg·100mg-1 in the skins of
ripe fruit (Table 5-1). The amount of AIR in whole blueberry fruits from the cultivar
‘Duke’ was measured by Vicente et al. (2007) to be approximately 3 to 4 mg·100mg-1
and is therefore considered to be consistent with the AIR values we obtained from flesh
and skin tissue separately (Vicente et al., 2007). Flesh tissue from ‘Star’, and skin
tissue from FL 98-325, were the only examples from this study in which a difference in
AIR could be detected between pink, ripe, and postharvest stored fruits. However,
Vicente et al. (2007) found that AIR decreased over five ripening stages (green to ripe)
in the cultivar ‘Duke’.
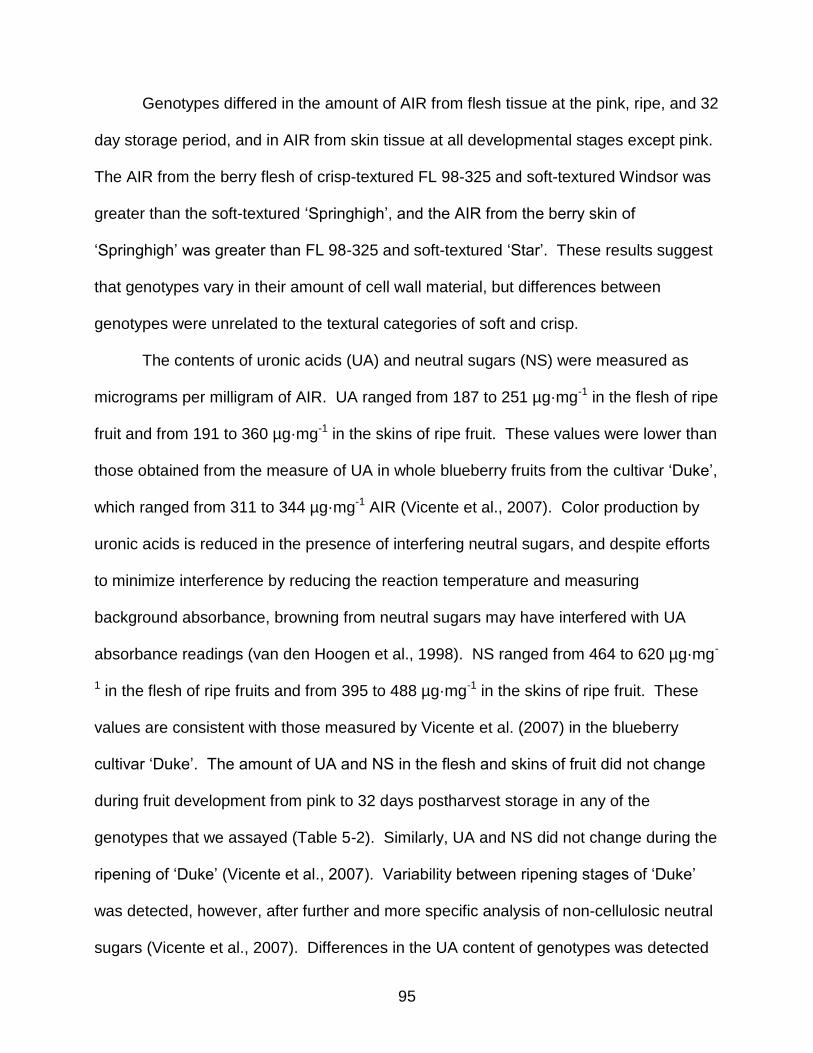
95
Genotypes differed in the amount of AIR from flesh tissue at the pink, ripe, and 32
day storage period, and in AIR from skin tissue at all developmental stages except pink.
The AIR from the berry flesh of crisp-textured FL 98-325 and soft-textured Windsor was
greater than the soft-textured ‘Springhigh’, and the AIR from the berry skin of
‘Springhigh’ was greater than FL 98-325 and soft-textured ‘Star’. These results suggest
that genotypes vary in their amount of cell wall material, but differences between
genotypes were unrelated to the textural categories of soft and crisp.
The contents of uronic acids (UA) and neutral sugars (NS) were measured as
micrograms per milligram of AIR. UA ranged from 187 to 251 µg·mg-1 in the flesh of ripe
fruit and from 191 to 360 µg·mg-1 in the skins of ripe fruit. These values were lower than
those obtained from the measure of UA in whole blueberry fruits from the cultivar ‘Duke’,
which ranged from 311 to 344 µg·mg-1 AIR (Vicente et al., 2007). Color production by
uronic acids is reduced in the presence of interfering neutral sugars, and despite efforts
to minimize interference by reducing the reaction temperature and measuring
background absorbance, browning from neutral sugars may have interfered with UA
absorbance readings (van den Hoogen et al., 1998). NS ranged from 464 to 620 µg·mg-
1 in the flesh of ripe fruits and from 395 to 488 µg·mg-1 in the skins of ripe fruit. These
values are consistent with those measured by Vicente et al. (2007) in the blueberry
cultivar ‘Duke’. The amount of UA and NS in the flesh and skins of fruit did not change
during fruit development from pink to 32 days postharvest storage in any of the
genotypes that we assayed (Table 5-2). Similarly, UA and NS did not change during the
ripening of ‘Duke’ (Vicente et al., 2007). Variability between ripening stages of ‘Duke’
was detected, however, after further and more specific analysis of non-cellulosic neutral
sugars (Vicente et al., 2007). Differences in the UA content of genotypes was detected
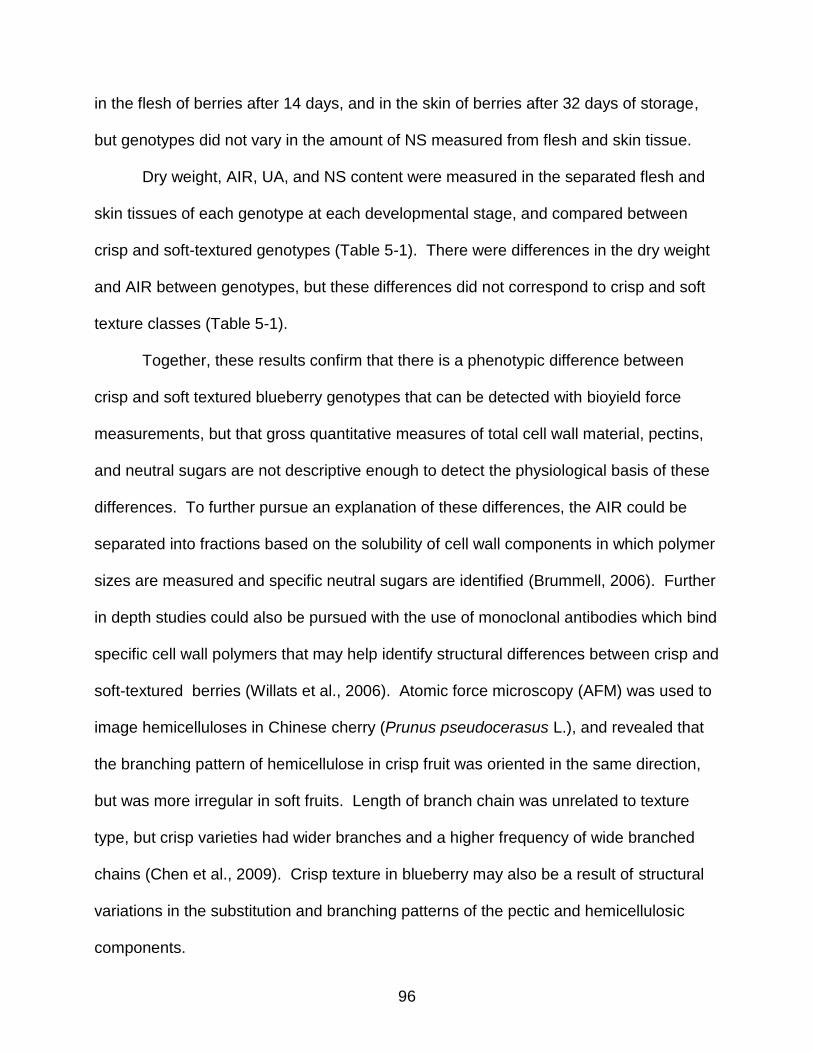
96
in the flesh of berries after 14 days, and in the skin of berries after 32 days of storage,
but genotypes did not vary in the amount of NS measured from flesh and skin tissue.
Dry weight, AIR, UA, and NS content were measured in the separated flesh and
skin tissues of each genotype at each developmental stage, and compared between
crisp and soft-textured genotypes (Table 5-1). There were differences in the dry weight
and AIR between genotypes, but these differences did not correspond to crisp and soft
texture classes (Table 5-1).
Together, these results confirm that there is a phenotypic difference between
crisp and soft textured blueberry genotypes that can be detected with bioyield force
measurements, but that gross quantitative measures of total cell wall material, pectins,
and neutral sugars are not descriptive enough to detect the physiological basis of these
differences. To further pursue an explanation of these differences, the AIR could be
separated into fractions based on the solubility of cell wall components in which polymer
sizes are measured and specific neutral sugars are identified (Brummell, 2006). Further
in depth studies could also be pursued with the use of monoclonal antibodies which bind
specific cell wall polymers that may help identify structural differences between crisp and
soft-textured berries (Willats et al., 2006). Atomic force microscopy (AFM) was used to
image hemicelluloses in Chinese cherry (Prunus pseudocerasus L.), and revealed that
the branching pattern of hemicellulose in crisp fruit was oriented in the same direction,
but was more irregular in soft fruits. Length of branch chain was unrelated to texture
type, but crisp varieties had wider branches and a higher frequency of wide branched
chains (Chen et al., 2009). Crisp texture in blueberry may also be a result of structural
variations in the substitution and branching patterns of the pectic and hemicellulosic
components.

97
0
2
4
7 14 32
We
igh
t L
oss
(%
)
Storage at 3 ºC (days)
Sweetcrisp FL 06-561 FL 06-562 FL 98-325 Springhigh Star Windsor
AB AB ABCBC C
A
C
ABC AB
C
A
BC CABC
A A A A A A A
Figure 5-1. Weight loss (%) of four crisp (black) and three soft (gray) textured southern
highbush blueberry genotypes after 7, 14, and 32 days postharvest storage at 3ºC. Different letters above graph bars indicate significant difference (P < 0.05) determined by Tukey’s HSD test for genotypes within a developmental stage.
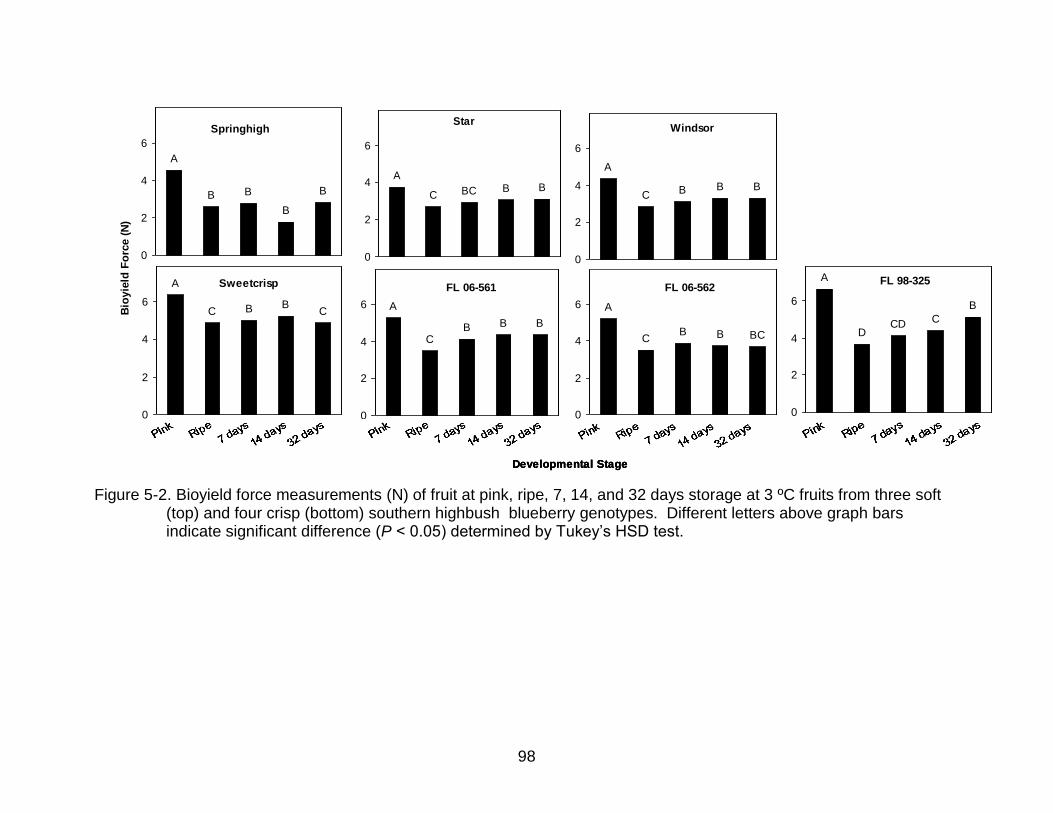
98
Figure 5-2. Bioyield force measurements (N) of fruit at pink, ripe, 7, 14, and 32 days storage at 3 ºC fruits from three soft (top) and four crisp (bottom) southern highbush blueberry genotypes. Different letters above graph bars indicate significant difference (P < 0.05) determined by Tukey’s HSD test.
SweetcrispA
C B BC
0
2
4
6
FL 06-561
A
CB B B
0
2
4
6
FL 06-562
A
CB B BC
0
2
4
6
FL 98-325A
DCD C
B
0
2
4
6
Springhigh
A
B B
B
B
0
2
4
6
Star
A
C BC B B
0
2
4
6
Windsor
A
C B B B
0
2
4
6
0
100
200
300
400
500
600
700
PinkRipe
7 days
14 days
32 days
Bio
yie
ld F
orc
e (
N)
Crisp Soft
0
100
200
300
400
500
600
700
Pink Ripe 7 days 14 days 32 days
Developmental Stage
Pu
nctu
re F
orc
e (
g)
Crisp Soft
SweetcrispA
C B BC
0
2
4
6
FL 06-561
A
CB B B
0
2
4
6
FL 06-562
A
CB B BC
0
2
4
6
FL 98-325A
DCD C
B
0
2
4
6
Springhigh
A
B B
B
B
0
2
4
6
Star
A
C BC B B
0
2
4
6
Windsor
A
C B B B
0
2
4
6
SweetcrispA
C B BC
0
2
4
6
FL 06-561
A
CB B B
0
2
4
6
FL 06-562
A
CB B BC
0
2
4
6
FL 98-325A
DCD C
B
0
2
4
6
Springhigh
A
B B
B
B
0
2
4
6
Star
A
C BC B B
0
2
4
6
Windsor
A
C B B B
0
2
4
6
0
100
200
300
400
500
600
700
PinkRipe
7 days
14 days
32 days
Bio
yie
ld F
orc
e (
N)
Crisp Soft
0
100
200
300
400
500
600
700
Pink Ripe 7 days 14 days 32 days
Developmental Stage
Pu
nctu
re F
orc
e (
g)
Crisp Soft
0
100
200
300
400
500
600
700
PinkRipe
7 days
14 days
32 days
Bio
yie
ld F
orc
e (
N)
Crisp Soft
0
100
200
300
400
500
600
700
Pink Ripe 7 days 14 days 32 days
Developmental Stage
Pu
nctu
re F
orc
e (
g)
Crisp Soft
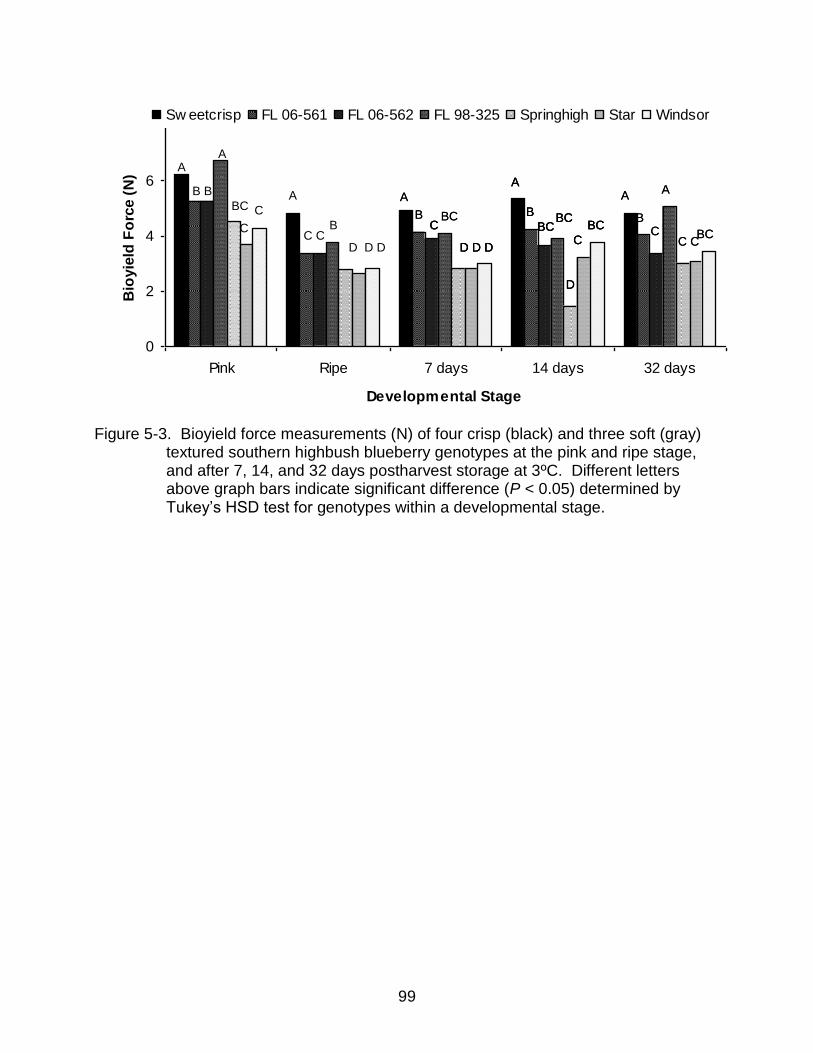
99
Figure 5-3. Bioyield force measurements (N) of four crisp (black) and three soft (gray)
textured southern highbush blueberry genotypes at the pink and ripe stage, and after 7, 14, and 32 days postharvest storage at 3ºC. Different letters above graph bars indicate significant difference (P < 0.05) determined by Tukey’s HSD test for genotypes within a developmental stage.
0
2
4
6
Pink Ripe 7 days 14 days 32 days
Developmental Stage
Bio
yie
ld F
orc
e (
N)
Sw eetcrisp FL 06-561 FL 06-562 FL 98-325 Springhigh Star Windsor
A
B B
A
BC
C
C
A
C CD D D
B
A
C
D D D
A
B
BCBC
BC
C
D
A
BCCB
A
C C
B BC
0
2
4
6
Pink Ripe 7 days 14 days 32 days
Developmental Stage
Bio
yie
ld F
orc
e (
N)
Sw eetcrisp FL 06-561 FL 06-562 FL 98-325 Springhigh Star Windsor
A
B B
A
BC
C
C
A
C CD D D
B
A
C
D D D
A
B
BCBC
BC
C
D
A
BCCB
A
C C
0
2
4
6
Pink Ripe 7 days 14 days 32 days
Developmental Stage
Bio
yie
ld F
orc
e (
N)
Sw eetcrisp FL 06-561 FL 06-562 FL 98-325 Springhigh Star Windsor
A
B B
A
BC
C
C
A
C CD D D
B
0
2
4
6
Pink Ripe 7 days 14 days 32 days
Developmental Stage
Bio
yie
ld F
orc
e (
N)
Sw eetcrisp FL 06-561 FL 06-562 FL 98-325 Springhigh Star Windsor
A
B B
A
BC
C
C
A
0
2
4
6
Pink Ripe 7 days 14 days 32 days
Developmental Stage
Bio
yie
ld F
orc
e (
N)
Sw eetcrisp FL 06-561 FL 06-562 FL 98-325 Springhigh Star Windsor
A
B B
A
BC
C
C
A
C CD D D
B
A
C
D D D
A
C
D D D
C
D D D
A
B
BCBC
BC
C
D
A
B
BC
A
B
BCBC
BC
C
D
BCBC
C
D
A
BCCB
A
C C
A
BCCB
A
C C
B BCB BC
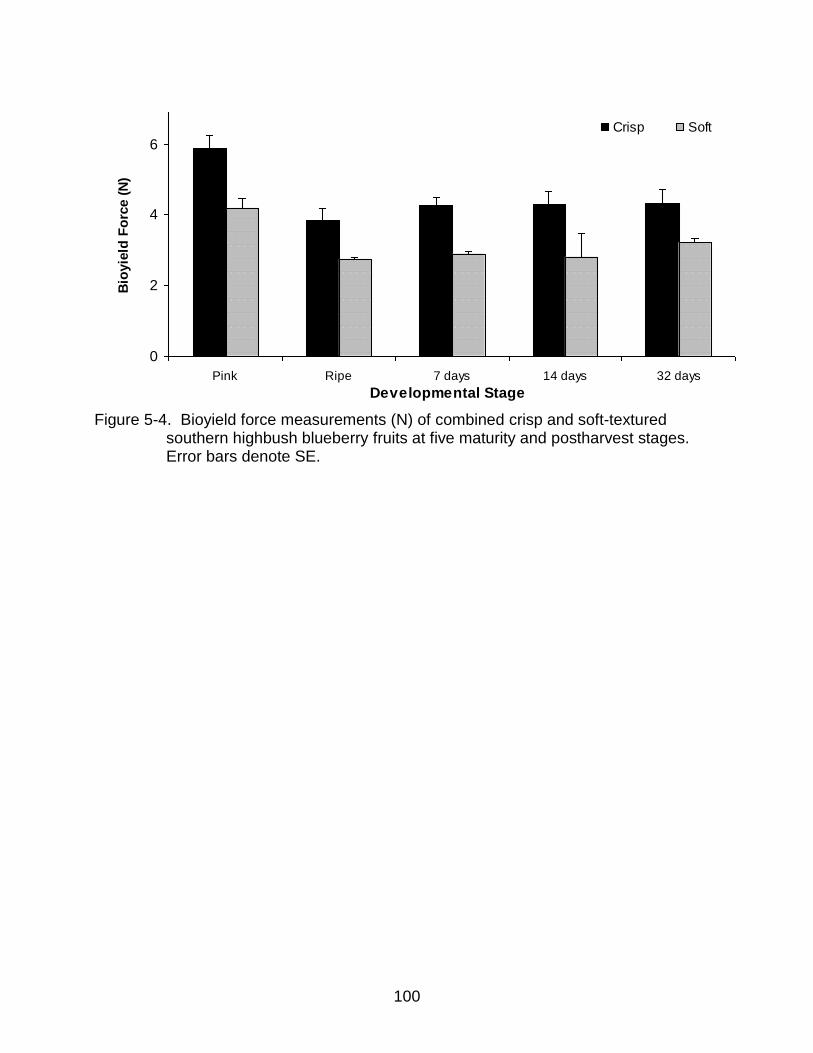
100
0
2
4
6
Pink Ripe 7 days 14 days 32 days
Developmental Stage
Bio
yie
ld F
orc
e (
N)
Crisp Soft
Figure 5-4. Bioyield force measurements (N) of combined crisp and soft-textured
southern highbush blueberry fruits at five maturity and postharvest stages. Error bars denote SE.

101
Table 5-1. Changes in dry weight and alcohol insoluble residue (AIR) of flesh and skin tissue from crisp and soft-textured southern highbush blueberry genotypes during ripening. Different letters in a column of the same tissue origin indicate significant difference (P < 0.05) determined by Tukey’s HSD.
Dry Weight (% Fresh Weight) AIR (µg 100 mg-1
)
Tissue Genotype Pink Ripe 7 days 14 days 32 days Pink Ripe 7 days 14 days 32 days
Flesh Sweetcrisp 13.3 AB 17.1 A 16.8 A 17.5 A 16.5 A 1.45 ABC 1.31 AB 1.32 A 1.28 A 1.36 AB
FL 06-561 13.4 AB 14.3 BC 13.2 CD 13.7 CD 13.9 C 1.34 BC 1.33 AB 1.23 A 1.18 A 1.20 AB
FL 06-562 13.2 AB 12.8 C 12.7 D 13.1 CD 13.1 C 1.37 BC 1.38 AB 1.28 A 1.16 A 1.37 AB
FL 98-325 14.0 A 15.2 AB 15.3 AB 13.7 CD 15.9 AB 1.57 AB 1.43 A 1.44 A 1.23 A 1.48 A
Springhigh 11.4 B 14.1 BC 14.2 BCD 11.2 D 13.8 C 1.25 C 1.31 B 1.28 A 1.11 A 1.08 B
Star 12.6 AB 15.2 AB 14.7 BC 15.0 BC 14.2 BC 1.49 ABC 1.31 AB 1.33 A 1.25 A 1.32 AB
Windsor 12.7 AB 15.1 ABC 15.4 AB 16.9 AB 15.3 ABC 1.72 A 1.56 A 1.49 A 1.33 A 1.54 A
Skin Sweetcrisp 21.4 A 27.5 A 24.3 A 21.2 B 23.0 AB 7.55 A 8.12 AB 7.54 ABC 6.84 AB 6.47 ABC
FL 06-561 20.4 A 24.2 A 21.8 A 21.9 B 20.9 AB 7.60 A 8.24 AB 6.78 BC 7.77 AB 5.97 BC
FL 06-562 19.0 A 26.5 A 21.5 A 20.9 B 19.9 B 6.89 A 9.57 AB 7.60 ABC 7.91 A 6.23 ABC
FL 98-325 20.3 A 24.4 A 21.6 A 30.4 A 23.4 AB 7.71 A 6.15 B 6.46 BC 5.50 B 6.45 ABC
Springhigh 21.0 A 26.6 A 25.8 A 31.5 A 23.3 AB 8.08 A 10.13 A 9.37 A 8.39 A 7.51 AB
Star 20.7 A 21.9 A 21.9 A 19.9 B 20.8 B 7.70 A 5.83 B 5.82 C 5.93 B 5.45 C
Windsor 21.9 A 23.4 A 23.0 A 22.9 B 24.9 A 8.31 A 7.69 AB 8.52 AB 8.15 A 7.87 A
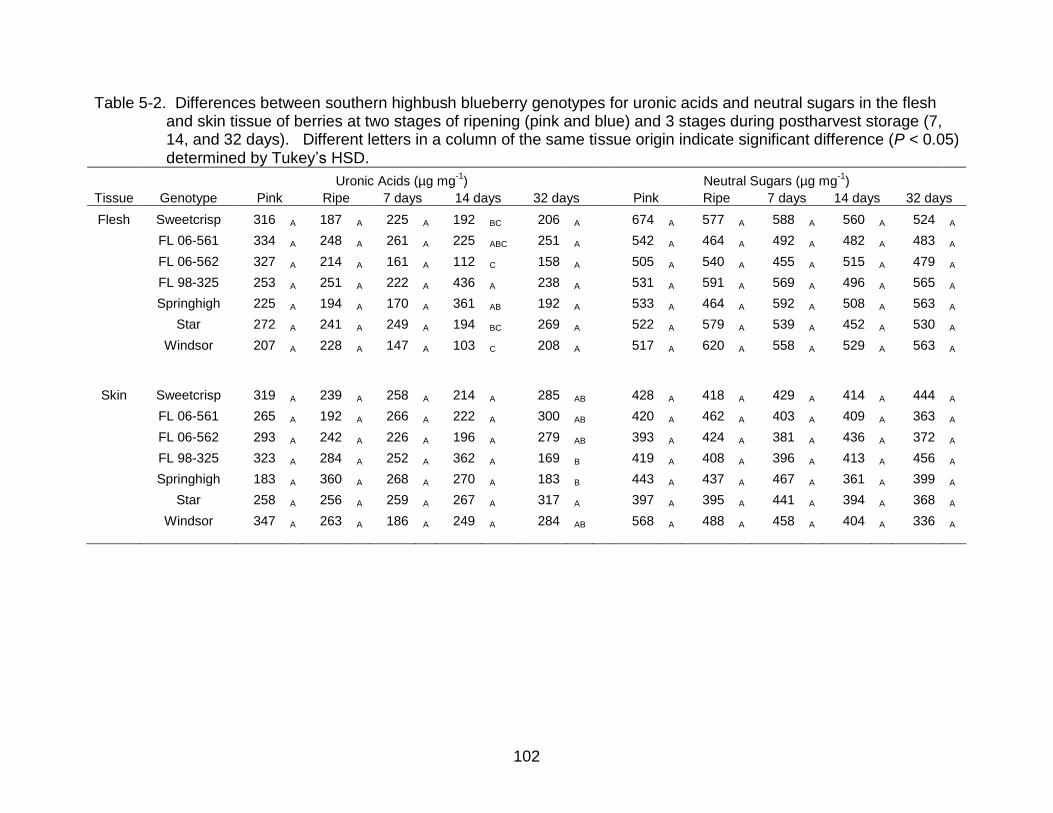
102
Table 5-2. Differences between southern highbush blueberry genotypes for uronic acids and neutral sugars in the flesh and skin tissue of berries at two stages of ripening (pink and blue) and 3 stages during postharvest storage (7, 14, and 32 days). Different letters in a column of the same tissue origin indicate significant difference (P < 0.05) determined by Tukey’s HSD.
Uronic Acids (µg mg-1
) Neutral Sugars (µg mg-1
)
Tissue Genotype Pink Ripe 7 days 14 days 32 days Pink Ripe 7 days 14 days 32 days
Flesh Sweetcrisp 316 A 187 A 225 A 192 BC 206 A 674 A 577 A 588 A 560 A 524 A
FL 06-561 334 A 248 A 261 A 225 ABC 251 A 542 A 464 A 492 A 482 A 483 A
FL 06-562 327 A 214 A 161 A 112 C 158 A 505 A 540 A 455 A 515 A 479 A
FL 98-325 253 A 251 A 222 A 436 A 238 A 531 A 591 A 569 A 496 A 565 A
Springhigh 225 A 194 A 170 A 361 AB 192 A 533 A 464 A 592 A 508 A 563 A
Star 272 A 241 A 249 A 194 BC 269 A 522 A 579 A 539 A 452 A 530 A
Windsor 207 A 228 A 147 A 103 C 208 A 517 A 620 A 558 A 529 A 563 A
Skin Sweetcrisp 319 A 239 A 258 A 214 A 285 AB 428 A 418 A 429 A 414 A 444 A
FL 06-561 265 A 192 A 266 A 222 A 300 AB 420 A 462 A 403 A 409 A 363 A
FL 06-562 293 A 242 A 226 A 196 A 279 AB 393 A 424 A 381 A 436 A 372 A
FL 98-325 323 A 284 A 252 A 362 A 169 B 419 A 408 A 396 A 413 A 456 A
Springhigh 183 A 360 A 268 A 270 A 183 B 443 A 437 A 467 A 361 A 399 A
Star 258 A 256 A 259 A 267 A 317 A 397 A 395 A 441 A 394 A 368 A
Windsor 347 A 263 A 186 A 249 A 284 AB 568 A 488 A 458 A 404 A 336 A
103
CHAPTER 6 SENSORY AND INSTRUMENTAL MEASUREMENTS OF CRISP TEXTURED
BLUEBERRIES IN AN F1 POPULATION
Literature Review
Southern highbush blueberry (SHB, Vaccinium corymbosum L. hybrids) belongs
to the family Ericaceae, genus Vaccinium, and section Cyanococcus, which includes 16
species (Uttal, 1987). Blueberries sold commercially for the fresh market typically come
from two species: V. corymbosum and V. virgatum, commonly known as “northern
highbush” and “rabbiteye” respectively. More recently, SHB resulting from hybrids
between northern highbush and several section Cyanococcus species native to the
southeastern U.S. (e.g., V. darrowii, V. virgatum, V. myrsinites), have been developed
for production in low-chill climates (Moore, 1965; Sharpe, 1953; Lyrene, 1997).
In 1997, the SHB cultivar ‘Bluecrisp’ was released by the University of Florida
(UF) and was considered by many to have a uniquely crisp texture (Okie, 1999). Similar
crisp texture was also noted in several other genotypes from UF breeding germplasm
including FL 97-136, FL 98-325, FL 02-22, FL 03-161 and ‘Sweetcrisp’, which was
released for commercial production in 2005 (Olmstead, 2011). The firmness of crisp
berries makes them attractive for use in mechanical harvesting and as a means of
extending postharvest shelf life (Mehra et al., 2013). The texture of these fruits is also
considered to have increased consumer appeal (Padley, 2005; Olmstead, personal
communication). Ehlenfeldt and Martin, (2002) reported that SHB cultivars were
generally more firm than northern highbush cultivars when compression force
measurements were made, and suggested it may be due to southern native Vaccinium
species in their ancestry. However, the crisp texture trait has not been traced back to
any one genetic source through pedigree analysis. Furthermore, it is unclear whether

104
the genetic basis of crisp texture is the result of monogenic or polygenic inheritance.
Because SHB is considered to be autotetraploid (Lyrene et al., 2003), simply inherited
traits are phenotypically much more complex than in diploids and can appear to be
quantitative (Lyrene, 1993). The objective of this study was to evaluate segregation
patterns of crisp texture in five F1 populations produced from parents expressing varying
degrees of crisp texture. Phenotypic data was assembled both by sensory evaluation
and instrumental measurements of bioyield using a texture analyzer.
Methods
Plant Material
Five crosses were made in spring 2009 (‘Sweetcrisp’ x FL 98-325; FL 03-161 x
FL 98-325; FL 98-325 x FL 97-136; FL 98-325 x FL 02-22; FL 98-325 x ‘Sweetcrisp’)
between parents considered to have a crisp texture as determined by firmness
measurements and sensory evaluations made by breeders in the field (Padley, 2005).
Hand-pollinated berries were picked at full maturity and seeds were extracted by
blending the total number of berries from a single cross in a Waring blender (model no.
38BL54, Torrington, CT). Seed from each cross were stored at 4 °C for approximately
six months before being planted in 3.75 L plastic pots containing 100% peat soil. After
germination, approximately 1,000 seedlings from each cross were transplanted into
trays of peat at 2.54 cm spacing and grown in the greenhouse to a height of
approximately 30 cm. Seedlings were randomly planted by population in April 2010 at
0.76 m spacing in raised bed rows (3 m apart) consisting of pine bark mixed with native
soil and covered with black woven weed barrier. Standard Florida blueberry
management practices were applied uniformly to all seedlings (Williamson et al., 2004,
2013). High tunnels were constructed over these plants in October-November 2010 and

105
commercial bumblebee hives were placed centrally under each tunnel in January 2011
and 2012 to facilitate pollination. The first two hundred healthy plants in a row from
each cross were selected and labeled for phenotypic evaluation.
Phenotypic Evaluation
In spring 2011, fruit from two hundred F1 seedlings from each of the five
populations were rated for crisp texture using a 9-point scale ranging from “not crisp” (1)
to “most crisp” (9). To compensate for fruit-to-fruit variability, three to six berries from
each seedling were tasted, and only undamaged berries were selected at the ripe
(100% blue surface area) stage of development (Shutak et al., 1980). Following each
evaluation period, plants were harvested for commercial production to ensure that
overripe fruits would not be present at the subsequent harvest for sensory analysis. To
account for climate and fruit quality differences throughout the approximate six week
harvest season, each seedling was evaluated on three separate dates during the
harvest period. Plants that could not be evaluated more than one time during the
season due to low plant yield or excessive fruit damage were excluded from the
population. The sensory scores of each seedling were averaged and any seedlings with
a standard deviation of ≥3 were also excluded. The total number of seedlings that were
included in the analysis of each population is given in Table 6-1.
In spring 2012, 25 undamaged ripe (100% blue surface area) fruits were picked
from 200 F1 seedlings of the FL 98-325 x ‘Sweetcrisp’ population. Berries were packed
in 170 g plastic clamshells (Pactiv, Lake Forest, IL) , stored in coolers filled with ice and
transported to the blueberry breeding lab at UF in Gainesville, FL for instrumental
analysis on the same day. Because this particular population had variable yield and fruit
had to be harvested from a single seedling, harvests were sometimes performed on

106
multiple days in order to reach the 25 berry goal. Seedlings from which 25 berries could
not be acquired due to plant death, low fruit yield, or damaged fruit were excluded from
the population. Bioyield (N) was measured using a TA.HD plus Texture Analyzer
(Texture Technologies, Corp., Scarsdale, NY) fitted with a 4 mm probe to bioyield
through the skin of a single berry oriented equatorially upright as described by Ehlenfeldt
and Martin, (2002).
Data Analyses
A chi square goodness-of-fit test was used to determine whether the segregation
pattern of each population fit expected segregation ratios for a Mendelian mode of
inheritance.
Results and Discussion
Sensory scores for crisp texture reported for 2011 were averaged from three
evaluations per seedling and ranged from 1.3 to 8.3 on a nine-point scale across all five
F1 populations. Because population size was not the same for each family, the
distribution of sensory scores was expressed as the percent of seedlings with mean
sensory scores ranging from one to nine (Figure 6-1). In three out of five populations,
no seedling received a sensory score greater than 7.6. The FL 98-325 x FL 02-22
population had the lowest mean sensory score of 3.8, and the FL 98-325 x ‘Sweetcrisp’
population had the highest mean sensory score of 6.0. The distribution of sensory
scores for seedlings from the FL 98-325 x ‘Sweetcrisp’ population was skewed toward
the higher texture rating compared to all other populations. In 2011 a trained sensory
panel evaluated four of the five parents used to develop these populations (FL 02-22, FL
03-161, FL 98-325, and ‘Sweetcrisp’). Several fruit textural qualities were determined
including “bursting energy” which was rated on an eleven point scale (0 to 10) based on

107
the panelist’s impression at the first bite, from mushy to crunchy (see Chapter 2).
Sensory scores determined by the trained panel for FL 02-22, FL 03-161, FL 98-325,
and ‘Sweetcrisp’ were 3.4, 4.5, 6.3, and 7.3 respectively. Populations having one parent
(FL 02-22 or FL 03-161) that received lower sensory scores by the trained panel for
bursting energy also had lower overall sensory scores for crisp texture in this study as
compared to those populations having the two parents (FL 98-325 and ‘Sweetcrisp’ )
that received higher scores from the trained panel.
There were several limitations to the sensory score method of phenotyping used
for these populations in 2011. The process of rating so many samples in the field could
not be performed under the same conditions at each evaluation. Temperature is well
known to have an effect on blueberry fruit firmness (NeSmith et al., 2002, 2005).
Evaluation of these populations often required the entire day, such that fruits evaluated
in the cool morning were not under the same conditions as those evaluated during the
heat of the afternoon. For a more consistent and less subjective measure of texture, a
single population was selected for evaluation by instrumental measures in 2012.
Bioyield (defined as the point at which deformation increases and force
decreases or remains the same) was measured using a texture analyzer on 25 berries
from 124 F1 seedlings of the FL 98-325 x ‘Sweetcrisp’ population (Jackman and Stanley,
1995). A normal distribution, with bioyield forces for individual genotypes ranging from
3.27 to 6.05 N and a mean force of 4.41 N, was observed for this population (Figure 6-
2). The parents of this population were not located in the same field, however, the mean
bioyield force of FL 98-325 and ‘Sweetcrisp’ fruit collected from multiple nearby locations
during the same harvest time period was 3.70 and 4.89 N respectively. In comparison,
standard texture, non-crisp commercial cultivars such as ‘Springhigh’, ‘Star’, and

108
‘Windsor’ were also collected from multiple locations in 2012 and had a mean bioyield
force of 2.57, 2.67, and 2.84 N respectively (data not shown). Each of these non-crisp
cultivars had an average bioyield that was below the lowest bioyield force from any
individual in the FL 98-325 x ‘Sweetcrisp’ population.
Chi square analysis was used to test the five populations that were phenotyped
by sensory scores in 2011 to determine whether they could be explained by qualitative
inheritance. Based on sensory and instrumental data previously obtained on four of the
five parents used in these crosses, we hypothesized that crisp texture was the result of
incomplete dominance and that degree of crisp texture was dependent on allelic dosage
in autotetraploid southern highbush blueberry. ‘Sweetcrisp’ had received the highest
sensory scores for texture by trained panelists in 2010 and 2011, and also had the
highest bioyield force measured by a texture analyzer (see Chapter 2). However,
because fruit from several seedlings from the FL 98-325 x ‘Sweetcrisp’ F1 population
received higher sensory and bioyield scores than ‘Sweetcrisp’, we hypothesized that this
parent contributed a higher allelic dosage than any of the other parents but did not have
the highest allelic dosage possible for this putative locus. Therefore, ‘Sweetcrisp’ was
designated to contribute three out of four potential alleles to the crisp phenotype at a
single locus. Based on previous sensory scores, FL 98-325 was designated to
contribute two out of four alleles, and the remaining three parents (FL 97-136, FL 02-22,
and FL 03-161) were designated as contributors of one allele to the crisp phenotype.
According to this model, the FL 98-325 x ‘Sweetcrisp’ F1 population was expected to
demonstrate a 1:5:5:1 segregation ratio in which 8.3% of the population was
homozygous for the crisp allele, 42% carried three crisp alleles, 42% carried two alleles,
and 8.3% carried one allele. The ‘Sweetcrisp’ x FL 02-22 population was expected to
109
follow a 1:2:1 segregation ratio where 25% of the progeny carried three crisp alleles,
50% carried two crisp alleles, and 25% carried one crisp allele. The remaining three
populations (FL 03-161 x FL 98-325, FL 98-325 x FL 97-136, and FL 98-325 x FL 02-22)
were expected to follow 1:5:5:1 segregation ratios with classes representing three, two,
one, or zero crisp alleles, respectively. Because sensory scores were subjective and did
not correspond to the number of potential alleles at a single locus, the scores were
divided into classes as follows: Sensory scores of 8.0-9.0 were designated to represent
seedlings having four crisp alleles, scores of 6.5-7.9 represented seedlings with three
crisp alleles, scores of 3.5-6.4 represented seedlings with two crisp alleles, scores of
2.5-3.4 represented seedlings with one crisp allele, and scores of 1.0-2.4 represented
seedlings with no crisp allele. Because the distributions of four out of five populations
were heavily skewed toward less crisp ratings and because of limited ability to
differentiate between softer fruits at the low end of the sensory scale, seedlings having
one or zero crisp alleles were combined into a single class and represented by sensory
scores <3.4. These sensory score classes were applied uniformly to the varying
expected segregation ratios in the chi square analysis of all five populations.
Four out of five populations fit expected segregation ratios based on the
hypothesis that ‘Sweetcrisp’, FL 98-325, and the other three parents (FL 97-136, FL 02-
22, and FL 03-161) contributed three, two, and one crisp alleles respectively (P > 0.2)
(Table 6-1). Segregation of the ‘Sweetcrisp’ x FL 02-22 population was found
significantly different from the expected 1:2:1 segregation pattern (P < 0.02). Fewer
individuals were able to be evaluated from this population due to poor fruit quality and
pest damage. This diminished sample and overall reduction in fruit firmness among

110
seedlings of this population may account for the deficit of individuals with higher sensory
scores.
Because bioyield was only measured in one F1 population in 2012 a chi-square
analysis was not performed, since division of measurements into classes corresponding
to allelic dosage would be arbitrary and unable to be compared between multiple
populations. However, based on the bioyield measurements of the parents (FL 98-325
and ‘Sweetcrisp’) in relation to the population distribution, the most plausible model
assuming crisp is a monogenic trait is that in which ‘Sweetcrisp’ carries three crisp
alleles and FL 98-325 carries two crisp alleles. The bioyield of thirteen individuals was
less than the bioyield of FL 98-325 (3.70 N) and the bioyield of twenty-five individuals
was greater than ‘Sweetcrisp’ (4.89 N), leaving 84 individuals with bioyield scores
between these two parents. Regardless of how bioyield scores are grouped according
to allelic dosage, the segregation ratio of AAaa x AAAa (1:5:5:1) is more descriptive of
this population than any other alternative for a monogenic trait. Unfortunately, in an
autotetraploid, the segregation ratio of Aaaa x AAaa (1:5:5:1) cannot be ruled out, as it
is not distinguishable from the previous allelic combination. However, assigning an
allele dosage of Aaaa to FL 98-325 and AAaa to ‘Sweetcrisp’ could not be expanded to
fit the parents (FL 97-136, FL 02-22, and FL 03-161) used to develop the populations
phenotyped by sensory score in 2011, and does not correlate with sensory panel and
firmness measurements of the parents (FL 02-22, FL 03-161, FL 98-325, and
‘Sweetcrisp’) which demonstrate increasing levels of crispness.
While the normal distribution of bioyield force in the FL 98-325 x ‘Sweetcrisp’
population is descriptive of quantitative inheritance, it could also explain a monogenic
trait that is disguised by polyploidy and environmental factors that make the crisp

111
phenotype difficult to classify in discrete categories. Thus, it remains unclear whether
the genetic basis of crisp texture is regulated by one or several genes. Although the
subjective rating scales used in 2011 can be made to fit a single-gene model, the
polyploid nature of blueberry and the potential for environmental interactions make
assessing texture difficult. Until a more precise method of determining the crisp
phenotype is developed, ideally at the genome level, it may be difficult to conclusively
determine whether crisp texture is a monogenic or polygenic trait.

112
Table 6-1. Segregation data for crisp texture in five F1 southern highbush blueberry populations tested to fit expected single-gene segregation ratios for a trait of incomplete dominance in an autotetraploid species.
Cross No. of
Seedlings Allelic
Dosagez Observedy Expected Χ2 P-value
SCx x 02-22v 152 aaaa 44w 0 + 38
Aaaa
AAaa 86 76
AAAa 22 38
AAAA 0 0 9 <0.02
03-161v x 98-325u 190 aaaa 82 16 + 79
Aaaa
AAaa 86 79
AAAa 15 16
AAAA 0 0 2.5 >0.25
98-325 x 97-136v 188 aaaa 83 16 + 78
Aaaa
AAaa 85 78
AAAa 20 16
AAAA 0 0 2.9 >0.2
98-325 x 02-22 192 aaaa 91 17 + 83
Aaaa
AAaa 91 83
AAAa 17 17
AAAA 0 0 1.6 >0.25
98-325 x SC 184 aaaa 16 0 + 15
Aaaa
AAaa 83 75
AAAa 65 75
AAAA 17 15 2.5 >0.25 zAllelic dosage representing genotypes with sensory scores of AAAA = 8.0-9.0; AAAa = 6.5-7.9; AAaa = 3.5-6.4; Aaaa = 2.5-3.4, and aaaa = 1.0-2.4.
yEach seedling was evaluated by sensory score 2-3 times during the season. Sensory scores were averaged and any seedlings with a standard deviation of ≥3 were excluded. xAAAa = genotype with 3 crisp alleles. wBecause subjective rating differences between the aaaa and Aaaa allelic classes were difficult to separate, these two classes were uniformly combined and the chi-square analysis was applied to the combined class.
vAaaa = genotype with 1 crisp allele. uAAaa = genotype with 2 crisp alleles.
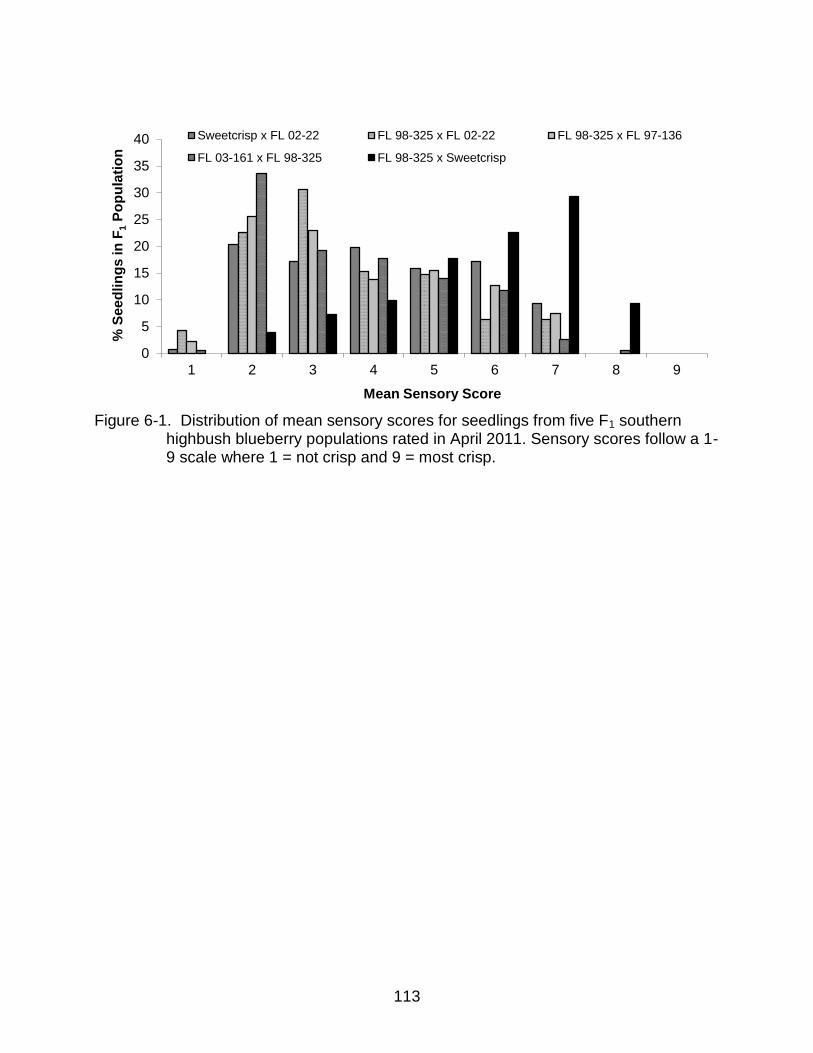
113
0
5
10
15
20
25
30
35
40
1 2 3 4 5 6 7 8 9
% S
ee
dlin
gs in
F1
Po
pu
lati
on
Mean Sensory Score
Sweetcrisp x FL 02-22 FL 98-325 x FL 02-22 FL 98-325 x FL 97-136
FL 03-161 x FL 98-325 FL 98-325 x Sweetcrisp
Figure 6-1. Distribution of mean sensory scores for seedlings from five F1 southern
highbush blueberry populations rated in April 2011. Sensory scores follow a 1-9 scale where 1 = not crisp and 9 = most crisp.

114
Figure 6-2. Distribution of bioyield force (N) of seedlings from the FL 98-325 x ‘Sweetcrisp’ F1 southern highbush blueberry population.
0
5
10
15
20
25
3.25
-3.4
9
3.50
-3.7
4
3.75
-3.9
9
4.00
-4.2
4
4.25
-4.4
9
4.5-
4.74
4.75
-4.9
9
5.00
-5.2
4
5.25
-5.4
9
5.50
-5.7
4
5.75
-5.9
9
6.00
-6.2
4
Bioyield Force (N)
No
. o
f seed
lin
gs
FL 98-325
Sweetcrisp
0
5
10
15
20
25
3.25
-3.4
9
3.50
-3.7
4
3.75
-3.9
9
4.00
-4.2
4
4.25
-4.4
9
4.5-
4.74
4.75
-4.9
9
5.00
-5.2
4
5.25
-5.4
9
5.50
-5.7
4
5.75
-5.9
9
6.00
-6.2
4
Bioyield Force (N)
No
. o
f seed
lin
gs
FL 98-325
Sweetcrisp
FL 98-325
Sweetcrisp

115
CHAPTER 7 CONCLUSION
The objective of this research was to use compression and bioyield force
measures to identify crisp and soft-textured southern highbush blueberry (SHB)
genotypes determined by a trained sensory panel, to evaluate how genotypes of these
identified texture classes respond to ethylene inhibition, to investigate differences in
cellular structure and composition between genotypes, and to phenotype seedling
populations from putative crisp parents in order to determine segregation patterns of
crisp texture in blueberry.
Descriptors for textural traits in blueberry were devised using a trained sensory
panel to survey a broad range of germplasm, including crisp and soft-textured SHB
cultivars and selections developed at the University of Florida. Differences in sensory
perception of berry texture and instrumental measurements of compression and bioyield
force on the berry tissue were detected between genotypes, and correlations between
trained panel ranking and instrumental measurements of blueberry texture were found.
Instrumental measures of compression and bioyield forces were significantly different
among genotypes and correlated with sensory scores for bursting energy, flesh
firmness, and skin toughness. These results suggest that there is a distinction between
crisp and soft-textured cultivars in blueberry, and that crispness is related to the sensory
perception of bursting energy, flesh firmness, and skin toughness, as well as higher
compression and bioyield force measurements.
In an effort to determine the physiological basis for the increased firmness
observed in crisp-textured genotypes, we began by exploring the role of ethylene in
blueberry ripening. Fruit species can be divided into two categories based on how they
116
ripen: climacteric and non-climacteric. Because blueberry had been characterized as a
climacteric fruit, we decided to first investigate how genotypes of the previously
identified texture classes would respond to ethylene inhibition. Two SHB cultivars with
soft and crisp fruit texture were treated at five and nine days prior to berry coloration with
a preharvest application of 1-methylcyclopropene (1-MCP), which is a known ethylene
inhibitor. Compression firmness was measured on berries from each treatment and
genotype, but none of the preharvest treatments with 1-MCP resulted in significantly
greater firmness when compared to the untreated control. Ethylene sensitive
(climacteric) fruits are expected to show negative ripening responses to ethylene
inhibitors such as 1-MCP, and to our knowledge no climacteric fruit has yet been found
to be unresponsive to 1-MCP. These results suggested that ethylene inhibition does not
have an effect on ripening in blueberry and that blueberry has been inappropriately
identified as a climacteric fruit. These results also demonstrate that differences in fruit
texture were not the result of genotypic differences in ethylene sensitivity.
In conjunction with our findings that neither crisp nor soft-textured fruits
demonstrated ethylene sensitivities during ripening, reports from an unpublished study
between crisp and soft-textured SHB genotypes showed that crisp genotypes had
consistently greater firmness throughout ripening and storage but were not different from
soft-textured genotypes in the rate at which they softened. Together these findings led
us to focus on differences in the cellular structure between these two texture types
rather than changes over time. More specifically, we chose to narrow our studies by
focusing on the structure and composition of the fruit peel.
A survey of blueberry firmness (measured as compression force g·mm-1) by
Ehlenfeldt and Martin (2002) found that SHB with southern native species (V. virgatum,
117
V. darrowii, and V. tenellum) in their pedigree, were firmer than SHB with introgression
from northern species (V. angustifolium). Silva et al (2005) measured the bioyield force
of three rabbiteye (V. virgatum) and two highbush (V. corymbosum) cultivars and
similarly found that the rabbiteye genotypes originating in the south had a greater
bioyield force. The texture of rabbiteye cultivars has also been described as having
increased seediness and tougher skins Silva et al., 2005).
In addition, Gough (1983) reported sclereids beneath the skin tissue of three
highbush blueberry cultivars and suggested that these highly lignified cells give fruit a
gritty texture (which could easily be confused with “seediness”) and may increase
firmness. It has also been observed that unlike standard soft blueberry fruits, which
form a sauce when heated, the skins of crisp fruits remain intact (Olmstead, personal
communication). These reports, in combination with our own findings (see chapter 2) in
which bioyield force, bursting energy (“crispness”), and skin toughness were highly
associated, led us to focus our research on the fruit peel. To examine the structural
features of the fruit peel, a histological analysis was performed on the outermost cell
layers of four soft, four crisp, and one intermediate-textured genotype at the mature
green and ripe blue maturity stage. The results of this study found variability among
genotypes for stone cell frequency, cell size, cell shape, and thickness of the epicarp,
but no differences between classes of soft and crisp-textured genotypes were found,
which led us to a more detailed study of cellular composition.
Similar to the crisp SHB genotypes that we evaluated (see chapter 2), rabbiteye
blueberries have been shown to have greater firmness when measured by bioyield force
than highbush types, and also were shown to contain more soluble and insoluble fiber
(Silva et al., 2005). Fruit firmness is largely determined by cell wall strength and

118
thickness (Goulao and Oliveira, 2008; Li et al., 2010), therefore, the next logical step
towards investigating the physiological differences between crisp and soft-textured
blueberries, was to look in more detail at the cell wall. We continued to focus our
research on the fruit peel and collected the alcohol insoluble residue (AIR), comprised of
mostly cell wall material, from separated skins and flesh tissue from three crisp, three
soft, and one intermediate-textured SHB genotype from two field locations. To confirm
unpublished findings of the degree to which crisp and soft-textured genotypes vary in
firmness over time, we evaluated fruits at two maturity stages (pink and ripe) and after
three postharvest storage durations (7, 14, and 32 days at 3ºC). Dry weight, AIR,
uronic acids, and neutral sugars were measured in the separated flesh and skin tissues
of each genotype at each developmental stage, and were compared between crisp and
soft-textured genotypes. There were differences in the dry weight and AIR of flesh and
skin tissue between genotypes, and select genotypes varied in uronic acids, but these
differences did not correspond to crisp and soft-texture classes. To further pursue an
explanation of these differences, fractions of the AIR should be separated based on the
solubility of cell wall polysaccharides to estimate polymer size and sugar composition of
each fraction (Brummell, 2006). If textural differences cannot be detected based on
evidence of the solubilization and depolymerization of pectin and hemicelluloses, then
further analysis of polymer substitution and branching patterns would be warranted. For
example, several monoclonal antibodies are available that bind specific pectin domains
with the ability to differentiate between varying amounts and patterns of methyl-
esterification (Willats et al., 2005) Several other techniques are available for determining
the fine structure of cell wall polymers as well, and could also be applied if no
differences are detected by fractionation between texture types (Willats et al., 2005).

119
Fruit texture is a complex trait and despite our inability to identify the physiological
factors governing its unique expression of “crisp” in blueberry with the body of work we
have contributed here, we were able to successfully eliminate several plausible
explanations of what might have been responsible for the textural differences in
blueberry, and we were able to develop a reliable set of tools for phenotyping crisp
texture that will be informative and useful for future studies of texture in blueberry.
We used the tools developed through sensory descriptors and instrumental
bioyield force measures to phenotype five F1 populations segregating for crisp texture.
These populations were evaluated by sensory score and tested by chi square analysis
to determine whether segregation patterns could be explained by qualitative inheritance.
One population was phenotyped by bioyield force and demonstrated a distribution that
could support the qualitative model that we proposed in which the crisp trait is controlled
by a single gene expressing incomplete dominance in an autotetraploid genetic system.
In the populations that we evaluated and with the limited bioyield force measurements
we were able to obtain, it was not possible to determine the genotypic nature of crisp,
despite four out of five populations fitting expected ratios for a monogenic trait. Future
segregation studies would be improved by selecting parents based on results from
Chapter 2, such that parents with sensory and instrumental scores likely to represent
each possible dosage class (0, 1, 2, 3, and 4 crisp alleles) for a putative single locus
should be crossed in order to form F1 populations representing every possible crisp
allelic dosage combination. The phenotyping of F1 populations would also improve with
the use of bioyield force, which we found to be more consistent and objective than
onsite sensory scores assigned to fruit from seedlings in the fluctuating weather
conditions of the field.
120
LIST OF REFERENCES
Ahmed and Labavitch 1977. A simplified method for accurate determination of cell wall uronide content. Journal of Food Biochemistry 1:361-365.
Allan-Wojtas, P.M., C.F. Forney, S.E. Carbyn, and K. Nicholas, 2001. Microstructural indicators of quality-related characteristics of blueberries - An integrated approach. Lebensmittel-Wissenschaft Und-Technologie-Food Science and Technology 34:23-32.
Alsmairat, N., C. Contreras, J. Hancock, P. Callow, and R. Beaudry, 2011. Use of combinations of commercially relevant O2 and CO2 partial pressures to evaluate the sensitivity of nine highbush blueberry fruit cultivars to controlled atmospheres. Hortscience 46:74-79.
Angeletti, P., H. Castagnasso, E. Miceli, L. Terminiello, A. Concellon, A. Chaves, and A.R. Vicente, 2010. Effect of preharvest calcium applications on postharvest quality, softening and cell wall degradation of two blueberry (Vaccinium corymbosum) varieties. Postharvest Biology and Technology 58:98-103.
Ballinger, W.E., E.P. Maness, and W.F. McClure, 1978. Relationship of stage of ripeness and holding temperature to decay development of blueberries. Journal of the American Society for Horticultural Science 103:130-134.
Ban, T., M. Kugishima, T. Ogata, S. Shiozaki, S. Horiuchi, and H. Ueda, 2007. Effect of ethephon (2-chloroethylphosphonic acid) on the fruit ripening characters of rabbiteye blueberry. Scientia Horticulturae 112:278-281.
Batisse, C., M. Buret, and P.J. Coulomb, 1996. Biochemical differences in cell wall of cherry fruit between soft and crisp fruit. Journal of Agricultural and Food Chemistry 44:453-457.
Beaudry, R.M., C.E. Moggia, J.B. Retamales, and J.F. Hancock, 1998. Quality of ‘Ivanhoe’ and ‘Bluecrop’ blueberry fruit transported by air and sea from Chile to North America. Hortscience 33:313-317.
Bellincontro, A., A. Fardelli, D. De Santis, R. Botondi, and F. Mencarelli, 2006. Postharvest ethylene and 1-MCP treatments both affect phenols, anthocyanins, and aromatic quality of Aleatico grapes and wine. Australian Journal of Grape and Wine Research 12:141-149.
Bonghi, C., F.M. Rizzini, A. Gambuti, L. Moio, L. Chkaiban, and P. Tonutti, 2012. Phenol compound metabolism and gene expression in the skin of wine grape (Vitis vinifera L.) berries subjected to partial postharvest dehydration. Postharvest Biology and Technology 67:102-109.

121
Bruce, D.M., 2003. Mathematical modelling of the cellular mechanics of plants. Philosophical Transactions of the Royal Society of London Series B-Biological Sciences 358:1437-1444.
Brummell, D.A., 2006. Cell wall disassembly in ripening fruit. Functional Plant Biology 33:103-119.
Camp, W.H., 1942. On the structure of populations in the genus Vaccinium. Brittonia 4:189-204.
Cano-Medrano, R. and R.L. Darnell, 1997. Cell number and cell size in parthenocarpic vs. pollinated blueberry (Vaccinium ashei) fruits. Annals of Botany 80:419-425.
Carpita, N.C. and D.M. Gibeaut, 1993. Structural models of primary cell walls in flowering plants – consistency of molecular structure with the physical properties of walls during growth. Plant Journal 3:1-30.
Chen, F., L. Zhang, H. An, H. Yang, X. Sun, H. Liu, Y. Yao, and L. Li, 2009. The nanostructure of hemicellulose of crisp and soft Chinese cherry (Prunus pseudocerasus L.) cultivars at different stages of ripeness. Lwt-Food Science and Technology 42:125-130.
Chervin, C., A. El-Kereamy, J.P. Roustan, A. Latche, J. Lamon, and M. Bouzayen, 2004. Ethylene seems required for the berry development and ripening in grape, a non-climacteric fruit. Plant Science 167:1301-1305.
Clark, J.R. and C.E. Finn, 2010. Register of new fruit and nut cultivars: list 45. Hortscience 45(5):721.
Coville, F.V., 1937. Improving the wild blueberry. USDA Yearbook 559-574.
Darnell, R.L., G.W. Stutte, G.C. Martin, G.A. Lang, and J.D. Early, 1992. “Developmental physiology of rabbiteye blueberry”. Horticultural Reviews vol. 13. Ed. J. Janick. New York: John Wiley & Sons, Inc., 339-405.
Darnell, R., P. Lyrene, J. Williamson, J. Olmstead, S. Sargent, W.Q. Yang, and J. Spiers, 2010. A multidisciplinary approach to sustainability and profitability of U.S. blueberry production using the tree-like species Vaccinium arboreum. HortScience 45(8):S199.
DeLong, J.M., R.K. Prange, C. Bishop, P.A. Harrison, and D.A.J. Ryan, 2003. The influence of 1-MCP on shelf-life quality of highbush blueberry. Hortscience 38:417-418.
Eck, P., 1970. Influence of ethrel upon highbush blueberry-D fruit ripening. Hortscience 5:23-25.

122
Ehlenfeldt, M.K. and R.B. Martin, 2002. A survey of fruit firmness in highbush blueberry and species-introgressed blueberry cultivars. Hortscience 37:386-389.
Ehlenfeldt, M.K., 2005. Fruit firmness and holding ability in highbush blueberry – implications for mechanical harvesting. International Journal of Fruit Science 5(3): 83-91.
Elfving, D.C., S.R. Drake, A.N. Reed, and D.B. Visser, 2007. Preharvest applications of sprayable 1-methylcyclopropene in the orchard for management of apple harvest and postharvest condition. Hortscience 42:1192-1199.
Esau, K., 1977. Anatomy of seed plants. New York: John Wiley & Sons, Inc.
Fava, J., S.M. Alzamora, and M.A. Castro, 2006. Structure and nanostructure of the outer tangential epidermal cell wall in Vaccinium corymbosum L. (Blueberry) fruits by blanching, freezing-thawing and ultrasound. Food Science and Technology International 12:241-251.
Forsyth, F.R., D.L. Craig, and R. Stark, 1977. Ethephon as a chemical harvesting aid for the late season highbush blueberry Coville. Canadian Journal of Plant Science 57:1099-1102.
Fralish, J.S., and S.B. Franklin, 2002. Taxonomy and Ecology of Woody Plants in North American Forests. New York: John Wiley & Sons, Inc..
Ghiani, A., N. Negrini, S. Morgutti, F. Baldin, F.F. Nocito, A. Spinardi, I. Mignani, D. Bassi, and M. Cocucci, 2011. Melting of 'Big Top' Nectarine Fruit: Some Physiological, Biochemical, and Molecular Aspects. Journal of the American Society for Horticultural Science 136:61-68.
Godoy, C., G. Monterubbianesi, and J. Tognetti, 2008. Analysis of highbush blueberry (Vaccinium corymbosum L.) fruit growth with exponential mixed models. Scientia Horticulturae 115:368-376.
Gough, R.E., 1983. The occurrence of mesocarpic stone cells in the fruit of cultivated highbush blueberry. Journal of the American Society for Horticultural Science108:1064-1067.
Gough, R.E., 1994. The highbush blueberry and its management. The Haworth Press, Inc. Binghampton, NY.
Goulao, L.F. and C.M. Oliveira, 2008. Cell wall modifications during fruit ripening: when a fruit is not the fruit. Trends in Food Science & Technology 19:4-25.
Gross, K., 2004. The Commercial Storage of Fruits, Vegetables, and Florist and Nursery Stocks. USDA/ARS Agriculture Handbook Number 66. http://www.ba.ars.usda.gov/hb66/
123
Haji, T., H. Yaegaki, and M. Yamaguchi, 2005. Inheritance and expression of fruit texture melting, non-melting and stony hard in peach. Scientia Horticulturae 105:241-248.
Hancock, J., P. Callow, S. Serce, E. Hanson, and R. Beaudry, 2008. Effect of cultivar, controlled atmosphere storage, and fruit ripeness on the long-term storage of highbush blueberries. Horttechnology 18:199-205.
Harker, F.R., R.J. Redgwell, I.C. Hallett, S.H. Murray, and G. Carter, 1997. Texture of fresh fruit. Horticultural Reviews 20:121-224.
Hatfield, R. and W. Vermerris, 2001. Lignin formation in plants-The dilemma of linkage specificity. Plant Physiology 126:1351-1357.
Huber, D.J., 2008. Suppression of ethylene responses through application of 1-methylcyclopropene: A powerful tool for elucidating ripening and senescence mechanisms in climacteric and nonclimacteric fruits and vegetables. Hortscience 43:106-111.
Iannetta, P.P.M., L.J. Laarhoven, N. Medina-Escobar, E.K. James, M.T. McManus, H.V. Davies, and F.J.M. Harren, 2006. Ethylene and carbon dioxide production by developing strawberries show a correlative pattern that is indicative of ripening climacteric fruit. Physiologia Plantarum 127:247-259.
Ismail, A.A. and W.J. Kender, 1969. Evidence of a respiratory climacteric in highbush blueberry-D and lowbush blueberry-D fruit. Hortscience 4:342-344.
Iwatani, S.-i., H. Yakushiji, N. Mitani, and N. Sakurai, 2011. Evaluation of grape flesh texture by an acoustic vibration method. Postharvest Biology and Technology 62:305-309.
Jackman, R.L., and D.W. Stanley, 1995. Perspectives in the textural evaluation of plant foods. Trends in Food Science & Technology 6:187-194.
Janes, H.W., C.K. Chin, and C. Frenkel, 1978. Respiratory upsurge in blueberries and strawberries as influenced by ethylene and acetaldehyde. Botanical Gazette 139:50-52.
Jiang, Y.M., D.C. Joyce, and L.A. Terry, 2001. 1-Methylcyclopropene treatment affects strawberry fruit decay. Postharvest Biology and Technology 23:227-232.
Johnson, L.K., A. Malladi, and D.S. NeSmith, 2011. Differences in cell number facilitate fruit size variation in Rabbiteye blueberry genotypes. Journal of the American Society for Horticultural Science 136:10-15.
Kader, A., B. Hess-Pierce, and E. Almenar, 2003. Relative contribution of fruit constituents to soluble solids content measured by a refractometer. . Hortscience 38:833.
124
King, G.J., C. Maliepaard, J.R. Lynn, F.H. Alston, C.E. Durel, K.M. Evans, B. Griffon, F. Laurens, A.G. Manganaris, T. Schrevens, S. Tartarini, and J. Verhaegh, 2000. Quantitative genetic analysis and comparison of physical and sensory descriptors relating to fruit flesh firmness in apple (Malus pumila Mill.). Theoretical and Applied Genetics 100:1074-1084.
Knox, J.P., 2008. Revealing the structural and functional diversity of plant cell walls. Current Opinion in Plant Biology 11:308-313.
Laurentin, A. and C.A. Edwards, 2003. A microtiter modification of the anthrone-sulfuric acid colorimetric assay for glucose-based carbohydrates. Analytical Biochemistry 315:143-145.
Lee, K.J.D., S.E. Marcus, and J.P. Knox, 2011. Cell Wall Biology: Perspectives from Cell Wall Imaging. Molecular Plant 4:212-219.
Lelievre, J.M., A. Latche, B. Jones, M. Bouzayen, and J.C. Pech, 1997. Ethylene and fruit ripening. Physiologia Plantarum 101:727-739.
Li, X., C. Xu, S.S. Korban, and K. Chen, 2010. Regulatory mechanisms of textural changes in ripening fruits. Critical Reviews in Plant Sciences 29:222-243.
Li, C., G.W. Krewer, P. Ji, H. Scherm, and S.J. Kays, 2010. Gas sensor array for blueberry fruit disease detection and classification. Postharvest Biology and Technology 55:144-149.
Li, C., J. Luo, and D. MacLean, 2011. A novel instrument to delineate varietal and harvest effects on blueberry fruit texture during storage. Journal of the Science of Food and Agriculture 91:1653-1658.
Lyrene, P.M., 1993. Some problems and opportunities in blueberry breeding. Acta Horticulturae 346:63-71.
Lyrene, P.M., 1997. Value of various taxa in breeding tetraploid blueberries in Florida. Euphytica 94:15-22.
Lyrene, P., 2002. Development of highbush blueberry cultivars adapted to Florida. Journal American Pomological Society 56:79-85.
Lyrene, P.M., 2011. First Report of Vaccinium arboreum Hybrids with cultivated highbush blueberry. Hortscience 46:563-566.
Lyrene, P.M., N. Vorsa, and J.R. Ballington, 2003. Polyploidy and sexual polyploidization in the genus Vaccinium. Euphytica 133:27-36.
MacLean, D.D. and D.S. NeSmith, 2011. Rabbiteye blueberry postharvest fruit quality and stimulation of ethylene production by 1-Methylcyclopropene. Hortscience 46:1278-1281.

125
Malladi, A., I. Vashisth, and S. NeSmith, 2013. Development and evaluation of a portable, handheld mechanical shaker to study fruit detachment in blueberry. Hortscience 48:394-397.
Malladi, A., T. Vashisth, and L.K. Johnson, 2012. Ethephon and methyl jasmonate affect fruit detachment in Rabbiteye and southern highbush blueberry. Hortscience 47:1745-1749.
Mann, H., D. Bedford, J. Luby, Z. Vickers, and C. Tong, 2005. Relationship of instrumental and sensory texture measurements of fresh and stored apples to cell number and size. Hortscience 40:1815-1820.
McArtney, S.J., J.D. Obermiller, T. Hoyt, and M.L. Parker, 2009. 'Law Rome' and 'Golden Delicious' Apples Differ in Their Response to Preharvest and Postharvest 1-Methylcyclopropene Treatment Combinations.Hortscience 44:1632-1636.
Mehra, L.K., D.D. MacLean, A.T. Savelle, and H. Scherm, 2013. Postharvest disease development on southern highbush blueberry fruit in relation to berry flesh type and harvest method. Plant Disease 97:213-221.
Meullenet, J.F., R. Xiong, and C.J. Findlay, 2007. Multivariate and probabilistic analyses of sensory science problems. Blackwell.
Miesle, T.J., A. Proctor, and L.M. Lagrimini, 1991. Peroxidase activity, isoenzymes, and tissue localization in developing highbush blueberry fruit. Journal of the American Society for Horticultural Science 116:827-830.
Moore, J.N., 1965. Improving highbush blueberries by breeding and selection. Euphytica 14:39-48.
NeSmith, D.S., A. Nunez-Barrios, S.E. Prussia, and D. Aggarwal, 2005. Postharvest berry quality of six rabbiteye blueberry cultivars in response to temperature. Journal of the American Pomological Society 59:13-17.
NeSmith, D.S., S. Prussia, M. Tetteh, and G. Krewer, 2002. Firmness losses of rabbiteye blueberries (Vaccinium ashei Reade) during harvesting and handling, p. 287-293. In: R.F. Hepp (ed.), Acta Horticulturae.
Okie, W.R., 1999. Register of new fruit and nut varieties - List 39. Hortscience 34:181-205.
Olmstead, J., 2011. Banking on berries with bite. Florida Grower 104(10):32-33.
Padley, L., 2005. Firmness and storage characteristics of crisp-textured blueberries. University of Florida Thesis.

126
Paniagua, A.C., A.R. East, J.P. Hindmarsh, and J.A. Heyes, 2013. Moisture loss is the major cause of firmness change during postharvest storage of blueberry. Postharvest Biology and Technology 79:13-19.
Peterson, D.L., S.D. Wolford, E.J. Timm, and F. Takeda, 1997. Fresh market quality blueberry harvester. Transactions of the Asae 40:535-540.
Proctor, A. and T.J. Miesle, 1991. Polygalacturonase and pectinmethylesterase activities in developing highbush blueberries. Hortscience 26:579-581.
Redgwell, R.J., E. MacRae, I. Hallett, M. Fischer, J. Perry, and R. Harker, 1997. In vivo and in vitro swelling of cell walls during fruit ripening. Planta 203:162-173.
Rhodes, M.J.C., 1970. The climacteric and ripening of fruits.
Rosenfeld, H.J., K.R. Meberg, K. Haffner, and H.A. Sundell, 1999. MAP of highbush blueberries: sensory quality in relation to storage temperature, film type and initial high oxygen atmosphere. Postharvest Biology and Technology 16:27-36.
Ross, C.F., M.A. Chauvin, and M. Whiting, 2009. Firmness evaluation of sweet cherries by a trained and consumer sensory panel. Journal of Texture Studies 40:554-570.
Ruzin, S.E., 1999. Plant microtechnique and microscopy. Oxford University Press.
Saftner, R., J. Polashock, M. Ehlenfeldt, and B. Vinyard, 2008. Instrumental and sensory quality characteristics of blueberry fruit from twelve cultivars. Postharvest Biology and Technology 49:19-26.
Sargent, S.A., A.D. Berry, J.G. Williamson, and J. Olmstead, 2010. Fruit detachment force of southern highbush blueberry: An aid to selection of cultivars suitable for mechanical harvest. Hortscience 45:S306-S306.
Sato, A. and M. Yamada, 2003. Berry texture of table, wine, and dual-purpose grape cultivars quantified. Hortscience 38:578-581.
Sato, A., H. Yamane, N. Hirakawa, K. Otobe, and M. Yamada, 1997. Varietal differences in the texture of grape berries measured by penetration tests. Vitis 36:7-10.
Scalzo, J., S. Dierking, W. Dierking, S. Miller, C. Edwards, and P. Alspach, 2009. 'Hortblue Poppins': new cultivar for the home garden, p. 157-162. In: K.E. Hummer, B.C. Strik, and C.E. Finn (eds.), Acta Horticulturae.
Shackel, K.A., C. Greve, J.M. Labavitch, and H. Ahmadi, 1991. Cell turgor changes associated with ripening in tomato pericarp tissue. Plant Physiology 97:814-816.
Sharpe, R.H., 1953. Horticultural development of Florida blueberries. Proceedings of the Florida State Horticultural Society, 1953:188-190.

127
Sharpe, R.H. and W.B. Sherman, 1976. Sharpeblue blueberry. Hortscience 11:65-65.
Shutak, V.G., and P.E. Marucci, 1966. “Plant and fruit development”. Blueberry Culture. Ed. P. Eck. New Brunswick: Rutgers University Press.
Shutak, V.G., R.E. Gough, and N.D. Windus, 1980. The cultivated highbush blueberry: Twenty years of research. Rhode Island Agr. Expt. Sta. Bul. 428.
Shimura, I., M. Kobayashi, and S. Ishikawa, 1986. Characteristics of fruit growth and development in highbush and Rabbiteye blueberries (Vaccinium corymbosum L) and Vaccinium-ashei reade) and the differences among their cultivars. Journal of the Japanese Society for Horticultural Science 55:46-50.
Silva, J.L., E. Marroquin, F.B. Matta, J.O. Garner Jr., and J. Stojanovic, 2005. Physiochemical, carbohydrate and sensory characteristics of highbush and Rabbiteye blueberry cultivars. Journal of the Science of Food and Agriculture. 85: 1815–1821.
Strik, B.C. and D. Yarborough, 2005. Blueberry production trends in North America, 1992 to 2003, and predictions for growth. Horttechnology 15:391-398.
Suzuki, A., T. Kikuchi, and K. Aoba, 1997. Changes of ethylene evolution, ACC content, ethylene forming enzyme activity and respiration in fruits of highbush blueberry. Journal of the Japanese Society for Horticultural Science 66:23-27.
Szczesniak, A.S., 2002. Texture is a sensory property. Food Quality and Preference 13:215-225.
Takeda, F., G. Krewer, E.L. Andrews, B. Mullinix, Jr., and D.L. Peterson, 2008. Assessment of the v45 blueberry harvester on Rabbiteye blueberry and Southern highbush blueberry pruned to V-shaped canopy. Horttechnology 18:130-138.
Takeda, T., G. Krewer, C. Li, D. MacLean, and J.W. Olmstead, 2013. Techniques for increasing machine-harvest efficiency in blueberries. HortTechnology (accepted).
Tao, S., S. Khanizadeh, H. Zhang, and S. Zhang, 2009. Anatomy, ultrastructure and lignin distribution of stone cells in two Pyrus species. Plant Science 176:413-419.
Tataranni, G., A. Spada, C. Pozzi, and D. Bassi, 2010. AFLP-based segregant analysis for tagging the slow ripening trait in peach [Prunus persica (L.) Batsch]. Journal of Horticultural Sciences & Biotechnology 85:78-82.
Tetteh, M.K., S.E. Prussia, D.S. NeSmith, B.P. Verma, and D. Aggarwal, 2004. Modeling blueberry firmness and mass loss during cooling delays and storage. Transactions of the Asae 47:1121-1127.

128
Thomas, T.R., K.A. Shackel, and M.A. Matthews, 2008. Mesocarp cell turgor in Vitis vinifera L. berries throughout development and its relation to firmness, growth, and the onset of ripening. Planta 228:1067-1076.
Tian, M.S., S. Prakash, H.J. Elgar, H. Young, D.M. Burmeister, and G.S. Ross, 2000. Responses of strawberry fruit to 1-Methylcyclopropene (1-MCP) and ethylene. Plant Growth Regulation 32:83-90.
Tong, C., D. Krueger, Z. Vickers, D. Bedford, J. Luby, A. El-Shiekh, K. Shackel, and H. Ahmadi, 1999. Comparison of softening-related changes during storage of 'Honeycrisp' apple, its parents, and 'Delicious'. Journal of the American Society for Horticultural Science 124:407-415.
Tunick, M.H., 2011. Food Texture Analysis in the 21st Century. Journal of Agricultural and Food Chemistry 59:1477-1480.
USDA National Agricultural Statistics Service, 2009. http://usda.mannlib.cornell.edu/MannUsda/viewDocumentInfo.do?documentID=1765
USDA. United States Department of Agriculture National Agricultural Statistics Service: Non-citrus Fruits and Nuts 2012 Preliminary Summary. January 2013. http://usda01.library.cornell.edu/usda/nass/NoncFruiNu//2010s/2013/NoncFruiNu-01-25-2013.pdf
Uttal, L.J., 1987. The genus Vaccinium L (Ericaceae) in Virginia. Castanea 52:231-255.
van Dalfsen, K.B. and M.M. Gaye, 1999. Yield from hand and mechanical harvesting of highbush blueberries in British Columbia. Applied Engineering in Agriculture 15:393-398.
van den Hoogen, B.M., P.R. van Weeren, M. Lopes-Cardozo, L.M.G. van Golde, A. Barneveld, and C.H.A. van de Lest, 1998. A microtiter plate assay for the determination of uronic acids. Analytical Biochemistry 257:107-111.
Vander Kloet, S.P., 1983. The taxonomy of Vaccinium section Cyanococcus a summation. Canadian Journal of Botany 61:255-266.
Vashisth, T., S. Pattathil, M. Hahn, and A. Malladi, 2012. Identification of changes in the glycome profile of cell walls during blueberry fruit abscission. ASHS Annual Conference – Oral Session Abstracts: 12.
Vermerris, W., 2008. “Composition and biosynthesis of lignocellulosic biomass”. Genetic improvement of Bioenergy crops. Ed. W. Vermerris. Springer Science+Business Media LLC. 89-129.
Vicente, A.R., C. Ortugno, H. Rosli, A.L.T. Powell, L.C. Greve, and J.M. Labavitch, 2007. Temporal sequence of cell wall disassembly events in developing fruits. 2.

129
Analysis of blueberry (Vaccinium Species). Journal of Agricultural and Food Chemistry 55:4125-4130.
Walters, D.R., and D.J. Keil, 1996. Vascular plant taxonomy. Kendall/Hunt Publishing Company. Iowa.
Ward, D.B., 1974. Contributions to the flora of Florida USA part 6 Vaccinium ericaceae. Castanea 39:191-205.
Warren, J.M., W.E. Ballinger, and C.M. Mainland, 1973. Effects of ethephon upon fruit development and ripening of highbush blueberries in the greenhouse. HortScience 8:504-507.
Willats, W.G.T, J.P. Knox, and J.D. Mikkelsen, 2006. Pectin: new insights into an old polymer are starting to gel. Trends in Food Science & Technology 17:97-104.
Williamson, J.G., F.S. Davies, and P.M. Lyrene, 2004. Pruning blueberry plants in Florida. 19 March 2013. <http://edis.ifas.ufl.edu/hs223>.
Williamson, J.G., P.F. Harmon, O.E. Liburd, and P. Dittmar, 2013. 2013 Florida blueberry integrated pest management guide. 19 March 2013. <http://edis.ifas.ufl.edu/hs380>.
Windus, N.D., V.G. Shutak, and R.E. Gough, 1976. CO2 and C2H4 evolution by highbush blueberry fruit. Hortscience 11:515-517.
Worch, T., S. Le, and P. Punter, 2010. How reliable are the consumers? Comparison of sensory profiles from consumers and experts. Food Quality and Preference 21:309-318.
Zablackis, E., J. Huang, B. Muller, A.G. Darvill, and P. Albersheim, 1995. Structure of plant cell walls. 34. Characterization of the cell wall polysaccharides of Arabidopsis thaliana leaves. Plant Physiology 107:1129-1138.
Zheng, Y., Z. Yang, and X. Chen, 2008. Effect of high oxygen atmospheres on fruit decay and quality in Chinese bayberries, strawberries and blueberries. Food Control 19:470-474.

130
BIOGRAPHICAL SKETCH
Kendra was born to Donald and Susan Blaker in Bradenton, Florida. She is the
third of four children: Bryan, Amber, and Courtney. She is sister-in-law to Mark Mattson
and Melissa Blaker and the proud aunt of seven beautiful nieces: Annabelle, Grace,
Selah, Aubrey, Georgia, Aniyah, and Tovah.
Kendra received her primary education in Manatee County public schools, and
earned a Bachelor of Science degree in biochemistry from Berry College, Rome,
Georgia, and a Master of Arts degree in theology from Gordon-Conwell Theological
Seminary, South Hamilton, Massachusetts. In 2006, she moved to Gainesville, FL and
taught in the secondary school at Cornerstone Academy. In 2007, she was admitted to
the stone-fruit breeding program of Dr. José Chaparro at the University of Florida, and
graduated with a Master of Science in Horticultural Sciences in May 2010. That same
semester she began research as a doctoral student in the blueberry breeding program
of Dr. James Olmstead at the University of Florida. Upon completing her Ph.D, she
hopes to find work in horticultural plant breeding.