comparison of conventional vs. modular hydrogen refueling ... · hydrogen on-site via smr or...
TRANSCRIPT

Comparison of conventional vs modular hydrogen refueling stations and on-site production vs delivery
Ethan S Hecht Joseph Pratt Sandia National Laboratories
Prepared by Sandia National Laboratories Albuquerque New Mexico 87185 and Livermore California 94550
Sandia National Laboratories is a multi-mission laboratory managed and operated by Sandia Corporashytion a wholly owned subsidiary of Lockheed Martin Corporation for the US Department of Energyrsquos National Nuclear Security Administration under contract DE-AC04-94AL85000
NREL is a national laboratory of the US Department of Energy Office of Energy Efficiency amp Renewshyable Energy operated by the Alliance for Sustainable Energy LLC under contract DE-AC36-08GO28308
Approved for public release further dissemination unlimited
SAND2017-2832
Comparison of conventional vs modular hydrogen refueling stations and on-site production vs delivery
Ethan S Hecht Joseph Pratt Sandia National Laboratories
Prepared by Sandia National Laboratories Albuquerque New Mexico 87185 and Livermore California 94550
Sandia National Laboratories is a multi-mission laboratory managed and operated by Sandia Corporation a wholly owned subsidiary of Lockheed Martin Corporation for the US Department of Energyrsquos National Nuclear Security Administration under contract DE-AC04-94AL85000
NREL is a national laboratory of the US Department of Energy Office of Energy Efficiency amp Renewable Energy operated by the Alliance for Sustainable Energy LLC under contract DE-AC36-08GO28308
Approved for public release further dissemination unlimited
SAND2017-2832
National Renewable Energy Laboratory Sandia National Laboratories 15013 Denver West Parkway Albuquerque New Mexico 87185 Golden Colorado 80401 Livermore California 94550 303-275-3000 middot wwwnrelgov wwwsandiagov
ii
Issued by Sandia National Laboratories operated for the United States Department of Energy by Sandia Corporation
NOTICE This report was prepared as an account of work sponsored by an agency of the United States Government Neither the United States Government nor any agency thereof nor any of their employees nor any of their contractors subcontractors or their employees make any warranty express or implied or assume any legal liability or responsibility for the accuracy completeness or usefulness of any information apparatus product or process disclosed or repshyresent that its use would not infringe privately owned rights Reference herein to any specific commercial product process or service by trade name trademark manufacturer or otherwise does not necessarily constitute or imply its endorsement recommendation or favoring by the United States Government any agency thereof or any of their contractors or subcontractors The views and opinions expressed herein do not necessarily state or reflect those of the United States Government any agency thereof or any of their contractors
Printed in the United States of America This report has been reproduced directly from the best available copy
Available to DOE and DOE contractors from US Department of Energy Office of Scientific and Technical Information PO Box 62 Oak Ridge TN 37831
Telephone (865) 576-8401 Facsimile (865) 576-5728 E-Mail reportsadonisostigov Online ordering httpwwwostigovbridge
Available to the public from US Department of Commerce National Technical Information Service 5285 Port Royal Rd Springfield VA 22161
Telephone (800) 553-6847 Facsimile (703) 605-6900 E-Mail ordersntisfedworldgov Online ordering httpwwwntisgovhelpordermethodsasploc=7-4-0online
DE
PA
RT
MENT OF EN
ER
GY
bull13 bull13UN
IT
ED
STATES OFA
M
ER
IC
A
iii
SAND2017-2832 Unlimited Release
Printed March 2017
Comparison of conventional vs modular hydrogen refueling stations and on-site production vs delivery
Ethan S Hecht and Joseph Pratt Sandia National Laboratories
Abstract
To meet the needs of public and private stakeholders involved in the development conshystruction and operation of hydrogen fueling stations needed to support the widespread roll-out of hydrogen fuel cell electric vehicles this work presents publicly available station templates and analyses These lsquoReference Stationsrsquo help reduce the cost and speed the deployment of hydrogen stations by providing a common baseline with which to start a design enable quick assessment of potential sites for a hydrogen station identify contributors to poor economics and suggest areas of research This work presents layouts bills of materials piping and inshystrumentation diagrams and detailed analyses of five new station designs In the near term delivered hydrogen results in a lower cost of hydrogen compared to on-site production via steam methane reforming or electrolysis although the on-site production methods have other advantages Modular station concepts including on-site production can reduce lot sizes from conventional assemble-on-site stations
iv
Executive Summary
For the wide-spread adoption of fuel cell electric vehicles (FCEVs) additional fueling stations need to be constructed in the US A wide variety of private and public stakeholders are involved in the development of this hydrogen fueling infrastructure Each stakeholder has particular needs to be met in the station planning development and operation process A sample of stakeholders and needs is given here
bull Station developersoperators (SDOs) quick evaluation of potential sites and needs lower investment risk general cost and return estimates
bull Local authorities understand devices components in a typical station bull Code developers understand near-term needs for code refinement bull Other analysis groups new tool and baseline for economic studies bull Businessesentrepreneurs and RampD organizations identification of near-term business
solution and technology needs bull Local municipalities and the general public high-level understanding of typical stations
lowering acceptance risk bull Funding and financing organizations understanding of current technological capabilities
costs and market needs
Hydrogen fueling station equipment designs and costs vary between developers and are often treated as proprietary information While necessary from a business standpoint this can hinder the ability to discuss station design details in a collaborative way
Publicly available templates of representative station designs can be used to meet many of the stakeholder needs outlined above These lsquoReference Stationsrsquo help reduce the cost and speed the deployment of hydrogen stations by providing a common baseline with which to start a design enable quick assessment of the suitability of a particular site for a hydrogen station and identify contributors to poor economics and areas of research needed for certain station designs This work presents five new reference station designs for use by the hydrogen infrastructure community The Phase 1 Reference Station Design Taskdagger examined four build-on-site stations which obtain hydrogen from compressed gas or liquid delivery trucks The current work builds on the Phase 1 work by producing designs and economic analyses of factory built lsquomodularrsquo stations and stations utilizing on-site generation and also brings the cost of supplied hydrogen into the analysis It includes one traditional design from the Phase 1 work to enable equal comparisons between all station types in the two works For all station types three capacities were examined 100 kgday 200 kgday and 300 kgday The five station types developed in this work are
bull Conventional (assemble-on-site) stations with hydrogen 1 delivered as compressed gas from a centralized already operational production facility
(baseline) 2 produced on-site through steam methane reforming (SMR) 3 produced on-site through electrolysis
daggerJ Pratt D Terlip C Ainscough J Kurtz and A Elgowainy H2FIRST reference station design task Technishycal Report SAND2015-2660R Sandia National Laboratories April 2015 Available at httpenergygoveere fuelcellsh2first
v
bull Modular fueling stations with hydrogen 4 delivered as compressed gas from a centralized production facility 5 produced on-site through electrolysis
The cost components of hydrogen fueling stations consist of capital cost of equipment instalshylation site acquisition and development and operating expenses For conventional stations capital costs of the equipment were estimated based on updated bills of material from the Phase 1 work Capital costs for modular stations and modular hydrogen production units were based on discusshysions with several manufacturers Operation costs such as the cost of electricity and other utilities if necessary were estimated using data from several sources
Revenue is assumed to be solely from the sale of hydrogen Operating expenses and revenue calculations depend on the assumed throughput of hydrogen The same utilization profile used in the Phase 1 work was used herein to calculate throughput although it was delayed in the onset year This utilization model estimates that starting in 2017 5 of station capacity will be utilized As the number of fuel cell vehicles on the roads continues to increase the utilization of stations is projected to increase up to a maximum of 80 in 2026 All costs were combined with revenue to determine the overall cost of hydrogen to the SDO such that the station will break even on investments in 7 years SDO margin and retail fuel taxes will be added to the calculated hydrogen cost to determine the final price to the consumer but both of these aspects are outside the scope of this work
Because the costs in this work are estimated (typically averages of costs from various situations andor a range of manufacturers) they will likely be different than that of an actual station To correct for differences in up-front capital or installation costs a graphical tool is included for the reader to estimate the resulting change in hydrogen cost for a given change in investment cost For example the tool can be used to show that a decrease of $300000 in (depreciable) up-front costs from that estimated herein for a 300 kgday station would result in a corresponding $100kg decrease in hydrogen cost
Economic results of the five different station concepts show that stations served by centrally produced delivered gaseous hydrogen are more economical compared to those which generate hydrogen on-site via SMR or electrolysis Higher capacity stations have a lower cost for hydrogen to break even at the same point in time compared to lower capacity stations Using the economic model specifying that a station will break even in year 7 both 300 kgday modular stations (at $15M for the uninstalled modular unit) and conventional stations with central hydrogen production and delivery in tube-trailers have a hydrogen cost of $1425kg (a lower uninstalled modular unit price of $1M results in a hydrogen cost of $1266kg) On-site production stations either through steam methane reforming or electrolysis have significantly higher capital costs than delivered centrally produced hydrogen This increase in capital results in a hydrogen cost increase of $6shy$10kg depending on the station capacity While SMR capital costs are higher than electrolyzer costs the electricity cost ends up making electrolyzer-supplied stations the most expensive option in terms of resulting cost per kilogram of dispensed hydrogen under the assumptions of this work Full cost results are shown in Table ES-1 and Fig ES-1
In addition to the economics the station equipment was laid-out in typical land use arrange-
vi
$00M$05M$10M$15M$20M$25M$30M$35M$40M$45M
inst
all
ed
cost
($)
capacity (kgday)
100 200 300
conv
ention
al d
eliv
ered
gas
conv
ention
al S
MR
conv
ention
al e
lect
roly
sis
mod
ular
($1
5M
) d
eliv
ered
gas
mod
ular
($1
M) d
eliv
ered
gas
mod
ular
($1
5M
) e
lect
roly
sis
mod
ular
($1
M) e
lect
roly
sis
$0k
$5k
$10k
$15k
$20k
$25k
$30k
inst
all
ed
cost
($[
kg
day]
)
conv
ention
al d
eliv
ered
gas
conv
ention
al S
MR
conv
ention
al e
lect
roly
sis
mod
ular
($1
5M
) d
eliv
ered
gas
mod
ular
($1
M) d
eliv
ered
gas
mod
ular
($1
5M
) e
lect
roly
sis
mod
ular
($1
M) e
lect
roly
sis
$0$5
$10$15$20$25$30$35$40$45
H2 c
ost
($k
g)
capacity (kgday)
100 200 300
Figure ES-1 Installed cost (which includes site preparation enshygineering amp design permitting component capital and installation costs) are shown in the left frames The top frame is the total inshyvestment in 2016$ while the bottom left frame is the installed cost per mass of hydrogen dispensed (kgday) The hydrogen cost to break even at year 7 is shown in the right frame for the stations analyzed in this work
vii
Table ES-1 Installed cost (which includes site preparation enshygineering amp design permitting component capital and installation costs) and resulting hydrogen cost to break even at year 7 for the stations analyzed in this work
station capacity rarr 100 kgday 200 kgday 300 kgday
station type darr installed cost ($)
H2 cost ($kg)
installed cost ($)
H2 cost ($kg)
installed cost ($)
H2 cost ($kg)
conventional delivered H2 conventional SMR H2 conventional electrolysis H2 modular ($15M) delivered H2 modular ($1M) delivered H2 modular ($15M) electrolysis H2 modular ($1M) electrolysis H2
$151M $274M $238M $186M $136M $274M $224M
$3053 $3847 $3966 $3390 $2912 $4303 $3825
$169M $383M $298M $186M $136M $314M $264M
$1837 $2596 $2651 $1916 $1677 $2730 $2491
$186M $443M $345M $186M $136M $345M $295M
$1426 $2023 $2174 $1425 $1265 $2173 $2013
ments Modular stations and stations with on-site production show a substantial decrease in overall required lot size due to reduced equipment size reduced truck access requirements and reduced setback distances The included piping and instrumentation diagram shows the system level reshyquirements for components and instruments and includes an estimate of utility requirements which are intended to be useful for site screening
This work details the economics of current hydrogen refueling stations and includes some sketches of what these fueling stations might look like It visually depicts the contributions to capital and operational costs of hydrogen for different station concepts making it easy to find the largest contributors to a high cost of hydrogen to the consumer This information can be used to devote research and development towards these high contributors At the station the dispenser compressors and chillers are expensive pieces where additional development or higher volume production could reduce station costs For electrolysis the purchase of low-priced electricity could serve to make on-site production cost competitive with central production and delivery This report enables the comparison of different station concepts that could be implemented in various market scenarios
viii
Acknowledgment
This work is funded by the US Department of Energy (DOE) Fuel Cell Technologies Office in the Office of Energy Efficiency and Renewable Energy
The Hydrogen Fueling Infrastructure Research and Station Technology Project (H2FIRST) is a DOE project executed by Sandia National Laboratories and the National Renewable Energy Labshyoratory The objective of H2FIRST is to ensure that fuel cell electric vehicle customers have a positive fueling experience relative to conventional gasolinediesel stations as vehicles are introshyduced (2015ndash2017) and transition to advanced refueling technology beyond 2017
DOEs Fuel Cell Technologies Office established H2FIRST directly in support of H2USA a public-private collaboration co-launched by DOE and industry in 2013 to address the key chalshylenges of hydrogen infrastructure
In addition to DOE the team wishes to thank the H2USA Hydrogen Fueling Station Working Group California Fuel Cell Partnership the California Energy Commission the California Air Reshysources Board and representatives from industry including H2 Logic Hydrogenics ITM Power Linde Nuvera PDC Machines Proton OnSite and Siemens AG for their input and support
ix
x
Contents
Executive Summary v 1 Introduction 1
11 Background and Contents 1 12 Approach 3 13 Method Overview 3
2 Station Cost Components 10 21 Centrally Produced Hydrogen and Delivery 10 22 Hydrogen Produced On-site via Steam Methane Reforming 13 23 Hydrogen Produced On-site via Electrolysis 14 24 Compression Storage and Ancillary Equipment for a Conventional Station 15 25 Packaged Compression Storage and Ancillary Equpiment for a Modular Station 17 26 Hydrogen Dispensers 18
3 Results Station Designs and Costs 19 31 Conventional Station with Delivered Centrally Produced Hydrogen 19 32 Conventional Station with Hydrogen Produced On-site via Steam Methane Reshy
forming 25 33 Conventional Station with Hydrogen Produced On-site via Electrolysis 27 34 Modular Station with Delivered Centrally Produced Hydrogen 31 35 Modular Station with Hydrogen Produced On-site via Electrolysis 35
4 Conclusions 39
Appendix
A Piping amp Instrumentation Diagram 42 References 45
Figures
ES-1 Installed cost (which includes site preparation engineering amp design permitting component capital and installation costs) are shown in the left frames The top frame is the total investment in 2016$ while the bottom left frame is the installed cost per mass of hydrogen dispensed (kgday) The hydrogen cost to break even at year 7 is shown in the right frame for the stations analyzed in this work vii
1 Historical and projected price of US No 2 Diesel (top) natural gas (middle) and electricity (bottom) from EIA data [1] 5
2 Utilization model from 2017 to 2036 of the theoretical hydrogen fueling stations in this report 6
xi
3 Additional cost of hydrogen given initial constructioncapital investment for the station utilization profile shown in Fig 2 Numbers on the graph lines are the years required to break even on the investment solid lines are for a depreciable asset (on a 7 year MACRS schedule) and dashed lines are for a non-depreciable asset Points on the plots are examples from the text 9
4 Breakdown of annual costs associated with delivery of hydrogen for a 100 (left) 200 (center) and 300 (right) kgday station Does not include the cost of hydrogen production or transport trailer 11
5 Cost for centralized production of hydrogen for the model used in this study and an H2A model (based on 380000 kgday production) [2] 12
6 Total costs associated with central production of hydrogen delivery and storage in a tube-trailer for a 100 (left) 200 (center) and 300 (right) kgday hydrogen refueling station 13
7 Annual production cost of 500 kgday hydrogen from distributed steam methane reforming as predicted by the current model and using the H2A production model 14
8 Cost and revenue associated with a conventional assemble-on-site station with centrally produced delivered hydrogen to break even at year 7 (2023) The net income includes the effects from depreciation and taxes Capital replacement costs and intervals are not included in this model (accuracy past 2023 is limited) Pie charts on the right show the breakdown of cumulative capital and operating costs over the 7-year analysis period to the cost of dispensed hydrogen 20
9 Renderings of a conventional station layout with delivered gaseous hydrogen 24
10 Cost and revenue associated with a conventional assemble-on-site station with on-site steam methane reforming produced hydrogen to break even at year 7 (2023) The net income includes the effects from depreciation and taxes Capital replaceshyment costs and intervals are not included in this model Pie charts on the right show the breakdown of cumulative capital and operating costs over the 7-year analysis period to the cost of dispensed hydrogen 26
11 Renderings of a conventional station layout with on-site production of hydrogen 28
12 Cost and revenue associated with a conventional assemble-on-site station with on-site electrolysis produced hydrogen to break even at year 7 (2023) The net income includes the effects from depreciation and taxes Capital replacement costs and intervals are not included in this model Pie charts on the right show the breakshydown of cumulative capital and operating costs over the 7-year analysis period to the cost of dispensed hydrogen 29
13 Cost and revenue associated with a modular station with centrally produced deshylivered hydrogen to break even at year 7 (2023) assuming a $15M uninstalled capital cost of the modular station The net income includes the effects from deshypreciation and taxes Capital replacement costs and intervals are not included in this model Pie charts on the right show the breakdown of cumulative capital and operating costs over the 7-year analysis period to the cost of dispensed hydrogen 32
14 Renderings of a modular station layout with delivered hydrogen 34
xii
15 Cost and revenue associated with a modular station with on-site electrolysis proshyduced hydrogen to break even at year 7 (2023) assuming a $15M uninstalled capital cost of the modular station The net income includes the effects from deshypreciation and taxes Capital replacement costs and intervals are not included in this model Pie charts on the right show the breakdown of cumulative capital and operating costs over the 7-year analysis period to the cost of dispensed hydrogen 36
16 Renderings of a modular station layout with an electrolyzer for on-site production with a small reduced footprint 37
17 Installed cost (which includes site preparation engineering amp design permitting component capital and installation costs) are shown in the left frames The top frame is the total investment in 2016$ while the bottom left frame is the installed cost per mass of hydrogen dispensed (kgday) The hydrogen cost to break even at year 7 is shown in the right frame for the stations analyzed in this work 40
Tables
ES-1 Installed cost (which includes site preparation engineering amp design permitting component capital and installation costs) and resulting hydrogen cost to break even at year 7 for the stations analyzed in this work viii
1 Economically favorable station designs from the Phase 1 Reference Station Design Task [3] that were fully analyzed 2
2 Water costs in various locations in California 6 3 Data used to calculate delivered hydrogen costs 11 4 Equipment needed for a conventional hydrogen fueling station and estimated costs
(inflation adjusted from [3] or reassessed as described in the text) 16 5 Installed cost (which includes site preparation engineering amp design permitting
capital and installation costs) and hydrogen cost for conventional stations with centrally produced delivered hydrogen 22
6 Installed cost (which includes site preparation engineering amp design permitting capital and installation costs) and hydrogen cost for conventional stations with SMR on-site 25
7 Installed cost (which includes site preparation engineering amp design permitting capital and installation costs) and hydrogen cost for conventional stations with electrolysis on-site 30
8 Installed cost (which includes site preparation engineering amp design permitting capital and installation costs) and hydrogen cost for modular stations with delivshyered hydrogen for two cases of uninstalled modular cost $15M and $10M 31
9 Installed cost (which includes site preparation engineering amp design permitting capital and installation costs) and hydrogen cost for modular stations with on-site electrolysis produced hydrogen for two cases of uninstalled modular cost $15M and $10M 35
xiii
10 Installed cost (which includes site preparation engineering amp design permitting component capital and installation costs) and resulting hydrogen cost to break even at year 7 for the stations analyzed in this work 39
A1 Utility requirement estimateslowast for the stations in this report 42
xiv
1 Introduction
The Hydrogen Fueling Infrastructure Research and Station Technology Project (H2FIRST) is a US Department of Energy (DOE) project executed by Sandia National Laboratories and the Nashytional Renewable Energy Laboratory The objective of H2FIRST is to ensure that fuel cell electric vehicle (FCEV) customers have a positive hydrogen fueling experience relative to conventional gasolinediesel fueling stations as FCEVs are introduced and to enable any needed transitions to advanced refueling technology in the future
For the wide-spread adoption of fuel cell electric vehicles (FCEVs) additional fueling stations need to be constructed in the US This work provides economic analyses and layouts of current-technology fueling station designs that utilize state-of-the-art components These reference station designs can help reduce the cost and speed the deployment of hydrogen stations by providing a common baseline with which to start a design enable quick assessment of the suitability of a particular site for a hydrogen station and identify contributors to poor economics and areas of research needed for certain station designs
This work is intended to address the needs of a wide variety of stakeholders Some examples of stakeholders and applicability include
bull Station developersoperators (SDOs) quick evaluation of potential sites and needs lower investment risk general cost and return estimates
bull Local authorities understand devices components in a typical station bull Code developers understand near-term needs for code refinement bull Other analysis groups new tool and baseline for economic studies bull Businessesentrepreneurs and RampD organizations identification of near-term business
solution and technology needs bull Local municipalities and the general public high-level understanding of typical stations
lowering acceptance risk bull Funding and financing organizations understanding of current technological capabilities
costs and market needs
11 Background and Contents
This is a follow-on work to the Phase 1 Reference Station Design Task [3] That work screened 160 different station permutations and found 4 near-term station designs that were economically favorable and one future station The report provides thorough designs of these stations with bills of materials layouts on greenfields and co-located with gasoline stations and piping and instrumentation diagrams The resulting capital and hydrogen costs for the selected stations in that analysis are reprinted here in Table 1
However the cost of the hydrogen was not included in the analysis only the capital and opshyerating costs associated with the fueling station (ie compression high-pressure storage cooling and dispensing) In addition the Phase 1 Reference Station project did not consider on-site hyshy
1
Table 1 Economically favorable station designs from the Phase 1 Reference Station Design Task [3] that were fully analyzed
Target Market
Delivery Method
Daily Capacity (kgday)
Maximum Consecutive Fills
Hoses Hydrogen Costlowast
($kg)
Capital Cost (2009$)
high use high use
liquid liquid
300 300
5 5
2 2
$746dagger
ndash $1486557dagger
$2007358Dagger
high use low use
gas gas
300 200
6 3
1 1
$603 $782sect
$1251270 $1097560sect
intermittent gas 100 2 1 $1328 $954799 lowast Hydrogen cost in this table is only the station contribution to the cost of hydrogen and does not
include the cost of hydrogen delivered to the station dagger Costs for this future station assume a high-pressure evaporator and cryopump which are not curshy
rently commercially available Dagger Consistent capital cost for a hydrogen fueling station that has hydrogen delivered as a liquid using
currently available technology but the cost of hydrogen could not be calculated using HRSAM [4] sect A typography error in the first report has been corrected for the hydrogen and capital cost of this
200 kgday station
drogen generation nor the impacts of lsquomodularrsquo stations where most components are pre-packaged in an assembly plant potentially reducing footprint and cost compared to traditional build-on-site stations
This work builds on the Phase 1 Reference Station work by producing designs and economic analyses of modular stations and stations utilizing on-site generation It also re-evaluates one traditional design from the Phase 1 Reference Station work to enable equal comparisons between all station types in the two works
In this report we describe many facets of designing hydrogen fueling stations In Section 12 Approach the station concepts are described In Section 13 Method Overview the steps to buildshying a fueling station are outlined the sources of economic data needed to calculate station operating costs are reported along with the station utilization profiles The Method Overview section is inshytended for readers who are interested in the assumptions and data used to determine the cost of hydrogen as the economic model is detailed in this section In Section 2 Station Cost Composhynents further details of the economic assumptions made about specific pieces of hydrogen fueling stations are included An experienced SDO may wish to skip to Section 3 Results Station Deshysigns and Costs which contains the detailed results of the economic model and includes sketches of hydrogen fueling stations
The wide variety of stakeholders on hydrogen refueling infrastructure and their interests means that some parts of the report will be more useful than others to different readers Rather than trying to simplify the report for one audience at the expense of another it is inclusive of all assumptions data and methods so that the reference stations described in this report can serve as a starting point for designs of real-world stations
2
12 Approach
In this work along with the costs associated with constructing and operating a hydrogen fueling station we also consider the costs of producing hydrogen on-site or having hydrogen produced at a centralized facility and delivered We also compare lsquoconventionalrsquo stations where parts (eg compressors tubing valves tanks) are assembled at the fueling station site to lsquomodularrsquo stations where parts (at least the compression and high-pressure storage if not the dispenser) are assembled at a centralized facility into a single unit and delivered to the fueling station site on a skid or in a trailer Five station concepts are considered herein
bull Conventional (assemble-on-site) stations with hydrogen 1 delivered as compressed gas from a centralized already operational production facility
(baseline) 2 produced on-site through steam methane reforming (SMR) 3 produced on-site through electrolysis
bull Modular fueling stations with hydrogen 4 delivered as compressed gas from a centralized production facility 5 produced on-site through electrolysis
For each of these concepts 100 200 and 300 kgday stations are studied since these capacities are appropriate for current and near-term station builds as identified in the Phase 1 Reference Station Design report [3] Costs (capital and operating) for each of these stations were estimated and the cost of hydrogen1 was calculated Components needed for each of these station concepts are specified and potential layouts are presented
13 Method Overview
Building a hydrogen fueling station requires several steps (which have associated costs andor considerations)
1 Identification and acquisition of land where the station can be built 2 Design of the station to account for the available space If hydrogen is to be delivered
delivery routes for the large tube-trailers must be planned 3 Design of utility connections including electrical power potentially water andor natural
gas bull Both conventional and modular stations require electrical power for the compressor
and chiller Trenching and conduit must be run transformers and electrical panels often require upgradingreplacement
bull On-site electrolysis requires a water supply (in addition to sufficient electrical power)
1In this work we refer to the cost of hydrogen rather than the price Using the method and assumptions described herein we calculate a per kg cost to a station developeroperator to provide hydrogen to consumers Station operators will be responsible for setting prices at their station which is what end consumers will pay for hydrogen and will vary based on local market demand profit margins retail fuel taxes and other considerations none of which are considered in this work The cost of hydrogen could be considered a lsquofixed minimum selling pricersquo to meet the payback criteria assumed in this analysis
3
bull On-site SMR requires water and natural gas (and sufficient electrical power) 4 Permitting and approval of the site design with the authorities having jurisdiction 5 Preparation of the site for station installation For a conventional station a concrete pad is
required and for modular stations concrete footings are needed at a minimum on which to secure the components or modular housing This concrete must be properly grounded and have a low electrical resistance to meet the fire code
6 Installation of the fueling station
In this analysis the costs of land procurement (step 1) are neglected Some costs in this analysis are based on the H2A Refueling Station Analysis Model (HRSAM) [4] In HRSAM the cost of installation of equipment (step 6) is 35 of the raw capital investment and the cost of site preparation engineering amp design project contingency and upfront permitting costs (steps 2-5) are 31 of the raw capital costs Accordingly here installation was assumed to cost 35 of the station capital for the conventional stations However since many of the modular installation costs are tied into the cost of the unit the cost of modular station installation is reduced to a flat cost of $60k (the details of this assumption can be found in Section 25) Also rather than using the percentage (31) for site preparation engineering amp design project contingency and upfront permitting costs in this analysis we assume a flat $300k for these costs This reflects the fact that these costs are linked more to the site itself rather than the cost and size of the equipment that must be installed on the site Since there is considerable variability in design permitting and site preparation costs we include additional analysis and charts showing how variability in these costs can change the cost of dispensed hydrogen later in this section
For all stations capital costs of the equipment were estimated Bills of materials for the conshyventional stations were assembled in the Phase 1 Reference Station Design Report [3] In this work we have updated these bills of material to estimate the cost of a conventional station today (2016) Capital costs for modular stations and modular hydrogen production units were based on discussions with several manufacturers For both the conventional and modular stations the design includes a single dispenser (ie credit card readeruser interface valving hose and nozshyzle to connect to the vehicle) able to dispense both 350 and 700 bar hydrogen located separately from the lsquostationrsquo (that contains the compressor high-pressure storage chiller programmable logic controller and safety equipment) Costs for specific components (eg compressors SMRs) are discussed in Section 2
In order to evaluate the operation costs the cost of several utilities and commodities namely diesel fuel natural gas electricity and water were needed With the exception of water these costs were estimated using pricing data from the US Energy Information Administration (EIA) [1] As shown in Fig 1 both historical and projected prices were extracted from the EIA database The data in the plots comes from the following series
bull Diesel ndash US No 2 Diesel Retail Prices Annual ndash Nominal Petroleum Prices Transportation Diesel Fuel Reference AEO2015
bull Natural gas ndash Retail Price of Natural Gas in Commercial Sector US Average Annual ndash Energy Prices Nominal Commercial Natural Gas United States Reference ndash Retail Price of Natural Gas in Industrial Sector US Average Annual
4
123456789
10
pri
ce (
nom
inal
$g
al)
diesel
0
5
10
15
20
25p
rice
(n
om
inal
$f
t3)
natural gas
commercial
industrial
1990 2000 2010 2020 2030 2040year
010
015
020
pri
ce (
nom
inal
$k
Wh
)
commercial electricity
Figure 1 Historical and projected price of US No 2 Diesel (top) natural gas (middle) and electricity (bottom) from EIA data [1]
ndash Energy Prices Nominal Industrial Natural Gas United States Reference AEO2015 bull Commercial electricity (US grid mix currently 13 renewable2)
ndash Retail Price of Electricity in Commercial Sector US Average Annual ndash Energy Prices Nominal Commercial Electricity United States Reference AEO2015
In all cases these data project out to 2045
It should be noted that the electricity prices estimated by EIA and used in this work assume status-quo reliance on fossil fuel In fact further cost reductions in renewable electricity generation
22015 estimate from httpwwweiagovtoolsfaqsfaqcfmid=92ampt=4
5
Table 2 Water costs in various locations in California
Location Price ($100 ft3) source
East Bay Los Angeles San Diego San Jose San Francisco San Francisco Peninsula
444 1022-10409 502 4509 714 7-8
ebmudcom dpwlacountygov sandiegogov sjwatercom sfwaterorg midpeninsulawaterorg
2020 2025 2030 2035year
0
20
40
60
80
100
uti
liza
tion
(
)
Figure 2 Utilization model from 2017 to 2036 of the theoretical hydrogen fueling stations in this report
technologies and utilization of low-cost stranded assets such as large nuclear coupled with increasshying fossil fuel costs may actually result in the opposite trend of future electricity rates As will be seen in the results variability in electricity rates can have a large impact on the cost effectiveness of on-site generation of hydrogen via electrolysis
Water is needed for electrolysis or steam methane reforming Water rates were estimated to be $8 per hundred cubic feet in 2016$ based on information from various sources of relevance to the California market shown in Table 2 While water rates can vary dramatically around the country as will be seen in the results the cost of water has a negligible impact on the resulting cost of hydrogen so using the California rates was deemed an acceptable approximation
In order to use this cost information to calculate operational costs and revenues a station utishylization rate must also be specified The same utilization profile used in Phase 1 of the Reference Station project [3] was used herein except the profile ramp has a delayed start as is suggested by a recent analysis by the California Air Resources Board [5] This profile is shown in Fig 2 As shown this utilization model estimates that starting in 2017 5 of station capacity will be utilized As the number of fuel cell vehicles on the roads continues to increase the utilization of stations is
6
projected to increase up to a maximum of 80 in 2026 This means for example that in 2026 and in perpetuity after a station sized for 100 kgday will sell on average 80 kgday hydrogen
Site preparation capital installation and operating costs were combined with hydrogen throughshyput and a required break-even time period on the initial investment to determine the overall cost of hydrogen to the SDO The estimates for these cost components are based on best-available inforshymation including consultation with station and equipment providers prior studies and government entities involved in publicly-funded stations However in most cases the estimated costs are avshyerages and can vary in practicendashfor example site preparation costs can vary widely or different manufacturers will have different costs for equipment with similar specifications If the reader has actual cost information that varies from that which is estimated in this report Fig 3 can be used to calculate the resulting change in hydrogen cost
Figure 3 shows the cost of hydrogen as a function of the initial non-depreciable cost by the dashed lines (eg land purchase costs) and an initial depreciable cost (eg equipment) by the solid lines Depreciation was estimated using a 7-year Modified Accelerated Cost Recovery System (MACRS) depreciation rate and an overall tax rate of 389 (35 federal and 6 state tax) the rate specified in HRSAM [4] The numbers and different colors in the plot represent the numbers of years required to make back the cost of the asset For example if one were to purchase land (which is non-depreciable) for $200k to make back that investment in 7 years the cost of hydrogen would be approximately $3kg higher than without the purchase for a 100 kgday station or about $1kg higher for a 300 kgday station (note that this assumes the stations are utilized at the rate shown in Fig 2) As a second example if a $1M electrolyzer were aded to a station (a depreciable investment) it would add $957kg for hydrogen to pay for that asset for a 100 kgday station and just over $3kg for a 300 kgday station (Note that the costs scale inversely with capacity because the same percentage station utilization rate shown in Fig 2 is used in this analysis In other words we assume that customers at the 100 kgday station are purchasing exactly 13 the hydrogen as at the 300 kgday station)
7
00 05 10 15
investment cost (M$)
0
2
4
6
8
10ad
dit
ion
al
H2 c
ost
($k
g)
55
7
7
11
11
13
13
100 kgday
(a) Additional cost of hydrogen for a 100 kgday station
00 05 10 15
investment cost (M$)
0
2
4
6
8
10
ad
dit
ion
al
H2 c
ost
($
kg
)
55 7
711
11
13
13
200 kgday
(b) Additional cost of hydrogen for a 200 kgday station
8
00 05 10 15
investment cost (M$)
0
2
4
6
8
10
ad
dit
ion
al
H2 c
ost
($k
g)
5
5 7
711
11
13
13
300 kgday
(c) Additional cost of hydrogen for a 300 kgday station
Figure 3 Additional cost of hydrogen given initial construcshytioncapital investment for the station utilization profile shown in Fig 2 Numbers on the graph lines are the years required to break even on the investment solid lines are for a depreciable asset (on a 7 year MACRS schedule) and dashed lines are for a non-depreciable asset Points on the plots are examples from the text
9
2 Station Cost Components
This section describes the primary contributors to the cost of hydrogen
bull Centrally Produced Hydrogen and Delivery bull Hydrogen Produced On-site via Steam Methane Reforming bull Hydrogen Produced On-site via Electrolysis bull Compression Storage and Ancillary Equipment for a Conventional Station bull Packaged Compression Storage and Ancillary Equpiment for a Modular Station bull Hydrogen Dispensers
Each subsection describes the technical details of the components and the rational for the assumed costs in the economic model
21 Centrally Produced Hydrogen and Delivery
For delivered hydrogen we included the cost of buying hydrogen from a centrally located production facility delivering it in tube-trailers and leasing tube-trailers for storage at the fueling station Initially the H2A Delivery Scenario Analysis Model (HDSAM) [4] was evaluated for its applicability to this project but this model did not have enough flexibility in its scenarios In this analysis we wanted to consider a single station and not consider savings from multiple station deliveries due to tractortrailer sharing In this analysis we did not model the cost of tractortrailer purchase and payment but rather considered a very early market scenario (ie the current market conditions) where the industrial gas company would own and control the delivery tractors and lease the tube-trailers to the station owners (assuming that they are left on-site until empty) Some of the data from HDSAM was used in this analysis including some parameters shown in Table 3 The delivery distance was assumed to be 200 miles so that delivered hydrogen costs could be compared to estimates from industrial gas companies [6] The trailers were assumed to have 300 kg of usable hydrogen There are some jumbo high-capacity tube-trailers in the market with closer to 1100 kg usable hydrogen3 but for these current market scenario simulations we assumed more conventional tube trailers with steel tubes and the smaller capacity With a 300 kg usable H2 capacity the utilization scenario shown in Fig 2 and a given station capacity were used to calculate the time to consume a tube-trailer The trips per year were calculated and fuel labor and other costs for delivering hydrogen were calculated Frequent deliveries of hydrogen would be necessary and it is likely that a fueling station would need to have multiple tube-trailers on site to ameliorate outages Especially for the 300 kgday station as the peak nameplate capacity is approached it may become infeasible to get daily tube-trailer deliveries and another type of hydrogen storage (ie liquid) or some on-site production would probably be required Nonetheless we performed the analysis with the assumption that the industrial gas companies would be able to provide near daily deliveries of tube-trailers in the out-years
Figure 4 shows the costs components associated with delivering tube trailers to a single station Because each station is assumed to follow the same utilization projections the costs follow the
3httpwwwthe-linde-groupcomennews_and_mediapress_releasesnews_20130925html
10
Table 3 Data used to calculate delivered hydrogen costs
description value
average delivery gas mileage1 6 mpg average delivery speed1 378 mph tube-trailer capacity2 300 kg tube-trailer maximum pressure2 250 bar delivery labor cost1 2121 $hr overhead on labor1 20 insurance cost1 $0106 mile licensing amp permits1 $0116 mile maintenance cost1 $0078 mile lease price3 $3500 month
1 data from HDSAM [4] 2 data from energygov
3 data from personal communications
2020 2025 2030 2035year
050
100150200250300350
deli
very
cost
(k$y
r)
diesellabor
insurancemaintenance
permitting
2020 2025 2030 2035year
diesellabor
insurancemaintenance
permitting
2020 2025 2030 2035year
diesellabor
insurancemaintenance
permitting
Figure 4 Breakdown of annual costs associated with delivery of hydrogen for a 100 (left) 200 (center) and 300 (right) kgday stashytion Does not include the cost of hydrogen production or transport trailer
11
2010
2015
2020
2025
2030
2035
2040
2045
2050
year
1
2
3
4
5
6
7
cost
(n
om
inal
$k
g)
centralized H2 production
current model (commercial NG)
H2A production
current model (industrial NG)
Figure 5 Cost for centralized production of hydrogen for the model used in this study and an H2A model (based on 380000 kgday production) [2]
same increasing trend out to 2026 The continued increase past 2026 is due to inflation which is estimated at 194 and the increasing cost of diesel fuel (Fig 1) This chart shows that labor is the largest contributor to hydrogen delivery costs followed by the cost of diesel to fuel the delivery truck All of these delivery costs scale proportionally if the delivery distance were to be smaller or larger than 200 miles The costs also scale proportionally with the nameplate capacity because the utilization scales with the nameplate capacity causing the larger stations to require proportionately more deliveries labor maintenance etc
Along with delivery costs in this analysis we also include the cost of the centrally produced hydrogen The cost of centrally produced hydrogen was estimated using a correlation from Lemus and Duart [7] Because the central hydrogen production plants that exist today make hydrogen from steam-methane reforming they found that production was linearly dependent on the price of natural gas
H2production cost = 12 middot NGprice + 6
where the cost and price are in $GJ Using the pricing data shown in Fig 1 this centrally produced hydrogen cost was calculated The DOErsquos H2A production model (version 301) [2] is compared to this calculation in Fig 5 using both commercial and industrial costs for natural gas As shown the Lemus and Duart model agrees quite well with the H2A production model until about 2042 Thus the commercial natural gas price was selected for use in further calculations of the costs associated with hydrogen production for conventional delivered hydrogen stations
Finally for delivered centrally produced hydrogen the cost of the tube trailer lease was inshycluded Shown in Table 3 the lease price was estimated at $3500 per month We assumed in
4Inflation rate taken from HRSAM [4]
12
2020 2025 2030 2035year
0100200300400500600700
deli
vere
d H
2 c
ost
(k$y
r)cent productiontube trailer lease
delivery
2020 2025 2030 2035year
cent productiontube trailer lease
delivery
2020 2025 2030 2035year
cent productiontube trailer lease
delivery
Figure 6 Total costs associated with central production of hyshydrogen delivery and storage in a tube-trailer for a 100 (left) 200 (center) and 300 (right) kgday hydrogen refueling station
this analysis that the stations would continually lease 2 tube trailers at $7000 per month so there would be no outages as the empty hydrogen tube trailers were exchanged We assumed that the lease cost was not affected by the number of deliveries required Figure 6 shows the total costs associated with delivered centrally produced hydrogen Within the red delivery bar are all of the costs shown in Fig 4 All three of the costs broken out in the plot (central production tube-trailer leasing and delivery) are significant contributors to the cost of centrally produced delivered hyshydrogen As shown the cost of the tube-trailer lease was fixed in this model for any station capacity resulting in a smaller percentage of the costs for 200 and 300 kgday stations This is far from a certain assumption The high lease price might cause a station operator to think about purchasing a tube-trailer (or fleet of tube-trailers) but the estimated cost of a tube trailer within HDSAM [4] is around $1 million At least two trailers would be required unless the station were shutdown while the tube trailers were being refilled so purchase might not make financial sense without an adshyvanced network of stations andor a long-term financial horizon An additional option to eliminate the trailer lease expense is to install a similar amount of low pressure hydrogen storage on site allowing the trailer to discharge its contents and depart This would add several hundred thousand dollars of capital cost to the station (depending on the amount and type of storage installed)
22 Hydrogen Produced On-site via Steam Methane Reforming
Cost information for on-site reformers was gathered from several manufacturers An estimate for capital cost is $115M for a 100 kgday unit $204M for a 200 kgday unit and $246M for a 300 kgday unit A functional fit was found to several data points including the H2A production model [2] capital cost for a 1500 kgH2day unit which is $325M As with most products the per kg cost of production reduces as the production rate increases
Feedstock consumption rates were also collected from manufacturers for several on-site reshyforming units Based on this information assumed rates of 39 kWhkgH2 96 lH2OkgH2 and 35
13
2010 2015 2020 2025 2030year
0
100000
200000
300000
400000
500000
600000
700000
800000
H2 p
rod
uct
ion
cost
($
)current model
H2A production
Figure 7 Annual production cost of 500 kgday hydrogen from distributed steam methane reforming as predicted by the current model and using the H2A production model
kgNGkgH2 were used to estimate operating costs The operating costs for the H2A production model for distributed SMR scaled down to 500 kgday [2] was compared to the operating costs calculated using the current model (using the cost information shown in Fig 1 and the commershycial price of natural gas) This comparison is shown in Fig 7 The annual operating costs of the current model which is based on recent manufacturer information are within 20 of the H2A model predictions
One factor that is not taken into account in this analysis is startup and shutdown production efficiencies and losses Because SMRs operate at high temperature start-up is slow and frequent shutdownstartup cycles can drastically reduce production efficiency It may be cheaper to simply produce and vent hydrogen continuously rather than cycling the unit off and back on The addishytional cost of running the SMR when it is not needed is not included in this analysis it is assumed that this process occurs instantaneously and without an efficiency penalty The impact of this assumption is that the operational costs of the SMR may be under-predicted by this model
23 Hydrogen Produced On-site via Electrolysis
The two most common type of electrolysis units on the market today are polymer electrolyte membrane (PEM) and alkaline PEM electrolysis units use the same technology as PEM fuel cells (which are found in vehicles) but the cells are biased and protons move in the opposite direction from a fuel cell Alkaline fuel cells have a liquid electrolyte solution that serves to transport ions from the electrodes Alkaline electrolyzers are a more mature technology can be cheaper and may have a longer lifetime than PEM electrolyzers but PEM electrolyzers produce higher purity hydrogen with less sensitivity to water purity are smaller can respond more quickly to changes in production rate and can produce hydrogen at pressure reducing compression needs In this
14
analysis we are not specifying the type of electrolyzer since costs (which are not precisely quoted in any case) are reasonably similar
Electrolyzer electricity consumption was estimated to be 56 kW-hrm3 = 624 kW-hrkgH2H2 There is some variability in electricity consumption depending on each manufacturerrsquos equipment but this value is in line with an analysis by Ursua et al [8] and is the average value from the Electrolyzer Energy composite data product (CDP)5 from NREL The municipal water consumpshytion was calculated as just under 3-times the stoichiometric value required based on the reacshytion (H2O rarr H2 + 12O2) (which accounts for purification system losses and other cooling water needs) at 264 lH2OkgH2 An informal survey of several companies led to capital cost estimates of $800k $12M and $15M for the 100 200 and 300 kgday stations These capital costs are lower than the SMR capital costs used in this analysis for an equivalent hydrogen production capacity For the modular electrolyzer units considered herein the installation cost was assumed to be a flat $60k regardless of the hydrogen production capacity an estimate based on discussions from several companies
Similar to the SMR the efficiency penalty for shutting down the unit and restarting it is not taken into account in this analysis This inefficiency is expected to be lower for electrolysis than SMR since the operation temperatures are much lower and the startup process is simpler Nonetheshyless there will be an efficiency penalty for cycling the electrolyzer off and back on so the elecshytrolyzer and storage sizes need to be optimized for the station utilization rates during station design
24 Compression Storage and Ancillary Equipment for a Conventional Stashytion
For conventional stations most equipment costs from Phase 1 of the reference station design report [3] were used in this analysis Shown in Table 4 costs for all but the compressor dispenser and chillercooling block were inflation adjusted from 2009$ to 2016$ at a 19 inflation rate The cost of the compressor was not simply inflated but rather re-estimated using the compressor size evaluated by HRSAM [4] and Fig 2 from the Phase 1 Reference Station Design report [3] The $100kndash$150k capital cost estimates for the compressors given in the first report were based on a specific station design with a smaller compressor rather than the compressor sizing evaluated by HRSAM The HRSAM estimates for compressor needs for the 100 200 and 300 kgday stations are 6 14 and 23 kghr as shown in the table Compressor energy consumption was assumed to be 42 kWhrkgH2 This is consistent with NRELrsquos Compressor Energy CDP6 and manufacturer specifications This factor was used to calculate the energy utilization and size the compressors at 25 60 and 100 kW for the 100 200 and 300 kgday stations respectively The electrical requirements are a bit more than those calculated by HRSAM which assumes that the compressors have a 65 isentropic efficiency but correspond well with literature [9] and manufacturer data
As with the Phase 1 report [3] the compressor is the only variable cost in different-sized station
5httpwwwnrelgovhydrogenimagescdp_infr_36jpg 6httpwwwnrelgovhydrogenimagescdp_infr_35jpg
15
Table 4 Equipment needed for a conventional hydrogen fuelshying station and estimated costs (inflation adjusted from [3] or reshyassessed as described in the text)
description quantity cost total tanks [13 kg each 945 bar MAWP Type II] 3 $45633 $136899 pressure transducer and indicator 6 $1141 $6845 block and bleed valve 6 $570 $3422 air operated valve 6 $2282 $13690 pilot solenoid valve 7 $57 $399 isolation hand valve 12 $570 $6845 check valve 3 $456 $1369 coolant pump 1 $1369 $1369 water chiller 2 $4563 $9127 coolant filter 1 $57 $57 instrument air compressor 1 $1141 $1141 instrument air dryer and filter 1 $2909 $2909 hydrogen compressor [2-stage 950 bar outlet]
100 kgday station - 6 kghr 25 kW $189827 $189827 200 kgday station - 14 kghr 60 kW 1 $328774 $328774 300 kgday station - 23 kghr 100 kW $453010 $453010
hydrogen dispenser [(1) 350 bar and (1) 700 bar hose] 1 $250000 $250000 hydrogen chiller and cooling block 1 $150000 $150000 IR flame detector 2 $1711 $3422 hydrogen filter 1 $2852 $2852 PLC 1 $5704 $5704 tubing - $22817 $22817 fittings - $17112 $17112 electrical upgrades - $57041 $57041 fencing - $5704 $5704 bollards - $5704 $5704
total (100 kgday station) total (200 kgday station) total (300 kgday station)
$894256 $1033203 $1157439
16
designs The developers of HRSAM [4] found the minimum size of the commonly available high pressure ground storage tanks to be 13 kg and three of these are needed for a cascade fill giving a minimum installed high-pressure storage amount of 39 kg This size was found to be sufficient for each station modeled in this work Since each station only has a single dispenser that cost also remains constant Using the varied compressor costs the conventional station equipment costs range from $900k to $12M
Costs for the hydrogen dispenser and the hydrogen chiller and cooling block were separated out and updated in this report where they were lumped together in the previous report The chiller and cooling block was estimated to cost $150k while the dispenser was estimated at $250k These costs are based on discussions with manufacturers and station operators who have purchased these pieces of equipment and are 15 higher than the estimated $350k combined cost in the previous report Part of the reason for this update is the evolution of dispenser design from an industrial-type interface to one that provides a retail customer experience more similar to that at a gasoline station and the associated cost of these newer dispensers
One high cost subsystem shown in Table 4 is the hydrogen compressor where cost savings can be realized by reducing the size of the compressor However the compressor size needs to be balanced by the high pressure storage and station utilization The hydrogen dispenser is also a significant cost as production volume increases on the components needed in the dispensers and the assembled dispensers this cost will likely decrease The same number and type (or at least cost) of dispenser valves pumps filters tanks tubing safety equipment etc are needed for the 100 kgday station as the 200 and 300 kgday stations
25 Packaged Compression Storage and Ancillary Equpiment for a Modushylar Station
Modular stations have the compressor hydrogen cooling block chiller high-pressure storage and control electronics housed in andor on a single container Manufacturing and installing these components in this way reduces installation labor allows leak and operation checking at a dedishycated facility and can potentially reduce equipment costs by enabling high volume production of standardized components Most station designers and companies are currently producing modular units and having at least some components in a modular shippable fashion is the preferred way of constructing stations at this time Our research shows that the primary savings associated with modular stations are in the installation costs Based on conversations with manufacturers capital costs of modular stations are currently on par with conventional stations This is likely because much of the same equipment is used in both types of stations We estimate modular fueling stations to cost between $750k to $15M depending on the manufacturer and whether or not a dispenser is included This price range is for a unit that can compress and provide 200-400 kgday hydrogen and spans the $890k-$12M capital cost range of the conventional station equipment While inshystallation of conventional stations is expected to be about 35 of capital costs [4] installation of equipment for a modular station is expected to be very low likely no more than 5 of the capital costs of the modular unit In this report installation cost was estimated to be $60k regardless of
17
station size the same as the electrolyzer unit installation costs since the installation requirements are similar
Most manufacturers make just one size of modular units so there might not be potential to save by having a smaller nameplate capacity In this analysis we provide estimates for total station costs for two cases of modular unit costs ($1M and $15M) to elucidate the effect of differing capital costs These costs are assumed to include the cost of the dispenser even though is is shown as being separated from the modular system in the layout sketches In the analysis below these two different costs are also used as a further example to show how Fig 3 can be used to adjust resulting hydrogen cost to account for variability in capital cost estimates
26 Hydrogen Dispensers
Both the modular and conventional on-site station components need to interface with a disshypenser The dispenser includes valving high pressure break-away(s) hose(s) nozzle(s) flow meshytering control electronics and a customer interface (point of sale system) Stations often provide both 350 and 700 bar fills requiring two hoses break-aways nozzles and additional plumbing and control electronics Dispensing units range in price from approximately $150k-$350k For a high utilization area where one would want to allow multiple simultaneous fills the cost of additional dispensers would need to be factored into an analysis In this analysis both the conventional stashytion and modular station total cost estimates include the cost of a single dispenser with both a 350 and 700 bar hose
18
3 Results Station Designs and Costs
Multiple approaches exist to financially model fueling stations and determine the cost of hydroshygen One approach is to perform a discount cash flow analysis specifying a return on investment that is desired after a given time-frame This is the approach taken in HRSAM [4] and used in the Phase 1 Reference Station Design report [3] Specifying a 30 year analysis period and a discount rate of 15 the cost of hydrogen was determined for the different station designs These specishyfications led to a payback period (break-even time) of approximately 75 years In this work an alternative approach to the discount cash flow analysis was used wherein we calculated the cost of hydrogen considering a 7-year payback period A solution for the cost of hydrogen is found such that the sum of all costs and revenues is zero at the end of a 7-year period By taking this approach we do not need to include replacement costs for components over the entire 20 or 30 year discount cash flow analysis we only need to include replacement costs for components that need to be replaced within 7-year time-frame While some maintenance costs will be required over this 7 year time-frame we assume that no major component of the fueling station would need to be replaced in this period The validity of this assumption varies with equipment type manufacturer and duty cycle We project station costs and incomes out 20 years in this analysis but these results are missing capital replacement costs
As discussed earlier site-preparation costs can vary widely In this analysis we assume a flat $300k to cover the site-preparation including engineering and design permitting and a project contingency The cost to install the conventional components is assumed to be 35 of the capital cost while the cost to install the modular stations electrolyzer or SMR units is assumed to be $60k regardless of unit size or station capacity It should be noted that should any of these assumed costs be different from a real-world station build the black lines in the chart of Fig 3 can be used to determine the resulting change in the cost of hydrogen for the 7-year payback period For example if the site preparation costs $600k rather than the assumed $300k one could use Fig 3 to determine that for a depreciable asset7 the excess $300k would add nearly $3kg to the cost of hydrogen for a 100 kgday station or approximately $1kg to the cost for a 300 kgday station
It is assumed that the station construction takes one year (the year of 2016) and utilization begins the following year (2017) at the rate shown by Fig 2 Just like the analysis that was used to generate Fig 3 when calculating the cost of hydrogen depreciation was estimated using a 7-year Modified Accelerated Cost Recovery System (MACRS) depreciation rate and an overall tax rate of 389 (35 federal and 6 state tax)
31 Conventional Station with Delivered Centrally Produced Hydrogen
Figure 8 shows the cost and revenue model for a conventional assemble-on-site station with delivered hydrogen In 2016 there is no revenue and the costs for building the station are incurred The capital of the station (green bar) is the largest contributor to costs in 2016 The 35 of capital
7Site preparation is likely considered depreciable because it is preparing the land for business use and is closely associated with the station equipment
19
site prep
94
stati
on
cap
ital
280
stationinstall 98
deliv
ered
H 232
6
labor
65
maintenance
118
electricity19
-2000
-1500
-1000
-500
0
500
1000
1500
2000co
st o
r re
ven
ue (
k$
yr)
tax
site preparationstation capitalstation install
delivered H2labor
maintenanceelectricity
revenue ($3053kg)net income
100 kgday
site prep
78
stat
ion
capit
al
269
stationinstall 94
deliv
ered
H 237
6
labor
54
maintenance
98
electricity31
-2000
-1500
-1000
-500
0
500
1000
1500
2000
cost
or
reve
nu
e (
k$
yr)
tax
site preparationstation capitalstation install
delivered H2labor
maintenanceelectricity
revenue ($1837kg)net income
200 kgday
site prep
67
stat
ion
capit
al
259
station
install 91
deliv
ered
H 2
413
labor
46
maintenance
84
electricity40
2020 2025 2030 2035year
-2000
-1500
-1000
-500
0
500
1000
1500
2000
cost
or
reve
nu
e (
k$y
r)
tax
site preparationstation capitalstation install
delivered H2labor
maintenanceelectricity
revenue ($1426kg)net income
300 kgday
conventional delivered H2
Figure 8 Cost and revenue associated with a conventional assemble-on-site station with centrally produced delivered hydroshygen to break even at year 7 (2023) The net income includes the effects from depreciation and taxes Capital replacement costs and intervals are not included in this model (accuracy past 2023 is limshyited) Pie charts on the right show the breakdown of cumulative capital and operating costs over the 7-year analysis period to the cost of dispensed hydrogen
20
costs needed to install the station (red bar) and the $300k site preparation cost (blue bar) make up the balance As discussed earlier land costs are not included in this analysis and site preparation costs can vary quite widely Figure 3 should be used to calculate the change in the cost of hydrogen given any land purchase costs differences in real-world capital or site preparation costs The total installed station costs range from $15M to $19M for the 100 to 300 kgday stations
In 2017 as hydrogen begins to sell at the station revenue begins to roll in but operating costs are also incurred The largest incurred operation cost is the hydrogen fuel supply including the cost of production delivery and storage at the station represented by the light blue bar in Fig 8 This cost increases as the utilization of the station increases (due to more hydrogen required by the station) until 2026 when utilization stabilizes After 2026 the delivered hydrogen costs continue to increase solely due to inflation Contributors to the hydrogen production delivery and tube-trailer storage (labeled delivered H2 in Fig 8) are shown by Figs 4 and 6 and are discussed in Section 21
The purple labor bar in Fig 8 makes up a small percentage of the operating costs This value is calculated using a labor rate of $1370 hr in 2016$ the default rate in HRSAM [4] This labor rate is fixed regardless of the size of the station or the amount of hydrogen sold Maintenance shown by the yellow bar is a slightly larger operating cost contributor Maintenance was estimated at $50kyr (in 2016$ with increases due only to inflation over time) regardless of the station size Maintenance costs can vary quite widely from station to station and from quarter to quarter but this number is near the average annual cost suggested by NRELrsquos Maintenance Costs Over Time CDP8
Electrical costs to run the compressor and chiller at the station make up the balance of the operational cost in Fig 8 shown by the slim gray bar The average compressor energy usage at stations is 42 kW-hrkgH2 according to the Compressor Energy CDP9 from NREL An additional 20 of the compressor energy use was assumed for the refrigeration energy use a factor consistent with HRSAM [4] The cost for electricity shown in Fig 1 was used with this assumed compression and refrigeration energy use to calculate the cost of electricity at the station This cost increases with the amount of hydrogen dispensed and is approximately the same as the maintenance costs for the 300 kgday station after the 80 utilization rate is reached in 2026 For the 200 and 100 kgday stations the electricity usage is proportionately less
For each of the three stations the cost of hydrogen was calculated such that the capital and operating costs were recovered by revenue over 7 years Shown in Fig 8 and tabulated in Table 5 the cost of hydrogen is $3053kg $1837kg and $1426kg for the 100 200 and 300 kgday stations respectively The decrease in hydrogen cost with increasing station capacity is consistent with the Phase 1 Reference Station results [3] and is because the increased revenue from hydrogen sales more than compensates for the increased cost of capital due to the larger station capacity The decreasing hydrogen cost with station capacity also shows a trend of diminishing returns also consistent with the Phase 1 work [3] and increasing the capacity further will not decrease the hydrogen cost so dramatically In fact increasing station capacity will eventually result in
8httpwwwnrelgovhydrogenimagescdp_infr_30jpg 9httpwwwnrelgovhydrogenimagescdp_infr_35jpg
21
Table 5 Installed cost (which includes site preparation engishyneering amp design permitting capital and installation costs) and hydrogen cost for conventional stations with centrally produced delivered hydrogen
capacity (kgday) installed cost ($) H2 cost ($kg)
100 $151M $3053 200 $169M $1837 300 $186M $1426
added capital not considered in this analysis such as multiple dispensers and associated hydrogen chilling equipment additional high pressure cascade storage and additional compressors as station capacity exceeds the throughput of available single compressors
The net income is shown by the purple lines in Fig 8 In 2016 the net income (which is actually an expense in this year without revenue) is not quite the entire capital costs This is due to the depreciation deduction (tax credit) on the capital investment shown by the brown bar In 2017 the net income is slightly greater than the revenue generated by selling hydrogen Once again this is the depreciation deduction on the capital investment which is occurring on a 7 year schedule The overall net expenses and income in all cases reaches a summed value of zero in year 7 (2023) and all income after that point would be earned by the investor (although as stated earlier replacement intervals of equipment are not included in this analysis) Including capital replacement costs would not affect the revenue but would affect the costs in replacement years the tax burden (as this replaced equipment depreciated) and net income in the years past 2023 For all three capacity stations the net income increases (due to inflation and varying operating costs) from about $300-400k year in 2024 to $500-600k yr in 2036
The pie charts on the right in Fig 8 show the contribution from the capital and operating costs over the 7 year payback period to the cost of hydrogen For the 100 kgday station the delivered hydrogen is the largest contributor at 33 followed by the station capital (28) Maintenance is also a large contributor to the cost of hydrogen responsible for 12 of the $3053kg Site preparation and station installation costs are each responsible for roughly 95 of the hydrogen cost Labor accounts for 65 of the hydrogen cost and electricity to run the compressor and chiller is a small contributor at only 2 Overall taxes do not have a net effect on the cost of hydrogen (and therefore do not appear in the pie charts) due to the fact that the capital investment is depreciating on a 7 year schedule providing tax credits in the early years and the fact that we are specifying the cost of hydrogen based on the operator breaking even on their investment in year 7 If we were to determine the cost of hydrogen using a different criterion or if there were capital investments that were not depreciating (or depreciating on an alternative schedule) taxes would have a role in the cost of hydrogen Taxes will also have an impact on the revenue and return on investment over a longer analysis period Note that in this analysis we are not considering the tax to the consumer that is placed on the dispensed fuel
Comparison of the pie charts in Fig 8 shows that as the station capacity increases the stashy
22
tion capital reduces slightly as a percentage of the hydrogen cost while the delivered hydrogen increases its share of the hydrogen cost However the overall cost of delivered hydrogen reduces with increasing capacity from $995kg for the 100 kgday station down to $589kg for the 300 kgday station Electricity on the other hand while increasing as a percentage of the hydrogen cost with increasing capacity contributes approximately $057kg to the cost of hydrogen regardless of the station capacity because the same amount of energy is required to compress and chill each dispensed kg of hydrogen
Figure 9 shows how a conventional station with delivered hydrogen might be organized on a site This is nearly the same layout sketched in the previous reference station design report [3] As with the previous layout the air compressor dryer and cooling water equipment are located near the convenience station so that the air compressor inlet is at least 45 feet away from the hydrogen trailers a prescriptive requirement of NFPA 2 [10] This also prevents this equipment outside the wall from requiring electrical classification The equipment in this layout is spaced out and one could probably devise a smaller footprint The largest contributors to the space requirement are the two tube trailers on-site which would be necessary to prevent interruptions in service The tube trailers drawn are 40rsquo long and sufficient space and delivery routes need to be designed into the layout so that the drivers can drop them off and pick them up
Cost of Delivered Hydrogen
To gain insight into the cost of delivered hydrogen its contribution to the overall cost of hyshydrogen was removed and the overall cost was recalculated Without the delivered hydrogen cost the cost of hydrogen would be $2058 $1147 and $837 for the 100 200 and 300 kgday stashytions respectively The difference between these two scenarios results in delivered hydrogen costs of $995 $690 and $589 per kg Note that these costs includes the leasing two tube-trailers for storage on-site and the cost of delivered centrally produced hydrogen (without the cost of the tube-trailer lease) is $387kg for all three capacity stations The delivered hydrogen cost of $6ndash 10kg is in line with the $6ndash$8kg (in 2014$) reported by Sutherland and Joseck [6] for centrally produced delivered hydrogen of 500ndash1000 kgmonth with a delivery distance of up to 200 miles The delivery distance (assumed to be 200 miles in this analysis) will have a large impact on the cost of delivered hydrogen proportionately changing all of the associated delivery costs shown in Fig 4 which are cumulatively shown as the red bar in Fig 6 The tube-trailer lease price to store hydrogen on-site which is fixed for all three capacity stations is responsible for the decreasing cost of the centrally produced delivered and stored hydrogen as the station capacity increases By having a higher throughput of hydrogen the larger capacity stations are able to spread the cost of the tube trailer lease over a greater quantity of dispensed hydrogen
Comparison of Costs to Previous Study
Neglecting the cost of the delivered hydrogen also allows a comparison to the results of the Phase 1 Reference Station Design report [3] The calculated hydrogen costs without production
23
conveniencestore
50 0
dispenser island
H2 cooling blockH2 chiller
gas panel
high pressure H2storage
compressorwater chillerair compressor
tube trailer
168 0
140
0
30 0
Figure 9 Renderings of a conventional station layout with delivshyered gaseous hydrogen
24
and delivery of $2058 $1147 and $837 are higher than the Phase 1 calculated costs of $1328 $782 and $603 for the 100 200 and 300 kgday stations (shown in Table 1) Several factors contribute to the differences in the calculated fuel cost First the installed capital costs of $15M $17 and $19M in this analysis are higher than those calculated previously of $11M $12M and $13M (even after adjusting for inflation) Second the previous analysis used HRSAM in which the operating costs are calculated a bit differently than this analysis Finally in the previous analshyysis the criteria for hydrogen cost was a 15 discount rate based on a 30 year analysis period which led to a 75 year payback period In this analysis the payback period was set to exactly 7 years (and the discount rate was not considered) If in this analysis the capital costs are reduced to match the previously reported capital costs ($11M $12M and $13M) and the payback period is extended from 7 to 75 years the cost for dispensed hydrogen (without including the cost of hydrogen production and delivery) is calculated as $1521 $823 and $590 for the 100 200 and 300 kgday stations respectively These costs are within 15 of the HRSAM values found in the previous analysis The differences in this case must all be attributed to the second cause of differshying assumptions on operation costs in this analysis method vs the HRSAM method This exercise shows that the economic assumptions in this analysis are in-line with the HRSAM assumptions albeit not exactly the same This exercise also demonstrates that solving for the hydrogen cost to match a payback periodndashas long as that payback period is less than the capital replacement interval on partsndashis a valid alternative to the discount rate analysis used in HRSAM
32 Conventional Station with Hydrogen Produced On-site via Steam Methane Reforming
The costs and revenue for a conventional assemble-on-site station with an on-site steam methane reformer to produce hydrogen are shown in Fig 10 with the installed costs and cost of hydrogen tabulated in Table 6 Inspection of the capital costs incurred in 2016 shows that the largest conshytributor is the SMR unit itself As discussed in Section 22 these SMR units are estimated to cost from just over $1M for a 100 kgday capacity to just under $25M for a 300 kgday capacity Usshying Fig 3 adding a $1M capital investment (depreciable) to a 100 kgday station will add nearly $10kg to the cost of hydrogen to make back that investment in 7 years But for the 100 kgday stashytion with on-site SMR the $3847kg cost of hydrogen is only about $8 higher than the $3053kg for the conventional station with delivered hydrogen The hydrogen cost is calculated based on
Table 6 Installed cost (which includes site preparation engishyneering amp design permitting capital and installation costs) and hydrogen cost for conventional stations with SMR on-site
capacity (kgday) installed cost ($) H2 cost ($kg)
100 $274M $3847 200 $383M $2596 300 $443M $2023
25
site
pre
p
75
station
capital
222
stationinstall 78
SMR c
ap
292
SM
R in
st
15
labor
51
SMR elec
12 natural gas
45 water
07
maintenance188
stat
ion
elec
tric
ity
15
-3000
-2000
-1000
0
1000
2000
3000co
st o
r re
ven
ue (
k$
yr)
tax
site preparationstation capitalstation installSMR capitalSMR install
laborSMR electricity
natural gaswater
maintenancestation electricity
revenue ($3847kg)net income
100 kgday
site
pre
p
55
statio
n
capita
l190
stationinstall 67
SMR c
ap
382
SM
R inst
11
labor
38 SMR elec
17 natural gas
67water
11
maintenance
139
stat
ion
elec
tricit
y
22
-4000
-3000
-2000
-1000
0
1000
2000
3000
4000
cost
or
reve
nu
e (
k$
yr)
tax
site preparationstation capitalstation installSMR capitalSMR install
laborSMR electricity
natural gaswater
maintenancestation electricity
revenue ($2596kg)net income
200 kgday
site
pre
p
47
statio
nca
pita
l182
stationinstall 64
SMR c
ap
395
SM
R in
st
09
labor
33
SMR elec
22
natural gas
86water
14
maintenance
119
stat
ion
elec
tricit
y
28
2020 2025 2030 2035year
-6000
-4000
-2000
0
2000
4000
6000
cost
or
reve
nu
e (
k$y
r)
tax
site preparationstation capitalstation installSMR capitalSMR install
laborSMR electricity
natural gaswater
maintenancestation electricity
revenue ($2023kg)net income
300 kgday
conventional SMR on-site
Figure 10 Cost and revenue associated with a conventional assemble-on-site station with on-site steam methane reforming produced hydrogen to break even at year 7 (2023) The net inshycome includes the effects from depreciation and taxes Capital replacement costs and intervals are not included in this model Pie charts on the right show the breakdown of cumulative capital and operating costs over the 7-year analysis period to the cost of disshypensed hydrogen
26
both capital and operating costs so we can conclude that the operating costs for the 100 kgday SMR are less than the operating costs for the 100 kgday delivered hydrogen station In addition to the common costs for labor station maintenance and station electricity the station with the SMR unit has a nominal operating cost for water for the SMR unit (nearly indistinguishable green bar) requires electricity and natural gas to run the unit (shown by the blue and black bars) and requires additional maintenance over the conventional station with delivered hydrogen (included in the red bar) Maintenance for the SMR unit is assumed to be $50kyear bringing total station maintenance costs to $100k yr However the sum of these costs is less than the cost to deliver and store censhytrally produced hydrogen for the 100 kgday station Operating costs for the SMR station neglect the inefficiencies in shutdownstartup cycles (or venting excess hydrogen) when production is not matched by demand which would further increase costs
The cost of hydrogen for the conventional 100 200 and 300 kgday stations with on-site SMR are $3847kg $2596kg and $2023kg These costs are 26 41 and 42 higher than the costs of hydrogen for a conventional station with delivered gaseous hydrogen As discussed the increased cost of hydrogen comes from the high capital costs for the on-site SMR units slightly offset by a reduced operating cost This can be seen by inspecting the pie charts on the right side of Fig 10 where the SMR capital costs is the largest contributor to the cost of hydrogen accounting for approximately 30-40 of the hydrogen cost For the 200 and 300 kgday stations the capital costs of $2M and $25M add approximately $10kg and $8kg While the operating costs for these stations are lower than the same capacity delivered hydrogen stations these differences fail to decrease the cost of hydrogen to the same level as the delivered hydrogen station Overall this analysis would suggest that while there may be some advantages to utilizing on-site SMR there is not much of a financial case to produce hydrogen on-site using steam methane reforming rather than having hydrogen delivered for 100-300 kgday hydrogen refueling stations unless the capital cost can be reduced significantly
A station with an on-site SMR unit could have a smaller footprint than a station with delivered hydrogen One potential layout is shown in Fig 11 By replacing the tube trailers with an SMR unit significantly less space is required for the fueling station components (compare to Fig 9) Since all hydrogen is produced on-site delivery routes can also be neglected from consideration and walls can enclose all of the hydrogen components reducing setback distances on all sides The SMR unit is shown as being housed in a 20 ft ISO container footprint although to produce 300 kgday it may be possible to have a smaller footprint and even smaller for the stations that only require 100 or 200 kgday For on-site SMR the fueling station components (eg compressor high pressure storage) take up relatively more space than the low pressure hydrogen source (because the SMR is much smaller than the two tube trailers) and laying out these components in a compact manner is important in space-constrained sites
33 Conventional Station with Hydrogen Produced On-site via Electrolysis
Conventional stations with on-site electrolysis have the costs and revenues shown in Fig 12 The installed capital costs and hydrogen costs at each of the three stations are tabulated in Table 7 Similar to the conventional station with a steam methane reforming unit on-site each of these
27
30 0
50 0
154 0
100
0
conveniencestore
dispenser island
compressor
high pressure storagegas panel
H2 chillerH2 cooling block
air compressorwater chiller
20 ft ISO container(electrolyzer or SMR)
Figure 11 Renderings of a conventional station layout with on-site production of hydrogen
28
site prep
72
stat
ion
capit
al
216
station
install 75
eleccapital 197
elec
install
14
elec
el
ectr
icity
177
wate
r02
lab
or
50
maintenance
182
stationelectricity
14
-3000
-2000
-1000
0
1000
2000
3000co
st o
r re
ven
ue (
k$
yr)
taxsite preparationstation capitalstation installelec capitalelec install
elec electricitywater
labormaintenance
station electricity
revenue ($3966kg)net income
100 kgday
site prep
54
stat
ion
capi
tal
186
statio
n
insta
ll65
eleccapital 221
elec
install11
elec
el
ectr
icit
y26
5
water
03
labor
37
maintenance
136
stationelectricity
21
-3000
-2000
-1000
0
1000
2000
3000
cost
or
reve
nu
e (
k$
yr)
taxsite preparationstation capitalstation installelec capitalelec install
elec electricitywater
labormaintenance
station electricity
revenue ($2651kg)net income
200 kgday
site prep44
stat
ion
capi
tal
170
stati
on
inst
all
59
elec
capital 224
elecinstall
09
elec
el
ectr
icit
y32
3
water
04
labor
30
maintenance
111
stationelectricity
26
2020 2025 2030 2035year
-4000
-3000
-2000
-1000
0
1000
2000
3000
4000
cost
or
reve
nu
e (
k$y
r)
taxsite preparationstation capitalstation installelec capitalelec install
elec electricitywater
labormaintenance
station electricity
revenue ($2174kg)net income
300 kgday
conventional electrolysis on-site
Figure 12 Cost and revenue associated with a conventional assemble-on-site station with on-site electrolysis produced hyshydrogen to break even at year 7 (2023) The net income includes the effects from depreciation and taxes Capital replacement costs and intervals are not included in this model Pie charts on the right show the breakdown of cumulative capital and operating costs over the 7-year analysis period to the cost of dispensed hydrogen
29
Table 7 Installed cost (which includes site preparation engishyneering amp design permitting capital and installation costs) and hydrogen cost for conventional stations with electrolysis on-site
capacity (kgday) installed cost ($) H2 cost ($kg)
100 $238M $3966 200 $298M $2651 300 $345M $2174
station designs has a large capital cost due to the electrolysis unit As discussed in Section 23 the electrolysis units cost approximately $800k $12M and $15M for 100 200 and 300 kgday capacities These capital investments will add approximately $8kg $6kg and $5kg to the cost of hydrogen over a conventional station assuming equivalent operating costs During operation there is a large cost associated with electricity to run the electrolysis unit (shown by the yellow bar) This cost scales with the amount of hydrogen produced and is a large factor in the station economics The pie charts on the right show that this electricity accounts for approximately 20-30 of the cost of hydrogen Other additional costs over the conventional delivered hydrogen station are the cost of water to run the electrolysis unit and additional maintenance on the electrolyzer (assumed to be $50k annually as with the SMR)
The electricity required for the electrolyzer costs approximately $300k $600k and $900k (for the 100 200 and 300 kgday stations) in 2036 where utilization has topped out at 80 Centrally produced delivered hydrogen by comparison as shown in Fig 8 costs around $300k $450k and $650k in 2036 with overall operating costs for the delivered hydrogen station (neglecting taxes) topping out at approximately $400k $600k and $800k In addition to the additional capital costs for the electrolyzer (and the other operational costs) it is clear that the economics of a station with an electrolyzer are challenging due to the high electricity consumption even when the electricity is from the current national grid mix with 13 renewable content10 Higher renewable content may further increase this cost component in the near term although fossil-fuel free electricity may become less expensive in the longer term
The cost of hydrogen for the conventional station with an electrolyzer is $3966kg $2651kg and $2174kg for the 100 200 and 300 kgday stations receptively These costs are on-par with the conventional station with SMR within $150kg for all three capacities The cost of hydrogen for a station with on-site production is significantly higher than for a station with delivered hydroshygen Besides improvements in electrical efficiency one strategy for minimizing operating costs is to only operate the electrolyzer at off-peak hours enabling the purchase of lower priced electricity However this might require oversizing the electrolyzer to produce enough hydrogen at off-peak hours to meet demand increasing the capital costs associated with the unit Another method is inshytentionally oversizing the electrolyzer to enable operation at a higher efficiency thereby reducing operating expenses
102015 estimate from httpwwweiagovtoolsfaqsfaqcfmid=92ampt=4
30
To estimate the impact of these methods of operation and aslo gain insight into less expensive renewable electricity costs in the future the model was run with the cost of electricity zeroed-out to calculate the lowest possible cost of hydrogen with cheap electricity In this scenario the cost of hydrogen is $3264kg $1949kg and $1472kg (for the 100 200 and 300 kgday stations) These costs are only slightly higher (by 3-7) than the conventional delivered hydrogen cost due to the capital investment in the electrolyzer and the remaining electrolyzer maintenance and water costs
A station with on-site electrolysis can also be represented by the layout shown in Fig 11 Housing the components necessary for alkaline electrolysis of 100-300 kgday hydrogen might be challenging in a 20 ft ISO container and the layout might need to be increased (to a 30 or 40 ft ISO container) For PEM electrolysis however the components should fit in the 20 ft ISO container and potentially smaller containers for the 100 or 200 kgday stations Similar to the reforming layout the hydrogen components fit in a much more compact space than for the conventional station with delivered hydrogen (shown in Fig 9) and the lot size is reduced
34 Modular Station with Delivered Centrally Produced Hydrogen
Figure 13 shows the cost revenue and income model for a modular station with delivered centrally produced hydrogen and an uninstalled modular unit cost of $15M The installed capital costs and hydrogen costs at each of the three capacity stations are tabulated in Table 8 Recall from Section 25 that the capital costs for modular stations do not follow the same trend as for build-on-site stations because modular stations come in discrete sizes Table 8 shows the installed capital and hydrogen costs for two cases of uninstalled modular station costs of $15M and $1M The only difference in costs between this scenario and the conventional station with delivered centrally produced hydrogen (see Table 5 and Fig 8) are in the capital costs While the installed capital costs including site preparation station capital and installation were $15M and $17M for the 100 and 200 kgday conventional stations it is $186M for all three capacities of the modular
Table 8 Installed cost (which includes site preparation engishyneering amp design permitting capital and installation costs) and hydrogen cost for modular stations with delivered hydrogen for two cases of uninstalled modular cost $15M and $10M
capacity uninstalled installed H2 cost (kgday) modular cost ($) cost ($) ($kg)
100 $15M $186M $3390 200 $15M $186M $1916 300 $15M $186M $1425 100 $1M $136M $2912 200 $1M $136M $1677 300 $1M $136M $1265
31
site
pre
p
85
stationcapital 423
statio
n
install
17d
elive
red
H2
294
labor
58
maintenance107
electricity
17
-2000
-1500
-1000
-500
0
500
1000
1500
2000co
st o
r re
ven
ue (
k$
yr)
tax
site preparationstation capitalstation install
delivered H2labor
maintenanceelectricity
revenue ($3390kg)net income
100 kgday
site
prep
75
station
capital 374
station
install15
delive
red
H2
360
labor
52
maintenance94
electricity
30
-2000
-1500
-1000
-500
0
500
1000
1500
2000
cost
or
reve
nu
e (
k$
yr)
tax
site preparationstation capitalstation install
delivered H2labor
maintenanceelectricity
revenue ($1916kg)net income
200 kgday
site
prep
67
station
capital336
stationinstall 13
del
iver
ed H2
413
labor
46
maintenance85
electricity
40
2020 2025 2030 2035year
-2000
-1500
-1000
-500
0
500
1000
1500
2000
cost
or
reve
nu
e (
k$y
r)
tax
site preparationstation capitalstation install
delivered H2labor
maintenanceelectricity
revenue ($1425kg)net income
300 kgday
modular station delivered hydrogen
Figure 13 Cost and revenue associated with a modular station with centrally produced delivered hydrogen to break even at year 7 (2023) assuming a $15M uninstalled capital cost of the modular station The net income includes the effects from depreciation and taxes Capital replacement costs and intervals are not included in this model Pie charts on the right show the breakdown of cumulashytive capital and operating costs over the 7-year analysis period to the cost of dispensed hydrogen
32
stations This capital investment for a 300 kgday modular station (including site preparation station capital and installation) is coincidentally the same as for a 300 kgday conventional station
If an estimate of $1M (as compared to the conservative estimate of $15M) for the uninstalled capital cost of the modular fueling station unit is used (note that this is still within the range of costs vendors estimated as described in Section 25) the cost of hydrogen will be $2912 $1677 and $1265 for the 100 200 and 300 kgday capacities respectively These costs are all lower than the cost of hydrogen at the equivalent capacity conventional stations As this technology matures and the installed capital cost of the modular units continues to decrease below the installed capital cost of the conventional stations it will make economic sense to site modular stations rather than assembling components on-site Parts standardization and the increased quality control that can be achieved by having modular station components may also lead to reduced maintenance requirements but that potential benefit is not included in this analysis
Figure 14 shows that a modular unit requires a slightly smaller installation area than the conshyventional station components shown in Fig 9 However the tube trailers acting as the hydrogen source and on-site storage still require significant space Similar to the conventional station with delivered hydrogen delivery routes must also be considered when siting a modular station with deshylivered hydrogen The hydrogen components are shown as being housed in a 20 ft ISO container although some 300 kgday modular stations are smaller than this While a slightly overall reduced footprint (relative to as drawn in Fig 14) could be realized we show this layout on the same lot as before Removing the need to store two 40-foot tube trailers by adding on-site low pressure storage could also drastically reduce the footprint by reducing the need to have an open wall for delivery A discussion of how the separation distances can be impacted and the footprints might be reduced due to fire-rated walls is included at the end of the Section 35
33
140
0
168 0
50 0
30 0
dispenser island
tube trailer
modular station(20 ft ISO)
conveniencestore
Figure 14 Renderings of a modular station layout with delivered hydrogen
34
35 Modular Station with Hydrogen Produced On-site via Electrolysis
The final configuration considered in this analysis is a modular station with an electrolysis unit attached to produce hydrogen The economics of this station design are shown in Fig 15 The installed capital costs and hydrogen costs at each of the three capacity stations with two different uninstalled modular unit costs are tabulated in Table 9 Similar to the results in the previous section the cost of hydrogen at the low volume modular electrolysis stations with an assumed $15M uninstalled modular station cost are higher than at the conventional electrolysis station counterpart We find that the cost of hydrogen at these modular stations with electrolysis produced hydrogen will be $4303kg $2730kg and $2173kg (for the 100 200 and 300 kgday stations) These costs are once again $337kg higher $079kg higher and the same (respectively) as the costs at the conventional stations with electrolysis produced hydrogen discussed in Section 33 This cost difference between the analogous conventional station is once again solely due to the differing capital cost of the installed modular station If the capital cost of the modular unit is $1M the hydrogen costs reduce to $3825 $2491 or $2013kg (for the 100 200 and 300 kgday stations) which are all lower than the cost at the similarly sized conventional stations with on-site electrolysis due to the lower installed station cost
Having on-site production using an electrolyzer and modular fueling station components only requires a small footprint for installation as shown in Fig 16 The ISO containers can house apshypropriate fire-rated barrier walls reducing separation distance for Group 1 and 2 exposures (except for air intakes) by half and eliminating separation distances for Group 3 exposures as described in Section 732312 of NFPA 2 The Hydrogen Technologies Code (2016) [10] Group 1 exshyposures are lot lines air intakes (HVAC compressors other) operable openings in buildings and structures and ignition sources such as open flames and welding Group 2 exposures are exshyposed persons (other than those servicing the system) and parked cars Group 3 exposures include buildings flammable gas storage hazardous materials storage ordinary combustibles horizontal distance to overhead electrical wire and piping containing other hazardous material This means
Table 9 Installed cost (which includes site preparation engishyneering amp design permitting capital and installation costs) and hydrogen cost for modular stations with on-site electrolysis proshyduced hydrogen for two cases of uninstalled modular cost $15M and $10M
capacity uninstalled installed H2 cost (kgday) modular cost ($) cost ($) ($kg)
100 $15M $274M $4303 200 $15M $314M $2730 300 $15M $345M $2173 100 $1M $224M $3825 200 $1M $264M $2491 300 $1M $295M $2013
35
site prep67
stat
ion
capit
al
333
stationinstall 13
eleccapital 181
elec
install
13
elec
el
ectr
icity
163
wate
r0
2
labor
46
maintenance
168
stationelectricity
13
-3000
-2000
-1000
0
1000
2000
3000co
st o
r re
ven
ue (
k$
yr)
taxsite preparationstation capitalstation installelec capitalelec install
elec electricitywater
labormaintenance
station electricity
revenue ($4303kg)net income
100 kgday
site prep53
stat
ion
capi
tal
263
station
install
11
eleccapital 214
elec
install11
elec
elec
tric
ity
257
water
03
lab
or
36
maintenance
132
stationelectricity
21
-4000
-3000
-2000
-1000
0
1000
2000
3000
4000
cost
or
reve
nu
e (
k$
yr)
taxsite preparationstation capitalstation installelec capitalelec install
elec electricitywater
labormaintenance
station electricity
revenue ($2730kg)net income
200 kgday
site prep44
stat
ion
capi
tal
220
stati
on
inst
all
09
elec
capital 224
elecinstall 09
elec
elec
tric
ity32
3
water
04
labor
30 maintenance
111
stationelectricity
26
2020 2025 2030 2035year
-4000
-3000
-2000
-1000
0
1000
2000
3000
4000
cost
or
reve
nu
e (
k$y
r)
taxsite preparationstation capitalstation installelec capitalelec install
elec electricitywater
labormaintenance
station electricity
revenue ($2173kg)net income
300 kgday
modular station electrolysis on-site
Figure 15 Cost and revenue associated with a modular station with on-site electrolysis produced hydrogen to break even at year 7 (2023) assuming a $15M uninstalled capital cost of the modular station The net income includes the effects from depreciation and taxes Capital replacement costs and intervals are not included in this model Pie charts on the right show the breakdown of cumulashytive capital and operating costs over the 7-year analysis period to the cost of dispensed hydrogen
36
electrolyzer(20 ft ISO)
modular station(20 ft ISO)
convenience store
dispenser island
100
0
100 0
17 0
Figure 16 Renderings of a modular station layout with an elecshytrolyzer for on-site production with a small reduced footprint
37
for a typical pipe diameter of 028rdquo and up to 15000 psi pressure (within the operating range of the cascade storage at a refueling station) air intakes must remain 34 ft from the containers while lot lines other building openings or ignition sources only need 17 ft of separation Exposed persons and parked cars must be 8 ft or more away from the containers and other exposures (including other combustibles like gasoline) do not need any separation from the containers This will allow a compact layout an example of which is shown in Fig 16
38
4 Conclusions
Five station designs were considered in this analysis with three capacities of each station deshysign With the current technology the lowest cost hydrogen source assessed here11 is tube-trailers delivering centrally produced gaseous hydrogen Shown in Table 10 or graphically in Fig 17 for either a conventional or modular station with a 300 kgday capacity and delivered hydrogen gas (using our conservative $15M cost estimate for the modular unit) it would cost approximately $186M to prepare the site and build the station and at a dispensed hydrogen cost of $1425kg a station operator would break even on their capital investments and operational costs in 7 years If the capital cost of the modular station unit is only $1M which is still in the range of cost estimates by manufacturers a modular station with delivered hydrogen would cost $136M to build and for a 300 kgday capacity hydrogen would cost $1265kg Embedded in all of these analyses is the utilization profile shown in Fig 2 which is the reason that the hydrogen cost increases as the cashypacity (and utilization) decreases for the modular stations with delivered hydrogen although they have the same installed cost
The specified 7-year return on investment results in higher cost hydrogen for smaller stations than for larger ones due to less throughput and higher capital cost per kg of capacity (see the lower left frame of Fig 17) If the SDO charges customers a price lower than this cost the result will be a longer return on investment Setting the same price regardless of station capacity will result in the 100 kgday station having the longest return on investment and the 300 kgday having the shortest
The addition of a steam methane reformer or an electrolyzer to a hydrogen refueling station increases the capital cost significantly with the steam methane reformer estimated to have the
11The cost of liquid delivery was not included in this analysis
Table 10 Installed cost (which includes site preparation engishyneering amp design permitting component capital and installation costs) and resulting hydrogen cost to break even at year 7 for the stations analyzed in this work
station capacity rarr 100 kgday 200 kgday 300 kgday
station type darr installed cost ($)
H2 cost ($kg)
installed cost ($)
H2 cost ($kg)
installed cost ($)
H2 cost ($kg)
conventional delivered H2 conventional SMR H2 conventional electrolysis H2 modular ($15M) delivered H2 modular ($1M) delivered H2 modular ($15M) electrolysis H2 modular ($1M) electrolysis H2
$151M $274M $238M $186M $136M $274M $224M
$3053 $3847 $3966 $3390 $2912 $4303 $3825
$169M $383M $298M $186M $136M $314M $264M
$1837 $2596 $2651 $1916 $1677 $2730 $2491
$186M $443M $345M $186M $136M $345M $295M
$1426 $2023 $2174 $1425 $1265 $2173 $2013
39
$00M$05M$10M$15M$20M$25M$30M$35M$40M$45M
inst
all
ed
cost
($)
capacity (kgday)
100 200 300
conv
ention
al d
eliv
ered
gas
conv
ention
al S
MR
conv
ention
al e
lect
roly
sis
mod
ular
($1
5M
) d
eliv
ered
gas
mod
ular
($1
M) d
eliv
ered
gas
mod
ular
($1
5M
) e
lect
roly
sis
mod
ular
($1
M) e
lect
roly
sis
$0k
$5k
$10k
$15k
$20k
$25k
$30k
inst
all
ed
cost
($[
kg
day]
)
conv
ention
al d
eliv
ered
gas
conv
ention
al S
MR
conv
ention
al e
lect
roly
sis
mod
ular
($1
5M
) d
eliv
ered
gas
mod
ular
($1
M) d
eliv
ered
gas
mod
ular
($1
5M
) e
lect
roly
sis
mod
ular
($1
M) e
lect
roly
sis
$0$5
$10$15$20$25$30$35$40$45
H2 c
ost
($k
g)
capacity (kgday)
100 200 300
Figure 17 Installed cost (which includes site preparation engishyneering amp design permitting component capital and installation costs) are shown in the left frames The top frame is the total inshyvestment in 2016$ while the bottom left frame is the installed cost per mass of hydrogen dispensed (kgday) The hydrogen cost to break even at year 7 is shown in the right frame for the stations analyzed in this work
40
highest capital cost On-site production does allow for a more compact station footprint and does not require consideration for tube-trailer delivery routes With current technology and projected utility prices operating a steam methane reformer costs slightly less than operating an electrolyzer These offsetting differences in capital vs operational costs causes the price of hydrogen to be very similar for a station with SMR produced hydrogen and electrolysis produced hydrogen In both cases the cost of hydrogen is $6-$10kg more for the stations that produce hydrogen on-site than the stations that have hydrogen delivered This analysis does not include the startup and shutdown inefficiencies (and associated costs) for either the SMR or electrolyzer The penalty for cycling a SMR is likely greater than for cycling an electrolyzer potentially giving an electrolyzer an economic advantage for on-site production
Electrolyzers also have the potential to produce less carbon dioxide than SMRrsquos By definishytion SMRrsquos require methane which contains carbon to produce hydrogen releasing the carbon molecules as carbon dioxide and contributing to climate change A reduced carbon footprint could be achieved by using bio-gas or implementing carbon capture and storage (although this would incur an efficiency penalty) Electrolyzers on the other hand require only electricity and water giving this technology the potential to be completely carbon free given the right source of elecshytricity such as solar wind hydroelectric or nuclear The key to making on-site production more cost competitive with delivered hydrogen is reducing the utility costs For electrolysis this can be achieved through efficiency improvements (although around 50-70 efficiencies are achieved with current technology) through the purchase of low cost off-peak electricity or by using elecshytricity generated behind the meter Of course reducing capital cost and maintenance requirements of on-site production units will also improve the economics of this technology
According to our research current modular fueling stations where components are assembled and tested at a central production facility have installed costs no higher than conventional stations Using our high estimate of $15M for the modular unit the installed cost of the 300 kgday modular station is nearly the same as for a 300 kgday conventional station Using a lower cost estimate of $1M for the modular unit the installed cost of a 100 kgday conventional station is 11 higher than the modular station With greater industry experience and higher volume production we would anticipate the cost of modular stations to reduce in the near-future Developing stations in this manner may lead to better quality control and reduced maintenance requirements for hydrogen fueling stations It is also possible to achieve more compact station footprints by modularizing the station components by building in appropriate fire-rated barrier walls Because of these potential benefits we anticipate modularization and standardization to increase in the future
This report details the economics of current hydrogen refueling stations and includes some sketches of potential layouts We have visually depicted the contributions to capital and operational costs of hydrogen for different station concepts making it easy to find the largest contributors to a high cost of hydrogen to the consumer This information can be used to devote research and development towards these high contributors At the station the dispenser compressors and chillers are expensive pieces where additional development or higher volume production could reduce station costs For electrolysis the purchase of low-priced electricity could serve to make on-site production cost competitive with central production and delivery This report enables the comparison of different station concepts that could be implemented in various market scenarios
41
A Piping amp Instrumentation Diagram
The following pages show the piping and instrumentation diagram for the included reference stations For the conventional stations all components need to be assembled on-site The dashed boxes show the components that are often modularized for the modular stations For reference the utility requirements shown in the PampID are also included here in Table A1
Table A1 Utility requirement estimateslowast for the stations in this report
capacity 100 kgday 200 kgday 300 kgday
compressor power electrolyzer power electrolyzer water SMR power SMR water SMR gas
25 kW 260 kW 110 lhr 16 kW 400 lhr 34 Nm3hr
60 kW 510 kW 220 lhr 33 kW 800 lhr 68 Nm3hr
100 kW 770 kW 330 lhr 49 kW 1200 lhr 101 Nm3hr
lowast These are averages based on manufacturer specifications and literature and are meant to give an estimate of site requirements For exact specifishycations to meet station requirements consult a manufacturer directly
42
ABCDEFGHIJK1
2
3
4
5
6
7
Measured Variable Readout of function Output Function ModifierA Air AlarmB Burner Storage Users Choice Users ChoiceC Compressor ClosedD DispenserE Electrolyzer Sensor (primary Element)F Flow FilterG Chiller Glass viewingH Hand HighI Current IndicatorJ PowerK Time Control StationL Level Light LowM Conductivity MiddleN Users Choice Users Choice Hydrogen Users ChoiceO Water Orifice restriction Air OpenP PressureQ QuantityR Reformer Record ReduceS Speed Frequency SwitchT Temperature TransmitU Multivariate Multifunction Multifunction MultifunctionV Vibration ValveW Weight Well WaterX Unclassified Unclassified Unclassified UnclassifiedY State RelayZ Position Actuator
PROCESS AND SIGNAL LINES
HYDROGEN PROCESS LINE
DEIONIZED WATER PROCESS LINE
PNEUMATIC SIGNAL LINE
NITROGEN SIGNAL LINE
ELECTRICAL SIGNAL LINE
SV
VALVES
BALL VALVE
NEEDLE VALVE
CHECK VALVE
SOLENOID VALVE
AIR ACTUATED VALVE SPRING RETURN CLOSE
PRESSURE REDUCING VALVE
TWO WAY PRESSURE RELIEF
THREE WAY PRESSURE RELIEF
EQUIPMENT
FILTER
PUMP
DRYER
HYDROGEN COMPRESSOR
STORAGE TANK
IR FLAME DETECTOR
Line Service Identification codesCCA-CLEAN COMPRESSED AIRCHW-CHILLED WATERH-HYDROGENN-NITROGEN
Pipe Specification Details3000PSI Min pressure rating of 3000 PSI 316316L austenitic stainless steel tubing UNS S31600 (316) UNS S31603 (316L)6500PSI Min pressure rating of 6500 PSI 316316L austenitic stainless steel tubing UNS S31600 (316) UNS S31603 (316L)15000PSI Min pressure rating of 15000 PSI 316316L austenitic stainless steel tubing UNS S31600 (316) UNS S31603 (316L)POLY Polyamide (Nylon) pneumatic tubing light and heat stabilized0032CU 0032 wall copper alloy 122 seamless tubingSCH40 Schedule 40 iron pipe
Line symbolsXrdquo-XXX-XXXX-XXX-XXX
Line size nominal inches
Service
Line Number (if assigned)
Pipe Spec
Insulation (if applicable)
Insulation codesF1- Soda-lime silicate glass (FOAMGLAS) 1 wall thicknessF2- Buna N Foam 38 thick
ABCDEFGHIJK1
2
3
4
5
6
7
CNH-300
HV-202HV-203
HV-201PT-300PI-300 HV-300
HV-301
Motor460-V 3Oslash SEE NOTE 1
Heater120-V 1Oslash 500 W
PT-202PI-202
34-H-VENT
1-frac14rdquo-CHW-800-SCH40
1-frac14rdquo-CHW-800-SCH40-F2
CW-800
GW-800
HV-202
HV-300
FV-100
ZSO-100
ZSC-100
ZI-100
FSV-100
ZZO-100
FSV-30038-H-3000PSI
38-H-5000PSI
38-H-5000PSI
38-H-15000PSI
34-H-VENT
OF-802TO COMMON frac34rdquo VENT MAST LOCATED ON BACK OF GMP
10 ABOVE GRADE
REFERENCE STATION 100-300 KGDAY
FF-300
GW-801
PI-101 PT-101
H2 Storage PBNH-402MAWP-15000 PSIG
H2 Storage PBNH-403MAWP-15000 PSIG
H2 Storage PBNH-401MAWP-15000 PSIG
FV-401
ZSO-401 ZSC-401
ZZO-401
FV-402
ZSO-402 ZSC-402
ZZO-402
FV-403
ZSO-403 ZSC-403
ZZO-403
FV-400
ZSO-400 ZSC-400
ZZO-400 GN-900
CHILLER 75-kW
DN-900JSS-901(EPO)
To EPO circuit
700-BAR NOZZLE
350-BAR NOZZLE
38-H-15000PSI
H70-T40H70-Warm
H35-T0
3570MPa DISPENSERWUN-900
FVControls Internal120V 1p 15A
GN-901
HEAT EXCHANGER1350 lbs
HV-901
H70-Cold
H2 Delivery Trailer multiple tubes one outlet
COH-100Air Compressor
PBAL-100
HV-100
AF-100
Air DryerAF-101
HV-900
PT-403PI-403
HV-403
PT-402PI-402
HV-402
PT-401PI-401
HV-401
HV-411
HV-412
HV-413
ZI-401
ZI-402
ZI-403
FV-101
ZSO-101 ZSC-101 ZI-101
ZZO-101
ZVO-100
ZVO-101
ZVO-900
ZVO-401
ZVO-400
ZVO-402
ZVO-403
RAH-100IR FLAME DETECTOR
AIMED AT HYDROGEN SOURCEAND ZONE 400
HIGH PRESSURE STORAGE
TO FIRE PANEL
RAH-900
IR FLAME DETECTORAIMED AT DISP HOSES
TO FIRE PANEL
HV-101
38-H-15000PSI
ZI-400
HV-400
FSV-200
EN-100ELECTROLYZER SKID
20 BAR (300 PSI) OUTPUT
RN-100STEAM METHANE REFORMER (SMR)
SKID13 BAR (200 PSI) OUTPUT
ZVO-102
Power460-V 3OslashSEE NOTE 1
Power460-V 3OslashSEE NOTE 1
ONLY ONE HYDROGEN SUPPLY OPTION IS USED PER STATION 1 TUBE TRAILER DELIVERY2 ON-SITE ELECTROLYSIS3 ON-SITE STEAM METHANE REFORMER
MUNICIPAL WATER SUPPLY
SEE NOTE 1
NATURAL GAS BIOGAS METHANE SUPPLY
SEE NOTE 1
NOTE 1 UTILITY REQUIREMENTS DEPEND ON STATION CAPACITY AND CAN BE ESTIMATED BASED ON THE FOLLOWING TABLESTATION CAPACITY 100 KGDAY 200 KGDAY 300 KGDAYELECTROLYZER POWER 260 KW 510 KW 770 KWELECTROLYZER WATER 110 LHR 220 LHR 330 LHRSMR POWER 16 KW 33 KW 49 KWSMR WATER 400 LHR 800 LHR 1200 LHRSMR GAS 34 NM3HR 68 NM3HR 101 NM3HRCOMPRESSOR POWER 25 KW 60 KW 100 KW
NOTE 2 ON-SITE PRODUCTION UNITS MAY INCORPORATE THEIR OWN INSTRUMENT AIR SYSTEM AND INTERCONNECTION WITH CSD SKIDCONTAINER MAY NOT BE NECESSARYNOTE 3 APPLIES TO MODULAR STATION ONLY A BUILD-ON-SITE STATION WILL NOT HAVE A SKID-OR CONTAINER-MOUNTED PRE-ASSEMBLED SYSTEMNOTE 4 IN SOME MODULAR STATIONS THE DISPENSER WILL BE A SEPARATELY-INSTALLED COMPONENTNOTE 5 IN MANY MODULAR STATIONS THE HEAT EXCHANGE EQUIPMENT WILL BE ROOF-MOUNTED
NOTE 2
COMPRESSION STORAGE AND DISPENSER (CSD) SKID OR CONTAINER BOUNDARY SEE NOTE 3
NOTE 4
NOTE 5
NOTE 5
PLCGas Control Cabinet
COMPRESSORMULTIPLE STAGES
References
[1] US Energy Information Administration EIA Open Data - Intro - US Energy Information Administration (EIA) accessed July 2016 httpwwweiagovopendata
[2] US DOE DOE H2A Production Analysis accessed May 2016 httpswwwhydrogen energygovh2a_productionhtml
[3] Joseph Pratt Danny Terlip Chris Ainscough Jennifer Kurtz and Amgad Elgowainy H2FIRST reference station design task Technical Report SAND2015-2660 R Sandia National Laboratories April 2015 Available at httpenergygoveerefuelcells h2first
[4] US DOE DOE H2A Delivery Analysis accessed May 2016 httpswwwhydrogen energygovh2a_deliveryhtml
[5] 2016 Annual Evaluation of Hydrogen Fuel Cell Electric Vehicle Deployment and Hydrogen Fuel Station Network Development Technical report California Environmental Protection Agency Air Resources Board July 2016 Available at httpswwwarbcagovmsprog zevproghydrogenhydrogenhtm
[6] E Sutherland and F Joseck Low volume production and delivery cost Technical Report 15011 Department of Energy Hydrogen and Fuel Cells Program Record 2015
[7] Ricardo Guerrero Lemus and Jose Manuel Martinez Duart Updated hydrogen production costs and parities for conventional and renewable technologies International Journal of Hydrogen Energy 35(9)3929ndash3936 2010
[8] Alfredo Ursua Luis M Gandia and Pablo Sanchis Hydrogen production from water elecshytrolysis current status and future trends Proceedings of the IEEE 100(2)410ndash426 2012
[9] G Parks R Boyd J Cornish and R Remick Hydrogen station compression storage and dispensing technical status and costs Systems integration Technical Report NRELBKshy6A10-58564 National Renewable Energy Laboratory (NREL) Golden CO May 2014
[10] NFPA 2 Hydrogen Technologies Code Technical report National Fire Protection Associashytion 2016
45
- Executive Summary
- Acknowledgment
- Contents
- Figures
- Tables
- 1 Introduction
-
- 11 Background and Contents
- 12 Approach
- 13 Method Overview
-
- 2 Station Cost Components
-
- 21 Centrally Produced Hydrogen and Delivery
- 22 Hydrogen Produced On-Site via Steam Methane Reforming
- 23 Hydrogen Produced On-Site via Electrolysis
- 24 Compression Storage and Ancillary Equipment for a Conventional Station
- 25 Packaged Compression Storage and Ancillary Equpiment for a Modular Station
- 26 Hydrogen Dispensers
-
- 3 Results Station Designs and Costs
-
- 31 Conventional Station with Delivered Centrally Produced Hydrogen
- 32 Conventional Station with Hydrogen Produced On-Site via Steam Methane Reforming
- 33 Conventional Station with Hydrogen Produced On-Site via Electrolysis
- 34 Modular Station with Delivered Centrally Produced Hydrogen
- 35 Modular Station with Hydrogen Produced On-Site via Electrolysis
-
- 4 Conclusions
- Appendix A Piping and Instrumentation Diagram
- References
-

Comparison of conventional vs modular hydrogen refueling stations and on-site production vs delivery
Ethan S Hecht Joseph Pratt Sandia National Laboratories
Prepared by Sandia National Laboratories Albuquerque New Mexico 87185 and Livermore California 94550
Sandia National Laboratories is a multi-mission laboratory managed and operated by Sandia Corporation a wholly owned subsidiary of Lockheed Martin Corporation for the US Department of Energyrsquos National Nuclear Security Administration under contract DE-AC04-94AL85000
NREL is a national laboratory of the US Department of Energy Office of Energy Efficiency amp Renewable Energy operated by the Alliance for Sustainable Energy LLC under contract DE-AC36-08GO28308
Approved for public release further dissemination unlimited
SAND2017-2832
National Renewable Energy Laboratory Sandia National Laboratories 15013 Denver West Parkway Albuquerque New Mexico 87185 Golden Colorado 80401 Livermore California 94550 303-275-3000 middot wwwnrelgov wwwsandiagov
ii
Issued by Sandia National Laboratories operated for the United States Department of Energy by Sandia Corporation
NOTICE This report was prepared as an account of work sponsored by an agency of the United States Government Neither the United States Government nor any agency thereof nor any of their employees nor any of their contractors subcontractors or their employees make any warranty express or implied or assume any legal liability or responsibility for the accuracy completeness or usefulness of any information apparatus product or process disclosed or repshyresent that its use would not infringe privately owned rights Reference herein to any specific commercial product process or service by trade name trademark manufacturer or otherwise does not necessarily constitute or imply its endorsement recommendation or favoring by the United States Government any agency thereof or any of their contractors or subcontractors The views and opinions expressed herein do not necessarily state or reflect those of the United States Government any agency thereof or any of their contractors
Printed in the United States of America This report has been reproduced directly from the best available copy
Available to DOE and DOE contractors from US Department of Energy Office of Scientific and Technical Information PO Box 62 Oak Ridge TN 37831
Telephone (865) 576-8401 Facsimile (865) 576-5728 E-Mail reportsadonisostigov Online ordering httpwwwostigovbridge
Available to the public from US Department of Commerce National Technical Information Service 5285 Port Royal Rd Springfield VA 22161
Telephone (800) 553-6847 Facsimile (703) 605-6900 E-Mail ordersntisfedworldgov Online ordering httpwwwntisgovhelpordermethodsasploc=7-4-0online
DE
PA
RT
MENT OF EN
ER
GY
bull13 bull13UN
IT
ED
STATES OFA
M
ER
IC
A
iii
SAND2017-2832 Unlimited Release
Printed March 2017
Comparison of conventional vs modular hydrogen refueling stations and on-site production vs delivery
Ethan S Hecht and Joseph Pratt Sandia National Laboratories
Abstract
To meet the needs of public and private stakeholders involved in the development conshystruction and operation of hydrogen fueling stations needed to support the widespread roll-out of hydrogen fuel cell electric vehicles this work presents publicly available station templates and analyses These lsquoReference Stationsrsquo help reduce the cost and speed the deployment of hydrogen stations by providing a common baseline with which to start a design enable quick assessment of potential sites for a hydrogen station identify contributors to poor economics and suggest areas of research This work presents layouts bills of materials piping and inshystrumentation diagrams and detailed analyses of five new station designs In the near term delivered hydrogen results in a lower cost of hydrogen compared to on-site production via steam methane reforming or electrolysis although the on-site production methods have other advantages Modular station concepts including on-site production can reduce lot sizes from conventional assemble-on-site stations
iv
Executive Summary
For the wide-spread adoption of fuel cell electric vehicles (FCEVs) additional fueling stations need to be constructed in the US A wide variety of private and public stakeholders are involved in the development of this hydrogen fueling infrastructure Each stakeholder has particular needs to be met in the station planning development and operation process A sample of stakeholders and needs is given here
bull Station developersoperators (SDOs) quick evaluation of potential sites and needs lower investment risk general cost and return estimates
bull Local authorities understand devices components in a typical station bull Code developers understand near-term needs for code refinement bull Other analysis groups new tool and baseline for economic studies bull Businessesentrepreneurs and RampD organizations identification of near-term business
solution and technology needs bull Local municipalities and the general public high-level understanding of typical stations
lowering acceptance risk bull Funding and financing organizations understanding of current technological capabilities
costs and market needs
Hydrogen fueling station equipment designs and costs vary between developers and are often treated as proprietary information While necessary from a business standpoint this can hinder the ability to discuss station design details in a collaborative way
Publicly available templates of representative station designs can be used to meet many of the stakeholder needs outlined above These lsquoReference Stationsrsquo help reduce the cost and speed the deployment of hydrogen stations by providing a common baseline with which to start a design enable quick assessment of the suitability of a particular site for a hydrogen station and identify contributors to poor economics and areas of research needed for certain station designs This work presents five new reference station designs for use by the hydrogen infrastructure community The Phase 1 Reference Station Design Taskdagger examined four build-on-site stations which obtain hydrogen from compressed gas or liquid delivery trucks The current work builds on the Phase 1 work by producing designs and economic analyses of factory built lsquomodularrsquo stations and stations utilizing on-site generation and also brings the cost of supplied hydrogen into the analysis It includes one traditional design from the Phase 1 work to enable equal comparisons between all station types in the two works For all station types three capacities were examined 100 kgday 200 kgday and 300 kgday The five station types developed in this work are
bull Conventional (assemble-on-site) stations with hydrogen 1 delivered as compressed gas from a centralized already operational production facility
(baseline) 2 produced on-site through steam methane reforming (SMR) 3 produced on-site through electrolysis
daggerJ Pratt D Terlip C Ainscough J Kurtz and A Elgowainy H2FIRST reference station design task Technishycal Report SAND2015-2660R Sandia National Laboratories April 2015 Available at httpenergygoveere fuelcellsh2first
v
bull Modular fueling stations with hydrogen 4 delivered as compressed gas from a centralized production facility 5 produced on-site through electrolysis
The cost components of hydrogen fueling stations consist of capital cost of equipment instalshylation site acquisition and development and operating expenses For conventional stations capital costs of the equipment were estimated based on updated bills of material from the Phase 1 work Capital costs for modular stations and modular hydrogen production units were based on discusshysions with several manufacturers Operation costs such as the cost of electricity and other utilities if necessary were estimated using data from several sources
Revenue is assumed to be solely from the sale of hydrogen Operating expenses and revenue calculations depend on the assumed throughput of hydrogen The same utilization profile used in the Phase 1 work was used herein to calculate throughput although it was delayed in the onset year This utilization model estimates that starting in 2017 5 of station capacity will be utilized As the number of fuel cell vehicles on the roads continues to increase the utilization of stations is projected to increase up to a maximum of 80 in 2026 All costs were combined with revenue to determine the overall cost of hydrogen to the SDO such that the station will break even on investments in 7 years SDO margin and retail fuel taxes will be added to the calculated hydrogen cost to determine the final price to the consumer but both of these aspects are outside the scope of this work
Because the costs in this work are estimated (typically averages of costs from various situations andor a range of manufacturers) they will likely be different than that of an actual station To correct for differences in up-front capital or installation costs a graphical tool is included for the reader to estimate the resulting change in hydrogen cost for a given change in investment cost For example the tool can be used to show that a decrease of $300000 in (depreciable) up-front costs from that estimated herein for a 300 kgday station would result in a corresponding $100kg decrease in hydrogen cost
Economic results of the five different station concepts show that stations served by centrally produced delivered gaseous hydrogen are more economical compared to those which generate hydrogen on-site via SMR or electrolysis Higher capacity stations have a lower cost for hydrogen to break even at the same point in time compared to lower capacity stations Using the economic model specifying that a station will break even in year 7 both 300 kgday modular stations (at $15M for the uninstalled modular unit) and conventional stations with central hydrogen production and delivery in tube-trailers have a hydrogen cost of $1425kg (a lower uninstalled modular unit price of $1M results in a hydrogen cost of $1266kg) On-site production stations either through steam methane reforming or electrolysis have significantly higher capital costs than delivered centrally produced hydrogen This increase in capital results in a hydrogen cost increase of $6shy$10kg depending on the station capacity While SMR capital costs are higher than electrolyzer costs the electricity cost ends up making electrolyzer-supplied stations the most expensive option in terms of resulting cost per kilogram of dispensed hydrogen under the assumptions of this work Full cost results are shown in Table ES-1 and Fig ES-1
In addition to the economics the station equipment was laid-out in typical land use arrange-
vi
$00M$05M$10M$15M$20M$25M$30M$35M$40M$45M
inst
all
ed
cost
($)
capacity (kgday)
100 200 300
conv
ention
al d
eliv
ered
gas
conv
ention
al S
MR
conv
ention
al e
lect
roly
sis
mod
ular
($1
5M
) d
eliv
ered
gas
mod
ular
($1
M) d
eliv
ered
gas
mod
ular
($1
5M
) e
lect
roly
sis
mod
ular
($1
M) e
lect
roly
sis
$0k
$5k
$10k
$15k
$20k
$25k
$30k
inst
all
ed
cost
($[
kg
day]
)
conv
ention
al d
eliv
ered
gas
conv
ention
al S
MR
conv
ention
al e
lect
roly
sis
mod
ular
($1
5M
) d
eliv
ered
gas
mod
ular
($1
M) d
eliv
ered
gas
mod
ular
($1
5M
) e
lect
roly
sis
mod
ular
($1
M) e
lect
roly
sis
$0$5
$10$15$20$25$30$35$40$45
H2 c
ost
($k
g)
capacity (kgday)
100 200 300
Figure ES-1 Installed cost (which includes site preparation enshygineering amp design permitting component capital and installation costs) are shown in the left frames The top frame is the total inshyvestment in 2016$ while the bottom left frame is the installed cost per mass of hydrogen dispensed (kgday) The hydrogen cost to break even at year 7 is shown in the right frame for the stations analyzed in this work
vii
Table ES-1 Installed cost (which includes site preparation enshygineering amp design permitting component capital and installation costs) and resulting hydrogen cost to break even at year 7 for the stations analyzed in this work
station capacity rarr 100 kgday 200 kgday 300 kgday
station type darr installed cost ($)
H2 cost ($kg)
installed cost ($)
H2 cost ($kg)
installed cost ($)
H2 cost ($kg)
conventional delivered H2 conventional SMR H2 conventional electrolysis H2 modular ($15M) delivered H2 modular ($1M) delivered H2 modular ($15M) electrolysis H2 modular ($1M) electrolysis H2
$151M $274M $238M $186M $136M $274M $224M
$3053 $3847 $3966 $3390 $2912 $4303 $3825
$169M $383M $298M $186M $136M $314M $264M
$1837 $2596 $2651 $1916 $1677 $2730 $2491
$186M $443M $345M $186M $136M $345M $295M
$1426 $2023 $2174 $1425 $1265 $2173 $2013
ments Modular stations and stations with on-site production show a substantial decrease in overall required lot size due to reduced equipment size reduced truck access requirements and reduced setback distances The included piping and instrumentation diagram shows the system level reshyquirements for components and instruments and includes an estimate of utility requirements which are intended to be useful for site screening
This work details the economics of current hydrogen refueling stations and includes some sketches of what these fueling stations might look like It visually depicts the contributions to capital and operational costs of hydrogen for different station concepts making it easy to find the largest contributors to a high cost of hydrogen to the consumer This information can be used to devote research and development towards these high contributors At the station the dispenser compressors and chillers are expensive pieces where additional development or higher volume production could reduce station costs For electrolysis the purchase of low-priced electricity could serve to make on-site production cost competitive with central production and delivery This report enables the comparison of different station concepts that could be implemented in various market scenarios
viii
Acknowledgment
This work is funded by the US Department of Energy (DOE) Fuel Cell Technologies Office in the Office of Energy Efficiency and Renewable Energy
The Hydrogen Fueling Infrastructure Research and Station Technology Project (H2FIRST) is a DOE project executed by Sandia National Laboratories and the National Renewable Energy Labshyoratory The objective of H2FIRST is to ensure that fuel cell electric vehicle customers have a positive fueling experience relative to conventional gasolinediesel stations as vehicles are introshyduced (2015ndash2017) and transition to advanced refueling technology beyond 2017
DOEs Fuel Cell Technologies Office established H2FIRST directly in support of H2USA a public-private collaboration co-launched by DOE and industry in 2013 to address the key chalshylenges of hydrogen infrastructure
In addition to DOE the team wishes to thank the H2USA Hydrogen Fueling Station Working Group California Fuel Cell Partnership the California Energy Commission the California Air Reshysources Board and representatives from industry including H2 Logic Hydrogenics ITM Power Linde Nuvera PDC Machines Proton OnSite and Siemens AG for their input and support
ix
x
Contents
Executive Summary v 1 Introduction 1
11 Background and Contents 1 12 Approach 3 13 Method Overview 3
2 Station Cost Components 10 21 Centrally Produced Hydrogen and Delivery 10 22 Hydrogen Produced On-site via Steam Methane Reforming 13 23 Hydrogen Produced On-site via Electrolysis 14 24 Compression Storage and Ancillary Equipment for a Conventional Station 15 25 Packaged Compression Storage and Ancillary Equpiment for a Modular Station 17 26 Hydrogen Dispensers 18
3 Results Station Designs and Costs 19 31 Conventional Station with Delivered Centrally Produced Hydrogen 19 32 Conventional Station with Hydrogen Produced On-site via Steam Methane Reshy
forming 25 33 Conventional Station with Hydrogen Produced On-site via Electrolysis 27 34 Modular Station with Delivered Centrally Produced Hydrogen 31 35 Modular Station with Hydrogen Produced On-site via Electrolysis 35
4 Conclusions 39
Appendix
A Piping amp Instrumentation Diagram 42 References 45
Figures
ES-1 Installed cost (which includes site preparation engineering amp design permitting component capital and installation costs) are shown in the left frames The top frame is the total investment in 2016$ while the bottom left frame is the installed cost per mass of hydrogen dispensed (kgday) The hydrogen cost to break even at year 7 is shown in the right frame for the stations analyzed in this work vii
1 Historical and projected price of US No 2 Diesel (top) natural gas (middle) and electricity (bottom) from EIA data [1] 5
2 Utilization model from 2017 to 2036 of the theoretical hydrogen fueling stations in this report 6
xi
3 Additional cost of hydrogen given initial constructioncapital investment for the station utilization profile shown in Fig 2 Numbers on the graph lines are the years required to break even on the investment solid lines are for a depreciable asset (on a 7 year MACRS schedule) and dashed lines are for a non-depreciable asset Points on the plots are examples from the text 9
4 Breakdown of annual costs associated with delivery of hydrogen for a 100 (left) 200 (center) and 300 (right) kgday station Does not include the cost of hydrogen production or transport trailer 11
5 Cost for centralized production of hydrogen for the model used in this study and an H2A model (based on 380000 kgday production) [2] 12
6 Total costs associated with central production of hydrogen delivery and storage in a tube-trailer for a 100 (left) 200 (center) and 300 (right) kgday hydrogen refueling station 13
7 Annual production cost of 500 kgday hydrogen from distributed steam methane reforming as predicted by the current model and using the H2A production model 14
8 Cost and revenue associated with a conventional assemble-on-site station with centrally produced delivered hydrogen to break even at year 7 (2023) The net income includes the effects from depreciation and taxes Capital replacement costs and intervals are not included in this model (accuracy past 2023 is limited) Pie charts on the right show the breakdown of cumulative capital and operating costs over the 7-year analysis period to the cost of dispensed hydrogen 20
9 Renderings of a conventional station layout with delivered gaseous hydrogen 24
10 Cost and revenue associated with a conventional assemble-on-site station with on-site steam methane reforming produced hydrogen to break even at year 7 (2023) The net income includes the effects from depreciation and taxes Capital replaceshyment costs and intervals are not included in this model Pie charts on the right show the breakdown of cumulative capital and operating costs over the 7-year analysis period to the cost of dispensed hydrogen 26
11 Renderings of a conventional station layout with on-site production of hydrogen 28
12 Cost and revenue associated with a conventional assemble-on-site station with on-site electrolysis produced hydrogen to break even at year 7 (2023) The net income includes the effects from depreciation and taxes Capital replacement costs and intervals are not included in this model Pie charts on the right show the breakshydown of cumulative capital and operating costs over the 7-year analysis period to the cost of dispensed hydrogen 29
13 Cost and revenue associated with a modular station with centrally produced deshylivered hydrogen to break even at year 7 (2023) assuming a $15M uninstalled capital cost of the modular station The net income includes the effects from deshypreciation and taxes Capital replacement costs and intervals are not included in this model Pie charts on the right show the breakdown of cumulative capital and operating costs over the 7-year analysis period to the cost of dispensed hydrogen 32
14 Renderings of a modular station layout with delivered hydrogen 34
xii
15 Cost and revenue associated with a modular station with on-site electrolysis proshyduced hydrogen to break even at year 7 (2023) assuming a $15M uninstalled capital cost of the modular station The net income includes the effects from deshypreciation and taxes Capital replacement costs and intervals are not included in this model Pie charts on the right show the breakdown of cumulative capital and operating costs over the 7-year analysis period to the cost of dispensed hydrogen 36
16 Renderings of a modular station layout with an electrolyzer for on-site production with a small reduced footprint 37
17 Installed cost (which includes site preparation engineering amp design permitting component capital and installation costs) are shown in the left frames The top frame is the total investment in 2016$ while the bottom left frame is the installed cost per mass of hydrogen dispensed (kgday) The hydrogen cost to break even at year 7 is shown in the right frame for the stations analyzed in this work 40
Tables
ES-1 Installed cost (which includes site preparation engineering amp design permitting component capital and installation costs) and resulting hydrogen cost to break even at year 7 for the stations analyzed in this work viii
1 Economically favorable station designs from the Phase 1 Reference Station Design Task [3] that were fully analyzed 2
2 Water costs in various locations in California 6 3 Data used to calculate delivered hydrogen costs 11 4 Equipment needed for a conventional hydrogen fueling station and estimated costs
(inflation adjusted from [3] or reassessed as described in the text) 16 5 Installed cost (which includes site preparation engineering amp design permitting
capital and installation costs) and hydrogen cost for conventional stations with centrally produced delivered hydrogen 22
6 Installed cost (which includes site preparation engineering amp design permitting capital and installation costs) and hydrogen cost for conventional stations with SMR on-site 25
7 Installed cost (which includes site preparation engineering amp design permitting capital and installation costs) and hydrogen cost for conventional stations with electrolysis on-site 30
8 Installed cost (which includes site preparation engineering amp design permitting capital and installation costs) and hydrogen cost for modular stations with delivshyered hydrogen for two cases of uninstalled modular cost $15M and $10M 31
9 Installed cost (which includes site preparation engineering amp design permitting capital and installation costs) and hydrogen cost for modular stations with on-site electrolysis produced hydrogen for two cases of uninstalled modular cost $15M and $10M 35
xiii
10 Installed cost (which includes site preparation engineering amp design permitting component capital and installation costs) and resulting hydrogen cost to break even at year 7 for the stations analyzed in this work 39
A1 Utility requirement estimateslowast for the stations in this report 42
xiv
1 Introduction
The Hydrogen Fueling Infrastructure Research and Station Technology Project (H2FIRST) is a US Department of Energy (DOE) project executed by Sandia National Laboratories and the Nashytional Renewable Energy Laboratory The objective of H2FIRST is to ensure that fuel cell electric vehicle (FCEV) customers have a positive hydrogen fueling experience relative to conventional gasolinediesel fueling stations as FCEVs are introduced and to enable any needed transitions to advanced refueling technology in the future
For the wide-spread adoption of fuel cell electric vehicles (FCEVs) additional fueling stations need to be constructed in the US This work provides economic analyses and layouts of current-technology fueling station designs that utilize state-of-the-art components These reference station designs can help reduce the cost and speed the deployment of hydrogen stations by providing a common baseline with which to start a design enable quick assessment of the suitability of a particular site for a hydrogen station and identify contributors to poor economics and areas of research needed for certain station designs
This work is intended to address the needs of a wide variety of stakeholders Some examples of stakeholders and applicability include
bull Station developersoperators (SDOs) quick evaluation of potential sites and needs lower investment risk general cost and return estimates
bull Local authorities understand devices components in a typical station bull Code developers understand near-term needs for code refinement bull Other analysis groups new tool and baseline for economic studies bull Businessesentrepreneurs and RampD organizations identification of near-term business
solution and technology needs bull Local municipalities and the general public high-level understanding of typical stations
lowering acceptance risk bull Funding and financing organizations understanding of current technological capabilities
costs and market needs
11 Background and Contents
This is a follow-on work to the Phase 1 Reference Station Design Task [3] That work screened 160 different station permutations and found 4 near-term station designs that were economically favorable and one future station The report provides thorough designs of these stations with bills of materials layouts on greenfields and co-located with gasoline stations and piping and instrumentation diagrams The resulting capital and hydrogen costs for the selected stations in that analysis are reprinted here in Table 1
However the cost of the hydrogen was not included in the analysis only the capital and opshyerating costs associated with the fueling station (ie compression high-pressure storage cooling and dispensing) In addition the Phase 1 Reference Station project did not consider on-site hyshy
1
Table 1 Economically favorable station designs from the Phase 1 Reference Station Design Task [3] that were fully analyzed
Target Market
Delivery Method
Daily Capacity (kgday)
Maximum Consecutive Fills
Hoses Hydrogen Costlowast
($kg)
Capital Cost (2009$)
high use high use
liquid liquid
300 300
5 5
2 2
$746dagger
ndash $1486557dagger
$2007358Dagger
high use low use
gas gas
300 200
6 3
1 1
$603 $782sect
$1251270 $1097560sect
intermittent gas 100 2 1 $1328 $954799 lowast Hydrogen cost in this table is only the station contribution to the cost of hydrogen and does not
include the cost of hydrogen delivered to the station dagger Costs for this future station assume a high-pressure evaporator and cryopump which are not curshy
rently commercially available Dagger Consistent capital cost for a hydrogen fueling station that has hydrogen delivered as a liquid using
currently available technology but the cost of hydrogen could not be calculated using HRSAM [4] sect A typography error in the first report has been corrected for the hydrogen and capital cost of this
200 kgday station
drogen generation nor the impacts of lsquomodularrsquo stations where most components are pre-packaged in an assembly plant potentially reducing footprint and cost compared to traditional build-on-site stations
This work builds on the Phase 1 Reference Station work by producing designs and economic analyses of modular stations and stations utilizing on-site generation It also re-evaluates one traditional design from the Phase 1 Reference Station work to enable equal comparisons between all station types in the two works
In this report we describe many facets of designing hydrogen fueling stations In Section 12 Approach the station concepts are described In Section 13 Method Overview the steps to buildshying a fueling station are outlined the sources of economic data needed to calculate station operating costs are reported along with the station utilization profiles The Method Overview section is inshytended for readers who are interested in the assumptions and data used to determine the cost of hydrogen as the economic model is detailed in this section In Section 2 Station Cost Composhynents further details of the economic assumptions made about specific pieces of hydrogen fueling stations are included An experienced SDO may wish to skip to Section 3 Results Station Deshysigns and Costs which contains the detailed results of the economic model and includes sketches of hydrogen fueling stations
The wide variety of stakeholders on hydrogen refueling infrastructure and their interests means that some parts of the report will be more useful than others to different readers Rather than trying to simplify the report for one audience at the expense of another it is inclusive of all assumptions data and methods so that the reference stations described in this report can serve as a starting point for designs of real-world stations
2
12 Approach
In this work along with the costs associated with constructing and operating a hydrogen fueling station we also consider the costs of producing hydrogen on-site or having hydrogen produced at a centralized facility and delivered We also compare lsquoconventionalrsquo stations where parts (eg compressors tubing valves tanks) are assembled at the fueling station site to lsquomodularrsquo stations where parts (at least the compression and high-pressure storage if not the dispenser) are assembled at a centralized facility into a single unit and delivered to the fueling station site on a skid or in a trailer Five station concepts are considered herein
bull Conventional (assemble-on-site) stations with hydrogen 1 delivered as compressed gas from a centralized already operational production facility
(baseline) 2 produced on-site through steam methane reforming (SMR) 3 produced on-site through electrolysis
bull Modular fueling stations with hydrogen 4 delivered as compressed gas from a centralized production facility 5 produced on-site through electrolysis
For each of these concepts 100 200 and 300 kgday stations are studied since these capacities are appropriate for current and near-term station builds as identified in the Phase 1 Reference Station Design report [3] Costs (capital and operating) for each of these stations were estimated and the cost of hydrogen1 was calculated Components needed for each of these station concepts are specified and potential layouts are presented
13 Method Overview
Building a hydrogen fueling station requires several steps (which have associated costs andor considerations)
1 Identification and acquisition of land where the station can be built 2 Design of the station to account for the available space If hydrogen is to be delivered
delivery routes for the large tube-trailers must be planned 3 Design of utility connections including electrical power potentially water andor natural
gas bull Both conventional and modular stations require electrical power for the compressor
and chiller Trenching and conduit must be run transformers and electrical panels often require upgradingreplacement
bull On-site electrolysis requires a water supply (in addition to sufficient electrical power)
1In this work we refer to the cost of hydrogen rather than the price Using the method and assumptions described herein we calculate a per kg cost to a station developeroperator to provide hydrogen to consumers Station operators will be responsible for setting prices at their station which is what end consumers will pay for hydrogen and will vary based on local market demand profit margins retail fuel taxes and other considerations none of which are considered in this work The cost of hydrogen could be considered a lsquofixed minimum selling pricersquo to meet the payback criteria assumed in this analysis
3
bull On-site SMR requires water and natural gas (and sufficient electrical power) 4 Permitting and approval of the site design with the authorities having jurisdiction 5 Preparation of the site for station installation For a conventional station a concrete pad is
required and for modular stations concrete footings are needed at a minimum on which to secure the components or modular housing This concrete must be properly grounded and have a low electrical resistance to meet the fire code
6 Installation of the fueling station
In this analysis the costs of land procurement (step 1) are neglected Some costs in this analysis are based on the H2A Refueling Station Analysis Model (HRSAM) [4] In HRSAM the cost of installation of equipment (step 6) is 35 of the raw capital investment and the cost of site preparation engineering amp design project contingency and upfront permitting costs (steps 2-5) are 31 of the raw capital costs Accordingly here installation was assumed to cost 35 of the station capital for the conventional stations However since many of the modular installation costs are tied into the cost of the unit the cost of modular station installation is reduced to a flat cost of $60k (the details of this assumption can be found in Section 25) Also rather than using the percentage (31) for site preparation engineering amp design project contingency and upfront permitting costs in this analysis we assume a flat $300k for these costs This reflects the fact that these costs are linked more to the site itself rather than the cost and size of the equipment that must be installed on the site Since there is considerable variability in design permitting and site preparation costs we include additional analysis and charts showing how variability in these costs can change the cost of dispensed hydrogen later in this section
For all stations capital costs of the equipment were estimated Bills of materials for the conshyventional stations were assembled in the Phase 1 Reference Station Design Report [3] In this work we have updated these bills of material to estimate the cost of a conventional station today (2016) Capital costs for modular stations and modular hydrogen production units were based on discussions with several manufacturers For both the conventional and modular stations the design includes a single dispenser (ie credit card readeruser interface valving hose and nozshyzle to connect to the vehicle) able to dispense both 350 and 700 bar hydrogen located separately from the lsquostationrsquo (that contains the compressor high-pressure storage chiller programmable logic controller and safety equipment) Costs for specific components (eg compressors SMRs) are discussed in Section 2
In order to evaluate the operation costs the cost of several utilities and commodities namely diesel fuel natural gas electricity and water were needed With the exception of water these costs were estimated using pricing data from the US Energy Information Administration (EIA) [1] As shown in Fig 1 both historical and projected prices were extracted from the EIA database The data in the plots comes from the following series
bull Diesel ndash US No 2 Diesel Retail Prices Annual ndash Nominal Petroleum Prices Transportation Diesel Fuel Reference AEO2015
bull Natural gas ndash Retail Price of Natural Gas in Commercial Sector US Average Annual ndash Energy Prices Nominal Commercial Natural Gas United States Reference ndash Retail Price of Natural Gas in Industrial Sector US Average Annual
4
123456789
10
pri
ce (
nom
inal
$g
al)
diesel
0
5
10
15
20
25p
rice
(n
om
inal
$f
t3)
natural gas
commercial
industrial
1990 2000 2010 2020 2030 2040year
010
015
020
pri
ce (
nom
inal
$k
Wh
)
commercial electricity
Figure 1 Historical and projected price of US No 2 Diesel (top) natural gas (middle) and electricity (bottom) from EIA data [1]
ndash Energy Prices Nominal Industrial Natural Gas United States Reference AEO2015 bull Commercial electricity (US grid mix currently 13 renewable2)
ndash Retail Price of Electricity in Commercial Sector US Average Annual ndash Energy Prices Nominal Commercial Electricity United States Reference AEO2015
In all cases these data project out to 2045
It should be noted that the electricity prices estimated by EIA and used in this work assume status-quo reliance on fossil fuel In fact further cost reductions in renewable electricity generation
22015 estimate from httpwwweiagovtoolsfaqsfaqcfmid=92ampt=4
5
Table 2 Water costs in various locations in California
Location Price ($100 ft3) source
East Bay Los Angeles San Diego San Jose San Francisco San Francisco Peninsula
444 1022-10409 502 4509 714 7-8
ebmudcom dpwlacountygov sandiegogov sjwatercom sfwaterorg midpeninsulawaterorg
2020 2025 2030 2035year
0
20
40
60
80
100
uti
liza
tion
(
)
Figure 2 Utilization model from 2017 to 2036 of the theoretical hydrogen fueling stations in this report
technologies and utilization of low-cost stranded assets such as large nuclear coupled with increasshying fossil fuel costs may actually result in the opposite trend of future electricity rates As will be seen in the results variability in electricity rates can have a large impact on the cost effectiveness of on-site generation of hydrogen via electrolysis
Water is needed for electrolysis or steam methane reforming Water rates were estimated to be $8 per hundred cubic feet in 2016$ based on information from various sources of relevance to the California market shown in Table 2 While water rates can vary dramatically around the country as will be seen in the results the cost of water has a negligible impact on the resulting cost of hydrogen so using the California rates was deemed an acceptable approximation
In order to use this cost information to calculate operational costs and revenues a station utishylization rate must also be specified The same utilization profile used in Phase 1 of the Reference Station project [3] was used herein except the profile ramp has a delayed start as is suggested by a recent analysis by the California Air Resources Board [5] This profile is shown in Fig 2 As shown this utilization model estimates that starting in 2017 5 of station capacity will be utilized As the number of fuel cell vehicles on the roads continues to increase the utilization of stations is
6
projected to increase up to a maximum of 80 in 2026 This means for example that in 2026 and in perpetuity after a station sized for 100 kgday will sell on average 80 kgday hydrogen
Site preparation capital installation and operating costs were combined with hydrogen throughshyput and a required break-even time period on the initial investment to determine the overall cost of hydrogen to the SDO The estimates for these cost components are based on best-available inforshymation including consultation with station and equipment providers prior studies and government entities involved in publicly-funded stations However in most cases the estimated costs are avshyerages and can vary in practicendashfor example site preparation costs can vary widely or different manufacturers will have different costs for equipment with similar specifications If the reader has actual cost information that varies from that which is estimated in this report Fig 3 can be used to calculate the resulting change in hydrogen cost
Figure 3 shows the cost of hydrogen as a function of the initial non-depreciable cost by the dashed lines (eg land purchase costs) and an initial depreciable cost (eg equipment) by the solid lines Depreciation was estimated using a 7-year Modified Accelerated Cost Recovery System (MACRS) depreciation rate and an overall tax rate of 389 (35 federal and 6 state tax) the rate specified in HRSAM [4] The numbers and different colors in the plot represent the numbers of years required to make back the cost of the asset For example if one were to purchase land (which is non-depreciable) for $200k to make back that investment in 7 years the cost of hydrogen would be approximately $3kg higher than without the purchase for a 100 kgday station or about $1kg higher for a 300 kgday station (note that this assumes the stations are utilized at the rate shown in Fig 2) As a second example if a $1M electrolyzer were aded to a station (a depreciable investment) it would add $957kg for hydrogen to pay for that asset for a 100 kgday station and just over $3kg for a 300 kgday station (Note that the costs scale inversely with capacity because the same percentage station utilization rate shown in Fig 2 is used in this analysis In other words we assume that customers at the 100 kgday station are purchasing exactly 13 the hydrogen as at the 300 kgday station)
7
00 05 10 15
investment cost (M$)
0
2
4
6
8
10ad
dit
ion
al
H2 c
ost
($k
g)
55
7
7
11
11
13
13
100 kgday
(a) Additional cost of hydrogen for a 100 kgday station
00 05 10 15
investment cost (M$)
0
2
4
6
8
10
ad
dit
ion
al
H2 c
ost
($
kg
)
55 7
711
11
13
13
200 kgday
(b) Additional cost of hydrogen for a 200 kgday station
8
00 05 10 15
investment cost (M$)
0
2
4
6
8
10
ad
dit
ion
al
H2 c
ost
($k
g)
5
5 7
711
11
13
13
300 kgday
(c) Additional cost of hydrogen for a 300 kgday station
Figure 3 Additional cost of hydrogen given initial construcshytioncapital investment for the station utilization profile shown in Fig 2 Numbers on the graph lines are the years required to break even on the investment solid lines are for a depreciable asset (on a 7 year MACRS schedule) and dashed lines are for a non-depreciable asset Points on the plots are examples from the text
9
2 Station Cost Components
This section describes the primary contributors to the cost of hydrogen
bull Centrally Produced Hydrogen and Delivery bull Hydrogen Produced On-site via Steam Methane Reforming bull Hydrogen Produced On-site via Electrolysis bull Compression Storage and Ancillary Equipment for a Conventional Station bull Packaged Compression Storage and Ancillary Equpiment for a Modular Station bull Hydrogen Dispensers
Each subsection describes the technical details of the components and the rational for the assumed costs in the economic model
21 Centrally Produced Hydrogen and Delivery
For delivered hydrogen we included the cost of buying hydrogen from a centrally located production facility delivering it in tube-trailers and leasing tube-trailers for storage at the fueling station Initially the H2A Delivery Scenario Analysis Model (HDSAM) [4] was evaluated for its applicability to this project but this model did not have enough flexibility in its scenarios In this analysis we wanted to consider a single station and not consider savings from multiple station deliveries due to tractortrailer sharing In this analysis we did not model the cost of tractortrailer purchase and payment but rather considered a very early market scenario (ie the current market conditions) where the industrial gas company would own and control the delivery tractors and lease the tube-trailers to the station owners (assuming that they are left on-site until empty) Some of the data from HDSAM was used in this analysis including some parameters shown in Table 3 The delivery distance was assumed to be 200 miles so that delivered hydrogen costs could be compared to estimates from industrial gas companies [6] The trailers were assumed to have 300 kg of usable hydrogen There are some jumbo high-capacity tube-trailers in the market with closer to 1100 kg usable hydrogen3 but for these current market scenario simulations we assumed more conventional tube trailers with steel tubes and the smaller capacity With a 300 kg usable H2 capacity the utilization scenario shown in Fig 2 and a given station capacity were used to calculate the time to consume a tube-trailer The trips per year were calculated and fuel labor and other costs for delivering hydrogen were calculated Frequent deliveries of hydrogen would be necessary and it is likely that a fueling station would need to have multiple tube-trailers on site to ameliorate outages Especially for the 300 kgday station as the peak nameplate capacity is approached it may become infeasible to get daily tube-trailer deliveries and another type of hydrogen storage (ie liquid) or some on-site production would probably be required Nonetheless we performed the analysis with the assumption that the industrial gas companies would be able to provide near daily deliveries of tube-trailers in the out-years
Figure 4 shows the costs components associated with delivering tube trailers to a single station Because each station is assumed to follow the same utilization projections the costs follow the
3httpwwwthe-linde-groupcomennews_and_mediapress_releasesnews_20130925html
10
Table 3 Data used to calculate delivered hydrogen costs
description value
average delivery gas mileage1 6 mpg average delivery speed1 378 mph tube-trailer capacity2 300 kg tube-trailer maximum pressure2 250 bar delivery labor cost1 2121 $hr overhead on labor1 20 insurance cost1 $0106 mile licensing amp permits1 $0116 mile maintenance cost1 $0078 mile lease price3 $3500 month
1 data from HDSAM [4] 2 data from energygov
3 data from personal communications
2020 2025 2030 2035year
050
100150200250300350
deli
very
cost
(k$y
r)
diesellabor
insurancemaintenance
permitting
2020 2025 2030 2035year
diesellabor
insurancemaintenance
permitting
2020 2025 2030 2035year
diesellabor
insurancemaintenance
permitting
Figure 4 Breakdown of annual costs associated with delivery of hydrogen for a 100 (left) 200 (center) and 300 (right) kgday stashytion Does not include the cost of hydrogen production or transport trailer
11
2010
2015
2020
2025
2030
2035
2040
2045
2050
year
1
2
3
4
5
6
7
cost
(n
om
inal
$k
g)
centralized H2 production
current model (commercial NG)
H2A production
current model (industrial NG)
Figure 5 Cost for centralized production of hydrogen for the model used in this study and an H2A model (based on 380000 kgday production) [2]
same increasing trend out to 2026 The continued increase past 2026 is due to inflation which is estimated at 194 and the increasing cost of diesel fuel (Fig 1) This chart shows that labor is the largest contributor to hydrogen delivery costs followed by the cost of diesel to fuel the delivery truck All of these delivery costs scale proportionally if the delivery distance were to be smaller or larger than 200 miles The costs also scale proportionally with the nameplate capacity because the utilization scales with the nameplate capacity causing the larger stations to require proportionately more deliveries labor maintenance etc
Along with delivery costs in this analysis we also include the cost of the centrally produced hydrogen The cost of centrally produced hydrogen was estimated using a correlation from Lemus and Duart [7] Because the central hydrogen production plants that exist today make hydrogen from steam-methane reforming they found that production was linearly dependent on the price of natural gas
H2production cost = 12 middot NGprice + 6
where the cost and price are in $GJ Using the pricing data shown in Fig 1 this centrally produced hydrogen cost was calculated The DOErsquos H2A production model (version 301) [2] is compared to this calculation in Fig 5 using both commercial and industrial costs for natural gas As shown the Lemus and Duart model agrees quite well with the H2A production model until about 2042 Thus the commercial natural gas price was selected for use in further calculations of the costs associated with hydrogen production for conventional delivered hydrogen stations
Finally for delivered centrally produced hydrogen the cost of the tube trailer lease was inshycluded Shown in Table 3 the lease price was estimated at $3500 per month We assumed in
4Inflation rate taken from HRSAM [4]
12
2020 2025 2030 2035year
0100200300400500600700
deli
vere
d H
2 c
ost
(k$y
r)cent productiontube trailer lease
delivery
2020 2025 2030 2035year
cent productiontube trailer lease
delivery
2020 2025 2030 2035year
cent productiontube trailer lease
delivery
Figure 6 Total costs associated with central production of hyshydrogen delivery and storage in a tube-trailer for a 100 (left) 200 (center) and 300 (right) kgday hydrogen refueling station
this analysis that the stations would continually lease 2 tube trailers at $7000 per month so there would be no outages as the empty hydrogen tube trailers were exchanged We assumed that the lease cost was not affected by the number of deliveries required Figure 6 shows the total costs associated with delivered centrally produced hydrogen Within the red delivery bar are all of the costs shown in Fig 4 All three of the costs broken out in the plot (central production tube-trailer leasing and delivery) are significant contributors to the cost of centrally produced delivered hyshydrogen As shown the cost of the tube-trailer lease was fixed in this model for any station capacity resulting in a smaller percentage of the costs for 200 and 300 kgday stations This is far from a certain assumption The high lease price might cause a station operator to think about purchasing a tube-trailer (or fleet of tube-trailers) but the estimated cost of a tube trailer within HDSAM [4] is around $1 million At least two trailers would be required unless the station were shutdown while the tube trailers were being refilled so purchase might not make financial sense without an adshyvanced network of stations andor a long-term financial horizon An additional option to eliminate the trailer lease expense is to install a similar amount of low pressure hydrogen storage on site allowing the trailer to discharge its contents and depart This would add several hundred thousand dollars of capital cost to the station (depending on the amount and type of storage installed)
22 Hydrogen Produced On-site via Steam Methane Reforming
Cost information for on-site reformers was gathered from several manufacturers An estimate for capital cost is $115M for a 100 kgday unit $204M for a 200 kgday unit and $246M for a 300 kgday unit A functional fit was found to several data points including the H2A production model [2] capital cost for a 1500 kgH2day unit which is $325M As with most products the per kg cost of production reduces as the production rate increases
Feedstock consumption rates were also collected from manufacturers for several on-site reshyforming units Based on this information assumed rates of 39 kWhkgH2 96 lH2OkgH2 and 35
13
2010 2015 2020 2025 2030year
0
100000
200000
300000
400000
500000
600000
700000
800000
H2 p
rod
uct
ion
cost
($
)current model
H2A production
Figure 7 Annual production cost of 500 kgday hydrogen from distributed steam methane reforming as predicted by the current model and using the H2A production model
kgNGkgH2 were used to estimate operating costs The operating costs for the H2A production model for distributed SMR scaled down to 500 kgday [2] was compared to the operating costs calculated using the current model (using the cost information shown in Fig 1 and the commershycial price of natural gas) This comparison is shown in Fig 7 The annual operating costs of the current model which is based on recent manufacturer information are within 20 of the H2A model predictions
One factor that is not taken into account in this analysis is startup and shutdown production efficiencies and losses Because SMRs operate at high temperature start-up is slow and frequent shutdownstartup cycles can drastically reduce production efficiency It may be cheaper to simply produce and vent hydrogen continuously rather than cycling the unit off and back on The addishytional cost of running the SMR when it is not needed is not included in this analysis it is assumed that this process occurs instantaneously and without an efficiency penalty The impact of this assumption is that the operational costs of the SMR may be under-predicted by this model
23 Hydrogen Produced On-site via Electrolysis
The two most common type of electrolysis units on the market today are polymer electrolyte membrane (PEM) and alkaline PEM electrolysis units use the same technology as PEM fuel cells (which are found in vehicles) but the cells are biased and protons move in the opposite direction from a fuel cell Alkaline fuel cells have a liquid electrolyte solution that serves to transport ions from the electrodes Alkaline electrolyzers are a more mature technology can be cheaper and may have a longer lifetime than PEM electrolyzers but PEM electrolyzers produce higher purity hydrogen with less sensitivity to water purity are smaller can respond more quickly to changes in production rate and can produce hydrogen at pressure reducing compression needs In this
14
analysis we are not specifying the type of electrolyzer since costs (which are not precisely quoted in any case) are reasonably similar
Electrolyzer electricity consumption was estimated to be 56 kW-hrm3 = 624 kW-hrkgH2H2 There is some variability in electricity consumption depending on each manufacturerrsquos equipment but this value is in line with an analysis by Ursua et al [8] and is the average value from the Electrolyzer Energy composite data product (CDP)5 from NREL The municipal water consumpshytion was calculated as just under 3-times the stoichiometric value required based on the reacshytion (H2O rarr H2 + 12O2) (which accounts for purification system losses and other cooling water needs) at 264 lH2OkgH2 An informal survey of several companies led to capital cost estimates of $800k $12M and $15M for the 100 200 and 300 kgday stations These capital costs are lower than the SMR capital costs used in this analysis for an equivalent hydrogen production capacity For the modular electrolyzer units considered herein the installation cost was assumed to be a flat $60k regardless of the hydrogen production capacity an estimate based on discussions from several companies
Similar to the SMR the efficiency penalty for shutting down the unit and restarting it is not taken into account in this analysis This inefficiency is expected to be lower for electrolysis than SMR since the operation temperatures are much lower and the startup process is simpler Nonetheshyless there will be an efficiency penalty for cycling the electrolyzer off and back on so the elecshytrolyzer and storage sizes need to be optimized for the station utilization rates during station design
24 Compression Storage and Ancillary Equipment for a Conventional Stashytion
For conventional stations most equipment costs from Phase 1 of the reference station design report [3] were used in this analysis Shown in Table 4 costs for all but the compressor dispenser and chillercooling block were inflation adjusted from 2009$ to 2016$ at a 19 inflation rate The cost of the compressor was not simply inflated but rather re-estimated using the compressor size evaluated by HRSAM [4] and Fig 2 from the Phase 1 Reference Station Design report [3] The $100kndash$150k capital cost estimates for the compressors given in the first report were based on a specific station design with a smaller compressor rather than the compressor sizing evaluated by HRSAM The HRSAM estimates for compressor needs for the 100 200 and 300 kgday stations are 6 14 and 23 kghr as shown in the table Compressor energy consumption was assumed to be 42 kWhrkgH2 This is consistent with NRELrsquos Compressor Energy CDP6 and manufacturer specifications This factor was used to calculate the energy utilization and size the compressors at 25 60 and 100 kW for the 100 200 and 300 kgday stations respectively The electrical requirements are a bit more than those calculated by HRSAM which assumes that the compressors have a 65 isentropic efficiency but correspond well with literature [9] and manufacturer data
As with the Phase 1 report [3] the compressor is the only variable cost in different-sized station
5httpwwwnrelgovhydrogenimagescdp_infr_36jpg 6httpwwwnrelgovhydrogenimagescdp_infr_35jpg
15
Table 4 Equipment needed for a conventional hydrogen fuelshying station and estimated costs (inflation adjusted from [3] or reshyassessed as described in the text)
description quantity cost total tanks [13 kg each 945 bar MAWP Type II] 3 $45633 $136899 pressure transducer and indicator 6 $1141 $6845 block and bleed valve 6 $570 $3422 air operated valve 6 $2282 $13690 pilot solenoid valve 7 $57 $399 isolation hand valve 12 $570 $6845 check valve 3 $456 $1369 coolant pump 1 $1369 $1369 water chiller 2 $4563 $9127 coolant filter 1 $57 $57 instrument air compressor 1 $1141 $1141 instrument air dryer and filter 1 $2909 $2909 hydrogen compressor [2-stage 950 bar outlet]
100 kgday station - 6 kghr 25 kW $189827 $189827 200 kgday station - 14 kghr 60 kW 1 $328774 $328774 300 kgday station - 23 kghr 100 kW $453010 $453010
hydrogen dispenser [(1) 350 bar and (1) 700 bar hose] 1 $250000 $250000 hydrogen chiller and cooling block 1 $150000 $150000 IR flame detector 2 $1711 $3422 hydrogen filter 1 $2852 $2852 PLC 1 $5704 $5704 tubing - $22817 $22817 fittings - $17112 $17112 electrical upgrades - $57041 $57041 fencing - $5704 $5704 bollards - $5704 $5704
total (100 kgday station) total (200 kgday station) total (300 kgday station)
$894256 $1033203 $1157439
16
designs The developers of HRSAM [4] found the minimum size of the commonly available high pressure ground storage tanks to be 13 kg and three of these are needed for a cascade fill giving a minimum installed high-pressure storage amount of 39 kg This size was found to be sufficient for each station modeled in this work Since each station only has a single dispenser that cost also remains constant Using the varied compressor costs the conventional station equipment costs range from $900k to $12M
Costs for the hydrogen dispenser and the hydrogen chiller and cooling block were separated out and updated in this report where they were lumped together in the previous report The chiller and cooling block was estimated to cost $150k while the dispenser was estimated at $250k These costs are based on discussions with manufacturers and station operators who have purchased these pieces of equipment and are 15 higher than the estimated $350k combined cost in the previous report Part of the reason for this update is the evolution of dispenser design from an industrial-type interface to one that provides a retail customer experience more similar to that at a gasoline station and the associated cost of these newer dispensers
One high cost subsystem shown in Table 4 is the hydrogen compressor where cost savings can be realized by reducing the size of the compressor However the compressor size needs to be balanced by the high pressure storage and station utilization The hydrogen dispenser is also a significant cost as production volume increases on the components needed in the dispensers and the assembled dispensers this cost will likely decrease The same number and type (or at least cost) of dispenser valves pumps filters tanks tubing safety equipment etc are needed for the 100 kgday station as the 200 and 300 kgday stations
25 Packaged Compression Storage and Ancillary Equpiment for a Modushylar Station
Modular stations have the compressor hydrogen cooling block chiller high-pressure storage and control electronics housed in andor on a single container Manufacturing and installing these components in this way reduces installation labor allows leak and operation checking at a dedishycated facility and can potentially reduce equipment costs by enabling high volume production of standardized components Most station designers and companies are currently producing modular units and having at least some components in a modular shippable fashion is the preferred way of constructing stations at this time Our research shows that the primary savings associated with modular stations are in the installation costs Based on conversations with manufacturers capital costs of modular stations are currently on par with conventional stations This is likely because much of the same equipment is used in both types of stations We estimate modular fueling stations to cost between $750k to $15M depending on the manufacturer and whether or not a dispenser is included This price range is for a unit that can compress and provide 200-400 kgday hydrogen and spans the $890k-$12M capital cost range of the conventional station equipment While inshystallation of conventional stations is expected to be about 35 of capital costs [4] installation of equipment for a modular station is expected to be very low likely no more than 5 of the capital costs of the modular unit In this report installation cost was estimated to be $60k regardless of
17
station size the same as the electrolyzer unit installation costs since the installation requirements are similar
Most manufacturers make just one size of modular units so there might not be potential to save by having a smaller nameplate capacity In this analysis we provide estimates for total station costs for two cases of modular unit costs ($1M and $15M) to elucidate the effect of differing capital costs These costs are assumed to include the cost of the dispenser even though is is shown as being separated from the modular system in the layout sketches In the analysis below these two different costs are also used as a further example to show how Fig 3 can be used to adjust resulting hydrogen cost to account for variability in capital cost estimates
26 Hydrogen Dispensers
Both the modular and conventional on-site station components need to interface with a disshypenser The dispenser includes valving high pressure break-away(s) hose(s) nozzle(s) flow meshytering control electronics and a customer interface (point of sale system) Stations often provide both 350 and 700 bar fills requiring two hoses break-aways nozzles and additional plumbing and control electronics Dispensing units range in price from approximately $150k-$350k For a high utilization area where one would want to allow multiple simultaneous fills the cost of additional dispensers would need to be factored into an analysis In this analysis both the conventional stashytion and modular station total cost estimates include the cost of a single dispenser with both a 350 and 700 bar hose
18
3 Results Station Designs and Costs
Multiple approaches exist to financially model fueling stations and determine the cost of hydroshygen One approach is to perform a discount cash flow analysis specifying a return on investment that is desired after a given time-frame This is the approach taken in HRSAM [4] and used in the Phase 1 Reference Station Design report [3] Specifying a 30 year analysis period and a discount rate of 15 the cost of hydrogen was determined for the different station designs These specishyfications led to a payback period (break-even time) of approximately 75 years In this work an alternative approach to the discount cash flow analysis was used wherein we calculated the cost of hydrogen considering a 7-year payback period A solution for the cost of hydrogen is found such that the sum of all costs and revenues is zero at the end of a 7-year period By taking this approach we do not need to include replacement costs for components over the entire 20 or 30 year discount cash flow analysis we only need to include replacement costs for components that need to be replaced within 7-year time-frame While some maintenance costs will be required over this 7 year time-frame we assume that no major component of the fueling station would need to be replaced in this period The validity of this assumption varies with equipment type manufacturer and duty cycle We project station costs and incomes out 20 years in this analysis but these results are missing capital replacement costs
As discussed earlier site-preparation costs can vary widely In this analysis we assume a flat $300k to cover the site-preparation including engineering and design permitting and a project contingency The cost to install the conventional components is assumed to be 35 of the capital cost while the cost to install the modular stations electrolyzer or SMR units is assumed to be $60k regardless of unit size or station capacity It should be noted that should any of these assumed costs be different from a real-world station build the black lines in the chart of Fig 3 can be used to determine the resulting change in the cost of hydrogen for the 7-year payback period For example if the site preparation costs $600k rather than the assumed $300k one could use Fig 3 to determine that for a depreciable asset7 the excess $300k would add nearly $3kg to the cost of hydrogen for a 100 kgday station or approximately $1kg to the cost for a 300 kgday station
It is assumed that the station construction takes one year (the year of 2016) and utilization begins the following year (2017) at the rate shown by Fig 2 Just like the analysis that was used to generate Fig 3 when calculating the cost of hydrogen depreciation was estimated using a 7-year Modified Accelerated Cost Recovery System (MACRS) depreciation rate and an overall tax rate of 389 (35 federal and 6 state tax)
31 Conventional Station with Delivered Centrally Produced Hydrogen
Figure 8 shows the cost and revenue model for a conventional assemble-on-site station with delivered hydrogen In 2016 there is no revenue and the costs for building the station are incurred The capital of the station (green bar) is the largest contributor to costs in 2016 The 35 of capital
7Site preparation is likely considered depreciable because it is preparing the land for business use and is closely associated with the station equipment
19
site prep
94
stati
on
cap
ital
280
stationinstall 98
deliv
ered
H 232
6
labor
65
maintenance
118
electricity19
-2000
-1500
-1000
-500
0
500
1000
1500
2000co
st o
r re
ven
ue (
k$
yr)
tax
site preparationstation capitalstation install
delivered H2labor
maintenanceelectricity
revenue ($3053kg)net income
100 kgday
site prep
78
stat
ion
capit
al
269
stationinstall 94
deliv
ered
H 237
6
labor
54
maintenance
98
electricity31
-2000
-1500
-1000
-500
0
500
1000
1500
2000
cost
or
reve
nu
e (
k$
yr)
tax
site preparationstation capitalstation install
delivered H2labor
maintenanceelectricity
revenue ($1837kg)net income
200 kgday
site prep
67
stat
ion
capit
al
259
station
install 91
deliv
ered
H 2
413
labor
46
maintenance
84
electricity40
2020 2025 2030 2035year
-2000
-1500
-1000
-500
0
500
1000
1500
2000
cost
or
reve
nu
e (
k$y
r)
tax
site preparationstation capitalstation install
delivered H2labor
maintenanceelectricity
revenue ($1426kg)net income
300 kgday
conventional delivered H2
Figure 8 Cost and revenue associated with a conventional assemble-on-site station with centrally produced delivered hydroshygen to break even at year 7 (2023) The net income includes the effects from depreciation and taxes Capital replacement costs and intervals are not included in this model (accuracy past 2023 is limshyited) Pie charts on the right show the breakdown of cumulative capital and operating costs over the 7-year analysis period to the cost of dispensed hydrogen
20
costs needed to install the station (red bar) and the $300k site preparation cost (blue bar) make up the balance As discussed earlier land costs are not included in this analysis and site preparation costs can vary quite widely Figure 3 should be used to calculate the change in the cost of hydrogen given any land purchase costs differences in real-world capital or site preparation costs The total installed station costs range from $15M to $19M for the 100 to 300 kgday stations
In 2017 as hydrogen begins to sell at the station revenue begins to roll in but operating costs are also incurred The largest incurred operation cost is the hydrogen fuel supply including the cost of production delivery and storage at the station represented by the light blue bar in Fig 8 This cost increases as the utilization of the station increases (due to more hydrogen required by the station) until 2026 when utilization stabilizes After 2026 the delivered hydrogen costs continue to increase solely due to inflation Contributors to the hydrogen production delivery and tube-trailer storage (labeled delivered H2 in Fig 8) are shown by Figs 4 and 6 and are discussed in Section 21
The purple labor bar in Fig 8 makes up a small percentage of the operating costs This value is calculated using a labor rate of $1370 hr in 2016$ the default rate in HRSAM [4] This labor rate is fixed regardless of the size of the station or the amount of hydrogen sold Maintenance shown by the yellow bar is a slightly larger operating cost contributor Maintenance was estimated at $50kyr (in 2016$ with increases due only to inflation over time) regardless of the station size Maintenance costs can vary quite widely from station to station and from quarter to quarter but this number is near the average annual cost suggested by NRELrsquos Maintenance Costs Over Time CDP8
Electrical costs to run the compressor and chiller at the station make up the balance of the operational cost in Fig 8 shown by the slim gray bar The average compressor energy usage at stations is 42 kW-hrkgH2 according to the Compressor Energy CDP9 from NREL An additional 20 of the compressor energy use was assumed for the refrigeration energy use a factor consistent with HRSAM [4] The cost for electricity shown in Fig 1 was used with this assumed compression and refrigeration energy use to calculate the cost of electricity at the station This cost increases with the amount of hydrogen dispensed and is approximately the same as the maintenance costs for the 300 kgday station after the 80 utilization rate is reached in 2026 For the 200 and 100 kgday stations the electricity usage is proportionately less
For each of the three stations the cost of hydrogen was calculated such that the capital and operating costs were recovered by revenue over 7 years Shown in Fig 8 and tabulated in Table 5 the cost of hydrogen is $3053kg $1837kg and $1426kg for the 100 200 and 300 kgday stations respectively The decrease in hydrogen cost with increasing station capacity is consistent with the Phase 1 Reference Station results [3] and is because the increased revenue from hydrogen sales more than compensates for the increased cost of capital due to the larger station capacity The decreasing hydrogen cost with station capacity also shows a trend of diminishing returns also consistent with the Phase 1 work [3] and increasing the capacity further will not decrease the hydrogen cost so dramatically In fact increasing station capacity will eventually result in
8httpwwwnrelgovhydrogenimagescdp_infr_30jpg 9httpwwwnrelgovhydrogenimagescdp_infr_35jpg
21
Table 5 Installed cost (which includes site preparation engishyneering amp design permitting capital and installation costs) and hydrogen cost for conventional stations with centrally produced delivered hydrogen
capacity (kgday) installed cost ($) H2 cost ($kg)
100 $151M $3053 200 $169M $1837 300 $186M $1426
added capital not considered in this analysis such as multiple dispensers and associated hydrogen chilling equipment additional high pressure cascade storage and additional compressors as station capacity exceeds the throughput of available single compressors
The net income is shown by the purple lines in Fig 8 In 2016 the net income (which is actually an expense in this year without revenue) is not quite the entire capital costs This is due to the depreciation deduction (tax credit) on the capital investment shown by the brown bar In 2017 the net income is slightly greater than the revenue generated by selling hydrogen Once again this is the depreciation deduction on the capital investment which is occurring on a 7 year schedule The overall net expenses and income in all cases reaches a summed value of zero in year 7 (2023) and all income after that point would be earned by the investor (although as stated earlier replacement intervals of equipment are not included in this analysis) Including capital replacement costs would not affect the revenue but would affect the costs in replacement years the tax burden (as this replaced equipment depreciated) and net income in the years past 2023 For all three capacity stations the net income increases (due to inflation and varying operating costs) from about $300-400k year in 2024 to $500-600k yr in 2036
The pie charts on the right in Fig 8 show the contribution from the capital and operating costs over the 7 year payback period to the cost of hydrogen For the 100 kgday station the delivered hydrogen is the largest contributor at 33 followed by the station capital (28) Maintenance is also a large contributor to the cost of hydrogen responsible for 12 of the $3053kg Site preparation and station installation costs are each responsible for roughly 95 of the hydrogen cost Labor accounts for 65 of the hydrogen cost and electricity to run the compressor and chiller is a small contributor at only 2 Overall taxes do not have a net effect on the cost of hydrogen (and therefore do not appear in the pie charts) due to the fact that the capital investment is depreciating on a 7 year schedule providing tax credits in the early years and the fact that we are specifying the cost of hydrogen based on the operator breaking even on their investment in year 7 If we were to determine the cost of hydrogen using a different criterion or if there were capital investments that were not depreciating (or depreciating on an alternative schedule) taxes would have a role in the cost of hydrogen Taxes will also have an impact on the revenue and return on investment over a longer analysis period Note that in this analysis we are not considering the tax to the consumer that is placed on the dispensed fuel
Comparison of the pie charts in Fig 8 shows that as the station capacity increases the stashy
22
tion capital reduces slightly as a percentage of the hydrogen cost while the delivered hydrogen increases its share of the hydrogen cost However the overall cost of delivered hydrogen reduces with increasing capacity from $995kg for the 100 kgday station down to $589kg for the 300 kgday station Electricity on the other hand while increasing as a percentage of the hydrogen cost with increasing capacity contributes approximately $057kg to the cost of hydrogen regardless of the station capacity because the same amount of energy is required to compress and chill each dispensed kg of hydrogen
Figure 9 shows how a conventional station with delivered hydrogen might be organized on a site This is nearly the same layout sketched in the previous reference station design report [3] As with the previous layout the air compressor dryer and cooling water equipment are located near the convenience station so that the air compressor inlet is at least 45 feet away from the hydrogen trailers a prescriptive requirement of NFPA 2 [10] This also prevents this equipment outside the wall from requiring electrical classification The equipment in this layout is spaced out and one could probably devise a smaller footprint The largest contributors to the space requirement are the two tube trailers on-site which would be necessary to prevent interruptions in service The tube trailers drawn are 40rsquo long and sufficient space and delivery routes need to be designed into the layout so that the drivers can drop them off and pick them up
Cost of Delivered Hydrogen
To gain insight into the cost of delivered hydrogen its contribution to the overall cost of hyshydrogen was removed and the overall cost was recalculated Without the delivered hydrogen cost the cost of hydrogen would be $2058 $1147 and $837 for the 100 200 and 300 kgday stashytions respectively The difference between these two scenarios results in delivered hydrogen costs of $995 $690 and $589 per kg Note that these costs includes the leasing two tube-trailers for storage on-site and the cost of delivered centrally produced hydrogen (without the cost of the tube-trailer lease) is $387kg for all three capacity stations The delivered hydrogen cost of $6ndash 10kg is in line with the $6ndash$8kg (in 2014$) reported by Sutherland and Joseck [6] for centrally produced delivered hydrogen of 500ndash1000 kgmonth with a delivery distance of up to 200 miles The delivery distance (assumed to be 200 miles in this analysis) will have a large impact on the cost of delivered hydrogen proportionately changing all of the associated delivery costs shown in Fig 4 which are cumulatively shown as the red bar in Fig 6 The tube-trailer lease price to store hydrogen on-site which is fixed for all three capacity stations is responsible for the decreasing cost of the centrally produced delivered and stored hydrogen as the station capacity increases By having a higher throughput of hydrogen the larger capacity stations are able to spread the cost of the tube trailer lease over a greater quantity of dispensed hydrogen
Comparison of Costs to Previous Study
Neglecting the cost of the delivered hydrogen also allows a comparison to the results of the Phase 1 Reference Station Design report [3] The calculated hydrogen costs without production
23
conveniencestore
50 0
dispenser island
H2 cooling blockH2 chiller
gas panel
high pressure H2storage
compressorwater chillerair compressor
tube trailer
168 0
140
0
30 0
Figure 9 Renderings of a conventional station layout with delivshyered gaseous hydrogen
24
and delivery of $2058 $1147 and $837 are higher than the Phase 1 calculated costs of $1328 $782 and $603 for the 100 200 and 300 kgday stations (shown in Table 1) Several factors contribute to the differences in the calculated fuel cost First the installed capital costs of $15M $17 and $19M in this analysis are higher than those calculated previously of $11M $12M and $13M (even after adjusting for inflation) Second the previous analysis used HRSAM in which the operating costs are calculated a bit differently than this analysis Finally in the previous analshyysis the criteria for hydrogen cost was a 15 discount rate based on a 30 year analysis period which led to a 75 year payback period In this analysis the payback period was set to exactly 7 years (and the discount rate was not considered) If in this analysis the capital costs are reduced to match the previously reported capital costs ($11M $12M and $13M) and the payback period is extended from 7 to 75 years the cost for dispensed hydrogen (without including the cost of hydrogen production and delivery) is calculated as $1521 $823 and $590 for the 100 200 and 300 kgday stations respectively These costs are within 15 of the HRSAM values found in the previous analysis The differences in this case must all be attributed to the second cause of differshying assumptions on operation costs in this analysis method vs the HRSAM method This exercise shows that the economic assumptions in this analysis are in-line with the HRSAM assumptions albeit not exactly the same This exercise also demonstrates that solving for the hydrogen cost to match a payback periodndashas long as that payback period is less than the capital replacement interval on partsndashis a valid alternative to the discount rate analysis used in HRSAM
32 Conventional Station with Hydrogen Produced On-site via Steam Methane Reforming
The costs and revenue for a conventional assemble-on-site station with an on-site steam methane reformer to produce hydrogen are shown in Fig 10 with the installed costs and cost of hydrogen tabulated in Table 6 Inspection of the capital costs incurred in 2016 shows that the largest conshytributor is the SMR unit itself As discussed in Section 22 these SMR units are estimated to cost from just over $1M for a 100 kgday capacity to just under $25M for a 300 kgday capacity Usshying Fig 3 adding a $1M capital investment (depreciable) to a 100 kgday station will add nearly $10kg to the cost of hydrogen to make back that investment in 7 years But for the 100 kgday stashytion with on-site SMR the $3847kg cost of hydrogen is only about $8 higher than the $3053kg for the conventional station with delivered hydrogen The hydrogen cost is calculated based on
Table 6 Installed cost (which includes site preparation engishyneering amp design permitting capital and installation costs) and hydrogen cost for conventional stations with SMR on-site
capacity (kgday) installed cost ($) H2 cost ($kg)
100 $274M $3847 200 $383M $2596 300 $443M $2023
25
site
pre
p
75
station
capital
222
stationinstall 78
SMR c
ap
292
SM
R in
st
15
labor
51
SMR elec
12 natural gas
45 water
07
maintenance188
stat
ion
elec
tric
ity
15
-3000
-2000
-1000
0
1000
2000
3000co
st o
r re
ven
ue (
k$
yr)
tax
site preparationstation capitalstation installSMR capitalSMR install
laborSMR electricity
natural gaswater
maintenancestation electricity
revenue ($3847kg)net income
100 kgday
site
pre
p
55
statio
n
capita
l190
stationinstall 67
SMR c
ap
382
SM
R inst
11
labor
38 SMR elec
17 natural gas
67water
11
maintenance
139
stat
ion
elec
tricit
y
22
-4000
-3000
-2000
-1000
0
1000
2000
3000
4000
cost
or
reve
nu
e (
k$
yr)
tax
site preparationstation capitalstation installSMR capitalSMR install
laborSMR electricity
natural gaswater
maintenancestation electricity
revenue ($2596kg)net income
200 kgday
site
pre
p
47
statio
nca
pita
l182
stationinstall 64
SMR c
ap
395
SM
R in
st
09
labor
33
SMR elec
22
natural gas
86water
14
maintenance
119
stat
ion
elec
tricit
y
28
2020 2025 2030 2035year
-6000
-4000
-2000
0
2000
4000
6000
cost
or
reve
nu
e (
k$y
r)
tax
site preparationstation capitalstation installSMR capitalSMR install
laborSMR electricity
natural gaswater
maintenancestation electricity
revenue ($2023kg)net income
300 kgday
conventional SMR on-site
Figure 10 Cost and revenue associated with a conventional assemble-on-site station with on-site steam methane reforming produced hydrogen to break even at year 7 (2023) The net inshycome includes the effects from depreciation and taxes Capital replacement costs and intervals are not included in this model Pie charts on the right show the breakdown of cumulative capital and operating costs over the 7-year analysis period to the cost of disshypensed hydrogen
26
both capital and operating costs so we can conclude that the operating costs for the 100 kgday SMR are less than the operating costs for the 100 kgday delivered hydrogen station In addition to the common costs for labor station maintenance and station electricity the station with the SMR unit has a nominal operating cost for water for the SMR unit (nearly indistinguishable green bar) requires electricity and natural gas to run the unit (shown by the blue and black bars) and requires additional maintenance over the conventional station with delivered hydrogen (included in the red bar) Maintenance for the SMR unit is assumed to be $50kyear bringing total station maintenance costs to $100k yr However the sum of these costs is less than the cost to deliver and store censhytrally produced hydrogen for the 100 kgday station Operating costs for the SMR station neglect the inefficiencies in shutdownstartup cycles (or venting excess hydrogen) when production is not matched by demand which would further increase costs
The cost of hydrogen for the conventional 100 200 and 300 kgday stations with on-site SMR are $3847kg $2596kg and $2023kg These costs are 26 41 and 42 higher than the costs of hydrogen for a conventional station with delivered gaseous hydrogen As discussed the increased cost of hydrogen comes from the high capital costs for the on-site SMR units slightly offset by a reduced operating cost This can be seen by inspecting the pie charts on the right side of Fig 10 where the SMR capital costs is the largest contributor to the cost of hydrogen accounting for approximately 30-40 of the hydrogen cost For the 200 and 300 kgday stations the capital costs of $2M and $25M add approximately $10kg and $8kg While the operating costs for these stations are lower than the same capacity delivered hydrogen stations these differences fail to decrease the cost of hydrogen to the same level as the delivered hydrogen station Overall this analysis would suggest that while there may be some advantages to utilizing on-site SMR there is not much of a financial case to produce hydrogen on-site using steam methane reforming rather than having hydrogen delivered for 100-300 kgday hydrogen refueling stations unless the capital cost can be reduced significantly
A station with an on-site SMR unit could have a smaller footprint than a station with delivered hydrogen One potential layout is shown in Fig 11 By replacing the tube trailers with an SMR unit significantly less space is required for the fueling station components (compare to Fig 9) Since all hydrogen is produced on-site delivery routes can also be neglected from consideration and walls can enclose all of the hydrogen components reducing setback distances on all sides The SMR unit is shown as being housed in a 20 ft ISO container footprint although to produce 300 kgday it may be possible to have a smaller footprint and even smaller for the stations that only require 100 or 200 kgday For on-site SMR the fueling station components (eg compressor high pressure storage) take up relatively more space than the low pressure hydrogen source (because the SMR is much smaller than the two tube trailers) and laying out these components in a compact manner is important in space-constrained sites
33 Conventional Station with Hydrogen Produced On-site via Electrolysis
Conventional stations with on-site electrolysis have the costs and revenues shown in Fig 12 The installed capital costs and hydrogen costs at each of the three stations are tabulated in Table 7 Similar to the conventional station with a steam methane reforming unit on-site each of these
27
30 0
50 0
154 0
100
0
conveniencestore
dispenser island
compressor
high pressure storagegas panel
H2 chillerH2 cooling block
air compressorwater chiller
20 ft ISO container(electrolyzer or SMR)
Figure 11 Renderings of a conventional station layout with on-site production of hydrogen
28
site prep
72
stat
ion
capit
al
216
station
install 75
eleccapital 197
elec
install
14
elec
el
ectr
icity
177
wate
r02
lab
or
50
maintenance
182
stationelectricity
14
-3000
-2000
-1000
0
1000
2000
3000co
st o
r re
ven
ue (
k$
yr)
taxsite preparationstation capitalstation installelec capitalelec install
elec electricitywater
labormaintenance
station electricity
revenue ($3966kg)net income
100 kgday
site prep
54
stat
ion
capi
tal
186
statio
n
insta
ll65
eleccapital 221
elec
install11
elec
el
ectr
icit
y26
5
water
03
labor
37
maintenance
136
stationelectricity
21
-3000
-2000
-1000
0
1000
2000
3000
cost
or
reve
nu
e (
k$
yr)
taxsite preparationstation capitalstation installelec capitalelec install
elec electricitywater
labormaintenance
station electricity
revenue ($2651kg)net income
200 kgday
site prep44
stat
ion
capi
tal
170
stati
on
inst
all
59
elec
capital 224
elecinstall
09
elec
el
ectr
icit
y32
3
water
04
labor
30
maintenance
111
stationelectricity
26
2020 2025 2030 2035year
-4000
-3000
-2000
-1000
0
1000
2000
3000
4000
cost
or
reve
nu
e (
k$y
r)
taxsite preparationstation capitalstation installelec capitalelec install
elec electricitywater
labormaintenance
station electricity
revenue ($2174kg)net income
300 kgday
conventional electrolysis on-site
Figure 12 Cost and revenue associated with a conventional assemble-on-site station with on-site electrolysis produced hyshydrogen to break even at year 7 (2023) The net income includes the effects from depreciation and taxes Capital replacement costs and intervals are not included in this model Pie charts on the right show the breakdown of cumulative capital and operating costs over the 7-year analysis period to the cost of dispensed hydrogen
29
Table 7 Installed cost (which includes site preparation engishyneering amp design permitting capital and installation costs) and hydrogen cost for conventional stations with electrolysis on-site
capacity (kgday) installed cost ($) H2 cost ($kg)
100 $238M $3966 200 $298M $2651 300 $345M $2174
station designs has a large capital cost due to the electrolysis unit As discussed in Section 23 the electrolysis units cost approximately $800k $12M and $15M for 100 200 and 300 kgday capacities These capital investments will add approximately $8kg $6kg and $5kg to the cost of hydrogen over a conventional station assuming equivalent operating costs During operation there is a large cost associated with electricity to run the electrolysis unit (shown by the yellow bar) This cost scales with the amount of hydrogen produced and is a large factor in the station economics The pie charts on the right show that this electricity accounts for approximately 20-30 of the cost of hydrogen Other additional costs over the conventional delivered hydrogen station are the cost of water to run the electrolysis unit and additional maintenance on the electrolyzer (assumed to be $50k annually as with the SMR)
The electricity required for the electrolyzer costs approximately $300k $600k and $900k (for the 100 200 and 300 kgday stations) in 2036 where utilization has topped out at 80 Centrally produced delivered hydrogen by comparison as shown in Fig 8 costs around $300k $450k and $650k in 2036 with overall operating costs for the delivered hydrogen station (neglecting taxes) topping out at approximately $400k $600k and $800k In addition to the additional capital costs for the electrolyzer (and the other operational costs) it is clear that the economics of a station with an electrolyzer are challenging due to the high electricity consumption even when the electricity is from the current national grid mix with 13 renewable content10 Higher renewable content may further increase this cost component in the near term although fossil-fuel free electricity may become less expensive in the longer term
The cost of hydrogen for the conventional station with an electrolyzer is $3966kg $2651kg and $2174kg for the 100 200 and 300 kgday stations receptively These costs are on-par with the conventional station with SMR within $150kg for all three capacities The cost of hydrogen for a station with on-site production is significantly higher than for a station with delivered hydroshygen Besides improvements in electrical efficiency one strategy for minimizing operating costs is to only operate the electrolyzer at off-peak hours enabling the purchase of lower priced electricity However this might require oversizing the electrolyzer to produce enough hydrogen at off-peak hours to meet demand increasing the capital costs associated with the unit Another method is inshytentionally oversizing the electrolyzer to enable operation at a higher efficiency thereby reducing operating expenses
102015 estimate from httpwwweiagovtoolsfaqsfaqcfmid=92ampt=4
30
To estimate the impact of these methods of operation and aslo gain insight into less expensive renewable electricity costs in the future the model was run with the cost of electricity zeroed-out to calculate the lowest possible cost of hydrogen with cheap electricity In this scenario the cost of hydrogen is $3264kg $1949kg and $1472kg (for the 100 200 and 300 kgday stations) These costs are only slightly higher (by 3-7) than the conventional delivered hydrogen cost due to the capital investment in the electrolyzer and the remaining electrolyzer maintenance and water costs
A station with on-site electrolysis can also be represented by the layout shown in Fig 11 Housing the components necessary for alkaline electrolysis of 100-300 kgday hydrogen might be challenging in a 20 ft ISO container and the layout might need to be increased (to a 30 or 40 ft ISO container) For PEM electrolysis however the components should fit in the 20 ft ISO container and potentially smaller containers for the 100 or 200 kgday stations Similar to the reforming layout the hydrogen components fit in a much more compact space than for the conventional station with delivered hydrogen (shown in Fig 9) and the lot size is reduced
34 Modular Station with Delivered Centrally Produced Hydrogen
Figure 13 shows the cost revenue and income model for a modular station with delivered centrally produced hydrogen and an uninstalled modular unit cost of $15M The installed capital costs and hydrogen costs at each of the three capacity stations are tabulated in Table 8 Recall from Section 25 that the capital costs for modular stations do not follow the same trend as for build-on-site stations because modular stations come in discrete sizes Table 8 shows the installed capital and hydrogen costs for two cases of uninstalled modular station costs of $15M and $1M The only difference in costs between this scenario and the conventional station with delivered centrally produced hydrogen (see Table 5 and Fig 8) are in the capital costs While the installed capital costs including site preparation station capital and installation were $15M and $17M for the 100 and 200 kgday conventional stations it is $186M for all three capacities of the modular
Table 8 Installed cost (which includes site preparation engishyneering amp design permitting capital and installation costs) and hydrogen cost for modular stations with delivered hydrogen for two cases of uninstalled modular cost $15M and $10M
capacity uninstalled installed H2 cost (kgday) modular cost ($) cost ($) ($kg)
100 $15M $186M $3390 200 $15M $186M $1916 300 $15M $186M $1425 100 $1M $136M $2912 200 $1M $136M $1677 300 $1M $136M $1265
31
site
pre
p
85
stationcapital 423
statio
n
install
17d
elive
red
H2
294
labor
58
maintenance107
electricity
17
-2000
-1500
-1000
-500
0
500
1000
1500
2000co
st o
r re
ven
ue (
k$
yr)
tax
site preparationstation capitalstation install
delivered H2labor
maintenanceelectricity
revenue ($3390kg)net income
100 kgday
site
prep
75
station
capital 374
station
install15
delive
red
H2
360
labor
52
maintenance94
electricity
30
-2000
-1500
-1000
-500
0
500
1000
1500
2000
cost
or
reve
nu
e (
k$
yr)
tax
site preparationstation capitalstation install
delivered H2labor
maintenanceelectricity
revenue ($1916kg)net income
200 kgday
site
prep
67
station
capital336
stationinstall 13
del
iver
ed H2
413
labor
46
maintenance85
electricity
40
2020 2025 2030 2035year
-2000
-1500
-1000
-500
0
500
1000
1500
2000
cost
or
reve
nu
e (
k$y
r)
tax
site preparationstation capitalstation install
delivered H2labor
maintenanceelectricity
revenue ($1425kg)net income
300 kgday
modular station delivered hydrogen
Figure 13 Cost and revenue associated with a modular station with centrally produced delivered hydrogen to break even at year 7 (2023) assuming a $15M uninstalled capital cost of the modular station The net income includes the effects from depreciation and taxes Capital replacement costs and intervals are not included in this model Pie charts on the right show the breakdown of cumulashytive capital and operating costs over the 7-year analysis period to the cost of dispensed hydrogen
32
stations This capital investment for a 300 kgday modular station (including site preparation station capital and installation) is coincidentally the same as for a 300 kgday conventional station
If an estimate of $1M (as compared to the conservative estimate of $15M) for the uninstalled capital cost of the modular fueling station unit is used (note that this is still within the range of costs vendors estimated as described in Section 25) the cost of hydrogen will be $2912 $1677 and $1265 for the 100 200 and 300 kgday capacities respectively These costs are all lower than the cost of hydrogen at the equivalent capacity conventional stations As this technology matures and the installed capital cost of the modular units continues to decrease below the installed capital cost of the conventional stations it will make economic sense to site modular stations rather than assembling components on-site Parts standardization and the increased quality control that can be achieved by having modular station components may also lead to reduced maintenance requirements but that potential benefit is not included in this analysis
Figure 14 shows that a modular unit requires a slightly smaller installation area than the conshyventional station components shown in Fig 9 However the tube trailers acting as the hydrogen source and on-site storage still require significant space Similar to the conventional station with delivered hydrogen delivery routes must also be considered when siting a modular station with deshylivered hydrogen The hydrogen components are shown as being housed in a 20 ft ISO container although some 300 kgday modular stations are smaller than this While a slightly overall reduced footprint (relative to as drawn in Fig 14) could be realized we show this layout on the same lot as before Removing the need to store two 40-foot tube trailers by adding on-site low pressure storage could also drastically reduce the footprint by reducing the need to have an open wall for delivery A discussion of how the separation distances can be impacted and the footprints might be reduced due to fire-rated walls is included at the end of the Section 35
33
140
0
168 0
50 0
30 0
dispenser island
tube trailer
modular station(20 ft ISO)
conveniencestore
Figure 14 Renderings of a modular station layout with delivered hydrogen
34
35 Modular Station with Hydrogen Produced On-site via Electrolysis
The final configuration considered in this analysis is a modular station with an electrolysis unit attached to produce hydrogen The economics of this station design are shown in Fig 15 The installed capital costs and hydrogen costs at each of the three capacity stations with two different uninstalled modular unit costs are tabulated in Table 9 Similar to the results in the previous section the cost of hydrogen at the low volume modular electrolysis stations with an assumed $15M uninstalled modular station cost are higher than at the conventional electrolysis station counterpart We find that the cost of hydrogen at these modular stations with electrolysis produced hydrogen will be $4303kg $2730kg and $2173kg (for the 100 200 and 300 kgday stations) These costs are once again $337kg higher $079kg higher and the same (respectively) as the costs at the conventional stations with electrolysis produced hydrogen discussed in Section 33 This cost difference between the analogous conventional station is once again solely due to the differing capital cost of the installed modular station If the capital cost of the modular unit is $1M the hydrogen costs reduce to $3825 $2491 or $2013kg (for the 100 200 and 300 kgday stations) which are all lower than the cost at the similarly sized conventional stations with on-site electrolysis due to the lower installed station cost
Having on-site production using an electrolyzer and modular fueling station components only requires a small footprint for installation as shown in Fig 16 The ISO containers can house apshypropriate fire-rated barrier walls reducing separation distance for Group 1 and 2 exposures (except for air intakes) by half and eliminating separation distances for Group 3 exposures as described in Section 732312 of NFPA 2 The Hydrogen Technologies Code (2016) [10] Group 1 exshyposures are lot lines air intakes (HVAC compressors other) operable openings in buildings and structures and ignition sources such as open flames and welding Group 2 exposures are exshyposed persons (other than those servicing the system) and parked cars Group 3 exposures include buildings flammable gas storage hazardous materials storage ordinary combustibles horizontal distance to overhead electrical wire and piping containing other hazardous material This means
Table 9 Installed cost (which includes site preparation engishyneering amp design permitting capital and installation costs) and hydrogen cost for modular stations with on-site electrolysis proshyduced hydrogen for two cases of uninstalled modular cost $15M and $10M
capacity uninstalled installed H2 cost (kgday) modular cost ($) cost ($) ($kg)
100 $15M $274M $4303 200 $15M $314M $2730 300 $15M $345M $2173 100 $1M $224M $3825 200 $1M $264M $2491 300 $1M $295M $2013
35
site prep67
stat
ion
capit
al
333
stationinstall 13
eleccapital 181
elec
install
13
elec
el
ectr
icity
163
wate
r0
2
labor
46
maintenance
168
stationelectricity
13
-3000
-2000
-1000
0
1000
2000
3000co
st o
r re
ven
ue (
k$
yr)
taxsite preparationstation capitalstation installelec capitalelec install
elec electricitywater
labormaintenance
station electricity
revenue ($4303kg)net income
100 kgday
site prep53
stat
ion
capi
tal
263
station
install
11
eleccapital 214
elec
install11
elec
elec
tric
ity
257
water
03
lab
or
36
maintenance
132
stationelectricity
21
-4000
-3000
-2000
-1000
0
1000
2000
3000
4000
cost
or
reve
nu
e (
k$
yr)
taxsite preparationstation capitalstation installelec capitalelec install
elec electricitywater
labormaintenance
station electricity
revenue ($2730kg)net income
200 kgday
site prep44
stat
ion
capi
tal
220
stati
on
inst
all
09
elec
capital 224
elecinstall 09
elec
elec
tric
ity32
3
water
04
labor
30 maintenance
111
stationelectricity
26
2020 2025 2030 2035year
-4000
-3000
-2000
-1000
0
1000
2000
3000
4000
cost
or
reve
nu
e (
k$y
r)
taxsite preparationstation capitalstation installelec capitalelec install
elec electricitywater
labormaintenance
station electricity
revenue ($2173kg)net income
300 kgday
modular station electrolysis on-site
Figure 15 Cost and revenue associated with a modular station with on-site electrolysis produced hydrogen to break even at year 7 (2023) assuming a $15M uninstalled capital cost of the modular station The net income includes the effects from depreciation and taxes Capital replacement costs and intervals are not included in this model Pie charts on the right show the breakdown of cumulashytive capital and operating costs over the 7-year analysis period to the cost of dispensed hydrogen
36
electrolyzer(20 ft ISO)
modular station(20 ft ISO)
convenience store
dispenser island
100
0
100 0
17 0
Figure 16 Renderings of a modular station layout with an elecshytrolyzer for on-site production with a small reduced footprint
37
for a typical pipe diameter of 028rdquo and up to 15000 psi pressure (within the operating range of the cascade storage at a refueling station) air intakes must remain 34 ft from the containers while lot lines other building openings or ignition sources only need 17 ft of separation Exposed persons and parked cars must be 8 ft or more away from the containers and other exposures (including other combustibles like gasoline) do not need any separation from the containers This will allow a compact layout an example of which is shown in Fig 16
38
4 Conclusions
Five station designs were considered in this analysis with three capacities of each station deshysign With the current technology the lowest cost hydrogen source assessed here11 is tube-trailers delivering centrally produced gaseous hydrogen Shown in Table 10 or graphically in Fig 17 for either a conventional or modular station with a 300 kgday capacity and delivered hydrogen gas (using our conservative $15M cost estimate for the modular unit) it would cost approximately $186M to prepare the site and build the station and at a dispensed hydrogen cost of $1425kg a station operator would break even on their capital investments and operational costs in 7 years If the capital cost of the modular station unit is only $1M which is still in the range of cost estimates by manufacturers a modular station with delivered hydrogen would cost $136M to build and for a 300 kgday capacity hydrogen would cost $1265kg Embedded in all of these analyses is the utilization profile shown in Fig 2 which is the reason that the hydrogen cost increases as the cashypacity (and utilization) decreases for the modular stations with delivered hydrogen although they have the same installed cost
The specified 7-year return on investment results in higher cost hydrogen for smaller stations than for larger ones due to less throughput and higher capital cost per kg of capacity (see the lower left frame of Fig 17) If the SDO charges customers a price lower than this cost the result will be a longer return on investment Setting the same price regardless of station capacity will result in the 100 kgday station having the longest return on investment and the 300 kgday having the shortest
The addition of a steam methane reformer or an electrolyzer to a hydrogen refueling station increases the capital cost significantly with the steam methane reformer estimated to have the
11The cost of liquid delivery was not included in this analysis
Table 10 Installed cost (which includes site preparation engishyneering amp design permitting component capital and installation costs) and resulting hydrogen cost to break even at year 7 for the stations analyzed in this work
station capacity rarr 100 kgday 200 kgday 300 kgday
station type darr installed cost ($)
H2 cost ($kg)
installed cost ($)
H2 cost ($kg)
installed cost ($)
H2 cost ($kg)
conventional delivered H2 conventional SMR H2 conventional electrolysis H2 modular ($15M) delivered H2 modular ($1M) delivered H2 modular ($15M) electrolysis H2 modular ($1M) electrolysis H2
$151M $274M $238M $186M $136M $274M $224M
$3053 $3847 $3966 $3390 $2912 $4303 $3825
$169M $383M $298M $186M $136M $314M $264M
$1837 $2596 $2651 $1916 $1677 $2730 $2491
$186M $443M $345M $186M $136M $345M $295M
$1426 $2023 $2174 $1425 $1265 $2173 $2013
39
$00M$05M$10M$15M$20M$25M$30M$35M$40M$45M
inst
all
ed
cost
($)
capacity (kgday)
100 200 300
conv
ention
al d
eliv
ered
gas
conv
ention
al S
MR
conv
ention
al e
lect
roly
sis
mod
ular
($1
5M
) d
eliv
ered
gas
mod
ular
($1
M) d
eliv
ered
gas
mod
ular
($1
5M
) e
lect
roly
sis
mod
ular
($1
M) e
lect
roly
sis
$0k
$5k
$10k
$15k
$20k
$25k
$30k
inst
all
ed
cost
($[
kg
day]
)
conv
ention
al d
eliv
ered
gas
conv
ention
al S
MR
conv
ention
al e
lect
roly
sis
mod
ular
($1
5M
) d
eliv
ered
gas
mod
ular
($1
M) d
eliv
ered
gas
mod
ular
($1
5M
) e
lect
roly
sis
mod
ular
($1
M) e
lect
roly
sis
$0$5
$10$15$20$25$30$35$40$45
H2 c
ost
($k
g)
capacity (kgday)
100 200 300
Figure 17 Installed cost (which includes site preparation engishyneering amp design permitting component capital and installation costs) are shown in the left frames The top frame is the total inshyvestment in 2016$ while the bottom left frame is the installed cost per mass of hydrogen dispensed (kgday) The hydrogen cost to break even at year 7 is shown in the right frame for the stations analyzed in this work
40
highest capital cost On-site production does allow for a more compact station footprint and does not require consideration for tube-trailer delivery routes With current technology and projected utility prices operating a steam methane reformer costs slightly less than operating an electrolyzer These offsetting differences in capital vs operational costs causes the price of hydrogen to be very similar for a station with SMR produced hydrogen and electrolysis produced hydrogen In both cases the cost of hydrogen is $6-$10kg more for the stations that produce hydrogen on-site than the stations that have hydrogen delivered This analysis does not include the startup and shutdown inefficiencies (and associated costs) for either the SMR or electrolyzer The penalty for cycling a SMR is likely greater than for cycling an electrolyzer potentially giving an electrolyzer an economic advantage for on-site production
Electrolyzers also have the potential to produce less carbon dioxide than SMRrsquos By definishytion SMRrsquos require methane which contains carbon to produce hydrogen releasing the carbon molecules as carbon dioxide and contributing to climate change A reduced carbon footprint could be achieved by using bio-gas or implementing carbon capture and storage (although this would incur an efficiency penalty) Electrolyzers on the other hand require only electricity and water giving this technology the potential to be completely carbon free given the right source of elecshytricity such as solar wind hydroelectric or nuclear The key to making on-site production more cost competitive with delivered hydrogen is reducing the utility costs For electrolysis this can be achieved through efficiency improvements (although around 50-70 efficiencies are achieved with current technology) through the purchase of low cost off-peak electricity or by using elecshytricity generated behind the meter Of course reducing capital cost and maintenance requirements of on-site production units will also improve the economics of this technology
According to our research current modular fueling stations where components are assembled and tested at a central production facility have installed costs no higher than conventional stations Using our high estimate of $15M for the modular unit the installed cost of the 300 kgday modular station is nearly the same as for a 300 kgday conventional station Using a lower cost estimate of $1M for the modular unit the installed cost of a 100 kgday conventional station is 11 higher than the modular station With greater industry experience and higher volume production we would anticipate the cost of modular stations to reduce in the near-future Developing stations in this manner may lead to better quality control and reduced maintenance requirements for hydrogen fueling stations It is also possible to achieve more compact station footprints by modularizing the station components by building in appropriate fire-rated barrier walls Because of these potential benefits we anticipate modularization and standardization to increase in the future
This report details the economics of current hydrogen refueling stations and includes some sketches of potential layouts We have visually depicted the contributions to capital and operational costs of hydrogen for different station concepts making it easy to find the largest contributors to a high cost of hydrogen to the consumer This information can be used to devote research and development towards these high contributors At the station the dispenser compressors and chillers are expensive pieces where additional development or higher volume production could reduce station costs For electrolysis the purchase of low-priced electricity could serve to make on-site production cost competitive with central production and delivery This report enables the comparison of different station concepts that could be implemented in various market scenarios
41
A Piping amp Instrumentation Diagram
The following pages show the piping and instrumentation diagram for the included reference stations For the conventional stations all components need to be assembled on-site The dashed boxes show the components that are often modularized for the modular stations For reference the utility requirements shown in the PampID are also included here in Table A1
Table A1 Utility requirement estimateslowast for the stations in this report
capacity 100 kgday 200 kgday 300 kgday
compressor power electrolyzer power electrolyzer water SMR power SMR water SMR gas
25 kW 260 kW 110 lhr 16 kW 400 lhr 34 Nm3hr
60 kW 510 kW 220 lhr 33 kW 800 lhr 68 Nm3hr
100 kW 770 kW 330 lhr 49 kW 1200 lhr 101 Nm3hr
lowast These are averages based on manufacturer specifications and literature and are meant to give an estimate of site requirements For exact specifishycations to meet station requirements consult a manufacturer directly
42
ABCDEFGHIJK1
2
3
4
5
6
7
Measured Variable Readout of function Output Function ModifierA Air AlarmB Burner Storage Users Choice Users ChoiceC Compressor ClosedD DispenserE Electrolyzer Sensor (primary Element)F Flow FilterG Chiller Glass viewingH Hand HighI Current IndicatorJ PowerK Time Control StationL Level Light LowM Conductivity MiddleN Users Choice Users Choice Hydrogen Users ChoiceO Water Orifice restriction Air OpenP PressureQ QuantityR Reformer Record ReduceS Speed Frequency SwitchT Temperature TransmitU Multivariate Multifunction Multifunction MultifunctionV Vibration ValveW Weight Well WaterX Unclassified Unclassified Unclassified UnclassifiedY State RelayZ Position Actuator
PROCESS AND SIGNAL LINES
HYDROGEN PROCESS LINE
DEIONIZED WATER PROCESS LINE
PNEUMATIC SIGNAL LINE
NITROGEN SIGNAL LINE
ELECTRICAL SIGNAL LINE
SV
VALVES
BALL VALVE
NEEDLE VALVE
CHECK VALVE
SOLENOID VALVE
AIR ACTUATED VALVE SPRING RETURN CLOSE
PRESSURE REDUCING VALVE
TWO WAY PRESSURE RELIEF
THREE WAY PRESSURE RELIEF
EQUIPMENT
FILTER
PUMP
DRYER
HYDROGEN COMPRESSOR
STORAGE TANK
IR FLAME DETECTOR
Line Service Identification codesCCA-CLEAN COMPRESSED AIRCHW-CHILLED WATERH-HYDROGENN-NITROGEN
Pipe Specification Details3000PSI Min pressure rating of 3000 PSI 316316L austenitic stainless steel tubing UNS S31600 (316) UNS S31603 (316L)6500PSI Min pressure rating of 6500 PSI 316316L austenitic stainless steel tubing UNS S31600 (316) UNS S31603 (316L)15000PSI Min pressure rating of 15000 PSI 316316L austenitic stainless steel tubing UNS S31600 (316) UNS S31603 (316L)POLY Polyamide (Nylon) pneumatic tubing light and heat stabilized0032CU 0032 wall copper alloy 122 seamless tubingSCH40 Schedule 40 iron pipe
Line symbolsXrdquo-XXX-XXXX-XXX-XXX
Line size nominal inches
Service
Line Number (if assigned)
Pipe Spec
Insulation (if applicable)
Insulation codesF1- Soda-lime silicate glass (FOAMGLAS) 1 wall thicknessF2- Buna N Foam 38 thick
ABCDEFGHIJK1
2
3
4
5
6
7
CNH-300
HV-202HV-203
HV-201PT-300PI-300 HV-300
HV-301
Motor460-V 3Oslash SEE NOTE 1
Heater120-V 1Oslash 500 W
PT-202PI-202
34-H-VENT
1-frac14rdquo-CHW-800-SCH40
1-frac14rdquo-CHW-800-SCH40-F2
CW-800
GW-800
HV-202
HV-300
FV-100
ZSO-100
ZSC-100
ZI-100
FSV-100
ZZO-100
FSV-30038-H-3000PSI
38-H-5000PSI
38-H-5000PSI
38-H-15000PSI
34-H-VENT
OF-802TO COMMON frac34rdquo VENT MAST LOCATED ON BACK OF GMP
10 ABOVE GRADE
REFERENCE STATION 100-300 KGDAY
FF-300
GW-801
PI-101 PT-101
H2 Storage PBNH-402MAWP-15000 PSIG
H2 Storage PBNH-403MAWP-15000 PSIG
H2 Storage PBNH-401MAWP-15000 PSIG
FV-401
ZSO-401 ZSC-401
ZZO-401
FV-402
ZSO-402 ZSC-402
ZZO-402
FV-403
ZSO-403 ZSC-403
ZZO-403
FV-400
ZSO-400 ZSC-400
ZZO-400 GN-900
CHILLER 75-kW
DN-900JSS-901(EPO)
To EPO circuit
700-BAR NOZZLE
350-BAR NOZZLE
38-H-15000PSI
H70-T40H70-Warm
H35-T0
3570MPa DISPENSERWUN-900
FVControls Internal120V 1p 15A
GN-901
HEAT EXCHANGER1350 lbs
HV-901
H70-Cold
H2 Delivery Trailer multiple tubes one outlet
COH-100Air Compressor
PBAL-100
HV-100
AF-100
Air DryerAF-101
HV-900
PT-403PI-403
HV-403
PT-402PI-402
HV-402
PT-401PI-401
HV-401
HV-411
HV-412
HV-413
ZI-401
ZI-402
ZI-403
FV-101
ZSO-101 ZSC-101 ZI-101
ZZO-101
ZVO-100
ZVO-101
ZVO-900
ZVO-401
ZVO-400
ZVO-402
ZVO-403
RAH-100IR FLAME DETECTOR
AIMED AT HYDROGEN SOURCEAND ZONE 400
HIGH PRESSURE STORAGE
TO FIRE PANEL
RAH-900
IR FLAME DETECTORAIMED AT DISP HOSES
TO FIRE PANEL
HV-101
38-H-15000PSI
ZI-400
HV-400
FSV-200
EN-100ELECTROLYZER SKID
20 BAR (300 PSI) OUTPUT
RN-100STEAM METHANE REFORMER (SMR)
SKID13 BAR (200 PSI) OUTPUT
ZVO-102
Power460-V 3OslashSEE NOTE 1
Power460-V 3OslashSEE NOTE 1
ONLY ONE HYDROGEN SUPPLY OPTION IS USED PER STATION 1 TUBE TRAILER DELIVERY2 ON-SITE ELECTROLYSIS3 ON-SITE STEAM METHANE REFORMER
MUNICIPAL WATER SUPPLY
SEE NOTE 1
NATURAL GAS BIOGAS METHANE SUPPLY
SEE NOTE 1
NOTE 1 UTILITY REQUIREMENTS DEPEND ON STATION CAPACITY AND CAN BE ESTIMATED BASED ON THE FOLLOWING TABLESTATION CAPACITY 100 KGDAY 200 KGDAY 300 KGDAYELECTROLYZER POWER 260 KW 510 KW 770 KWELECTROLYZER WATER 110 LHR 220 LHR 330 LHRSMR POWER 16 KW 33 KW 49 KWSMR WATER 400 LHR 800 LHR 1200 LHRSMR GAS 34 NM3HR 68 NM3HR 101 NM3HRCOMPRESSOR POWER 25 KW 60 KW 100 KW
NOTE 2 ON-SITE PRODUCTION UNITS MAY INCORPORATE THEIR OWN INSTRUMENT AIR SYSTEM AND INTERCONNECTION WITH CSD SKIDCONTAINER MAY NOT BE NECESSARYNOTE 3 APPLIES TO MODULAR STATION ONLY A BUILD-ON-SITE STATION WILL NOT HAVE A SKID-OR CONTAINER-MOUNTED PRE-ASSEMBLED SYSTEMNOTE 4 IN SOME MODULAR STATIONS THE DISPENSER WILL BE A SEPARATELY-INSTALLED COMPONENTNOTE 5 IN MANY MODULAR STATIONS THE HEAT EXCHANGE EQUIPMENT WILL BE ROOF-MOUNTED
NOTE 2
COMPRESSION STORAGE AND DISPENSER (CSD) SKID OR CONTAINER BOUNDARY SEE NOTE 3
NOTE 4
NOTE 5
NOTE 5
PLCGas Control Cabinet
COMPRESSORMULTIPLE STAGES
References
[1] US Energy Information Administration EIA Open Data - Intro - US Energy Information Administration (EIA) accessed July 2016 httpwwweiagovopendata
[2] US DOE DOE H2A Production Analysis accessed May 2016 httpswwwhydrogen energygovh2a_productionhtml
[3] Joseph Pratt Danny Terlip Chris Ainscough Jennifer Kurtz and Amgad Elgowainy H2FIRST reference station design task Technical Report SAND2015-2660 R Sandia National Laboratories April 2015 Available at httpenergygoveerefuelcells h2first
[4] US DOE DOE H2A Delivery Analysis accessed May 2016 httpswwwhydrogen energygovh2a_deliveryhtml
[5] 2016 Annual Evaluation of Hydrogen Fuel Cell Electric Vehicle Deployment and Hydrogen Fuel Station Network Development Technical report California Environmental Protection Agency Air Resources Board July 2016 Available at httpswwwarbcagovmsprog zevproghydrogenhydrogenhtm
[6] E Sutherland and F Joseck Low volume production and delivery cost Technical Report 15011 Department of Energy Hydrogen and Fuel Cells Program Record 2015
[7] Ricardo Guerrero Lemus and Jose Manuel Martinez Duart Updated hydrogen production costs and parities for conventional and renewable technologies International Journal of Hydrogen Energy 35(9)3929ndash3936 2010
[8] Alfredo Ursua Luis M Gandia and Pablo Sanchis Hydrogen production from water elecshytrolysis current status and future trends Proceedings of the IEEE 100(2)410ndash426 2012
[9] G Parks R Boyd J Cornish and R Remick Hydrogen station compression storage and dispensing technical status and costs Systems integration Technical Report NRELBKshy6A10-58564 National Renewable Energy Laboratory (NREL) Golden CO May 2014
[10] NFPA 2 Hydrogen Technologies Code Technical report National Fire Protection Associashytion 2016
45
- Executive Summary
- Acknowledgment
- Contents
- Figures
- Tables
- 1 Introduction
-
- 11 Background and Contents
- 12 Approach
- 13 Method Overview
-
- 2 Station Cost Components
-
- 21 Centrally Produced Hydrogen and Delivery
- 22 Hydrogen Produced On-Site via Steam Methane Reforming
- 23 Hydrogen Produced On-Site via Electrolysis
- 24 Compression Storage and Ancillary Equipment for a Conventional Station
- 25 Packaged Compression Storage and Ancillary Equpiment for a Modular Station
- 26 Hydrogen Dispensers
-
- 3 Results Station Designs and Costs
-
- 31 Conventional Station with Delivered Centrally Produced Hydrogen
- 32 Conventional Station with Hydrogen Produced On-Site via Steam Methane Reforming
- 33 Conventional Station with Hydrogen Produced On-Site via Electrolysis
- 34 Modular Station with Delivered Centrally Produced Hydrogen
- 35 Modular Station with Hydrogen Produced On-Site via Electrolysis
-
- 4 Conclusions
- Appendix A Piping and Instrumentation Diagram
- References
-
bull Modular fueling stations with hydrogen 4 delivered as compressed gas from a centralized production facility 5 produced on-site through electrolysis
The cost components of hydrogen fueling stations consist of capital cost of equipment instalshylation site acquisition and development and operating expenses For conventional stations capital costs of the equipment were estimated based on updated bills of material from the Phase 1 work Capital costs for modular stations and modular hydrogen production units were based on discusshysions with several manufacturers Operation costs such as the cost of electricity and other utilities if necessary were estimated using data from several sources
Revenue is assumed to be solely from the sale of hydrogen Operating expenses and revenue calculations depend on the assumed throughput of hydrogen The same utilization profile used in the Phase 1 work was used herein to calculate throughput although it was delayed in the onset year This utilization model estimates that starting in 2017 5 of station capacity will be utilized As the number of fuel cell vehicles on the roads continues to increase the utilization of stations is projected to increase up to a maximum of 80 in 2026 All costs were combined with revenue to determine the overall cost of hydrogen to the SDO such that the station will break even on investments in 7 years SDO margin and retail fuel taxes will be added to the calculated hydrogen cost to determine the final price to the consumer but both of these aspects are outside the scope of this work
Because the costs in this work are estimated (typically averages of costs from various situations andor a range of manufacturers) they will likely be different than that of an actual station To correct for differences in up-front capital or installation costs a graphical tool is included for the reader to estimate the resulting change in hydrogen cost for a given change in investment cost For example the tool can be used to show that a decrease of $300000 in (depreciable) up-front costs from that estimated herein for a 300 kgday station would result in a corresponding $100kg decrease in hydrogen cost
Economic results of the five different station concepts show that stations served by centrally produced delivered gaseous hydrogen are more economical compared to those which generate hydrogen on-site via SMR or electrolysis Higher capacity stations have a lower cost for hydrogen to break even at the same point in time compared to lower capacity stations Using the economic model specifying that a station will break even in year 7 both 300 kgday modular stations (at $15M for the uninstalled modular unit) and conventional stations with central hydrogen production and delivery in tube-trailers have a hydrogen cost of $1425kg (a lower uninstalled modular unit price of $1M results in a hydrogen cost of $1266kg) On-site production stations either through steam methane reforming or electrolysis have significantly higher capital costs than delivered centrally produced hydrogen This increase in capital results in a hydrogen cost increase of $6shy$10kg depending on the station capacity While SMR capital costs are higher than electrolyzer costs the electricity cost ends up making electrolyzer-supplied stations the most expensive option in terms of resulting cost per kilogram of dispensed hydrogen under the assumptions of this work Full cost results are shown in Table ES-1 and Fig ES-1
In addition to the economics the station equipment was laid-out in typical land use arrange-
vi
$00M$05M$10M$15M$20M$25M$30M$35M$40M$45M
inst
all
ed
cost
($)
capacity (kgday)
100 200 300
conv
ention
al d
eliv
ered
gas
conv
ention
al S
MR
conv
ention
al e
lect
roly
sis
mod
ular
($1
5M
) d
eliv
ered
gas
mod
ular
($1
M) d
eliv
ered
gas
mod
ular
($1
5M
) e
lect
roly
sis
mod
ular
($1
M) e
lect
roly
sis
$0k
$5k
$10k
$15k
$20k
$25k
$30k
inst
all
ed
cost
($[
kg
day]
)
conv
ention
al d
eliv
ered
gas
conv
ention
al S
MR
conv
ention
al e
lect
roly
sis
mod
ular
($1
5M
) d
eliv
ered
gas
mod
ular
($1
M) d
eliv
ered
gas
mod
ular
($1
5M
) e
lect
roly
sis
mod
ular
($1
M) e
lect
roly
sis
$0$5
$10$15$20$25$30$35$40$45
H2 c
ost
($k
g)
capacity (kgday)
100 200 300
Figure ES-1 Installed cost (which includes site preparation enshygineering amp design permitting component capital and installation costs) are shown in the left frames The top frame is the total inshyvestment in 2016$ while the bottom left frame is the installed cost per mass of hydrogen dispensed (kgday) The hydrogen cost to break even at year 7 is shown in the right frame for the stations analyzed in this work
vii
Table ES-1 Installed cost (which includes site preparation enshygineering amp design permitting component capital and installation costs) and resulting hydrogen cost to break even at year 7 for the stations analyzed in this work
station capacity rarr 100 kgday 200 kgday 300 kgday
station type darr installed cost ($)
H2 cost ($kg)
installed cost ($)
H2 cost ($kg)
installed cost ($)
H2 cost ($kg)
conventional delivered H2 conventional SMR H2 conventional electrolysis H2 modular ($15M) delivered H2 modular ($1M) delivered H2 modular ($15M) electrolysis H2 modular ($1M) electrolysis H2
$151M $274M $238M $186M $136M $274M $224M
$3053 $3847 $3966 $3390 $2912 $4303 $3825
$169M $383M $298M $186M $136M $314M $264M
$1837 $2596 $2651 $1916 $1677 $2730 $2491
$186M $443M $345M $186M $136M $345M $295M
$1426 $2023 $2174 $1425 $1265 $2173 $2013
ments Modular stations and stations with on-site production show a substantial decrease in overall required lot size due to reduced equipment size reduced truck access requirements and reduced setback distances The included piping and instrumentation diagram shows the system level reshyquirements for components and instruments and includes an estimate of utility requirements which are intended to be useful for site screening
This work details the economics of current hydrogen refueling stations and includes some sketches of what these fueling stations might look like It visually depicts the contributions to capital and operational costs of hydrogen for different station concepts making it easy to find the largest contributors to a high cost of hydrogen to the consumer This information can be used to devote research and development towards these high contributors At the station the dispenser compressors and chillers are expensive pieces where additional development or higher volume production could reduce station costs For electrolysis the purchase of low-priced electricity could serve to make on-site production cost competitive with central production and delivery This report enables the comparison of different station concepts that could be implemented in various market scenarios
viii
Acknowledgment
This work is funded by the US Department of Energy (DOE) Fuel Cell Technologies Office in the Office of Energy Efficiency and Renewable Energy
The Hydrogen Fueling Infrastructure Research and Station Technology Project (H2FIRST) is a DOE project executed by Sandia National Laboratories and the National Renewable Energy Labshyoratory The objective of H2FIRST is to ensure that fuel cell electric vehicle customers have a positive fueling experience relative to conventional gasolinediesel stations as vehicles are introshyduced (2015ndash2017) and transition to advanced refueling technology beyond 2017
DOEs Fuel Cell Technologies Office established H2FIRST directly in support of H2USA a public-private collaboration co-launched by DOE and industry in 2013 to address the key chalshylenges of hydrogen infrastructure
In addition to DOE the team wishes to thank the H2USA Hydrogen Fueling Station Working Group California Fuel Cell Partnership the California Energy Commission the California Air Reshysources Board and representatives from industry including H2 Logic Hydrogenics ITM Power Linde Nuvera PDC Machines Proton OnSite and Siemens AG for their input and support
ix
x
Contents
Executive Summary v 1 Introduction 1
11 Background and Contents 1 12 Approach 3 13 Method Overview 3
2 Station Cost Components 10 21 Centrally Produced Hydrogen and Delivery 10 22 Hydrogen Produced On-site via Steam Methane Reforming 13 23 Hydrogen Produced On-site via Electrolysis 14 24 Compression Storage and Ancillary Equipment for a Conventional Station 15 25 Packaged Compression Storage and Ancillary Equpiment for a Modular Station 17 26 Hydrogen Dispensers 18
3 Results Station Designs and Costs 19 31 Conventional Station with Delivered Centrally Produced Hydrogen 19 32 Conventional Station with Hydrogen Produced On-site via Steam Methane Reshy
forming 25 33 Conventional Station with Hydrogen Produced On-site via Electrolysis 27 34 Modular Station with Delivered Centrally Produced Hydrogen 31 35 Modular Station with Hydrogen Produced On-site via Electrolysis 35
4 Conclusions 39
Appendix
A Piping amp Instrumentation Diagram 42 References 45
Figures
ES-1 Installed cost (which includes site preparation engineering amp design permitting component capital and installation costs) are shown in the left frames The top frame is the total investment in 2016$ while the bottom left frame is the installed cost per mass of hydrogen dispensed (kgday) The hydrogen cost to break even at year 7 is shown in the right frame for the stations analyzed in this work vii
1 Historical and projected price of US No 2 Diesel (top) natural gas (middle) and electricity (bottom) from EIA data [1] 5
2 Utilization model from 2017 to 2036 of the theoretical hydrogen fueling stations in this report 6
xi
3 Additional cost of hydrogen given initial constructioncapital investment for the station utilization profile shown in Fig 2 Numbers on the graph lines are the years required to break even on the investment solid lines are for a depreciable asset (on a 7 year MACRS schedule) and dashed lines are for a non-depreciable asset Points on the plots are examples from the text 9
4 Breakdown of annual costs associated with delivery of hydrogen for a 100 (left) 200 (center) and 300 (right) kgday station Does not include the cost of hydrogen production or transport trailer 11
5 Cost for centralized production of hydrogen for the model used in this study and an H2A model (based on 380000 kgday production) [2] 12
6 Total costs associated with central production of hydrogen delivery and storage in a tube-trailer for a 100 (left) 200 (center) and 300 (right) kgday hydrogen refueling station 13
7 Annual production cost of 500 kgday hydrogen from distributed steam methane reforming as predicted by the current model and using the H2A production model 14
8 Cost and revenue associated with a conventional assemble-on-site station with centrally produced delivered hydrogen to break even at year 7 (2023) The net income includes the effects from depreciation and taxes Capital replacement costs and intervals are not included in this model (accuracy past 2023 is limited) Pie charts on the right show the breakdown of cumulative capital and operating costs over the 7-year analysis period to the cost of dispensed hydrogen 20
9 Renderings of a conventional station layout with delivered gaseous hydrogen 24
10 Cost and revenue associated with a conventional assemble-on-site station with on-site steam methane reforming produced hydrogen to break even at year 7 (2023) The net income includes the effects from depreciation and taxes Capital replaceshyment costs and intervals are not included in this model Pie charts on the right show the breakdown of cumulative capital and operating costs over the 7-year analysis period to the cost of dispensed hydrogen 26
11 Renderings of a conventional station layout with on-site production of hydrogen 28
12 Cost and revenue associated with a conventional assemble-on-site station with on-site electrolysis produced hydrogen to break even at year 7 (2023) The net income includes the effects from depreciation and taxes Capital replacement costs and intervals are not included in this model Pie charts on the right show the breakshydown of cumulative capital and operating costs over the 7-year analysis period to the cost of dispensed hydrogen 29
13 Cost and revenue associated with a modular station with centrally produced deshylivered hydrogen to break even at year 7 (2023) assuming a $15M uninstalled capital cost of the modular station The net income includes the effects from deshypreciation and taxes Capital replacement costs and intervals are not included in this model Pie charts on the right show the breakdown of cumulative capital and operating costs over the 7-year analysis period to the cost of dispensed hydrogen 32
14 Renderings of a modular station layout with delivered hydrogen 34
xii
15 Cost and revenue associated with a modular station with on-site electrolysis proshyduced hydrogen to break even at year 7 (2023) assuming a $15M uninstalled capital cost of the modular station The net income includes the effects from deshypreciation and taxes Capital replacement costs and intervals are not included in this model Pie charts on the right show the breakdown of cumulative capital and operating costs over the 7-year analysis period to the cost of dispensed hydrogen 36
16 Renderings of a modular station layout with an electrolyzer for on-site production with a small reduced footprint 37
17 Installed cost (which includes site preparation engineering amp design permitting component capital and installation costs) are shown in the left frames The top frame is the total investment in 2016$ while the bottom left frame is the installed cost per mass of hydrogen dispensed (kgday) The hydrogen cost to break even at year 7 is shown in the right frame for the stations analyzed in this work 40
Tables
ES-1 Installed cost (which includes site preparation engineering amp design permitting component capital and installation costs) and resulting hydrogen cost to break even at year 7 for the stations analyzed in this work viii
1 Economically favorable station designs from the Phase 1 Reference Station Design Task [3] that were fully analyzed 2
2 Water costs in various locations in California 6 3 Data used to calculate delivered hydrogen costs 11 4 Equipment needed for a conventional hydrogen fueling station and estimated costs
(inflation adjusted from [3] or reassessed as described in the text) 16 5 Installed cost (which includes site preparation engineering amp design permitting
capital and installation costs) and hydrogen cost for conventional stations with centrally produced delivered hydrogen 22
6 Installed cost (which includes site preparation engineering amp design permitting capital and installation costs) and hydrogen cost for conventional stations with SMR on-site 25
7 Installed cost (which includes site preparation engineering amp design permitting capital and installation costs) and hydrogen cost for conventional stations with electrolysis on-site 30
8 Installed cost (which includes site preparation engineering amp design permitting capital and installation costs) and hydrogen cost for modular stations with delivshyered hydrogen for two cases of uninstalled modular cost $15M and $10M 31
9 Installed cost (which includes site preparation engineering amp design permitting capital and installation costs) and hydrogen cost for modular stations with on-site electrolysis produced hydrogen for two cases of uninstalled modular cost $15M and $10M 35
xiii
10 Installed cost (which includes site preparation engineering amp design permitting component capital and installation costs) and resulting hydrogen cost to break even at year 7 for the stations analyzed in this work 39
A1 Utility requirement estimateslowast for the stations in this report 42
xiv
1 Introduction
The Hydrogen Fueling Infrastructure Research and Station Technology Project (H2FIRST) is a US Department of Energy (DOE) project executed by Sandia National Laboratories and the Nashytional Renewable Energy Laboratory The objective of H2FIRST is to ensure that fuel cell electric vehicle (FCEV) customers have a positive hydrogen fueling experience relative to conventional gasolinediesel fueling stations as FCEVs are introduced and to enable any needed transitions to advanced refueling technology in the future
For the wide-spread adoption of fuel cell electric vehicles (FCEVs) additional fueling stations need to be constructed in the US This work provides economic analyses and layouts of current-technology fueling station designs that utilize state-of-the-art components These reference station designs can help reduce the cost and speed the deployment of hydrogen stations by providing a common baseline with which to start a design enable quick assessment of the suitability of a particular site for a hydrogen station and identify contributors to poor economics and areas of research needed for certain station designs
This work is intended to address the needs of a wide variety of stakeholders Some examples of stakeholders and applicability include
bull Station developersoperators (SDOs) quick evaluation of potential sites and needs lower investment risk general cost and return estimates
bull Local authorities understand devices components in a typical station bull Code developers understand near-term needs for code refinement bull Other analysis groups new tool and baseline for economic studies bull Businessesentrepreneurs and RampD organizations identification of near-term business
solution and technology needs bull Local municipalities and the general public high-level understanding of typical stations
lowering acceptance risk bull Funding and financing organizations understanding of current technological capabilities
costs and market needs
11 Background and Contents
This is a follow-on work to the Phase 1 Reference Station Design Task [3] That work screened 160 different station permutations and found 4 near-term station designs that were economically favorable and one future station The report provides thorough designs of these stations with bills of materials layouts on greenfields and co-located with gasoline stations and piping and instrumentation diagrams The resulting capital and hydrogen costs for the selected stations in that analysis are reprinted here in Table 1
However the cost of the hydrogen was not included in the analysis only the capital and opshyerating costs associated with the fueling station (ie compression high-pressure storage cooling and dispensing) In addition the Phase 1 Reference Station project did not consider on-site hyshy
1
Table 1 Economically favorable station designs from the Phase 1 Reference Station Design Task [3] that were fully analyzed
Target Market
Delivery Method
Daily Capacity (kgday)
Maximum Consecutive Fills
Hoses Hydrogen Costlowast
($kg)
Capital Cost (2009$)
high use high use
liquid liquid
300 300
5 5
2 2
$746dagger
ndash $1486557dagger
$2007358Dagger
high use low use
gas gas
300 200
6 3
1 1
$603 $782sect
$1251270 $1097560sect
intermittent gas 100 2 1 $1328 $954799 lowast Hydrogen cost in this table is only the station contribution to the cost of hydrogen and does not
include the cost of hydrogen delivered to the station dagger Costs for this future station assume a high-pressure evaporator and cryopump which are not curshy
rently commercially available Dagger Consistent capital cost for a hydrogen fueling station that has hydrogen delivered as a liquid using
currently available technology but the cost of hydrogen could not be calculated using HRSAM [4] sect A typography error in the first report has been corrected for the hydrogen and capital cost of this
200 kgday station
drogen generation nor the impacts of lsquomodularrsquo stations where most components are pre-packaged in an assembly plant potentially reducing footprint and cost compared to traditional build-on-site stations
This work builds on the Phase 1 Reference Station work by producing designs and economic analyses of modular stations and stations utilizing on-site generation It also re-evaluates one traditional design from the Phase 1 Reference Station work to enable equal comparisons between all station types in the two works
In this report we describe many facets of designing hydrogen fueling stations In Section 12 Approach the station concepts are described In Section 13 Method Overview the steps to buildshying a fueling station are outlined the sources of economic data needed to calculate station operating costs are reported along with the station utilization profiles The Method Overview section is inshytended for readers who are interested in the assumptions and data used to determine the cost of hydrogen as the economic model is detailed in this section In Section 2 Station Cost Composhynents further details of the economic assumptions made about specific pieces of hydrogen fueling stations are included An experienced SDO may wish to skip to Section 3 Results Station Deshysigns and Costs which contains the detailed results of the economic model and includes sketches of hydrogen fueling stations
The wide variety of stakeholders on hydrogen refueling infrastructure and their interests means that some parts of the report will be more useful than others to different readers Rather than trying to simplify the report for one audience at the expense of another it is inclusive of all assumptions data and methods so that the reference stations described in this report can serve as a starting point for designs of real-world stations
2
12 Approach
In this work along with the costs associated with constructing and operating a hydrogen fueling station we also consider the costs of producing hydrogen on-site or having hydrogen produced at a centralized facility and delivered We also compare lsquoconventionalrsquo stations where parts (eg compressors tubing valves tanks) are assembled at the fueling station site to lsquomodularrsquo stations where parts (at least the compression and high-pressure storage if not the dispenser) are assembled at a centralized facility into a single unit and delivered to the fueling station site on a skid or in a trailer Five station concepts are considered herein
bull Conventional (assemble-on-site) stations with hydrogen 1 delivered as compressed gas from a centralized already operational production facility
(baseline) 2 produced on-site through steam methane reforming (SMR) 3 produced on-site through electrolysis
bull Modular fueling stations with hydrogen 4 delivered as compressed gas from a centralized production facility 5 produced on-site through electrolysis
For each of these concepts 100 200 and 300 kgday stations are studied since these capacities are appropriate for current and near-term station builds as identified in the Phase 1 Reference Station Design report [3] Costs (capital and operating) for each of these stations were estimated and the cost of hydrogen1 was calculated Components needed for each of these station concepts are specified and potential layouts are presented
13 Method Overview
Building a hydrogen fueling station requires several steps (which have associated costs andor considerations)
1 Identification and acquisition of land where the station can be built 2 Design of the station to account for the available space If hydrogen is to be delivered
delivery routes for the large tube-trailers must be planned 3 Design of utility connections including electrical power potentially water andor natural
gas bull Both conventional and modular stations require electrical power for the compressor
and chiller Trenching and conduit must be run transformers and electrical panels often require upgradingreplacement
bull On-site electrolysis requires a water supply (in addition to sufficient electrical power)
1In this work we refer to the cost of hydrogen rather than the price Using the method and assumptions described herein we calculate a per kg cost to a station developeroperator to provide hydrogen to consumers Station operators will be responsible for setting prices at their station which is what end consumers will pay for hydrogen and will vary based on local market demand profit margins retail fuel taxes and other considerations none of which are considered in this work The cost of hydrogen could be considered a lsquofixed minimum selling pricersquo to meet the payback criteria assumed in this analysis
3
bull On-site SMR requires water and natural gas (and sufficient electrical power) 4 Permitting and approval of the site design with the authorities having jurisdiction 5 Preparation of the site for station installation For a conventional station a concrete pad is
required and for modular stations concrete footings are needed at a minimum on which to secure the components or modular housing This concrete must be properly grounded and have a low electrical resistance to meet the fire code
6 Installation of the fueling station
In this analysis the costs of land procurement (step 1) are neglected Some costs in this analysis are based on the H2A Refueling Station Analysis Model (HRSAM) [4] In HRSAM the cost of installation of equipment (step 6) is 35 of the raw capital investment and the cost of site preparation engineering amp design project contingency and upfront permitting costs (steps 2-5) are 31 of the raw capital costs Accordingly here installation was assumed to cost 35 of the station capital for the conventional stations However since many of the modular installation costs are tied into the cost of the unit the cost of modular station installation is reduced to a flat cost of $60k (the details of this assumption can be found in Section 25) Also rather than using the percentage (31) for site preparation engineering amp design project contingency and upfront permitting costs in this analysis we assume a flat $300k for these costs This reflects the fact that these costs are linked more to the site itself rather than the cost and size of the equipment that must be installed on the site Since there is considerable variability in design permitting and site preparation costs we include additional analysis and charts showing how variability in these costs can change the cost of dispensed hydrogen later in this section
For all stations capital costs of the equipment were estimated Bills of materials for the conshyventional stations were assembled in the Phase 1 Reference Station Design Report [3] In this work we have updated these bills of material to estimate the cost of a conventional station today (2016) Capital costs for modular stations and modular hydrogen production units were based on discussions with several manufacturers For both the conventional and modular stations the design includes a single dispenser (ie credit card readeruser interface valving hose and nozshyzle to connect to the vehicle) able to dispense both 350 and 700 bar hydrogen located separately from the lsquostationrsquo (that contains the compressor high-pressure storage chiller programmable logic controller and safety equipment) Costs for specific components (eg compressors SMRs) are discussed in Section 2
In order to evaluate the operation costs the cost of several utilities and commodities namely diesel fuel natural gas electricity and water were needed With the exception of water these costs were estimated using pricing data from the US Energy Information Administration (EIA) [1] As shown in Fig 1 both historical and projected prices were extracted from the EIA database The data in the plots comes from the following series
bull Diesel ndash US No 2 Diesel Retail Prices Annual ndash Nominal Petroleum Prices Transportation Diesel Fuel Reference AEO2015
bull Natural gas ndash Retail Price of Natural Gas in Commercial Sector US Average Annual ndash Energy Prices Nominal Commercial Natural Gas United States Reference ndash Retail Price of Natural Gas in Industrial Sector US Average Annual
4
123456789
10
pri
ce (
nom
inal
$g
al)
diesel
0
5
10
15
20
25p
rice
(n
om
inal
$f
t3)
natural gas
commercial
industrial
1990 2000 2010 2020 2030 2040year
010
015
020
pri
ce (
nom
inal
$k
Wh
)
commercial electricity
Figure 1 Historical and projected price of US No 2 Diesel (top) natural gas (middle) and electricity (bottom) from EIA data [1]
ndash Energy Prices Nominal Industrial Natural Gas United States Reference AEO2015 bull Commercial electricity (US grid mix currently 13 renewable2)
ndash Retail Price of Electricity in Commercial Sector US Average Annual ndash Energy Prices Nominal Commercial Electricity United States Reference AEO2015
In all cases these data project out to 2045
It should be noted that the electricity prices estimated by EIA and used in this work assume status-quo reliance on fossil fuel In fact further cost reductions in renewable electricity generation
22015 estimate from httpwwweiagovtoolsfaqsfaqcfmid=92ampt=4
5
Table 2 Water costs in various locations in California
Location Price ($100 ft3) source
East Bay Los Angeles San Diego San Jose San Francisco San Francisco Peninsula
444 1022-10409 502 4509 714 7-8
ebmudcom dpwlacountygov sandiegogov sjwatercom sfwaterorg midpeninsulawaterorg
2020 2025 2030 2035year
0
20
40
60
80
100
uti
liza
tion
(
)
Figure 2 Utilization model from 2017 to 2036 of the theoretical hydrogen fueling stations in this report
technologies and utilization of low-cost stranded assets such as large nuclear coupled with increasshying fossil fuel costs may actually result in the opposite trend of future electricity rates As will be seen in the results variability in electricity rates can have a large impact on the cost effectiveness of on-site generation of hydrogen via electrolysis
Water is needed for electrolysis or steam methane reforming Water rates were estimated to be $8 per hundred cubic feet in 2016$ based on information from various sources of relevance to the California market shown in Table 2 While water rates can vary dramatically around the country as will be seen in the results the cost of water has a negligible impact on the resulting cost of hydrogen so using the California rates was deemed an acceptable approximation
In order to use this cost information to calculate operational costs and revenues a station utishylization rate must also be specified The same utilization profile used in Phase 1 of the Reference Station project [3] was used herein except the profile ramp has a delayed start as is suggested by a recent analysis by the California Air Resources Board [5] This profile is shown in Fig 2 As shown this utilization model estimates that starting in 2017 5 of station capacity will be utilized As the number of fuel cell vehicles on the roads continues to increase the utilization of stations is
6
projected to increase up to a maximum of 80 in 2026 This means for example that in 2026 and in perpetuity after a station sized for 100 kgday will sell on average 80 kgday hydrogen
Site preparation capital installation and operating costs were combined with hydrogen throughshyput and a required break-even time period on the initial investment to determine the overall cost of hydrogen to the SDO The estimates for these cost components are based on best-available inforshymation including consultation with station and equipment providers prior studies and government entities involved in publicly-funded stations However in most cases the estimated costs are avshyerages and can vary in practicendashfor example site preparation costs can vary widely or different manufacturers will have different costs for equipment with similar specifications If the reader has actual cost information that varies from that which is estimated in this report Fig 3 can be used to calculate the resulting change in hydrogen cost
Figure 3 shows the cost of hydrogen as a function of the initial non-depreciable cost by the dashed lines (eg land purchase costs) and an initial depreciable cost (eg equipment) by the solid lines Depreciation was estimated using a 7-year Modified Accelerated Cost Recovery System (MACRS) depreciation rate and an overall tax rate of 389 (35 federal and 6 state tax) the rate specified in HRSAM [4] The numbers and different colors in the plot represent the numbers of years required to make back the cost of the asset For example if one were to purchase land (which is non-depreciable) for $200k to make back that investment in 7 years the cost of hydrogen would be approximately $3kg higher than without the purchase for a 100 kgday station or about $1kg higher for a 300 kgday station (note that this assumes the stations are utilized at the rate shown in Fig 2) As a second example if a $1M electrolyzer were aded to a station (a depreciable investment) it would add $957kg for hydrogen to pay for that asset for a 100 kgday station and just over $3kg for a 300 kgday station (Note that the costs scale inversely with capacity because the same percentage station utilization rate shown in Fig 2 is used in this analysis In other words we assume that customers at the 100 kgday station are purchasing exactly 13 the hydrogen as at the 300 kgday station)
7
00 05 10 15
investment cost (M$)
0
2
4
6
8
10ad
dit
ion
al
H2 c
ost
($k
g)
55
7
7
11
11
13
13
100 kgday
(a) Additional cost of hydrogen for a 100 kgday station
00 05 10 15
investment cost (M$)
0
2
4
6
8
10
ad
dit
ion
al
H2 c
ost
($
kg
)
55 7
711
11
13
13
200 kgday
(b) Additional cost of hydrogen for a 200 kgday station
8
00 05 10 15
investment cost (M$)
0
2
4
6
8
10
ad
dit
ion
al
H2 c
ost
($k
g)
5
5 7
711
11
13
13
300 kgday
(c) Additional cost of hydrogen for a 300 kgday station
Figure 3 Additional cost of hydrogen given initial construcshytioncapital investment for the station utilization profile shown in Fig 2 Numbers on the graph lines are the years required to break even on the investment solid lines are for a depreciable asset (on a 7 year MACRS schedule) and dashed lines are for a non-depreciable asset Points on the plots are examples from the text
9
2 Station Cost Components
This section describes the primary contributors to the cost of hydrogen
bull Centrally Produced Hydrogen and Delivery bull Hydrogen Produced On-site via Steam Methane Reforming bull Hydrogen Produced On-site via Electrolysis bull Compression Storage and Ancillary Equipment for a Conventional Station bull Packaged Compression Storage and Ancillary Equpiment for a Modular Station bull Hydrogen Dispensers
Each subsection describes the technical details of the components and the rational for the assumed costs in the economic model
21 Centrally Produced Hydrogen and Delivery
For delivered hydrogen we included the cost of buying hydrogen from a centrally located production facility delivering it in tube-trailers and leasing tube-trailers for storage at the fueling station Initially the H2A Delivery Scenario Analysis Model (HDSAM) [4] was evaluated for its applicability to this project but this model did not have enough flexibility in its scenarios In this analysis we wanted to consider a single station and not consider savings from multiple station deliveries due to tractortrailer sharing In this analysis we did not model the cost of tractortrailer purchase and payment but rather considered a very early market scenario (ie the current market conditions) where the industrial gas company would own and control the delivery tractors and lease the tube-trailers to the station owners (assuming that they are left on-site until empty) Some of the data from HDSAM was used in this analysis including some parameters shown in Table 3 The delivery distance was assumed to be 200 miles so that delivered hydrogen costs could be compared to estimates from industrial gas companies [6] The trailers were assumed to have 300 kg of usable hydrogen There are some jumbo high-capacity tube-trailers in the market with closer to 1100 kg usable hydrogen3 but for these current market scenario simulations we assumed more conventional tube trailers with steel tubes and the smaller capacity With a 300 kg usable H2 capacity the utilization scenario shown in Fig 2 and a given station capacity were used to calculate the time to consume a tube-trailer The trips per year were calculated and fuel labor and other costs for delivering hydrogen were calculated Frequent deliveries of hydrogen would be necessary and it is likely that a fueling station would need to have multiple tube-trailers on site to ameliorate outages Especially for the 300 kgday station as the peak nameplate capacity is approached it may become infeasible to get daily tube-trailer deliveries and another type of hydrogen storage (ie liquid) or some on-site production would probably be required Nonetheless we performed the analysis with the assumption that the industrial gas companies would be able to provide near daily deliveries of tube-trailers in the out-years
Figure 4 shows the costs components associated with delivering tube trailers to a single station Because each station is assumed to follow the same utilization projections the costs follow the
3httpwwwthe-linde-groupcomennews_and_mediapress_releasesnews_20130925html
10
Table 3 Data used to calculate delivered hydrogen costs
description value
average delivery gas mileage1 6 mpg average delivery speed1 378 mph tube-trailer capacity2 300 kg tube-trailer maximum pressure2 250 bar delivery labor cost1 2121 $hr overhead on labor1 20 insurance cost1 $0106 mile licensing amp permits1 $0116 mile maintenance cost1 $0078 mile lease price3 $3500 month
1 data from HDSAM [4] 2 data from energygov
3 data from personal communications
2020 2025 2030 2035year
050
100150200250300350
deli
very
cost
(k$y
r)
diesellabor
insurancemaintenance
permitting
2020 2025 2030 2035year
diesellabor
insurancemaintenance
permitting
2020 2025 2030 2035year
diesellabor
insurancemaintenance
permitting
Figure 4 Breakdown of annual costs associated with delivery of hydrogen for a 100 (left) 200 (center) and 300 (right) kgday stashytion Does not include the cost of hydrogen production or transport trailer
11
2010
2015
2020
2025
2030
2035
2040
2045
2050
year
1
2
3
4
5
6
7
cost
(n
om
inal
$k
g)
centralized H2 production
current model (commercial NG)
H2A production
current model (industrial NG)
Figure 5 Cost for centralized production of hydrogen for the model used in this study and an H2A model (based on 380000 kgday production) [2]
same increasing trend out to 2026 The continued increase past 2026 is due to inflation which is estimated at 194 and the increasing cost of diesel fuel (Fig 1) This chart shows that labor is the largest contributor to hydrogen delivery costs followed by the cost of diesel to fuel the delivery truck All of these delivery costs scale proportionally if the delivery distance were to be smaller or larger than 200 miles The costs also scale proportionally with the nameplate capacity because the utilization scales with the nameplate capacity causing the larger stations to require proportionately more deliveries labor maintenance etc
Along with delivery costs in this analysis we also include the cost of the centrally produced hydrogen The cost of centrally produced hydrogen was estimated using a correlation from Lemus and Duart [7] Because the central hydrogen production plants that exist today make hydrogen from steam-methane reforming they found that production was linearly dependent on the price of natural gas
H2production cost = 12 middot NGprice + 6
where the cost and price are in $GJ Using the pricing data shown in Fig 1 this centrally produced hydrogen cost was calculated The DOErsquos H2A production model (version 301) [2] is compared to this calculation in Fig 5 using both commercial and industrial costs for natural gas As shown the Lemus and Duart model agrees quite well with the H2A production model until about 2042 Thus the commercial natural gas price was selected for use in further calculations of the costs associated with hydrogen production for conventional delivered hydrogen stations
Finally for delivered centrally produced hydrogen the cost of the tube trailer lease was inshycluded Shown in Table 3 the lease price was estimated at $3500 per month We assumed in
4Inflation rate taken from HRSAM [4]
12
2020 2025 2030 2035year
0100200300400500600700
deli
vere
d H
2 c
ost
(k$y
r)cent productiontube trailer lease
delivery
2020 2025 2030 2035year
cent productiontube trailer lease
delivery
2020 2025 2030 2035year
cent productiontube trailer lease
delivery
Figure 6 Total costs associated with central production of hyshydrogen delivery and storage in a tube-trailer for a 100 (left) 200 (center) and 300 (right) kgday hydrogen refueling station
this analysis that the stations would continually lease 2 tube trailers at $7000 per month so there would be no outages as the empty hydrogen tube trailers were exchanged We assumed that the lease cost was not affected by the number of deliveries required Figure 6 shows the total costs associated with delivered centrally produced hydrogen Within the red delivery bar are all of the costs shown in Fig 4 All three of the costs broken out in the plot (central production tube-trailer leasing and delivery) are significant contributors to the cost of centrally produced delivered hyshydrogen As shown the cost of the tube-trailer lease was fixed in this model for any station capacity resulting in a smaller percentage of the costs for 200 and 300 kgday stations This is far from a certain assumption The high lease price might cause a station operator to think about purchasing a tube-trailer (or fleet of tube-trailers) but the estimated cost of a tube trailer within HDSAM [4] is around $1 million At least two trailers would be required unless the station were shutdown while the tube trailers were being refilled so purchase might not make financial sense without an adshyvanced network of stations andor a long-term financial horizon An additional option to eliminate the trailer lease expense is to install a similar amount of low pressure hydrogen storage on site allowing the trailer to discharge its contents and depart This would add several hundred thousand dollars of capital cost to the station (depending on the amount and type of storage installed)
22 Hydrogen Produced On-site via Steam Methane Reforming
Cost information for on-site reformers was gathered from several manufacturers An estimate for capital cost is $115M for a 100 kgday unit $204M for a 200 kgday unit and $246M for a 300 kgday unit A functional fit was found to several data points including the H2A production model [2] capital cost for a 1500 kgH2day unit which is $325M As with most products the per kg cost of production reduces as the production rate increases
Feedstock consumption rates were also collected from manufacturers for several on-site reshyforming units Based on this information assumed rates of 39 kWhkgH2 96 lH2OkgH2 and 35
13
2010 2015 2020 2025 2030year
0
100000
200000
300000
400000
500000
600000
700000
800000
H2 p
rod
uct
ion
cost
($
)current model
H2A production
Figure 7 Annual production cost of 500 kgday hydrogen from distributed steam methane reforming as predicted by the current model and using the H2A production model
kgNGkgH2 were used to estimate operating costs The operating costs for the H2A production model for distributed SMR scaled down to 500 kgday [2] was compared to the operating costs calculated using the current model (using the cost information shown in Fig 1 and the commershycial price of natural gas) This comparison is shown in Fig 7 The annual operating costs of the current model which is based on recent manufacturer information are within 20 of the H2A model predictions
One factor that is not taken into account in this analysis is startup and shutdown production efficiencies and losses Because SMRs operate at high temperature start-up is slow and frequent shutdownstartup cycles can drastically reduce production efficiency It may be cheaper to simply produce and vent hydrogen continuously rather than cycling the unit off and back on The addishytional cost of running the SMR when it is not needed is not included in this analysis it is assumed that this process occurs instantaneously and without an efficiency penalty The impact of this assumption is that the operational costs of the SMR may be under-predicted by this model
23 Hydrogen Produced On-site via Electrolysis
The two most common type of electrolysis units on the market today are polymer electrolyte membrane (PEM) and alkaline PEM electrolysis units use the same technology as PEM fuel cells (which are found in vehicles) but the cells are biased and protons move in the opposite direction from a fuel cell Alkaline fuel cells have a liquid electrolyte solution that serves to transport ions from the electrodes Alkaline electrolyzers are a more mature technology can be cheaper and may have a longer lifetime than PEM electrolyzers but PEM electrolyzers produce higher purity hydrogen with less sensitivity to water purity are smaller can respond more quickly to changes in production rate and can produce hydrogen at pressure reducing compression needs In this
14
analysis we are not specifying the type of electrolyzer since costs (which are not precisely quoted in any case) are reasonably similar
Electrolyzer electricity consumption was estimated to be 56 kW-hrm3 = 624 kW-hrkgH2H2 There is some variability in electricity consumption depending on each manufacturerrsquos equipment but this value is in line with an analysis by Ursua et al [8] and is the average value from the Electrolyzer Energy composite data product (CDP)5 from NREL The municipal water consumpshytion was calculated as just under 3-times the stoichiometric value required based on the reacshytion (H2O rarr H2 + 12O2) (which accounts for purification system losses and other cooling water needs) at 264 lH2OkgH2 An informal survey of several companies led to capital cost estimates of $800k $12M and $15M for the 100 200 and 300 kgday stations These capital costs are lower than the SMR capital costs used in this analysis for an equivalent hydrogen production capacity For the modular electrolyzer units considered herein the installation cost was assumed to be a flat $60k regardless of the hydrogen production capacity an estimate based on discussions from several companies
Similar to the SMR the efficiency penalty for shutting down the unit and restarting it is not taken into account in this analysis This inefficiency is expected to be lower for electrolysis than SMR since the operation temperatures are much lower and the startup process is simpler Nonetheshyless there will be an efficiency penalty for cycling the electrolyzer off and back on so the elecshytrolyzer and storage sizes need to be optimized for the station utilization rates during station design
24 Compression Storage and Ancillary Equipment for a Conventional Stashytion
For conventional stations most equipment costs from Phase 1 of the reference station design report [3] were used in this analysis Shown in Table 4 costs for all but the compressor dispenser and chillercooling block were inflation adjusted from 2009$ to 2016$ at a 19 inflation rate The cost of the compressor was not simply inflated but rather re-estimated using the compressor size evaluated by HRSAM [4] and Fig 2 from the Phase 1 Reference Station Design report [3] The $100kndash$150k capital cost estimates for the compressors given in the first report were based on a specific station design with a smaller compressor rather than the compressor sizing evaluated by HRSAM The HRSAM estimates for compressor needs for the 100 200 and 300 kgday stations are 6 14 and 23 kghr as shown in the table Compressor energy consumption was assumed to be 42 kWhrkgH2 This is consistent with NRELrsquos Compressor Energy CDP6 and manufacturer specifications This factor was used to calculate the energy utilization and size the compressors at 25 60 and 100 kW for the 100 200 and 300 kgday stations respectively The electrical requirements are a bit more than those calculated by HRSAM which assumes that the compressors have a 65 isentropic efficiency but correspond well with literature [9] and manufacturer data
As with the Phase 1 report [3] the compressor is the only variable cost in different-sized station
5httpwwwnrelgovhydrogenimagescdp_infr_36jpg 6httpwwwnrelgovhydrogenimagescdp_infr_35jpg
15
Table 4 Equipment needed for a conventional hydrogen fuelshying station and estimated costs (inflation adjusted from [3] or reshyassessed as described in the text)
description quantity cost total tanks [13 kg each 945 bar MAWP Type II] 3 $45633 $136899 pressure transducer and indicator 6 $1141 $6845 block and bleed valve 6 $570 $3422 air operated valve 6 $2282 $13690 pilot solenoid valve 7 $57 $399 isolation hand valve 12 $570 $6845 check valve 3 $456 $1369 coolant pump 1 $1369 $1369 water chiller 2 $4563 $9127 coolant filter 1 $57 $57 instrument air compressor 1 $1141 $1141 instrument air dryer and filter 1 $2909 $2909 hydrogen compressor [2-stage 950 bar outlet]
100 kgday station - 6 kghr 25 kW $189827 $189827 200 kgday station - 14 kghr 60 kW 1 $328774 $328774 300 kgday station - 23 kghr 100 kW $453010 $453010
hydrogen dispenser [(1) 350 bar and (1) 700 bar hose] 1 $250000 $250000 hydrogen chiller and cooling block 1 $150000 $150000 IR flame detector 2 $1711 $3422 hydrogen filter 1 $2852 $2852 PLC 1 $5704 $5704 tubing - $22817 $22817 fittings - $17112 $17112 electrical upgrades - $57041 $57041 fencing - $5704 $5704 bollards - $5704 $5704
total (100 kgday station) total (200 kgday station) total (300 kgday station)
$894256 $1033203 $1157439
16
designs The developers of HRSAM [4] found the minimum size of the commonly available high pressure ground storage tanks to be 13 kg and three of these are needed for a cascade fill giving a minimum installed high-pressure storage amount of 39 kg This size was found to be sufficient for each station modeled in this work Since each station only has a single dispenser that cost also remains constant Using the varied compressor costs the conventional station equipment costs range from $900k to $12M
Costs for the hydrogen dispenser and the hydrogen chiller and cooling block were separated out and updated in this report where they were lumped together in the previous report The chiller and cooling block was estimated to cost $150k while the dispenser was estimated at $250k These costs are based on discussions with manufacturers and station operators who have purchased these pieces of equipment and are 15 higher than the estimated $350k combined cost in the previous report Part of the reason for this update is the evolution of dispenser design from an industrial-type interface to one that provides a retail customer experience more similar to that at a gasoline station and the associated cost of these newer dispensers
One high cost subsystem shown in Table 4 is the hydrogen compressor where cost savings can be realized by reducing the size of the compressor However the compressor size needs to be balanced by the high pressure storage and station utilization The hydrogen dispenser is also a significant cost as production volume increases on the components needed in the dispensers and the assembled dispensers this cost will likely decrease The same number and type (or at least cost) of dispenser valves pumps filters tanks tubing safety equipment etc are needed for the 100 kgday station as the 200 and 300 kgday stations
25 Packaged Compression Storage and Ancillary Equpiment for a Modushylar Station
Modular stations have the compressor hydrogen cooling block chiller high-pressure storage and control electronics housed in andor on a single container Manufacturing and installing these components in this way reduces installation labor allows leak and operation checking at a dedishycated facility and can potentially reduce equipment costs by enabling high volume production of standardized components Most station designers and companies are currently producing modular units and having at least some components in a modular shippable fashion is the preferred way of constructing stations at this time Our research shows that the primary savings associated with modular stations are in the installation costs Based on conversations with manufacturers capital costs of modular stations are currently on par with conventional stations This is likely because much of the same equipment is used in both types of stations We estimate modular fueling stations to cost between $750k to $15M depending on the manufacturer and whether or not a dispenser is included This price range is for a unit that can compress and provide 200-400 kgday hydrogen and spans the $890k-$12M capital cost range of the conventional station equipment While inshystallation of conventional stations is expected to be about 35 of capital costs [4] installation of equipment for a modular station is expected to be very low likely no more than 5 of the capital costs of the modular unit In this report installation cost was estimated to be $60k regardless of
17
station size the same as the electrolyzer unit installation costs since the installation requirements are similar
Most manufacturers make just one size of modular units so there might not be potential to save by having a smaller nameplate capacity In this analysis we provide estimates for total station costs for two cases of modular unit costs ($1M and $15M) to elucidate the effect of differing capital costs These costs are assumed to include the cost of the dispenser even though is is shown as being separated from the modular system in the layout sketches In the analysis below these two different costs are also used as a further example to show how Fig 3 can be used to adjust resulting hydrogen cost to account for variability in capital cost estimates
26 Hydrogen Dispensers
Both the modular and conventional on-site station components need to interface with a disshypenser The dispenser includes valving high pressure break-away(s) hose(s) nozzle(s) flow meshytering control electronics and a customer interface (point of sale system) Stations often provide both 350 and 700 bar fills requiring two hoses break-aways nozzles and additional plumbing and control electronics Dispensing units range in price from approximately $150k-$350k For a high utilization area where one would want to allow multiple simultaneous fills the cost of additional dispensers would need to be factored into an analysis In this analysis both the conventional stashytion and modular station total cost estimates include the cost of a single dispenser with both a 350 and 700 bar hose
18
3 Results Station Designs and Costs
Multiple approaches exist to financially model fueling stations and determine the cost of hydroshygen One approach is to perform a discount cash flow analysis specifying a return on investment that is desired after a given time-frame This is the approach taken in HRSAM [4] and used in the Phase 1 Reference Station Design report [3] Specifying a 30 year analysis period and a discount rate of 15 the cost of hydrogen was determined for the different station designs These specishyfications led to a payback period (break-even time) of approximately 75 years In this work an alternative approach to the discount cash flow analysis was used wherein we calculated the cost of hydrogen considering a 7-year payback period A solution for the cost of hydrogen is found such that the sum of all costs and revenues is zero at the end of a 7-year period By taking this approach we do not need to include replacement costs for components over the entire 20 or 30 year discount cash flow analysis we only need to include replacement costs for components that need to be replaced within 7-year time-frame While some maintenance costs will be required over this 7 year time-frame we assume that no major component of the fueling station would need to be replaced in this period The validity of this assumption varies with equipment type manufacturer and duty cycle We project station costs and incomes out 20 years in this analysis but these results are missing capital replacement costs
As discussed earlier site-preparation costs can vary widely In this analysis we assume a flat $300k to cover the site-preparation including engineering and design permitting and a project contingency The cost to install the conventional components is assumed to be 35 of the capital cost while the cost to install the modular stations electrolyzer or SMR units is assumed to be $60k regardless of unit size or station capacity It should be noted that should any of these assumed costs be different from a real-world station build the black lines in the chart of Fig 3 can be used to determine the resulting change in the cost of hydrogen for the 7-year payback period For example if the site preparation costs $600k rather than the assumed $300k one could use Fig 3 to determine that for a depreciable asset7 the excess $300k would add nearly $3kg to the cost of hydrogen for a 100 kgday station or approximately $1kg to the cost for a 300 kgday station
It is assumed that the station construction takes one year (the year of 2016) and utilization begins the following year (2017) at the rate shown by Fig 2 Just like the analysis that was used to generate Fig 3 when calculating the cost of hydrogen depreciation was estimated using a 7-year Modified Accelerated Cost Recovery System (MACRS) depreciation rate and an overall tax rate of 389 (35 federal and 6 state tax)
31 Conventional Station with Delivered Centrally Produced Hydrogen
Figure 8 shows the cost and revenue model for a conventional assemble-on-site station with delivered hydrogen In 2016 there is no revenue and the costs for building the station are incurred The capital of the station (green bar) is the largest contributor to costs in 2016 The 35 of capital
7Site preparation is likely considered depreciable because it is preparing the land for business use and is closely associated with the station equipment
19
site prep
94
stati
on
cap
ital
280
stationinstall 98
deliv
ered
H 232
6
labor
65
maintenance
118
electricity19
-2000
-1500
-1000
-500
0
500
1000
1500
2000co
st o
r re
ven
ue (
k$
yr)
tax
site preparationstation capitalstation install
delivered H2labor
maintenanceelectricity
revenue ($3053kg)net income
100 kgday
site prep
78
stat
ion
capit
al
269
stationinstall 94
deliv
ered
H 237
6
labor
54
maintenance
98
electricity31
-2000
-1500
-1000
-500
0
500
1000
1500
2000
cost
or
reve
nu
e (
k$
yr)
tax
site preparationstation capitalstation install
delivered H2labor
maintenanceelectricity
revenue ($1837kg)net income
200 kgday
site prep
67
stat
ion
capit
al
259
station
install 91
deliv
ered
H 2
413
labor
46
maintenance
84
electricity40
2020 2025 2030 2035year
-2000
-1500
-1000
-500
0
500
1000
1500
2000
cost
or
reve
nu
e (
k$y
r)
tax
site preparationstation capitalstation install
delivered H2labor
maintenanceelectricity
revenue ($1426kg)net income
300 kgday
conventional delivered H2
Figure 8 Cost and revenue associated with a conventional assemble-on-site station with centrally produced delivered hydroshygen to break even at year 7 (2023) The net income includes the effects from depreciation and taxes Capital replacement costs and intervals are not included in this model (accuracy past 2023 is limshyited) Pie charts on the right show the breakdown of cumulative capital and operating costs over the 7-year analysis period to the cost of dispensed hydrogen
20
costs needed to install the station (red bar) and the $300k site preparation cost (blue bar) make up the balance As discussed earlier land costs are not included in this analysis and site preparation costs can vary quite widely Figure 3 should be used to calculate the change in the cost of hydrogen given any land purchase costs differences in real-world capital or site preparation costs The total installed station costs range from $15M to $19M for the 100 to 300 kgday stations
In 2017 as hydrogen begins to sell at the station revenue begins to roll in but operating costs are also incurred The largest incurred operation cost is the hydrogen fuel supply including the cost of production delivery and storage at the station represented by the light blue bar in Fig 8 This cost increases as the utilization of the station increases (due to more hydrogen required by the station) until 2026 when utilization stabilizes After 2026 the delivered hydrogen costs continue to increase solely due to inflation Contributors to the hydrogen production delivery and tube-trailer storage (labeled delivered H2 in Fig 8) are shown by Figs 4 and 6 and are discussed in Section 21
The purple labor bar in Fig 8 makes up a small percentage of the operating costs This value is calculated using a labor rate of $1370 hr in 2016$ the default rate in HRSAM [4] This labor rate is fixed regardless of the size of the station or the amount of hydrogen sold Maintenance shown by the yellow bar is a slightly larger operating cost contributor Maintenance was estimated at $50kyr (in 2016$ with increases due only to inflation over time) regardless of the station size Maintenance costs can vary quite widely from station to station and from quarter to quarter but this number is near the average annual cost suggested by NRELrsquos Maintenance Costs Over Time CDP8
Electrical costs to run the compressor and chiller at the station make up the balance of the operational cost in Fig 8 shown by the slim gray bar The average compressor energy usage at stations is 42 kW-hrkgH2 according to the Compressor Energy CDP9 from NREL An additional 20 of the compressor energy use was assumed for the refrigeration energy use a factor consistent with HRSAM [4] The cost for electricity shown in Fig 1 was used with this assumed compression and refrigeration energy use to calculate the cost of electricity at the station This cost increases with the amount of hydrogen dispensed and is approximately the same as the maintenance costs for the 300 kgday station after the 80 utilization rate is reached in 2026 For the 200 and 100 kgday stations the electricity usage is proportionately less
For each of the three stations the cost of hydrogen was calculated such that the capital and operating costs were recovered by revenue over 7 years Shown in Fig 8 and tabulated in Table 5 the cost of hydrogen is $3053kg $1837kg and $1426kg for the 100 200 and 300 kgday stations respectively The decrease in hydrogen cost with increasing station capacity is consistent with the Phase 1 Reference Station results [3] and is because the increased revenue from hydrogen sales more than compensates for the increased cost of capital due to the larger station capacity The decreasing hydrogen cost with station capacity also shows a trend of diminishing returns also consistent with the Phase 1 work [3] and increasing the capacity further will not decrease the hydrogen cost so dramatically In fact increasing station capacity will eventually result in
8httpwwwnrelgovhydrogenimagescdp_infr_30jpg 9httpwwwnrelgovhydrogenimagescdp_infr_35jpg
21
Table 5 Installed cost (which includes site preparation engishyneering amp design permitting capital and installation costs) and hydrogen cost for conventional stations with centrally produced delivered hydrogen
capacity (kgday) installed cost ($) H2 cost ($kg)
100 $151M $3053 200 $169M $1837 300 $186M $1426
added capital not considered in this analysis such as multiple dispensers and associated hydrogen chilling equipment additional high pressure cascade storage and additional compressors as station capacity exceeds the throughput of available single compressors
The net income is shown by the purple lines in Fig 8 In 2016 the net income (which is actually an expense in this year without revenue) is not quite the entire capital costs This is due to the depreciation deduction (tax credit) on the capital investment shown by the brown bar In 2017 the net income is slightly greater than the revenue generated by selling hydrogen Once again this is the depreciation deduction on the capital investment which is occurring on a 7 year schedule The overall net expenses and income in all cases reaches a summed value of zero in year 7 (2023) and all income after that point would be earned by the investor (although as stated earlier replacement intervals of equipment are not included in this analysis) Including capital replacement costs would not affect the revenue but would affect the costs in replacement years the tax burden (as this replaced equipment depreciated) and net income in the years past 2023 For all three capacity stations the net income increases (due to inflation and varying operating costs) from about $300-400k year in 2024 to $500-600k yr in 2036
The pie charts on the right in Fig 8 show the contribution from the capital and operating costs over the 7 year payback period to the cost of hydrogen For the 100 kgday station the delivered hydrogen is the largest contributor at 33 followed by the station capital (28) Maintenance is also a large contributor to the cost of hydrogen responsible for 12 of the $3053kg Site preparation and station installation costs are each responsible for roughly 95 of the hydrogen cost Labor accounts for 65 of the hydrogen cost and electricity to run the compressor and chiller is a small contributor at only 2 Overall taxes do not have a net effect on the cost of hydrogen (and therefore do not appear in the pie charts) due to the fact that the capital investment is depreciating on a 7 year schedule providing tax credits in the early years and the fact that we are specifying the cost of hydrogen based on the operator breaking even on their investment in year 7 If we were to determine the cost of hydrogen using a different criterion or if there were capital investments that were not depreciating (or depreciating on an alternative schedule) taxes would have a role in the cost of hydrogen Taxes will also have an impact on the revenue and return on investment over a longer analysis period Note that in this analysis we are not considering the tax to the consumer that is placed on the dispensed fuel
Comparison of the pie charts in Fig 8 shows that as the station capacity increases the stashy
22
tion capital reduces slightly as a percentage of the hydrogen cost while the delivered hydrogen increases its share of the hydrogen cost However the overall cost of delivered hydrogen reduces with increasing capacity from $995kg for the 100 kgday station down to $589kg for the 300 kgday station Electricity on the other hand while increasing as a percentage of the hydrogen cost with increasing capacity contributes approximately $057kg to the cost of hydrogen regardless of the station capacity because the same amount of energy is required to compress and chill each dispensed kg of hydrogen
Figure 9 shows how a conventional station with delivered hydrogen might be organized on a site This is nearly the same layout sketched in the previous reference station design report [3] As with the previous layout the air compressor dryer and cooling water equipment are located near the convenience station so that the air compressor inlet is at least 45 feet away from the hydrogen trailers a prescriptive requirement of NFPA 2 [10] This also prevents this equipment outside the wall from requiring electrical classification The equipment in this layout is spaced out and one could probably devise a smaller footprint The largest contributors to the space requirement are the two tube trailers on-site which would be necessary to prevent interruptions in service The tube trailers drawn are 40rsquo long and sufficient space and delivery routes need to be designed into the layout so that the drivers can drop them off and pick them up
Cost of Delivered Hydrogen
To gain insight into the cost of delivered hydrogen its contribution to the overall cost of hyshydrogen was removed and the overall cost was recalculated Without the delivered hydrogen cost the cost of hydrogen would be $2058 $1147 and $837 for the 100 200 and 300 kgday stashytions respectively The difference between these two scenarios results in delivered hydrogen costs of $995 $690 and $589 per kg Note that these costs includes the leasing two tube-trailers for storage on-site and the cost of delivered centrally produced hydrogen (without the cost of the tube-trailer lease) is $387kg for all three capacity stations The delivered hydrogen cost of $6ndash 10kg is in line with the $6ndash$8kg (in 2014$) reported by Sutherland and Joseck [6] for centrally produced delivered hydrogen of 500ndash1000 kgmonth with a delivery distance of up to 200 miles The delivery distance (assumed to be 200 miles in this analysis) will have a large impact on the cost of delivered hydrogen proportionately changing all of the associated delivery costs shown in Fig 4 which are cumulatively shown as the red bar in Fig 6 The tube-trailer lease price to store hydrogen on-site which is fixed for all three capacity stations is responsible for the decreasing cost of the centrally produced delivered and stored hydrogen as the station capacity increases By having a higher throughput of hydrogen the larger capacity stations are able to spread the cost of the tube trailer lease over a greater quantity of dispensed hydrogen
Comparison of Costs to Previous Study
Neglecting the cost of the delivered hydrogen also allows a comparison to the results of the Phase 1 Reference Station Design report [3] The calculated hydrogen costs without production
23
conveniencestore
50 0
dispenser island
H2 cooling blockH2 chiller
gas panel
high pressure H2storage
compressorwater chillerair compressor
tube trailer
168 0
140
0
30 0
Figure 9 Renderings of a conventional station layout with delivshyered gaseous hydrogen
24
and delivery of $2058 $1147 and $837 are higher than the Phase 1 calculated costs of $1328 $782 and $603 for the 100 200 and 300 kgday stations (shown in Table 1) Several factors contribute to the differences in the calculated fuel cost First the installed capital costs of $15M $17 and $19M in this analysis are higher than those calculated previously of $11M $12M and $13M (even after adjusting for inflation) Second the previous analysis used HRSAM in which the operating costs are calculated a bit differently than this analysis Finally in the previous analshyysis the criteria for hydrogen cost was a 15 discount rate based on a 30 year analysis period which led to a 75 year payback period In this analysis the payback period was set to exactly 7 years (and the discount rate was not considered) If in this analysis the capital costs are reduced to match the previously reported capital costs ($11M $12M and $13M) and the payback period is extended from 7 to 75 years the cost for dispensed hydrogen (without including the cost of hydrogen production and delivery) is calculated as $1521 $823 and $590 for the 100 200 and 300 kgday stations respectively These costs are within 15 of the HRSAM values found in the previous analysis The differences in this case must all be attributed to the second cause of differshying assumptions on operation costs in this analysis method vs the HRSAM method This exercise shows that the economic assumptions in this analysis are in-line with the HRSAM assumptions albeit not exactly the same This exercise also demonstrates that solving for the hydrogen cost to match a payback periodndashas long as that payback period is less than the capital replacement interval on partsndashis a valid alternative to the discount rate analysis used in HRSAM
32 Conventional Station with Hydrogen Produced On-site via Steam Methane Reforming
The costs and revenue for a conventional assemble-on-site station with an on-site steam methane reformer to produce hydrogen are shown in Fig 10 with the installed costs and cost of hydrogen tabulated in Table 6 Inspection of the capital costs incurred in 2016 shows that the largest conshytributor is the SMR unit itself As discussed in Section 22 these SMR units are estimated to cost from just over $1M for a 100 kgday capacity to just under $25M for a 300 kgday capacity Usshying Fig 3 adding a $1M capital investment (depreciable) to a 100 kgday station will add nearly $10kg to the cost of hydrogen to make back that investment in 7 years But for the 100 kgday stashytion with on-site SMR the $3847kg cost of hydrogen is only about $8 higher than the $3053kg for the conventional station with delivered hydrogen The hydrogen cost is calculated based on
Table 6 Installed cost (which includes site preparation engishyneering amp design permitting capital and installation costs) and hydrogen cost for conventional stations with SMR on-site
capacity (kgday) installed cost ($) H2 cost ($kg)
100 $274M $3847 200 $383M $2596 300 $443M $2023
25
site
pre
p
75
station
capital
222
stationinstall 78
SMR c
ap
292
SM
R in
st
15
labor
51
SMR elec
12 natural gas
45 water
07
maintenance188
stat
ion
elec
tric
ity
15
-3000
-2000
-1000
0
1000
2000
3000co
st o
r re
ven
ue (
k$
yr)
tax
site preparationstation capitalstation installSMR capitalSMR install
laborSMR electricity
natural gaswater
maintenancestation electricity
revenue ($3847kg)net income
100 kgday
site
pre
p
55
statio
n
capita
l190
stationinstall 67
SMR c
ap
382
SM
R inst
11
labor
38 SMR elec
17 natural gas
67water
11
maintenance
139
stat
ion
elec
tricit
y
22
-4000
-3000
-2000
-1000
0
1000
2000
3000
4000
cost
or
reve
nu
e (
k$
yr)
tax
site preparationstation capitalstation installSMR capitalSMR install
laborSMR electricity
natural gaswater
maintenancestation electricity
revenue ($2596kg)net income
200 kgday
site
pre
p
47
statio
nca
pita
l182
stationinstall 64
SMR c
ap
395
SM
R in
st
09
labor
33
SMR elec
22
natural gas
86water
14
maintenance
119
stat
ion
elec
tricit
y
28
2020 2025 2030 2035year
-6000
-4000
-2000
0
2000
4000
6000
cost
or
reve
nu
e (
k$y
r)
tax
site preparationstation capitalstation installSMR capitalSMR install
laborSMR electricity
natural gaswater
maintenancestation electricity
revenue ($2023kg)net income
300 kgday
conventional SMR on-site
Figure 10 Cost and revenue associated with a conventional assemble-on-site station with on-site steam methane reforming produced hydrogen to break even at year 7 (2023) The net inshycome includes the effects from depreciation and taxes Capital replacement costs and intervals are not included in this model Pie charts on the right show the breakdown of cumulative capital and operating costs over the 7-year analysis period to the cost of disshypensed hydrogen
26
both capital and operating costs so we can conclude that the operating costs for the 100 kgday SMR are less than the operating costs for the 100 kgday delivered hydrogen station In addition to the common costs for labor station maintenance and station electricity the station with the SMR unit has a nominal operating cost for water for the SMR unit (nearly indistinguishable green bar) requires electricity and natural gas to run the unit (shown by the blue and black bars) and requires additional maintenance over the conventional station with delivered hydrogen (included in the red bar) Maintenance for the SMR unit is assumed to be $50kyear bringing total station maintenance costs to $100k yr However the sum of these costs is less than the cost to deliver and store censhytrally produced hydrogen for the 100 kgday station Operating costs for the SMR station neglect the inefficiencies in shutdownstartup cycles (or venting excess hydrogen) when production is not matched by demand which would further increase costs
The cost of hydrogen for the conventional 100 200 and 300 kgday stations with on-site SMR are $3847kg $2596kg and $2023kg These costs are 26 41 and 42 higher than the costs of hydrogen for a conventional station with delivered gaseous hydrogen As discussed the increased cost of hydrogen comes from the high capital costs for the on-site SMR units slightly offset by a reduced operating cost This can be seen by inspecting the pie charts on the right side of Fig 10 where the SMR capital costs is the largest contributor to the cost of hydrogen accounting for approximately 30-40 of the hydrogen cost For the 200 and 300 kgday stations the capital costs of $2M and $25M add approximately $10kg and $8kg While the operating costs for these stations are lower than the same capacity delivered hydrogen stations these differences fail to decrease the cost of hydrogen to the same level as the delivered hydrogen station Overall this analysis would suggest that while there may be some advantages to utilizing on-site SMR there is not much of a financial case to produce hydrogen on-site using steam methane reforming rather than having hydrogen delivered for 100-300 kgday hydrogen refueling stations unless the capital cost can be reduced significantly
A station with an on-site SMR unit could have a smaller footprint than a station with delivered hydrogen One potential layout is shown in Fig 11 By replacing the tube trailers with an SMR unit significantly less space is required for the fueling station components (compare to Fig 9) Since all hydrogen is produced on-site delivery routes can also be neglected from consideration and walls can enclose all of the hydrogen components reducing setback distances on all sides The SMR unit is shown as being housed in a 20 ft ISO container footprint although to produce 300 kgday it may be possible to have a smaller footprint and even smaller for the stations that only require 100 or 200 kgday For on-site SMR the fueling station components (eg compressor high pressure storage) take up relatively more space than the low pressure hydrogen source (because the SMR is much smaller than the two tube trailers) and laying out these components in a compact manner is important in space-constrained sites
33 Conventional Station with Hydrogen Produced On-site via Electrolysis
Conventional stations with on-site electrolysis have the costs and revenues shown in Fig 12 The installed capital costs and hydrogen costs at each of the three stations are tabulated in Table 7 Similar to the conventional station with a steam methane reforming unit on-site each of these
27
30 0
50 0
154 0
100
0
conveniencestore
dispenser island
compressor
high pressure storagegas panel
H2 chillerH2 cooling block
air compressorwater chiller
20 ft ISO container(electrolyzer or SMR)
Figure 11 Renderings of a conventional station layout with on-site production of hydrogen
28
site prep
72
stat
ion
capit
al
216
station
install 75
eleccapital 197
elec
install
14
elec
el
ectr
icity
177
wate
r02
lab
or
50
maintenance
182
stationelectricity
14
-3000
-2000
-1000
0
1000
2000
3000co
st o
r re
ven
ue (
k$
yr)
taxsite preparationstation capitalstation installelec capitalelec install
elec electricitywater
labormaintenance
station electricity
revenue ($3966kg)net income
100 kgday
site prep
54
stat
ion
capi
tal
186
statio
n
insta
ll65
eleccapital 221
elec
install11
elec
el
ectr
icit
y26
5
water
03
labor
37
maintenance
136
stationelectricity
21
-3000
-2000
-1000
0
1000
2000
3000
cost
or
reve
nu
e (
k$
yr)
taxsite preparationstation capitalstation installelec capitalelec install
elec electricitywater
labormaintenance
station electricity
revenue ($2651kg)net income
200 kgday
site prep44
stat
ion
capi
tal
170
stati
on
inst
all
59
elec
capital 224
elecinstall
09
elec
el
ectr
icit
y32
3
water
04
labor
30
maintenance
111
stationelectricity
26
2020 2025 2030 2035year
-4000
-3000
-2000
-1000
0
1000
2000
3000
4000
cost
or
reve
nu
e (
k$y
r)
taxsite preparationstation capitalstation installelec capitalelec install
elec electricitywater
labormaintenance
station electricity
revenue ($2174kg)net income
300 kgday
conventional electrolysis on-site
Figure 12 Cost and revenue associated with a conventional assemble-on-site station with on-site electrolysis produced hyshydrogen to break even at year 7 (2023) The net income includes the effects from depreciation and taxes Capital replacement costs and intervals are not included in this model Pie charts on the right show the breakdown of cumulative capital and operating costs over the 7-year analysis period to the cost of dispensed hydrogen
29
Table 7 Installed cost (which includes site preparation engishyneering amp design permitting capital and installation costs) and hydrogen cost for conventional stations with electrolysis on-site
capacity (kgday) installed cost ($) H2 cost ($kg)
100 $238M $3966 200 $298M $2651 300 $345M $2174
station designs has a large capital cost due to the electrolysis unit As discussed in Section 23 the electrolysis units cost approximately $800k $12M and $15M for 100 200 and 300 kgday capacities These capital investments will add approximately $8kg $6kg and $5kg to the cost of hydrogen over a conventional station assuming equivalent operating costs During operation there is a large cost associated with electricity to run the electrolysis unit (shown by the yellow bar) This cost scales with the amount of hydrogen produced and is a large factor in the station economics The pie charts on the right show that this electricity accounts for approximately 20-30 of the cost of hydrogen Other additional costs over the conventional delivered hydrogen station are the cost of water to run the electrolysis unit and additional maintenance on the electrolyzer (assumed to be $50k annually as with the SMR)
The electricity required for the electrolyzer costs approximately $300k $600k and $900k (for the 100 200 and 300 kgday stations) in 2036 where utilization has topped out at 80 Centrally produced delivered hydrogen by comparison as shown in Fig 8 costs around $300k $450k and $650k in 2036 with overall operating costs for the delivered hydrogen station (neglecting taxes) topping out at approximately $400k $600k and $800k In addition to the additional capital costs for the electrolyzer (and the other operational costs) it is clear that the economics of a station with an electrolyzer are challenging due to the high electricity consumption even when the electricity is from the current national grid mix with 13 renewable content10 Higher renewable content may further increase this cost component in the near term although fossil-fuel free electricity may become less expensive in the longer term
The cost of hydrogen for the conventional station with an electrolyzer is $3966kg $2651kg and $2174kg for the 100 200 and 300 kgday stations receptively These costs are on-par with the conventional station with SMR within $150kg for all three capacities The cost of hydrogen for a station with on-site production is significantly higher than for a station with delivered hydroshygen Besides improvements in electrical efficiency one strategy for minimizing operating costs is to only operate the electrolyzer at off-peak hours enabling the purchase of lower priced electricity However this might require oversizing the electrolyzer to produce enough hydrogen at off-peak hours to meet demand increasing the capital costs associated with the unit Another method is inshytentionally oversizing the electrolyzer to enable operation at a higher efficiency thereby reducing operating expenses
102015 estimate from httpwwweiagovtoolsfaqsfaqcfmid=92ampt=4
30
To estimate the impact of these methods of operation and aslo gain insight into less expensive renewable electricity costs in the future the model was run with the cost of electricity zeroed-out to calculate the lowest possible cost of hydrogen with cheap electricity In this scenario the cost of hydrogen is $3264kg $1949kg and $1472kg (for the 100 200 and 300 kgday stations) These costs are only slightly higher (by 3-7) than the conventional delivered hydrogen cost due to the capital investment in the electrolyzer and the remaining electrolyzer maintenance and water costs
A station with on-site electrolysis can also be represented by the layout shown in Fig 11 Housing the components necessary for alkaline electrolysis of 100-300 kgday hydrogen might be challenging in a 20 ft ISO container and the layout might need to be increased (to a 30 or 40 ft ISO container) For PEM electrolysis however the components should fit in the 20 ft ISO container and potentially smaller containers for the 100 or 200 kgday stations Similar to the reforming layout the hydrogen components fit in a much more compact space than for the conventional station with delivered hydrogen (shown in Fig 9) and the lot size is reduced
34 Modular Station with Delivered Centrally Produced Hydrogen
Figure 13 shows the cost revenue and income model for a modular station with delivered centrally produced hydrogen and an uninstalled modular unit cost of $15M The installed capital costs and hydrogen costs at each of the three capacity stations are tabulated in Table 8 Recall from Section 25 that the capital costs for modular stations do not follow the same trend as for build-on-site stations because modular stations come in discrete sizes Table 8 shows the installed capital and hydrogen costs for two cases of uninstalled modular station costs of $15M and $1M The only difference in costs between this scenario and the conventional station with delivered centrally produced hydrogen (see Table 5 and Fig 8) are in the capital costs While the installed capital costs including site preparation station capital and installation were $15M and $17M for the 100 and 200 kgday conventional stations it is $186M for all three capacities of the modular
Table 8 Installed cost (which includes site preparation engishyneering amp design permitting capital and installation costs) and hydrogen cost for modular stations with delivered hydrogen for two cases of uninstalled modular cost $15M and $10M
capacity uninstalled installed H2 cost (kgday) modular cost ($) cost ($) ($kg)
100 $15M $186M $3390 200 $15M $186M $1916 300 $15M $186M $1425 100 $1M $136M $2912 200 $1M $136M $1677 300 $1M $136M $1265
31
site
pre
p
85
stationcapital 423
statio
n
install
17d
elive
red
H2
294
labor
58
maintenance107
electricity
17
-2000
-1500
-1000
-500
0
500
1000
1500
2000co
st o
r re
ven
ue (
k$
yr)
tax
site preparationstation capitalstation install
delivered H2labor
maintenanceelectricity
revenue ($3390kg)net income
100 kgday
site
prep
75
station
capital 374
station
install15
delive
red
H2
360
labor
52
maintenance94
electricity
30
-2000
-1500
-1000
-500
0
500
1000
1500
2000
cost
or
reve
nu
e (
k$
yr)
tax
site preparationstation capitalstation install
delivered H2labor
maintenanceelectricity
revenue ($1916kg)net income
200 kgday
site
prep
67
station
capital336
stationinstall 13
del
iver
ed H2
413
labor
46
maintenance85
electricity
40
2020 2025 2030 2035year
-2000
-1500
-1000
-500
0
500
1000
1500
2000
cost
or
reve
nu
e (
k$y
r)
tax
site preparationstation capitalstation install
delivered H2labor
maintenanceelectricity
revenue ($1425kg)net income
300 kgday
modular station delivered hydrogen
Figure 13 Cost and revenue associated with a modular station with centrally produced delivered hydrogen to break even at year 7 (2023) assuming a $15M uninstalled capital cost of the modular station The net income includes the effects from depreciation and taxes Capital replacement costs and intervals are not included in this model Pie charts on the right show the breakdown of cumulashytive capital and operating costs over the 7-year analysis period to the cost of dispensed hydrogen
32
stations This capital investment for a 300 kgday modular station (including site preparation station capital and installation) is coincidentally the same as for a 300 kgday conventional station
If an estimate of $1M (as compared to the conservative estimate of $15M) for the uninstalled capital cost of the modular fueling station unit is used (note that this is still within the range of costs vendors estimated as described in Section 25) the cost of hydrogen will be $2912 $1677 and $1265 for the 100 200 and 300 kgday capacities respectively These costs are all lower than the cost of hydrogen at the equivalent capacity conventional stations As this technology matures and the installed capital cost of the modular units continues to decrease below the installed capital cost of the conventional stations it will make economic sense to site modular stations rather than assembling components on-site Parts standardization and the increased quality control that can be achieved by having modular station components may also lead to reduced maintenance requirements but that potential benefit is not included in this analysis
Figure 14 shows that a modular unit requires a slightly smaller installation area than the conshyventional station components shown in Fig 9 However the tube trailers acting as the hydrogen source and on-site storage still require significant space Similar to the conventional station with delivered hydrogen delivery routes must also be considered when siting a modular station with deshylivered hydrogen The hydrogen components are shown as being housed in a 20 ft ISO container although some 300 kgday modular stations are smaller than this While a slightly overall reduced footprint (relative to as drawn in Fig 14) could be realized we show this layout on the same lot as before Removing the need to store two 40-foot tube trailers by adding on-site low pressure storage could also drastically reduce the footprint by reducing the need to have an open wall for delivery A discussion of how the separation distances can be impacted and the footprints might be reduced due to fire-rated walls is included at the end of the Section 35
33
140
0
168 0
50 0
30 0
dispenser island
tube trailer
modular station(20 ft ISO)
conveniencestore
Figure 14 Renderings of a modular station layout with delivered hydrogen
34
35 Modular Station with Hydrogen Produced On-site via Electrolysis
The final configuration considered in this analysis is a modular station with an electrolysis unit attached to produce hydrogen The economics of this station design are shown in Fig 15 The installed capital costs and hydrogen costs at each of the three capacity stations with two different uninstalled modular unit costs are tabulated in Table 9 Similar to the results in the previous section the cost of hydrogen at the low volume modular electrolysis stations with an assumed $15M uninstalled modular station cost are higher than at the conventional electrolysis station counterpart We find that the cost of hydrogen at these modular stations with electrolysis produced hydrogen will be $4303kg $2730kg and $2173kg (for the 100 200 and 300 kgday stations) These costs are once again $337kg higher $079kg higher and the same (respectively) as the costs at the conventional stations with electrolysis produced hydrogen discussed in Section 33 This cost difference between the analogous conventional station is once again solely due to the differing capital cost of the installed modular station If the capital cost of the modular unit is $1M the hydrogen costs reduce to $3825 $2491 or $2013kg (for the 100 200 and 300 kgday stations) which are all lower than the cost at the similarly sized conventional stations with on-site electrolysis due to the lower installed station cost
Having on-site production using an electrolyzer and modular fueling station components only requires a small footprint for installation as shown in Fig 16 The ISO containers can house apshypropriate fire-rated barrier walls reducing separation distance for Group 1 and 2 exposures (except for air intakes) by half and eliminating separation distances for Group 3 exposures as described in Section 732312 of NFPA 2 The Hydrogen Technologies Code (2016) [10] Group 1 exshyposures are lot lines air intakes (HVAC compressors other) operable openings in buildings and structures and ignition sources such as open flames and welding Group 2 exposures are exshyposed persons (other than those servicing the system) and parked cars Group 3 exposures include buildings flammable gas storage hazardous materials storage ordinary combustibles horizontal distance to overhead electrical wire and piping containing other hazardous material This means
Table 9 Installed cost (which includes site preparation engishyneering amp design permitting capital and installation costs) and hydrogen cost for modular stations with on-site electrolysis proshyduced hydrogen for two cases of uninstalled modular cost $15M and $10M
capacity uninstalled installed H2 cost (kgday) modular cost ($) cost ($) ($kg)
100 $15M $274M $4303 200 $15M $314M $2730 300 $15M $345M $2173 100 $1M $224M $3825 200 $1M $264M $2491 300 $1M $295M $2013
35
site prep67
stat
ion
capit
al
333
stationinstall 13
eleccapital 181
elec
install
13
elec
el
ectr
icity
163
wate
r0
2
labor
46
maintenance
168
stationelectricity
13
-3000
-2000
-1000
0
1000
2000
3000co
st o
r re
ven
ue (
k$
yr)
taxsite preparationstation capitalstation installelec capitalelec install
elec electricitywater
labormaintenance
station electricity
revenue ($4303kg)net income
100 kgday
site prep53
stat
ion
capi
tal
263
station
install
11
eleccapital 214
elec
install11
elec
elec
tric
ity
257
water
03
lab
or
36
maintenance
132
stationelectricity
21
-4000
-3000
-2000
-1000
0
1000
2000
3000
4000
cost
or
reve
nu
e (
k$
yr)
taxsite preparationstation capitalstation installelec capitalelec install
elec electricitywater
labormaintenance
station electricity
revenue ($2730kg)net income
200 kgday
site prep44
stat
ion
capi
tal
220
stati
on
inst
all
09
elec
capital 224
elecinstall 09
elec
elec
tric
ity32
3
water
04
labor
30 maintenance
111
stationelectricity
26
2020 2025 2030 2035year
-4000
-3000
-2000
-1000
0
1000
2000
3000
4000
cost
or
reve
nu
e (
k$y
r)
taxsite preparationstation capitalstation installelec capitalelec install
elec electricitywater
labormaintenance
station electricity
revenue ($2173kg)net income
300 kgday
modular station electrolysis on-site
Figure 15 Cost and revenue associated with a modular station with on-site electrolysis produced hydrogen to break even at year 7 (2023) assuming a $15M uninstalled capital cost of the modular station The net income includes the effects from depreciation and taxes Capital replacement costs and intervals are not included in this model Pie charts on the right show the breakdown of cumulashytive capital and operating costs over the 7-year analysis period to the cost of dispensed hydrogen
36
electrolyzer(20 ft ISO)
modular station(20 ft ISO)
convenience store
dispenser island
100
0
100 0
17 0
Figure 16 Renderings of a modular station layout with an elecshytrolyzer for on-site production with a small reduced footprint
37
for a typical pipe diameter of 028rdquo and up to 15000 psi pressure (within the operating range of the cascade storage at a refueling station) air intakes must remain 34 ft from the containers while lot lines other building openings or ignition sources only need 17 ft of separation Exposed persons and parked cars must be 8 ft or more away from the containers and other exposures (including other combustibles like gasoline) do not need any separation from the containers This will allow a compact layout an example of which is shown in Fig 16
38
4 Conclusions
Five station designs were considered in this analysis with three capacities of each station deshysign With the current technology the lowest cost hydrogen source assessed here11 is tube-trailers delivering centrally produced gaseous hydrogen Shown in Table 10 or graphically in Fig 17 for either a conventional or modular station with a 300 kgday capacity and delivered hydrogen gas (using our conservative $15M cost estimate for the modular unit) it would cost approximately $186M to prepare the site and build the station and at a dispensed hydrogen cost of $1425kg a station operator would break even on their capital investments and operational costs in 7 years If the capital cost of the modular station unit is only $1M which is still in the range of cost estimates by manufacturers a modular station with delivered hydrogen would cost $136M to build and for a 300 kgday capacity hydrogen would cost $1265kg Embedded in all of these analyses is the utilization profile shown in Fig 2 which is the reason that the hydrogen cost increases as the cashypacity (and utilization) decreases for the modular stations with delivered hydrogen although they have the same installed cost
The specified 7-year return on investment results in higher cost hydrogen for smaller stations than for larger ones due to less throughput and higher capital cost per kg of capacity (see the lower left frame of Fig 17) If the SDO charges customers a price lower than this cost the result will be a longer return on investment Setting the same price regardless of station capacity will result in the 100 kgday station having the longest return on investment and the 300 kgday having the shortest
The addition of a steam methane reformer or an electrolyzer to a hydrogen refueling station increases the capital cost significantly with the steam methane reformer estimated to have the
11The cost of liquid delivery was not included in this analysis
Table 10 Installed cost (which includes site preparation engishyneering amp design permitting component capital and installation costs) and resulting hydrogen cost to break even at year 7 for the stations analyzed in this work
station capacity rarr 100 kgday 200 kgday 300 kgday
station type darr installed cost ($)
H2 cost ($kg)
installed cost ($)
H2 cost ($kg)
installed cost ($)
H2 cost ($kg)
conventional delivered H2 conventional SMR H2 conventional electrolysis H2 modular ($15M) delivered H2 modular ($1M) delivered H2 modular ($15M) electrolysis H2 modular ($1M) electrolysis H2
$151M $274M $238M $186M $136M $274M $224M
$3053 $3847 $3966 $3390 $2912 $4303 $3825
$169M $383M $298M $186M $136M $314M $264M
$1837 $2596 $2651 $1916 $1677 $2730 $2491
$186M $443M $345M $186M $136M $345M $295M
$1426 $2023 $2174 $1425 $1265 $2173 $2013
39
$00M$05M$10M$15M$20M$25M$30M$35M$40M$45M
inst
all
ed
cost
($)
capacity (kgday)
100 200 300
conv
ention
al d
eliv
ered
gas
conv
ention
al S
MR
conv
ention
al e
lect
roly
sis
mod
ular
($1
5M
) d
eliv
ered
gas
mod
ular
($1
M) d
eliv
ered
gas
mod
ular
($1
5M
) e
lect
roly
sis
mod
ular
($1
M) e
lect
roly
sis
$0k
$5k
$10k
$15k
$20k
$25k
$30k
inst
all
ed
cost
($[
kg
day]
)
conv
ention
al d
eliv
ered
gas
conv
ention
al S
MR
conv
ention
al e
lect
roly
sis
mod
ular
($1
5M
) d
eliv
ered
gas
mod
ular
($1
M) d
eliv
ered
gas
mod
ular
($1
5M
) e
lect
roly
sis
mod
ular
($1
M) e
lect
roly
sis
$0$5
$10$15$20$25$30$35$40$45
H2 c
ost
($k
g)
capacity (kgday)
100 200 300
Figure 17 Installed cost (which includes site preparation engishyneering amp design permitting component capital and installation costs) are shown in the left frames The top frame is the total inshyvestment in 2016$ while the bottom left frame is the installed cost per mass of hydrogen dispensed (kgday) The hydrogen cost to break even at year 7 is shown in the right frame for the stations analyzed in this work
40
highest capital cost On-site production does allow for a more compact station footprint and does not require consideration for tube-trailer delivery routes With current technology and projected utility prices operating a steam methane reformer costs slightly less than operating an electrolyzer These offsetting differences in capital vs operational costs causes the price of hydrogen to be very similar for a station with SMR produced hydrogen and electrolysis produced hydrogen In both cases the cost of hydrogen is $6-$10kg more for the stations that produce hydrogen on-site than the stations that have hydrogen delivered This analysis does not include the startup and shutdown inefficiencies (and associated costs) for either the SMR or electrolyzer The penalty for cycling a SMR is likely greater than for cycling an electrolyzer potentially giving an electrolyzer an economic advantage for on-site production
Electrolyzers also have the potential to produce less carbon dioxide than SMRrsquos By definishytion SMRrsquos require methane which contains carbon to produce hydrogen releasing the carbon molecules as carbon dioxide and contributing to climate change A reduced carbon footprint could be achieved by using bio-gas or implementing carbon capture and storage (although this would incur an efficiency penalty) Electrolyzers on the other hand require only electricity and water giving this technology the potential to be completely carbon free given the right source of elecshytricity such as solar wind hydroelectric or nuclear The key to making on-site production more cost competitive with delivered hydrogen is reducing the utility costs For electrolysis this can be achieved through efficiency improvements (although around 50-70 efficiencies are achieved with current technology) through the purchase of low cost off-peak electricity or by using elecshytricity generated behind the meter Of course reducing capital cost and maintenance requirements of on-site production units will also improve the economics of this technology
According to our research current modular fueling stations where components are assembled and tested at a central production facility have installed costs no higher than conventional stations Using our high estimate of $15M for the modular unit the installed cost of the 300 kgday modular station is nearly the same as for a 300 kgday conventional station Using a lower cost estimate of $1M for the modular unit the installed cost of a 100 kgday conventional station is 11 higher than the modular station With greater industry experience and higher volume production we would anticipate the cost of modular stations to reduce in the near-future Developing stations in this manner may lead to better quality control and reduced maintenance requirements for hydrogen fueling stations It is also possible to achieve more compact station footprints by modularizing the station components by building in appropriate fire-rated barrier walls Because of these potential benefits we anticipate modularization and standardization to increase in the future
This report details the economics of current hydrogen refueling stations and includes some sketches of potential layouts We have visually depicted the contributions to capital and operational costs of hydrogen for different station concepts making it easy to find the largest contributors to a high cost of hydrogen to the consumer This information can be used to devote research and development towards these high contributors At the station the dispenser compressors and chillers are expensive pieces where additional development or higher volume production could reduce station costs For electrolysis the purchase of low-priced electricity could serve to make on-site production cost competitive with central production and delivery This report enables the comparison of different station concepts that could be implemented in various market scenarios
41
A Piping amp Instrumentation Diagram
The following pages show the piping and instrumentation diagram for the included reference stations For the conventional stations all components need to be assembled on-site The dashed boxes show the components that are often modularized for the modular stations For reference the utility requirements shown in the PampID are also included here in Table A1
Table A1 Utility requirement estimateslowast for the stations in this report
capacity 100 kgday 200 kgday 300 kgday
compressor power electrolyzer power electrolyzer water SMR power SMR water SMR gas
25 kW 260 kW 110 lhr 16 kW 400 lhr 34 Nm3hr
60 kW 510 kW 220 lhr 33 kW 800 lhr 68 Nm3hr
100 kW 770 kW 330 lhr 49 kW 1200 lhr 101 Nm3hr
lowast These are averages based on manufacturer specifications and literature and are meant to give an estimate of site requirements For exact specifishycations to meet station requirements consult a manufacturer directly
42
ABCDEFGHIJK1
2
3
4
5
6
7
Measured Variable Readout of function Output Function ModifierA Air AlarmB Burner Storage Users Choice Users ChoiceC Compressor ClosedD DispenserE Electrolyzer Sensor (primary Element)F Flow FilterG Chiller Glass viewingH Hand HighI Current IndicatorJ PowerK Time Control StationL Level Light LowM Conductivity MiddleN Users Choice Users Choice Hydrogen Users ChoiceO Water Orifice restriction Air OpenP PressureQ QuantityR Reformer Record ReduceS Speed Frequency SwitchT Temperature TransmitU Multivariate Multifunction Multifunction MultifunctionV Vibration ValveW Weight Well WaterX Unclassified Unclassified Unclassified UnclassifiedY State RelayZ Position Actuator
PROCESS AND SIGNAL LINES
HYDROGEN PROCESS LINE
DEIONIZED WATER PROCESS LINE
PNEUMATIC SIGNAL LINE
NITROGEN SIGNAL LINE
ELECTRICAL SIGNAL LINE
SV
VALVES
BALL VALVE
NEEDLE VALVE
CHECK VALVE
SOLENOID VALVE
AIR ACTUATED VALVE SPRING RETURN CLOSE
PRESSURE REDUCING VALVE
TWO WAY PRESSURE RELIEF
THREE WAY PRESSURE RELIEF
EQUIPMENT
FILTER
PUMP
DRYER
HYDROGEN COMPRESSOR
STORAGE TANK
IR FLAME DETECTOR
Line Service Identification codesCCA-CLEAN COMPRESSED AIRCHW-CHILLED WATERH-HYDROGENN-NITROGEN
Pipe Specification Details3000PSI Min pressure rating of 3000 PSI 316316L austenitic stainless steel tubing UNS S31600 (316) UNS S31603 (316L)6500PSI Min pressure rating of 6500 PSI 316316L austenitic stainless steel tubing UNS S31600 (316) UNS S31603 (316L)15000PSI Min pressure rating of 15000 PSI 316316L austenitic stainless steel tubing UNS S31600 (316) UNS S31603 (316L)POLY Polyamide (Nylon) pneumatic tubing light and heat stabilized0032CU 0032 wall copper alloy 122 seamless tubingSCH40 Schedule 40 iron pipe
Line symbolsXrdquo-XXX-XXXX-XXX-XXX
Line size nominal inches
Service
Line Number (if assigned)
Pipe Spec
Insulation (if applicable)
Insulation codesF1- Soda-lime silicate glass (FOAMGLAS) 1 wall thicknessF2- Buna N Foam 38 thick
ABCDEFGHIJK1
2
3
4
5
6
7
CNH-300
HV-202HV-203
HV-201PT-300PI-300 HV-300
HV-301
Motor460-V 3Oslash SEE NOTE 1
Heater120-V 1Oslash 500 W
PT-202PI-202
34-H-VENT
1-frac14rdquo-CHW-800-SCH40
1-frac14rdquo-CHW-800-SCH40-F2
CW-800
GW-800
HV-202
HV-300
FV-100
ZSO-100
ZSC-100
ZI-100
FSV-100
ZZO-100
FSV-30038-H-3000PSI
38-H-5000PSI
38-H-5000PSI
38-H-15000PSI
34-H-VENT
OF-802TO COMMON frac34rdquo VENT MAST LOCATED ON BACK OF GMP
10 ABOVE GRADE
REFERENCE STATION 100-300 KGDAY
FF-300
GW-801
PI-101 PT-101
H2 Storage PBNH-402MAWP-15000 PSIG
H2 Storage PBNH-403MAWP-15000 PSIG
H2 Storage PBNH-401MAWP-15000 PSIG
FV-401
ZSO-401 ZSC-401
ZZO-401
FV-402
ZSO-402 ZSC-402
ZZO-402
FV-403
ZSO-403 ZSC-403
ZZO-403
FV-400
ZSO-400 ZSC-400
ZZO-400 GN-900
CHILLER 75-kW
DN-900JSS-901(EPO)
To EPO circuit
700-BAR NOZZLE
350-BAR NOZZLE
38-H-15000PSI
H70-T40H70-Warm
H35-T0
3570MPa DISPENSERWUN-900
FVControls Internal120V 1p 15A
GN-901
HEAT EXCHANGER1350 lbs
HV-901
H70-Cold
H2 Delivery Trailer multiple tubes one outlet
COH-100Air Compressor
PBAL-100
HV-100
AF-100
Air DryerAF-101
HV-900
PT-403PI-403
HV-403
PT-402PI-402
HV-402
PT-401PI-401
HV-401
HV-411
HV-412
HV-413
ZI-401
ZI-402
ZI-403
FV-101
ZSO-101 ZSC-101 ZI-101
ZZO-101
ZVO-100
ZVO-101
ZVO-900
ZVO-401
ZVO-400
ZVO-402
ZVO-403
RAH-100IR FLAME DETECTOR
AIMED AT HYDROGEN SOURCEAND ZONE 400
HIGH PRESSURE STORAGE
TO FIRE PANEL
RAH-900
IR FLAME DETECTORAIMED AT DISP HOSES
TO FIRE PANEL
HV-101
38-H-15000PSI
ZI-400
HV-400
FSV-200
EN-100ELECTROLYZER SKID
20 BAR (300 PSI) OUTPUT
RN-100STEAM METHANE REFORMER (SMR)
SKID13 BAR (200 PSI) OUTPUT
ZVO-102
Power460-V 3OslashSEE NOTE 1
Power460-V 3OslashSEE NOTE 1
ONLY ONE HYDROGEN SUPPLY OPTION IS USED PER STATION 1 TUBE TRAILER DELIVERY2 ON-SITE ELECTROLYSIS3 ON-SITE STEAM METHANE REFORMER
MUNICIPAL WATER SUPPLY
SEE NOTE 1
NATURAL GAS BIOGAS METHANE SUPPLY
SEE NOTE 1
NOTE 1 UTILITY REQUIREMENTS DEPEND ON STATION CAPACITY AND CAN BE ESTIMATED BASED ON THE FOLLOWING TABLESTATION CAPACITY 100 KGDAY 200 KGDAY 300 KGDAYELECTROLYZER POWER 260 KW 510 KW 770 KWELECTROLYZER WATER 110 LHR 220 LHR 330 LHRSMR POWER 16 KW 33 KW 49 KWSMR WATER 400 LHR 800 LHR 1200 LHRSMR GAS 34 NM3HR 68 NM3HR 101 NM3HRCOMPRESSOR POWER 25 KW 60 KW 100 KW
NOTE 2 ON-SITE PRODUCTION UNITS MAY INCORPORATE THEIR OWN INSTRUMENT AIR SYSTEM AND INTERCONNECTION WITH CSD SKIDCONTAINER MAY NOT BE NECESSARYNOTE 3 APPLIES TO MODULAR STATION ONLY A BUILD-ON-SITE STATION WILL NOT HAVE A SKID-OR CONTAINER-MOUNTED PRE-ASSEMBLED SYSTEMNOTE 4 IN SOME MODULAR STATIONS THE DISPENSER WILL BE A SEPARATELY-INSTALLED COMPONENTNOTE 5 IN MANY MODULAR STATIONS THE HEAT EXCHANGE EQUIPMENT WILL BE ROOF-MOUNTED
NOTE 2
COMPRESSION STORAGE AND DISPENSER (CSD) SKID OR CONTAINER BOUNDARY SEE NOTE 3
NOTE 4
NOTE 5
NOTE 5
PLCGas Control Cabinet
COMPRESSORMULTIPLE STAGES
References
[1] US Energy Information Administration EIA Open Data - Intro - US Energy Information Administration (EIA) accessed July 2016 httpwwweiagovopendata
[2] US DOE DOE H2A Production Analysis accessed May 2016 httpswwwhydrogen energygovh2a_productionhtml
[3] Joseph Pratt Danny Terlip Chris Ainscough Jennifer Kurtz and Amgad Elgowainy H2FIRST reference station design task Technical Report SAND2015-2660 R Sandia National Laboratories April 2015 Available at httpenergygoveerefuelcells h2first
[4] US DOE DOE H2A Delivery Analysis accessed May 2016 httpswwwhydrogen energygovh2a_deliveryhtml
[5] 2016 Annual Evaluation of Hydrogen Fuel Cell Electric Vehicle Deployment and Hydrogen Fuel Station Network Development Technical report California Environmental Protection Agency Air Resources Board July 2016 Available at httpswwwarbcagovmsprog zevproghydrogenhydrogenhtm
[6] E Sutherland and F Joseck Low volume production and delivery cost Technical Report 15011 Department of Energy Hydrogen and Fuel Cells Program Record 2015
[7] Ricardo Guerrero Lemus and Jose Manuel Martinez Duart Updated hydrogen production costs and parities for conventional and renewable technologies International Journal of Hydrogen Energy 35(9)3929ndash3936 2010
[8] Alfredo Ursua Luis M Gandia and Pablo Sanchis Hydrogen production from water elecshytrolysis current status and future trends Proceedings of the IEEE 100(2)410ndash426 2012
[9] G Parks R Boyd J Cornish and R Remick Hydrogen station compression storage and dispensing technical status and costs Systems integration Technical Report NRELBKshy6A10-58564 National Renewable Energy Laboratory (NREL) Golden CO May 2014
[10] NFPA 2 Hydrogen Technologies Code Technical report National Fire Protection Associashytion 2016
45
- Executive Summary
- Acknowledgment
- Contents
- Figures
- Tables
- 1 Introduction
-
- 11 Background and Contents
- 12 Approach
- 13 Method Overview
-
- 2 Station Cost Components
-
- 21 Centrally Produced Hydrogen and Delivery
- 22 Hydrogen Produced On-Site via Steam Methane Reforming
- 23 Hydrogen Produced On-Site via Electrolysis
- 24 Compression Storage and Ancillary Equipment for a Conventional Station
- 25 Packaged Compression Storage and Ancillary Equpiment for a Modular Station
- 26 Hydrogen Dispensers
-
- 3 Results Station Designs and Costs
-
- 31 Conventional Station with Delivered Centrally Produced Hydrogen
- 32 Conventional Station with Hydrogen Produced On-Site via Steam Methane Reforming
- 33 Conventional Station with Hydrogen Produced On-Site via Electrolysis
- 34 Modular Station with Delivered Centrally Produced Hydrogen
- 35 Modular Station with Hydrogen Produced On-Site via Electrolysis
-
- 4 Conclusions
- Appendix A Piping and Instrumentation Diagram
- References
-
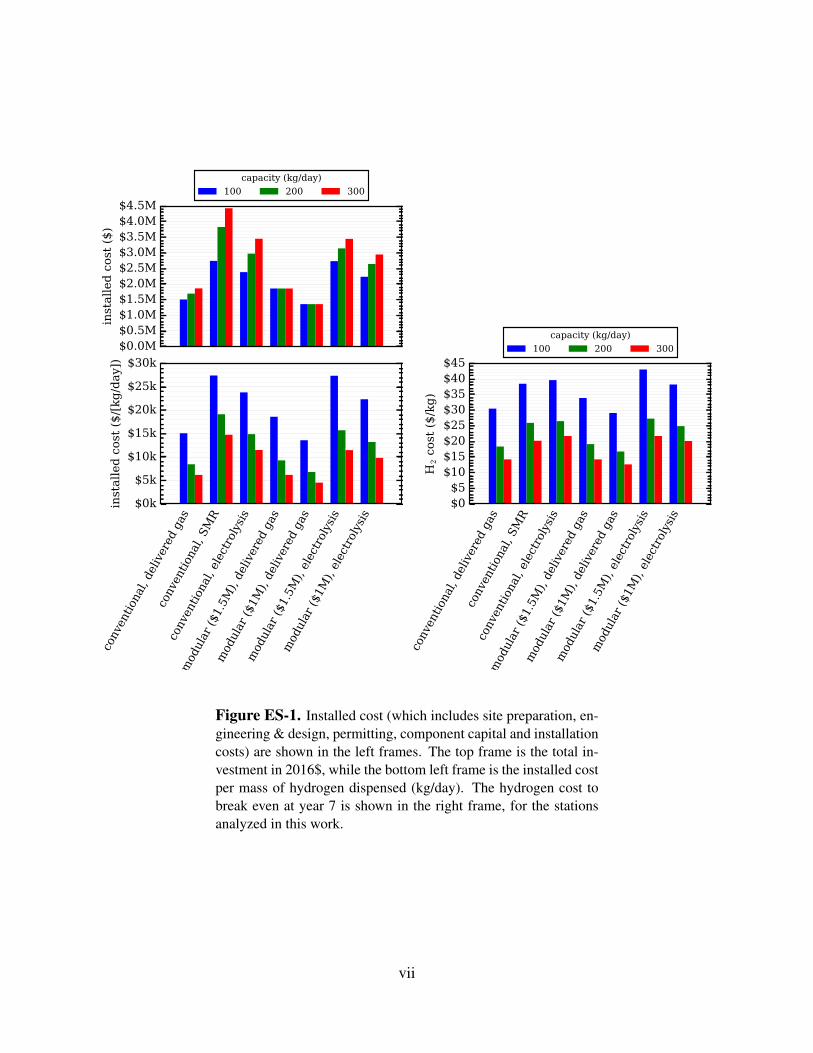
$00M$05M$10M$15M$20M$25M$30M$35M$40M$45M
inst
all
ed
cost
($)
capacity (kgday)
100 200 300
conv
ention
al d
eliv
ered
gas
conv
ention
al S
MR
conv
ention
al e
lect
roly
sis
mod
ular
($1
5M
) d
eliv
ered
gas
mod
ular
($1
M) d
eliv
ered
gas
mod
ular
($1
5M
) e
lect
roly
sis
mod
ular
($1
M) e
lect
roly
sis
$0k
$5k
$10k
$15k
$20k
$25k
$30k
inst
all
ed
cost
($[
kg
day]
)
conv
ention
al d
eliv
ered
gas
conv
ention
al S
MR
conv
ention
al e
lect
roly
sis
mod
ular
($1
5M
) d
eliv
ered
gas
mod
ular
($1
M) d
eliv
ered
gas
mod
ular
($1
5M
) e
lect
roly
sis
mod
ular
($1
M) e
lect
roly
sis
$0$5
$10$15$20$25$30$35$40$45
H2 c
ost
($k
g)
capacity (kgday)
100 200 300
Figure ES-1 Installed cost (which includes site preparation enshygineering amp design permitting component capital and installation costs) are shown in the left frames The top frame is the total inshyvestment in 2016$ while the bottom left frame is the installed cost per mass of hydrogen dispensed (kgday) The hydrogen cost to break even at year 7 is shown in the right frame for the stations analyzed in this work
vii
Table ES-1 Installed cost (which includes site preparation enshygineering amp design permitting component capital and installation costs) and resulting hydrogen cost to break even at year 7 for the stations analyzed in this work
station capacity rarr 100 kgday 200 kgday 300 kgday
station type darr installed cost ($)
H2 cost ($kg)
installed cost ($)
H2 cost ($kg)
installed cost ($)
H2 cost ($kg)
conventional delivered H2 conventional SMR H2 conventional electrolysis H2 modular ($15M) delivered H2 modular ($1M) delivered H2 modular ($15M) electrolysis H2 modular ($1M) electrolysis H2
$151M $274M $238M $186M $136M $274M $224M
$3053 $3847 $3966 $3390 $2912 $4303 $3825
$169M $383M $298M $186M $136M $314M $264M
$1837 $2596 $2651 $1916 $1677 $2730 $2491
$186M $443M $345M $186M $136M $345M $295M
$1426 $2023 $2174 $1425 $1265 $2173 $2013
ments Modular stations and stations with on-site production show a substantial decrease in overall required lot size due to reduced equipment size reduced truck access requirements and reduced setback distances The included piping and instrumentation diagram shows the system level reshyquirements for components and instruments and includes an estimate of utility requirements which are intended to be useful for site screening
This work details the economics of current hydrogen refueling stations and includes some sketches of what these fueling stations might look like It visually depicts the contributions to capital and operational costs of hydrogen for different station concepts making it easy to find the largest contributors to a high cost of hydrogen to the consumer This information can be used to devote research and development towards these high contributors At the station the dispenser compressors and chillers are expensive pieces where additional development or higher volume production could reduce station costs For electrolysis the purchase of low-priced electricity could serve to make on-site production cost competitive with central production and delivery This report enables the comparison of different station concepts that could be implemented in various market scenarios
viii
Acknowledgment
This work is funded by the US Department of Energy (DOE) Fuel Cell Technologies Office in the Office of Energy Efficiency and Renewable Energy
The Hydrogen Fueling Infrastructure Research and Station Technology Project (H2FIRST) is a DOE project executed by Sandia National Laboratories and the National Renewable Energy Labshyoratory The objective of H2FIRST is to ensure that fuel cell electric vehicle customers have a positive fueling experience relative to conventional gasolinediesel stations as vehicles are introshyduced (2015ndash2017) and transition to advanced refueling technology beyond 2017
DOEs Fuel Cell Technologies Office established H2FIRST directly in support of H2USA a public-private collaboration co-launched by DOE and industry in 2013 to address the key chalshylenges of hydrogen infrastructure
In addition to DOE the team wishes to thank the H2USA Hydrogen Fueling Station Working Group California Fuel Cell Partnership the California Energy Commission the California Air Reshysources Board and representatives from industry including H2 Logic Hydrogenics ITM Power Linde Nuvera PDC Machines Proton OnSite and Siemens AG for their input and support
ix
x
Contents
Executive Summary v 1 Introduction 1
11 Background and Contents 1 12 Approach 3 13 Method Overview 3
2 Station Cost Components 10 21 Centrally Produced Hydrogen and Delivery 10 22 Hydrogen Produced On-site via Steam Methane Reforming 13 23 Hydrogen Produced On-site via Electrolysis 14 24 Compression Storage and Ancillary Equipment for a Conventional Station 15 25 Packaged Compression Storage and Ancillary Equpiment for a Modular Station 17 26 Hydrogen Dispensers 18
3 Results Station Designs and Costs 19 31 Conventional Station with Delivered Centrally Produced Hydrogen 19 32 Conventional Station with Hydrogen Produced On-site via Steam Methane Reshy
forming 25 33 Conventional Station with Hydrogen Produced On-site via Electrolysis 27 34 Modular Station with Delivered Centrally Produced Hydrogen 31 35 Modular Station with Hydrogen Produced On-site via Electrolysis 35
4 Conclusions 39
Appendix
A Piping amp Instrumentation Diagram 42 References 45
Figures
ES-1 Installed cost (which includes site preparation engineering amp design permitting component capital and installation costs) are shown in the left frames The top frame is the total investment in 2016$ while the bottom left frame is the installed cost per mass of hydrogen dispensed (kgday) The hydrogen cost to break even at year 7 is shown in the right frame for the stations analyzed in this work vii
1 Historical and projected price of US No 2 Diesel (top) natural gas (middle) and electricity (bottom) from EIA data [1] 5
2 Utilization model from 2017 to 2036 of the theoretical hydrogen fueling stations in this report 6
xi
3 Additional cost of hydrogen given initial constructioncapital investment for the station utilization profile shown in Fig 2 Numbers on the graph lines are the years required to break even on the investment solid lines are for a depreciable asset (on a 7 year MACRS schedule) and dashed lines are for a non-depreciable asset Points on the plots are examples from the text 9
4 Breakdown of annual costs associated with delivery of hydrogen for a 100 (left) 200 (center) and 300 (right) kgday station Does not include the cost of hydrogen production or transport trailer 11
5 Cost for centralized production of hydrogen for the model used in this study and an H2A model (based on 380000 kgday production) [2] 12
6 Total costs associated with central production of hydrogen delivery and storage in a tube-trailer for a 100 (left) 200 (center) and 300 (right) kgday hydrogen refueling station 13
7 Annual production cost of 500 kgday hydrogen from distributed steam methane reforming as predicted by the current model and using the H2A production model 14
8 Cost and revenue associated with a conventional assemble-on-site station with centrally produced delivered hydrogen to break even at year 7 (2023) The net income includes the effects from depreciation and taxes Capital replacement costs and intervals are not included in this model (accuracy past 2023 is limited) Pie charts on the right show the breakdown of cumulative capital and operating costs over the 7-year analysis period to the cost of dispensed hydrogen 20
9 Renderings of a conventional station layout with delivered gaseous hydrogen 24
10 Cost and revenue associated with a conventional assemble-on-site station with on-site steam methane reforming produced hydrogen to break even at year 7 (2023) The net income includes the effects from depreciation and taxes Capital replaceshyment costs and intervals are not included in this model Pie charts on the right show the breakdown of cumulative capital and operating costs over the 7-year analysis period to the cost of dispensed hydrogen 26
11 Renderings of a conventional station layout with on-site production of hydrogen 28
12 Cost and revenue associated with a conventional assemble-on-site station with on-site electrolysis produced hydrogen to break even at year 7 (2023) The net income includes the effects from depreciation and taxes Capital replacement costs and intervals are not included in this model Pie charts on the right show the breakshydown of cumulative capital and operating costs over the 7-year analysis period to the cost of dispensed hydrogen 29
13 Cost and revenue associated with a modular station with centrally produced deshylivered hydrogen to break even at year 7 (2023) assuming a $15M uninstalled capital cost of the modular station The net income includes the effects from deshypreciation and taxes Capital replacement costs and intervals are not included in this model Pie charts on the right show the breakdown of cumulative capital and operating costs over the 7-year analysis period to the cost of dispensed hydrogen 32
14 Renderings of a modular station layout with delivered hydrogen 34
xii
15 Cost and revenue associated with a modular station with on-site electrolysis proshyduced hydrogen to break even at year 7 (2023) assuming a $15M uninstalled capital cost of the modular station The net income includes the effects from deshypreciation and taxes Capital replacement costs and intervals are not included in this model Pie charts on the right show the breakdown of cumulative capital and operating costs over the 7-year analysis period to the cost of dispensed hydrogen 36
16 Renderings of a modular station layout with an electrolyzer for on-site production with a small reduced footprint 37
17 Installed cost (which includes site preparation engineering amp design permitting component capital and installation costs) are shown in the left frames The top frame is the total investment in 2016$ while the bottom left frame is the installed cost per mass of hydrogen dispensed (kgday) The hydrogen cost to break even at year 7 is shown in the right frame for the stations analyzed in this work 40
Tables
ES-1 Installed cost (which includes site preparation engineering amp design permitting component capital and installation costs) and resulting hydrogen cost to break even at year 7 for the stations analyzed in this work viii
1 Economically favorable station designs from the Phase 1 Reference Station Design Task [3] that were fully analyzed 2
2 Water costs in various locations in California 6 3 Data used to calculate delivered hydrogen costs 11 4 Equipment needed for a conventional hydrogen fueling station and estimated costs
(inflation adjusted from [3] or reassessed as described in the text) 16 5 Installed cost (which includes site preparation engineering amp design permitting
capital and installation costs) and hydrogen cost for conventional stations with centrally produced delivered hydrogen 22
6 Installed cost (which includes site preparation engineering amp design permitting capital and installation costs) and hydrogen cost for conventional stations with SMR on-site 25
7 Installed cost (which includes site preparation engineering amp design permitting capital and installation costs) and hydrogen cost for conventional stations with electrolysis on-site 30
8 Installed cost (which includes site preparation engineering amp design permitting capital and installation costs) and hydrogen cost for modular stations with delivshyered hydrogen for two cases of uninstalled modular cost $15M and $10M 31
9 Installed cost (which includes site preparation engineering amp design permitting capital and installation costs) and hydrogen cost for modular stations with on-site electrolysis produced hydrogen for two cases of uninstalled modular cost $15M and $10M 35
xiii
10 Installed cost (which includes site preparation engineering amp design permitting component capital and installation costs) and resulting hydrogen cost to break even at year 7 for the stations analyzed in this work 39
A1 Utility requirement estimateslowast for the stations in this report 42
xiv
1 Introduction
The Hydrogen Fueling Infrastructure Research and Station Technology Project (H2FIRST) is a US Department of Energy (DOE) project executed by Sandia National Laboratories and the Nashytional Renewable Energy Laboratory The objective of H2FIRST is to ensure that fuel cell electric vehicle (FCEV) customers have a positive hydrogen fueling experience relative to conventional gasolinediesel fueling stations as FCEVs are introduced and to enable any needed transitions to advanced refueling technology in the future
For the wide-spread adoption of fuel cell electric vehicles (FCEVs) additional fueling stations need to be constructed in the US This work provides economic analyses and layouts of current-technology fueling station designs that utilize state-of-the-art components These reference station designs can help reduce the cost and speed the deployment of hydrogen stations by providing a common baseline with which to start a design enable quick assessment of the suitability of a particular site for a hydrogen station and identify contributors to poor economics and areas of research needed for certain station designs
This work is intended to address the needs of a wide variety of stakeholders Some examples of stakeholders and applicability include
bull Station developersoperators (SDOs) quick evaluation of potential sites and needs lower investment risk general cost and return estimates
bull Local authorities understand devices components in a typical station bull Code developers understand near-term needs for code refinement bull Other analysis groups new tool and baseline for economic studies bull Businessesentrepreneurs and RampD organizations identification of near-term business
solution and technology needs bull Local municipalities and the general public high-level understanding of typical stations
lowering acceptance risk bull Funding and financing organizations understanding of current technological capabilities
costs and market needs
11 Background and Contents
This is a follow-on work to the Phase 1 Reference Station Design Task [3] That work screened 160 different station permutations and found 4 near-term station designs that were economically favorable and one future station The report provides thorough designs of these stations with bills of materials layouts on greenfields and co-located with gasoline stations and piping and instrumentation diagrams The resulting capital and hydrogen costs for the selected stations in that analysis are reprinted here in Table 1
However the cost of the hydrogen was not included in the analysis only the capital and opshyerating costs associated with the fueling station (ie compression high-pressure storage cooling and dispensing) In addition the Phase 1 Reference Station project did not consider on-site hyshy
1
Table 1 Economically favorable station designs from the Phase 1 Reference Station Design Task [3] that were fully analyzed
Target Market
Delivery Method
Daily Capacity (kgday)
Maximum Consecutive Fills
Hoses Hydrogen Costlowast
($kg)
Capital Cost (2009$)
high use high use
liquid liquid
300 300
5 5
2 2
$746dagger
ndash $1486557dagger
$2007358Dagger
high use low use
gas gas
300 200
6 3
1 1
$603 $782sect
$1251270 $1097560sect
intermittent gas 100 2 1 $1328 $954799 lowast Hydrogen cost in this table is only the station contribution to the cost of hydrogen and does not
include the cost of hydrogen delivered to the station dagger Costs for this future station assume a high-pressure evaporator and cryopump which are not curshy
rently commercially available Dagger Consistent capital cost for a hydrogen fueling station that has hydrogen delivered as a liquid using
currently available technology but the cost of hydrogen could not be calculated using HRSAM [4] sect A typography error in the first report has been corrected for the hydrogen and capital cost of this
200 kgday station
drogen generation nor the impacts of lsquomodularrsquo stations where most components are pre-packaged in an assembly plant potentially reducing footprint and cost compared to traditional build-on-site stations
This work builds on the Phase 1 Reference Station work by producing designs and economic analyses of modular stations and stations utilizing on-site generation It also re-evaluates one traditional design from the Phase 1 Reference Station work to enable equal comparisons between all station types in the two works
In this report we describe many facets of designing hydrogen fueling stations In Section 12 Approach the station concepts are described In Section 13 Method Overview the steps to buildshying a fueling station are outlined the sources of economic data needed to calculate station operating costs are reported along with the station utilization profiles The Method Overview section is inshytended for readers who are interested in the assumptions and data used to determine the cost of hydrogen as the economic model is detailed in this section In Section 2 Station Cost Composhynents further details of the economic assumptions made about specific pieces of hydrogen fueling stations are included An experienced SDO may wish to skip to Section 3 Results Station Deshysigns and Costs which contains the detailed results of the economic model and includes sketches of hydrogen fueling stations
The wide variety of stakeholders on hydrogen refueling infrastructure and their interests means that some parts of the report will be more useful than others to different readers Rather than trying to simplify the report for one audience at the expense of another it is inclusive of all assumptions data and methods so that the reference stations described in this report can serve as a starting point for designs of real-world stations
2
12 Approach
In this work along with the costs associated with constructing and operating a hydrogen fueling station we also consider the costs of producing hydrogen on-site or having hydrogen produced at a centralized facility and delivered We also compare lsquoconventionalrsquo stations where parts (eg compressors tubing valves tanks) are assembled at the fueling station site to lsquomodularrsquo stations where parts (at least the compression and high-pressure storage if not the dispenser) are assembled at a centralized facility into a single unit and delivered to the fueling station site on a skid or in a trailer Five station concepts are considered herein
bull Conventional (assemble-on-site) stations with hydrogen 1 delivered as compressed gas from a centralized already operational production facility
(baseline) 2 produced on-site through steam methane reforming (SMR) 3 produced on-site through electrolysis
bull Modular fueling stations with hydrogen 4 delivered as compressed gas from a centralized production facility 5 produced on-site through electrolysis
For each of these concepts 100 200 and 300 kgday stations are studied since these capacities are appropriate for current and near-term station builds as identified in the Phase 1 Reference Station Design report [3] Costs (capital and operating) for each of these stations were estimated and the cost of hydrogen1 was calculated Components needed for each of these station concepts are specified and potential layouts are presented
13 Method Overview
Building a hydrogen fueling station requires several steps (which have associated costs andor considerations)
1 Identification and acquisition of land where the station can be built 2 Design of the station to account for the available space If hydrogen is to be delivered
delivery routes for the large tube-trailers must be planned 3 Design of utility connections including electrical power potentially water andor natural
gas bull Both conventional and modular stations require electrical power for the compressor
and chiller Trenching and conduit must be run transformers and electrical panels often require upgradingreplacement
bull On-site electrolysis requires a water supply (in addition to sufficient electrical power)
1In this work we refer to the cost of hydrogen rather than the price Using the method and assumptions described herein we calculate a per kg cost to a station developeroperator to provide hydrogen to consumers Station operators will be responsible for setting prices at their station which is what end consumers will pay for hydrogen and will vary based on local market demand profit margins retail fuel taxes and other considerations none of which are considered in this work The cost of hydrogen could be considered a lsquofixed minimum selling pricersquo to meet the payback criteria assumed in this analysis
3
bull On-site SMR requires water and natural gas (and sufficient electrical power) 4 Permitting and approval of the site design with the authorities having jurisdiction 5 Preparation of the site for station installation For a conventional station a concrete pad is
required and for modular stations concrete footings are needed at a minimum on which to secure the components or modular housing This concrete must be properly grounded and have a low electrical resistance to meet the fire code
6 Installation of the fueling station
In this analysis the costs of land procurement (step 1) are neglected Some costs in this analysis are based on the H2A Refueling Station Analysis Model (HRSAM) [4] In HRSAM the cost of installation of equipment (step 6) is 35 of the raw capital investment and the cost of site preparation engineering amp design project contingency and upfront permitting costs (steps 2-5) are 31 of the raw capital costs Accordingly here installation was assumed to cost 35 of the station capital for the conventional stations However since many of the modular installation costs are tied into the cost of the unit the cost of modular station installation is reduced to a flat cost of $60k (the details of this assumption can be found in Section 25) Also rather than using the percentage (31) for site preparation engineering amp design project contingency and upfront permitting costs in this analysis we assume a flat $300k for these costs This reflects the fact that these costs are linked more to the site itself rather than the cost and size of the equipment that must be installed on the site Since there is considerable variability in design permitting and site preparation costs we include additional analysis and charts showing how variability in these costs can change the cost of dispensed hydrogen later in this section
For all stations capital costs of the equipment were estimated Bills of materials for the conshyventional stations were assembled in the Phase 1 Reference Station Design Report [3] In this work we have updated these bills of material to estimate the cost of a conventional station today (2016) Capital costs for modular stations and modular hydrogen production units were based on discussions with several manufacturers For both the conventional and modular stations the design includes a single dispenser (ie credit card readeruser interface valving hose and nozshyzle to connect to the vehicle) able to dispense both 350 and 700 bar hydrogen located separately from the lsquostationrsquo (that contains the compressor high-pressure storage chiller programmable logic controller and safety equipment) Costs for specific components (eg compressors SMRs) are discussed in Section 2
In order to evaluate the operation costs the cost of several utilities and commodities namely diesel fuel natural gas electricity and water were needed With the exception of water these costs were estimated using pricing data from the US Energy Information Administration (EIA) [1] As shown in Fig 1 both historical and projected prices were extracted from the EIA database The data in the plots comes from the following series
bull Diesel ndash US No 2 Diesel Retail Prices Annual ndash Nominal Petroleum Prices Transportation Diesel Fuel Reference AEO2015
bull Natural gas ndash Retail Price of Natural Gas in Commercial Sector US Average Annual ndash Energy Prices Nominal Commercial Natural Gas United States Reference ndash Retail Price of Natural Gas in Industrial Sector US Average Annual
4
123456789
10
pri
ce (
nom
inal
$g
al)
diesel
0
5
10
15
20
25p
rice
(n
om
inal
$f
t3)
natural gas
commercial
industrial
1990 2000 2010 2020 2030 2040year
010
015
020
pri
ce (
nom
inal
$k
Wh
)
commercial electricity
Figure 1 Historical and projected price of US No 2 Diesel (top) natural gas (middle) and electricity (bottom) from EIA data [1]
ndash Energy Prices Nominal Industrial Natural Gas United States Reference AEO2015 bull Commercial electricity (US grid mix currently 13 renewable2)
ndash Retail Price of Electricity in Commercial Sector US Average Annual ndash Energy Prices Nominal Commercial Electricity United States Reference AEO2015
In all cases these data project out to 2045
It should be noted that the electricity prices estimated by EIA and used in this work assume status-quo reliance on fossil fuel In fact further cost reductions in renewable electricity generation
22015 estimate from httpwwweiagovtoolsfaqsfaqcfmid=92ampt=4
5
Table 2 Water costs in various locations in California
Location Price ($100 ft3) source
East Bay Los Angeles San Diego San Jose San Francisco San Francisco Peninsula
444 1022-10409 502 4509 714 7-8
ebmudcom dpwlacountygov sandiegogov sjwatercom sfwaterorg midpeninsulawaterorg
2020 2025 2030 2035year
0
20
40
60
80
100
uti
liza
tion
(
)
Figure 2 Utilization model from 2017 to 2036 of the theoretical hydrogen fueling stations in this report
technologies and utilization of low-cost stranded assets such as large nuclear coupled with increasshying fossil fuel costs may actually result in the opposite trend of future electricity rates As will be seen in the results variability in electricity rates can have a large impact on the cost effectiveness of on-site generation of hydrogen via electrolysis
Water is needed for electrolysis or steam methane reforming Water rates were estimated to be $8 per hundred cubic feet in 2016$ based on information from various sources of relevance to the California market shown in Table 2 While water rates can vary dramatically around the country as will be seen in the results the cost of water has a negligible impact on the resulting cost of hydrogen so using the California rates was deemed an acceptable approximation
In order to use this cost information to calculate operational costs and revenues a station utishylization rate must also be specified The same utilization profile used in Phase 1 of the Reference Station project [3] was used herein except the profile ramp has a delayed start as is suggested by a recent analysis by the California Air Resources Board [5] This profile is shown in Fig 2 As shown this utilization model estimates that starting in 2017 5 of station capacity will be utilized As the number of fuel cell vehicles on the roads continues to increase the utilization of stations is
6
projected to increase up to a maximum of 80 in 2026 This means for example that in 2026 and in perpetuity after a station sized for 100 kgday will sell on average 80 kgday hydrogen
Site preparation capital installation and operating costs were combined with hydrogen throughshyput and a required break-even time period on the initial investment to determine the overall cost of hydrogen to the SDO The estimates for these cost components are based on best-available inforshymation including consultation with station and equipment providers prior studies and government entities involved in publicly-funded stations However in most cases the estimated costs are avshyerages and can vary in practicendashfor example site preparation costs can vary widely or different manufacturers will have different costs for equipment with similar specifications If the reader has actual cost information that varies from that which is estimated in this report Fig 3 can be used to calculate the resulting change in hydrogen cost
Figure 3 shows the cost of hydrogen as a function of the initial non-depreciable cost by the dashed lines (eg land purchase costs) and an initial depreciable cost (eg equipment) by the solid lines Depreciation was estimated using a 7-year Modified Accelerated Cost Recovery System (MACRS) depreciation rate and an overall tax rate of 389 (35 federal and 6 state tax) the rate specified in HRSAM [4] The numbers and different colors in the plot represent the numbers of years required to make back the cost of the asset For example if one were to purchase land (which is non-depreciable) for $200k to make back that investment in 7 years the cost of hydrogen would be approximately $3kg higher than without the purchase for a 100 kgday station or about $1kg higher for a 300 kgday station (note that this assumes the stations are utilized at the rate shown in Fig 2) As a second example if a $1M electrolyzer were aded to a station (a depreciable investment) it would add $957kg for hydrogen to pay for that asset for a 100 kgday station and just over $3kg for a 300 kgday station (Note that the costs scale inversely with capacity because the same percentage station utilization rate shown in Fig 2 is used in this analysis In other words we assume that customers at the 100 kgday station are purchasing exactly 13 the hydrogen as at the 300 kgday station)
7
00 05 10 15
investment cost (M$)
0
2
4
6
8
10ad
dit
ion
al
H2 c
ost
($k
g)
55
7
7
11
11
13
13
100 kgday
(a) Additional cost of hydrogen for a 100 kgday station
00 05 10 15
investment cost (M$)
0
2
4
6
8
10
ad
dit
ion
al
H2 c
ost
($
kg
)
55 7
711
11
13
13
200 kgday
(b) Additional cost of hydrogen for a 200 kgday station
8
00 05 10 15
investment cost (M$)
0
2
4
6
8
10
ad
dit
ion
al
H2 c
ost
($k
g)
5
5 7
711
11
13
13
300 kgday
(c) Additional cost of hydrogen for a 300 kgday station
Figure 3 Additional cost of hydrogen given initial construcshytioncapital investment for the station utilization profile shown in Fig 2 Numbers on the graph lines are the years required to break even on the investment solid lines are for a depreciable asset (on a 7 year MACRS schedule) and dashed lines are for a non-depreciable asset Points on the plots are examples from the text
9
2 Station Cost Components
This section describes the primary contributors to the cost of hydrogen
bull Centrally Produced Hydrogen and Delivery bull Hydrogen Produced On-site via Steam Methane Reforming bull Hydrogen Produced On-site via Electrolysis bull Compression Storage and Ancillary Equipment for a Conventional Station bull Packaged Compression Storage and Ancillary Equpiment for a Modular Station bull Hydrogen Dispensers
Each subsection describes the technical details of the components and the rational for the assumed costs in the economic model
21 Centrally Produced Hydrogen and Delivery
For delivered hydrogen we included the cost of buying hydrogen from a centrally located production facility delivering it in tube-trailers and leasing tube-trailers for storage at the fueling station Initially the H2A Delivery Scenario Analysis Model (HDSAM) [4] was evaluated for its applicability to this project but this model did not have enough flexibility in its scenarios In this analysis we wanted to consider a single station and not consider savings from multiple station deliveries due to tractortrailer sharing In this analysis we did not model the cost of tractortrailer purchase and payment but rather considered a very early market scenario (ie the current market conditions) where the industrial gas company would own and control the delivery tractors and lease the tube-trailers to the station owners (assuming that they are left on-site until empty) Some of the data from HDSAM was used in this analysis including some parameters shown in Table 3 The delivery distance was assumed to be 200 miles so that delivered hydrogen costs could be compared to estimates from industrial gas companies [6] The trailers were assumed to have 300 kg of usable hydrogen There are some jumbo high-capacity tube-trailers in the market with closer to 1100 kg usable hydrogen3 but for these current market scenario simulations we assumed more conventional tube trailers with steel tubes and the smaller capacity With a 300 kg usable H2 capacity the utilization scenario shown in Fig 2 and a given station capacity were used to calculate the time to consume a tube-trailer The trips per year were calculated and fuel labor and other costs for delivering hydrogen were calculated Frequent deliveries of hydrogen would be necessary and it is likely that a fueling station would need to have multiple tube-trailers on site to ameliorate outages Especially for the 300 kgday station as the peak nameplate capacity is approached it may become infeasible to get daily tube-trailer deliveries and another type of hydrogen storage (ie liquid) or some on-site production would probably be required Nonetheless we performed the analysis with the assumption that the industrial gas companies would be able to provide near daily deliveries of tube-trailers in the out-years
Figure 4 shows the costs components associated with delivering tube trailers to a single station Because each station is assumed to follow the same utilization projections the costs follow the
3httpwwwthe-linde-groupcomennews_and_mediapress_releasesnews_20130925html
10
Table 3 Data used to calculate delivered hydrogen costs
description value
average delivery gas mileage1 6 mpg average delivery speed1 378 mph tube-trailer capacity2 300 kg tube-trailer maximum pressure2 250 bar delivery labor cost1 2121 $hr overhead on labor1 20 insurance cost1 $0106 mile licensing amp permits1 $0116 mile maintenance cost1 $0078 mile lease price3 $3500 month
1 data from HDSAM [4] 2 data from energygov
3 data from personal communications
2020 2025 2030 2035year
050
100150200250300350
deli
very
cost
(k$y
r)
diesellabor
insurancemaintenance
permitting
2020 2025 2030 2035year
diesellabor
insurancemaintenance
permitting
2020 2025 2030 2035year
diesellabor
insurancemaintenance
permitting
Figure 4 Breakdown of annual costs associated with delivery of hydrogen for a 100 (left) 200 (center) and 300 (right) kgday stashytion Does not include the cost of hydrogen production or transport trailer
11
2010
2015
2020
2025
2030
2035
2040
2045
2050
year
1
2
3
4
5
6
7
cost
(n
om
inal
$k
g)
centralized H2 production
current model (commercial NG)
H2A production
current model (industrial NG)
Figure 5 Cost for centralized production of hydrogen for the model used in this study and an H2A model (based on 380000 kgday production) [2]
same increasing trend out to 2026 The continued increase past 2026 is due to inflation which is estimated at 194 and the increasing cost of diesel fuel (Fig 1) This chart shows that labor is the largest contributor to hydrogen delivery costs followed by the cost of diesel to fuel the delivery truck All of these delivery costs scale proportionally if the delivery distance were to be smaller or larger than 200 miles The costs also scale proportionally with the nameplate capacity because the utilization scales with the nameplate capacity causing the larger stations to require proportionately more deliveries labor maintenance etc
Along with delivery costs in this analysis we also include the cost of the centrally produced hydrogen The cost of centrally produced hydrogen was estimated using a correlation from Lemus and Duart [7] Because the central hydrogen production plants that exist today make hydrogen from steam-methane reforming they found that production was linearly dependent on the price of natural gas
H2production cost = 12 middot NGprice + 6
where the cost and price are in $GJ Using the pricing data shown in Fig 1 this centrally produced hydrogen cost was calculated The DOErsquos H2A production model (version 301) [2] is compared to this calculation in Fig 5 using both commercial and industrial costs for natural gas As shown the Lemus and Duart model agrees quite well with the H2A production model until about 2042 Thus the commercial natural gas price was selected for use in further calculations of the costs associated with hydrogen production for conventional delivered hydrogen stations
Finally for delivered centrally produced hydrogen the cost of the tube trailer lease was inshycluded Shown in Table 3 the lease price was estimated at $3500 per month We assumed in
4Inflation rate taken from HRSAM [4]
12
2020 2025 2030 2035year
0100200300400500600700
deli
vere
d H
2 c
ost
(k$y
r)cent productiontube trailer lease
delivery
2020 2025 2030 2035year
cent productiontube trailer lease
delivery
2020 2025 2030 2035year
cent productiontube trailer lease
delivery
Figure 6 Total costs associated with central production of hyshydrogen delivery and storage in a tube-trailer for a 100 (left) 200 (center) and 300 (right) kgday hydrogen refueling station
this analysis that the stations would continually lease 2 tube trailers at $7000 per month so there would be no outages as the empty hydrogen tube trailers were exchanged We assumed that the lease cost was not affected by the number of deliveries required Figure 6 shows the total costs associated with delivered centrally produced hydrogen Within the red delivery bar are all of the costs shown in Fig 4 All three of the costs broken out in the plot (central production tube-trailer leasing and delivery) are significant contributors to the cost of centrally produced delivered hyshydrogen As shown the cost of the tube-trailer lease was fixed in this model for any station capacity resulting in a smaller percentage of the costs for 200 and 300 kgday stations This is far from a certain assumption The high lease price might cause a station operator to think about purchasing a tube-trailer (or fleet of tube-trailers) but the estimated cost of a tube trailer within HDSAM [4] is around $1 million At least two trailers would be required unless the station were shutdown while the tube trailers were being refilled so purchase might not make financial sense without an adshyvanced network of stations andor a long-term financial horizon An additional option to eliminate the trailer lease expense is to install a similar amount of low pressure hydrogen storage on site allowing the trailer to discharge its contents and depart This would add several hundred thousand dollars of capital cost to the station (depending on the amount and type of storage installed)
22 Hydrogen Produced On-site via Steam Methane Reforming
Cost information for on-site reformers was gathered from several manufacturers An estimate for capital cost is $115M for a 100 kgday unit $204M for a 200 kgday unit and $246M for a 300 kgday unit A functional fit was found to several data points including the H2A production model [2] capital cost for a 1500 kgH2day unit which is $325M As with most products the per kg cost of production reduces as the production rate increases
Feedstock consumption rates were also collected from manufacturers for several on-site reshyforming units Based on this information assumed rates of 39 kWhkgH2 96 lH2OkgH2 and 35
13
2010 2015 2020 2025 2030year
0
100000
200000
300000
400000
500000
600000
700000
800000
H2 p
rod
uct
ion
cost
($
)current model
H2A production
Figure 7 Annual production cost of 500 kgday hydrogen from distributed steam methane reforming as predicted by the current model and using the H2A production model
kgNGkgH2 were used to estimate operating costs The operating costs for the H2A production model for distributed SMR scaled down to 500 kgday [2] was compared to the operating costs calculated using the current model (using the cost information shown in Fig 1 and the commershycial price of natural gas) This comparison is shown in Fig 7 The annual operating costs of the current model which is based on recent manufacturer information are within 20 of the H2A model predictions
One factor that is not taken into account in this analysis is startup and shutdown production efficiencies and losses Because SMRs operate at high temperature start-up is slow and frequent shutdownstartup cycles can drastically reduce production efficiency It may be cheaper to simply produce and vent hydrogen continuously rather than cycling the unit off and back on The addishytional cost of running the SMR when it is not needed is not included in this analysis it is assumed that this process occurs instantaneously and without an efficiency penalty The impact of this assumption is that the operational costs of the SMR may be under-predicted by this model
23 Hydrogen Produced On-site via Electrolysis
The two most common type of electrolysis units on the market today are polymer electrolyte membrane (PEM) and alkaline PEM electrolysis units use the same technology as PEM fuel cells (which are found in vehicles) but the cells are biased and protons move in the opposite direction from a fuel cell Alkaline fuel cells have a liquid electrolyte solution that serves to transport ions from the electrodes Alkaline electrolyzers are a more mature technology can be cheaper and may have a longer lifetime than PEM electrolyzers but PEM electrolyzers produce higher purity hydrogen with less sensitivity to water purity are smaller can respond more quickly to changes in production rate and can produce hydrogen at pressure reducing compression needs In this
14
analysis we are not specifying the type of electrolyzer since costs (which are not precisely quoted in any case) are reasonably similar
Electrolyzer electricity consumption was estimated to be 56 kW-hrm3 = 624 kW-hrkgH2H2 There is some variability in electricity consumption depending on each manufacturerrsquos equipment but this value is in line with an analysis by Ursua et al [8] and is the average value from the Electrolyzer Energy composite data product (CDP)5 from NREL The municipal water consumpshytion was calculated as just under 3-times the stoichiometric value required based on the reacshytion (H2O rarr H2 + 12O2) (which accounts for purification system losses and other cooling water needs) at 264 lH2OkgH2 An informal survey of several companies led to capital cost estimates of $800k $12M and $15M for the 100 200 and 300 kgday stations These capital costs are lower than the SMR capital costs used in this analysis for an equivalent hydrogen production capacity For the modular electrolyzer units considered herein the installation cost was assumed to be a flat $60k regardless of the hydrogen production capacity an estimate based on discussions from several companies
Similar to the SMR the efficiency penalty for shutting down the unit and restarting it is not taken into account in this analysis This inefficiency is expected to be lower for electrolysis than SMR since the operation temperatures are much lower and the startup process is simpler Nonetheshyless there will be an efficiency penalty for cycling the electrolyzer off and back on so the elecshytrolyzer and storage sizes need to be optimized for the station utilization rates during station design
24 Compression Storage and Ancillary Equipment for a Conventional Stashytion
For conventional stations most equipment costs from Phase 1 of the reference station design report [3] were used in this analysis Shown in Table 4 costs for all but the compressor dispenser and chillercooling block were inflation adjusted from 2009$ to 2016$ at a 19 inflation rate The cost of the compressor was not simply inflated but rather re-estimated using the compressor size evaluated by HRSAM [4] and Fig 2 from the Phase 1 Reference Station Design report [3] The $100kndash$150k capital cost estimates for the compressors given in the first report were based on a specific station design with a smaller compressor rather than the compressor sizing evaluated by HRSAM The HRSAM estimates for compressor needs for the 100 200 and 300 kgday stations are 6 14 and 23 kghr as shown in the table Compressor energy consumption was assumed to be 42 kWhrkgH2 This is consistent with NRELrsquos Compressor Energy CDP6 and manufacturer specifications This factor was used to calculate the energy utilization and size the compressors at 25 60 and 100 kW for the 100 200 and 300 kgday stations respectively The electrical requirements are a bit more than those calculated by HRSAM which assumes that the compressors have a 65 isentropic efficiency but correspond well with literature [9] and manufacturer data
As with the Phase 1 report [3] the compressor is the only variable cost in different-sized station
5httpwwwnrelgovhydrogenimagescdp_infr_36jpg 6httpwwwnrelgovhydrogenimagescdp_infr_35jpg
15
Table 4 Equipment needed for a conventional hydrogen fuelshying station and estimated costs (inflation adjusted from [3] or reshyassessed as described in the text)
description quantity cost total tanks [13 kg each 945 bar MAWP Type II] 3 $45633 $136899 pressure transducer and indicator 6 $1141 $6845 block and bleed valve 6 $570 $3422 air operated valve 6 $2282 $13690 pilot solenoid valve 7 $57 $399 isolation hand valve 12 $570 $6845 check valve 3 $456 $1369 coolant pump 1 $1369 $1369 water chiller 2 $4563 $9127 coolant filter 1 $57 $57 instrument air compressor 1 $1141 $1141 instrument air dryer and filter 1 $2909 $2909 hydrogen compressor [2-stage 950 bar outlet]
100 kgday station - 6 kghr 25 kW $189827 $189827 200 kgday station - 14 kghr 60 kW 1 $328774 $328774 300 kgday station - 23 kghr 100 kW $453010 $453010
hydrogen dispenser [(1) 350 bar and (1) 700 bar hose] 1 $250000 $250000 hydrogen chiller and cooling block 1 $150000 $150000 IR flame detector 2 $1711 $3422 hydrogen filter 1 $2852 $2852 PLC 1 $5704 $5704 tubing - $22817 $22817 fittings - $17112 $17112 electrical upgrades - $57041 $57041 fencing - $5704 $5704 bollards - $5704 $5704
total (100 kgday station) total (200 kgday station) total (300 kgday station)
$894256 $1033203 $1157439
16
designs The developers of HRSAM [4] found the minimum size of the commonly available high pressure ground storage tanks to be 13 kg and three of these are needed for a cascade fill giving a minimum installed high-pressure storage amount of 39 kg This size was found to be sufficient for each station modeled in this work Since each station only has a single dispenser that cost also remains constant Using the varied compressor costs the conventional station equipment costs range from $900k to $12M
Costs for the hydrogen dispenser and the hydrogen chiller and cooling block were separated out and updated in this report where they were lumped together in the previous report The chiller and cooling block was estimated to cost $150k while the dispenser was estimated at $250k These costs are based on discussions with manufacturers and station operators who have purchased these pieces of equipment and are 15 higher than the estimated $350k combined cost in the previous report Part of the reason for this update is the evolution of dispenser design from an industrial-type interface to one that provides a retail customer experience more similar to that at a gasoline station and the associated cost of these newer dispensers
One high cost subsystem shown in Table 4 is the hydrogen compressor where cost savings can be realized by reducing the size of the compressor However the compressor size needs to be balanced by the high pressure storage and station utilization The hydrogen dispenser is also a significant cost as production volume increases on the components needed in the dispensers and the assembled dispensers this cost will likely decrease The same number and type (or at least cost) of dispenser valves pumps filters tanks tubing safety equipment etc are needed for the 100 kgday station as the 200 and 300 kgday stations
25 Packaged Compression Storage and Ancillary Equpiment for a Modushylar Station
Modular stations have the compressor hydrogen cooling block chiller high-pressure storage and control electronics housed in andor on a single container Manufacturing and installing these components in this way reduces installation labor allows leak and operation checking at a dedishycated facility and can potentially reduce equipment costs by enabling high volume production of standardized components Most station designers and companies are currently producing modular units and having at least some components in a modular shippable fashion is the preferred way of constructing stations at this time Our research shows that the primary savings associated with modular stations are in the installation costs Based on conversations with manufacturers capital costs of modular stations are currently on par with conventional stations This is likely because much of the same equipment is used in both types of stations We estimate modular fueling stations to cost between $750k to $15M depending on the manufacturer and whether or not a dispenser is included This price range is for a unit that can compress and provide 200-400 kgday hydrogen and spans the $890k-$12M capital cost range of the conventional station equipment While inshystallation of conventional stations is expected to be about 35 of capital costs [4] installation of equipment for a modular station is expected to be very low likely no more than 5 of the capital costs of the modular unit In this report installation cost was estimated to be $60k regardless of
17
station size the same as the electrolyzer unit installation costs since the installation requirements are similar
Most manufacturers make just one size of modular units so there might not be potential to save by having a smaller nameplate capacity In this analysis we provide estimates for total station costs for two cases of modular unit costs ($1M and $15M) to elucidate the effect of differing capital costs These costs are assumed to include the cost of the dispenser even though is is shown as being separated from the modular system in the layout sketches In the analysis below these two different costs are also used as a further example to show how Fig 3 can be used to adjust resulting hydrogen cost to account for variability in capital cost estimates
26 Hydrogen Dispensers
Both the modular and conventional on-site station components need to interface with a disshypenser The dispenser includes valving high pressure break-away(s) hose(s) nozzle(s) flow meshytering control electronics and a customer interface (point of sale system) Stations often provide both 350 and 700 bar fills requiring two hoses break-aways nozzles and additional plumbing and control electronics Dispensing units range in price from approximately $150k-$350k For a high utilization area where one would want to allow multiple simultaneous fills the cost of additional dispensers would need to be factored into an analysis In this analysis both the conventional stashytion and modular station total cost estimates include the cost of a single dispenser with both a 350 and 700 bar hose
18
3 Results Station Designs and Costs
Multiple approaches exist to financially model fueling stations and determine the cost of hydroshygen One approach is to perform a discount cash flow analysis specifying a return on investment that is desired after a given time-frame This is the approach taken in HRSAM [4] and used in the Phase 1 Reference Station Design report [3] Specifying a 30 year analysis period and a discount rate of 15 the cost of hydrogen was determined for the different station designs These specishyfications led to a payback period (break-even time) of approximately 75 years In this work an alternative approach to the discount cash flow analysis was used wherein we calculated the cost of hydrogen considering a 7-year payback period A solution for the cost of hydrogen is found such that the sum of all costs and revenues is zero at the end of a 7-year period By taking this approach we do not need to include replacement costs for components over the entire 20 or 30 year discount cash flow analysis we only need to include replacement costs for components that need to be replaced within 7-year time-frame While some maintenance costs will be required over this 7 year time-frame we assume that no major component of the fueling station would need to be replaced in this period The validity of this assumption varies with equipment type manufacturer and duty cycle We project station costs and incomes out 20 years in this analysis but these results are missing capital replacement costs
As discussed earlier site-preparation costs can vary widely In this analysis we assume a flat $300k to cover the site-preparation including engineering and design permitting and a project contingency The cost to install the conventional components is assumed to be 35 of the capital cost while the cost to install the modular stations electrolyzer or SMR units is assumed to be $60k regardless of unit size or station capacity It should be noted that should any of these assumed costs be different from a real-world station build the black lines in the chart of Fig 3 can be used to determine the resulting change in the cost of hydrogen for the 7-year payback period For example if the site preparation costs $600k rather than the assumed $300k one could use Fig 3 to determine that for a depreciable asset7 the excess $300k would add nearly $3kg to the cost of hydrogen for a 100 kgday station or approximately $1kg to the cost for a 300 kgday station
It is assumed that the station construction takes one year (the year of 2016) and utilization begins the following year (2017) at the rate shown by Fig 2 Just like the analysis that was used to generate Fig 3 when calculating the cost of hydrogen depreciation was estimated using a 7-year Modified Accelerated Cost Recovery System (MACRS) depreciation rate and an overall tax rate of 389 (35 federal and 6 state tax)
31 Conventional Station with Delivered Centrally Produced Hydrogen
Figure 8 shows the cost and revenue model for a conventional assemble-on-site station with delivered hydrogen In 2016 there is no revenue and the costs for building the station are incurred The capital of the station (green bar) is the largest contributor to costs in 2016 The 35 of capital
7Site preparation is likely considered depreciable because it is preparing the land for business use and is closely associated with the station equipment
19
site prep
94
stati
on
cap
ital
280
stationinstall 98
deliv
ered
H 232
6
labor
65
maintenance
118
electricity19
-2000
-1500
-1000
-500
0
500
1000
1500
2000co
st o
r re
ven
ue (
k$
yr)
tax
site preparationstation capitalstation install
delivered H2labor
maintenanceelectricity
revenue ($3053kg)net income
100 kgday
site prep
78
stat
ion
capit
al
269
stationinstall 94
deliv
ered
H 237
6
labor
54
maintenance
98
electricity31
-2000
-1500
-1000
-500
0
500
1000
1500
2000
cost
or
reve
nu
e (
k$
yr)
tax
site preparationstation capitalstation install
delivered H2labor
maintenanceelectricity
revenue ($1837kg)net income
200 kgday
site prep
67
stat
ion
capit
al
259
station
install 91
deliv
ered
H 2
413
labor
46
maintenance
84
electricity40
2020 2025 2030 2035year
-2000
-1500
-1000
-500
0
500
1000
1500
2000
cost
or
reve
nu
e (
k$y
r)
tax
site preparationstation capitalstation install
delivered H2labor
maintenanceelectricity
revenue ($1426kg)net income
300 kgday
conventional delivered H2
Figure 8 Cost and revenue associated with a conventional assemble-on-site station with centrally produced delivered hydroshygen to break even at year 7 (2023) The net income includes the effects from depreciation and taxes Capital replacement costs and intervals are not included in this model (accuracy past 2023 is limshyited) Pie charts on the right show the breakdown of cumulative capital and operating costs over the 7-year analysis period to the cost of dispensed hydrogen
20
costs needed to install the station (red bar) and the $300k site preparation cost (blue bar) make up the balance As discussed earlier land costs are not included in this analysis and site preparation costs can vary quite widely Figure 3 should be used to calculate the change in the cost of hydrogen given any land purchase costs differences in real-world capital or site preparation costs The total installed station costs range from $15M to $19M for the 100 to 300 kgday stations
In 2017 as hydrogen begins to sell at the station revenue begins to roll in but operating costs are also incurred The largest incurred operation cost is the hydrogen fuel supply including the cost of production delivery and storage at the station represented by the light blue bar in Fig 8 This cost increases as the utilization of the station increases (due to more hydrogen required by the station) until 2026 when utilization stabilizes After 2026 the delivered hydrogen costs continue to increase solely due to inflation Contributors to the hydrogen production delivery and tube-trailer storage (labeled delivered H2 in Fig 8) are shown by Figs 4 and 6 and are discussed in Section 21
The purple labor bar in Fig 8 makes up a small percentage of the operating costs This value is calculated using a labor rate of $1370 hr in 2016$ the default rate in HRSAM [4] This labor rate is fixed regardless of the size of the station or the amount of hydrogen sold Maintenance shown by the yellow bar is a slightly larger operating cost contributor Maintenance was estimated at $50kyr (in 2016$ with increases due only to inflation over time) regardless of the station size Maintenance costs can vary quite widely from station to station and from quarter to quarter but this number is near the average annual cost suggested by NRELrsquos Maintenance Costs Over Time CDP8
Electrical costs to run the compressor and chiller at the station make up the balance of the operational cost in Fig 8 shown by the slim gray bar The average compressor energy usage at stations is 42 kW-hrkgH2 according to the Compressor Energy CDP9 from NREL An additional 20 of the compressor energy use was assumed for the refrigeration energy use a factor consistent with HRSAM [4] The cost for electricity shown in Fig 1 was used with this assumed compression and refrigeration energy use to calculate the cost of electricity at the station This cost increases with the amount of hydrogen dispensed and is approximately the same as the maintenance costs for the 300 kgday station after the 80 utilization rate is reached in 2026 For the 200 and 100 kgday stations the electricity usage is proportionately less
For each of the three stations the cost of hydrogen was calculated such that the capital and operating costs were recovered by revenue over 7 years Shown in Fig 8 and tabulated in Table 5 the cost of hydrogen is $3053kg $1837kg and $1426kg for the 100 200 and 300 kgday stations respectively The decrease in hydrogen cost with increasing station capacity is consistent with the Phase 1 Reference Station results [3] and is because the increased revenue from hydrogen sales more than compensates for the increased cost of capital due to the larger station capacity The decreasing hydrogen cost with station capacity also shows a trend of diminishing returns also consistent with the Phase 1 work [3] and increasing the capacity further will not decrease the hydrogen cost so dramatically In fact increasing station capacity will eventually result in
8httpwwwnrelgovhydrogenimagescdp_infr_30jpg 9httpwwwnrelgovhydrogenimagescdp_infr_35jpg
21
Table 5 Installed cost (which includes site preparation engishyneering amp design permitting capital and installation costs) and hydrogen cost for conventional stations with centrally produced delivered hydrogen
capacity (kgday) installed cost ($) H2 cost ($kg)
100 $151M $3053 200 $169M $1837 300 $186M $1426
added capital not considered in this analysis such as multiple dispensers and associated hydrogen chilling equipment additional high pressure cascade storage and additional compressors as station capacity exceeds the throughput of available single compressors
The net income is shown by the purple lines in Fig 8 In 2016 the net income (which is actually an expense in this year without revenue) is not quite the entire capital costs This is due to the depreciation deduction (tax credit) on the capital investment shown by the brown bar In 2017 the net income is slightly greater than the revenue generated by selling hydrogen Once again this is the depreciation deduction on the capital investment which is occurring on a 7 year schedule The overall net expenses and income in all cases reaches a summed value of zero in year 7 (2023) and all income after that point would be earned by the investor (although as stated earlier replacement intervals of equipment are not included in this analysis) Including capital replacement costs would not affect the revenue but would affect the costs in replacement years the tax burden (as this replaced equipment depreciated) and net income in the years past 2023 For all three capacity stations the net income increases (due to inflation and varying operating costs) from about $300-400k year in 2024 to $500-600k yr in 2036
The pie charts on the right in Fig 8 show the contribution from the capital and operating costs over the 7 year payback period to the cost of hydrogen For the 100 kgday station the delivered hydrogen is the largest contributor at 33 followed by the station capital (28) Maintenance is also a large contributor to the cost of hydrogen responsible for 12 of the $3053kg Site preparation and station installation costs are each responsible for roughly 95 of the hydrogen cost Labor accounts for 65 of the hydrogen cost and electricity to run the compressor and chiller is a small contributor at only 2 Overall taxes do not have a net effect on the cost of hydrogen (and therefore do not appear in the pie charts) due to the fact that the capital investment is depreciating on a 7 year schedule providing tax credits in the early years and the fact that we are specifying the cost of hydrogen based on the operator breaking even on their investment in year 7 If we were to determine the cost of hydrogen using a different criterion or if there were capital investments that were not depreciating (or depreciating on an alternative schedule) taxes would have a role in the cost of hydrogen Taxes will also have an impact on the revenue and return on investment over a longer analysis period Note that in this analysis we are not considering the tax to the consumer that is placed on the dispensed fuel
Comparison of the pie charts in Fig 8 shows that as the station capacity increases the stashy
22
tion capital reduces slightly as a percentage of the hydrogen cost while the delivered hydrogen increases its share of the hydrogen cost However the overall cost of delivered hydrogen reduces with increasing capacity from $995kg for the 100 kgday station down to $589kg for the 300 kgday station Electricity on the other hand while increasing as a percentage of the hydrogen cost with increasing capacity contributes approximately $057kg to the cost of hydrogen regardless of the station capacity because the same amount of energy is required to compress and chill each dispensed kg of hydrogen
Figure 9 shows how a conventional station with delivered hydrogen might be organized on a site This is nearly the same layout sketched in the previous reference station design report [3] As with the previous layout the air compressor dryer and cooling water equipment are located near the convenience station so that the air compressor inlet is at least 45 feet away from the hydrogen trailers a prescriptive requirement of NFPA 2 [10] This also prevents this equipment outside the wall from requiring electrical classification The equipment in this layout is spaced out and one could probably devise a smaller footprint The largest contributors to the space requirement are the two tube trailers on-site which would be necessary to prevent interruptions in service The tube trailers drawn are 40rsquo long and sufficient space and delivery routes need to be designed into the layout so that the drivers can drop them off and pick them up
Cost of Delivered Hydrogen
To gain insight into the cost of delivered hydrogen its contribution to the overall cost of hyshydrogen was removed and the overall cost was recalculated Without the delivered hydrogen cost the cost of hydrogen would be $2058 $1147 and $837 for the 100 200 and 300 kgday stashytions respectively The difference between these two scenarios results in delivered hydrogen costs of $995 $690 and $589 per kg Note that these costs includes the leasing two tube-trailers for storage on-site and the cost of delivered centrally produced hydrogen (without the cost of the tube-trailer lease) is $387kg for all three capacity stations The delivered hydrogen cost of $6ndash 10kg is in line with the $6ndash$8kg (in 2014$) reported by Sutherland and Joseck [6] for centrally produced delivered hydrogen of 500ndash1000 kgmonth with a delivery distance of up to 200 miles The delivery distance (assumed to be 200 miles in this analysis) will have a large impact on the cost of delivered hydrogen proportionately changing all of the associated delivery costs shown in Fig 4 which are cumulatively shown as the red bar in Fig 6 The tube-trailer lease price to store hydrogen on-site which is fixed for all three capacity stations is responsible for the decreasing cost of the centrally produced delivered and stored hydrogen as the station capacity increases By having a higher throughput of hydrogen the larger capacity stations are able to spread the cost of the tube trailer lease over a greater quantity of dispensed hydrogen
Comparison of Costs to Previous Study
Neglecting the cost of the delivered hydrogen also allows a comparison to the results of the Phase 1 Reference Station Design report [3] The calculated hydrogen costs without production
23
conveniencestore
50 0
dispenser island
H2 cooling blockH2 chiller
gas panel
high pressure H2storage
compressorwater chillerair compressor
tube trailer
168 0
140
0
30 0
Figure 9 Renderings of a conventional station layout with delivshyered gaseous hydrogen
24
and delivery of $2058 $1147 and $837 are higher than the Phase 1 calculated costs of $1328 $782 and $603 for the 100 200 and 300 kgday stations (shown in Table 1) Several factors contribute to the differences in the calculated fuel cost First the installed capital costs of $15M $17 and $19M in this analysis are higher than those calculated previously of $11M $12M and $13M (even after adjusting for inflation) Second the previous analysis used HRSAM in which the operating costs are calculated a bit differently than this analysis Finally in the previous analshyysis the criteria for hydrogen cost was a 15 discount rate based on a 30 year analysis period which led to a 75 year payback period In this analysis the payback period was set to exactly 7 years (and the discount rate was not considered) If in this analysis the capital costs are reduced to match the previously reported capital costs ($11M $12M and $13M) and the payback period is extended from 7 to 75 years the cost for dispensed hydrogen (without including the cost of hydrogen production and delivery) is calculated as $1521 $823 and $590 for the 100 200 and 300 kgday stations respectively These costs are within 15 of the HRSAM values found in the previous analysis The differences in this case must all be attributed to the second cause of differshying assumptions on operation costs in this analysis method vs the HRSAM method This exercise shows that the economic assumptions in this analysis are in-line with the HRSAM assumptions albeit not exactly the same This exercise also demonstrates that solving for the hydrogen cost to match a payback periodndashas long as that payback period is less than the capital replacement interval on partsndashis a valid alternative to the discount rate analysis used in HRSAM
32 Conventional Station with Hydrogen Produced On-site via Steam Methane Reforming
The costs and revenue for a conventional assemble-on-site station with an on-site steam methane reformer to produce hydrogen are shown in Fig 10 with the installed costs and cost of hydrogen tabulated in Table 6 Inspection of the capital costs incurred in 2016 shows that the largest conshytributor is the SMR unit itself As discussed in Section 22 these SMR units are estimated to cost from just over $1M for a 100 kgday capacity to just under $25M for a 300 kgday capacity Usshying Fig 3 adding a $1M capital investment (depreciable) to a 100 kgday station will add nearly $10kg to the cost of hydrogen to make back that investment in 7 years But for the 100 kgday stashytion with on-site SMR the $3847kg cost of hydrogen is only about $8 higher than the $3053kg for the conventional station with delivered hydrogen The hydrogen cost is calculated based on
Table 6 Installed cost (which includes site preparation engishyneering amp design permitting capital and installation costs) and hydrogen cost for conventional stations with SMR on-site
capacity (kgday) installed cost ($) H2 cost ($kg)
100 $274M $3847 200 $383M $2596 300 $443M $2023
25
site
pre
p
75
station
capital
222
stationinstall 78
SMR c
ap
292
SM
R in
st
15
labor
51
SMR elec
12 natural gas
45 water
07
maintenance188
stat
ion
elec
tric
ity
15
-3000
-2000
-1000
0
1000
2000
3000co
st o
r re
ven
ue (
k$
yr)
tax
site preparationstation capitalstation installSMR capitalSMR install
laborSMR electricity
natural gaswater
maintenancestation electricity
revenue ($3847kg)net income
100 kgday
site
pre
p
55
statio
n
capita
l190
stationinstall 67
SMR c
ap
382
SM
R inst
11
labor
38 SMR elec
17 natural gas
67water
11
maintenance
139
stat
ion
elec
tricit
y
22
-4000
-3000
-2000
-1000
0
1000
2000
3000
4000
cost
or
reve
nu
e (
k$
yr)
tax
site preparationstation capitalstation installSMR capitalSMR install
laborSMR electricity
natural gaswater
maintenancestation electricity
revenue ($2596kg)net income
200 kgday
site
pre
p
47
statio
nca
pita
l182
stationinstall 64
SMR c
ap
395
SM
R in
st
09
labor
33
SMR elec
22
natural gas
86water
14
maintenance
119
stat
ion
elec
tricit
y
28
2020 2025 2030 2035year
-6000
-4000
-2000
0
2000
4000
6000
cost
or
reve
nu
e (
k$y
r)
tax
site preparationstation capitalstation installSMR capitalSMR install
laborSMR electricity
natural gaswater
maintenancestation electricity
revenue ($2023kg)net income
300 kgday
conventional SMR on-site
Figure 10 Cost and revenue associated with a conventional assemble-on-site station with on-site steam methane reforming produced hydrogen to break even at year 7 (2023) The net inshycome includes the effects from depreciation and taxes Capital replacement costs and intervals are not included in this model Pie charts on the right show the breakdown of cumulative capital and operating costs over the 7-year analysis period to the cost of disshypensed hydrogen
26
both capital and operating costs so we can conclude that the operating costs for the 100 kgday SMR are less than the operating costs for the 100 kgday delivered hydrogen station In addition to the common costs for labor station maintenance and station electricity the station with the SMR unit has a nominal operating cost for water for the SMR unit (nearly indistinguishable green bar) requires electricity and natural gas to run the unit (shown by the blue and black bars) and requires additional maintenance over the conventional station with delivered hydrogen (included in the red bar) Maintenance for the SMR unit is assumed to be $50kyear bringing total station maintenance costs to $100k yr However the sum of these costs is less than the cost to deliver and store censhytrally produced hydrogen for the 100 kgday station Operating costs for the SMR station neglect the inefficiencies in shutdownstartup cycles (or venting excess hydrogen) when production is not matched by demand which would further increase costs
The cost of hydrogen for the conventional 100 200 and 300 kgday stations with on-site SMR are $3847kg $2596kg and $2023kg These costs are 26 41 and 42 higher than the costs of hydrogen for a conventional station with delivered gaseous hydrogen As discussed the increased cost of hydrogen comes from the high capital costs for the on-site SMR units slightly offset by a reduced operating cost This can be seen by inspecting the pie charts on the right side of Fig 10 where the SMR capital costs is the largest contributor to the cost of hydrogen accounting for approximately 30-40 of the hydrogen cost For the 200 and 300 kgday stations the capital costs of $2M and $25M add approximately $10kg and $8kg While the operating costs for these stations are lower than the same capacity delivered hydrogen stations these differences fail to decrease the cost of hydrogen to the same level as the delivered hydrogen station Overall this analysis would suggest that while there may be some advantages to utilizing on-site SMR there is not much of a financial case to produce hydrogen on-site using steam methane reforming rather than having hydrogen delivered for 100-300 kgday hydrogen refueling stations unless the capital cost can be reduced significantly
A station with an on-site SMR unit could have a smaller footprint than a station with delivered hydrogen One potential layout is shown in Fig 11 By replacing the tube trailers with an SMR unit significantly less space is required for the fueling station components (compare to Fig 9) Since all hydrogen is produced on-site delivery routes can also be neglected from consideration and walls can enclose all of the hydrogen components reducing setback distances on all sides The SMR unit is shown as being housed in a 20 ft ISO container footprint although to produce 300 kgday it may be possible to have a smaller footprint and even smaller for the stations that only require 100 or 200 kgday For on-site SMR the fueling station components (eg compressor high pressure storage) take up relatively more space than the low pressure hydrogen source (because the SMR is much smaller than the two tube trailers) and laying out these components in a compact manner is important in space-constrained sites
33 Conventional Station with Hydrogen Produced On-site via Electrolysis
Conventional stations with on-site electrolysis have the costs and revenues shown in Fig 12 The installed capital costs and hydrogen costs at each of the three stations are tabulated in Table 7 Similar to the conventional station with a steam methane reforming unit on-site each of these
27
30 0
50 0
154 0
100
0
conveniencestore
dispenser island
compressor
high pressure storagegas panel
H2 chillerH2 cooling block
air compressorwater chiller
20 ft ISO container(electrolyzer or SMR)
Figure 11 Renderings of a conventional station layout with on-site production of hydrogen
28
site prep
72
stat
ion
capit
al
216
station
install 75
eleccapital 197
elec
install
14
elec
el
ectr
icity
177
wate
r02
lab
or
50
maintenance
182
stationelectricity
14
-3000
-2000
-1000
0
1000
2000
3000co
st o
r re
ven
ue (
k$
yr)
taxsite preparationstation capitalstation installelec capitalelec install
elec electricitywater
labormaintenance
station electricity
revenue ($3966kg)net income
100 kgday
site prep
54
stat
ion
capi
tal
186
statio
n
insta
ll65
eleccapital 221
elec
install11
elec
el
ectr
icit
y26
5
water
03
labor
37
maintenance
136
stationelectricity
21
-3000
-2000
-1000
0
1000
2000
3000
cost
or
reve
nu
e (
k$
yr)
taxsite preparationstation capitalstation installelec capitalelec install
elec electricitywater
labormaintenance
station electricity
revenue ($2651kg)net income
200 kgday
site prep44
stat
ion
capi
tal
170
stati
on
inst
all
59
elec
capital 224
elecinstall
09
elec
el
ectr
icit
y32
3
water
04
labor
30
maintenance
111
stationelectricity
26
2020 2025 2030 2035year
-4000
-3000
-2000
-1000
0
1000
2000
3000
4000
cost
or
reve
nu
e (
k$y
r)
taxsite preparationstation capitalstation installelec capitalelec install
elec electricitywater
labormaintenance
station electricity
revenue ($2174kg)net income
300 kgday
conventional electrolysis on-site
Figure 12 Cost and revenue associated with a conventional assemble-on-site station with on-site electrolysis produced hyshydrogen to break even at year 7 (2023) The net income includes the effects from depreciation and taxes Capital replacement costs and intervals are not included in this model Pie charts on the right show the breakdown of cumulative capital and operating costs over the 7-year analysis period to the cost of dispensed hydrogen
29
Table 7 Installed cost (which includes site preparation engishyneering amp design permitting capital and installation costs) and hydrogen cost for conventional stations with electrolysis on-site
capacity (kgday) installed cost ($) H2 cost ($kg)
100 $238M $3966 200 $298M $2651 300 $345M $2174
station designs has a large capital cost due to the electrolysis unit As discussed in Section 23 the electrolysis units cost approximately $800k $12M and $15M for 100 200 and 300 kgday capacities These capital investments will add approximately $8kg $6kg and $5kg to the cost of hydrogen over a conventional station assuming equivalent operating costs During operation there is a large cost associated with electricity to run the electrolysis unit (shown by the yellow bar) This cost scales with the amount of hydrogen produced and is a large factor in the station economics The pie charts on the right show that this electricity accounts for approximately 20-30 of the cost of hydrogen Other additional costs over the conventional delivered hydrogen station are the cost of water to run the electrolysis unit and additional maintenance on the electrolyzer (assumed to be $50k annually as with the SMR)
The electricity required for the electrolyzer costs approximately $300k $600k and $900k (for the 100 200 and 300 kgday stations) in 2036 where utilization has topped out at 80 Centrally produced delivered hydrogen by comparison as shown in Fig 8 costs around $300k $450k and $650k in 2036 with overall operating costs for the delivered hydrogen station (neglecting taxes) topping out at approximately $400k $600k and $800k In addition to the additional capital costs for the electrolyzer (and the other operational costs) it is clear that the economics of a station with an electrolyzer are challenging due to the high electricity consumption even when the electricity is from the current national grid mix with 13 renewable content10 Higher renewable content may further increase this cost component in the near term although fossil-fuel free electricity may become less expensive in the longer term
The cost of hydrogen for the conventional station with an electrolyzer is $3966kg $2651kg and $2174kg for the 100 200 and 300 kgday stations receptively These costs are on-par with the conventional station with SMR within $150kg for all three capacities The cost of hydrogen for a station with on-site production is significantly higher than for a station with delivered hydroshygen Besides improvements in electrical efficiency one strategy for minimizing operating costs is to only operate the electrolyzer at off-peak hours enabling the purchase of lower priced electricity However this might require oversizing the electrolyzer to produce enough hydrogen at off-peak hours to meet demand increasing the capital costs associated with the unit Another method is inshytentionally oversizing the electrolyzer to enable operation at a higher efficiency thereby reducing operating expenses
102015 estimate from httpwwweiagovtoolsfaqsfaqcfmid=92ampt=4
30
To estimate the impact of these methods of operation and aslo gain insight into less expensive renewable electricity costs in the future the model was run with the cost of electricity zeroed-out to calculate the lowest possible cost of hydrogen with cheap electricity In this scenario the cost of hydrogen is $3264kg $1949kg and $1472kg (for the 100 200 and 300 kgday stations) These costs are only slightly higher (by 3-7) than the conventional delivered hydrogen cost due to the capital investment in the electrolyzer and the remaining electrolyzer maintenance and water costs
A station with on-site electrolysis can also be represented by the layout shown in Fig 11 Housing the components necessary for alkaline electrolysis of 100-300 kgday hydrogen might be challenging in a 20 ft ISO container and the layout might need to be increased (to a 30 or 40 ft ISO container) For PEM electrolysis however the components should fit in the 20 ft ISO container and potentially smaller containers for the 100 or 200 kgday stations Similar to the reforming layout the hydrogen components fit in a much more compact space than for the conventional station with delivered hydrogen (shown in Fig 9) and the lot size is reduced
34 Modular Station with Delivered Centrally Produced Hydrogen
Figure 13 shows the cost revenue and income model for a modular station with delivered centrally produced hydrogen and an uninstalled modular unit cost of $15M The installed capital costs and hydrogen costs at each of the three capacity stations are tabulated in Table 8 Recall from Section 25 that the capital costs for modular stations do not follow the same trend as for build-on-site stations because modular stations come in discrete sizes Table 8 shows the installed capital and hydrogen costs for two cases of uninstalled modular station costs of $15M and $1M The only difference in costs between this scenario and the conventional station with delivered centrally produced hydrogen (see Table 5 and Fig 8) are in the capital costs While the installed capital costs including site preparation station capital and installation were $15M and $17M for the 100 and 200 kgday conventional stations it is $186M for all three capacities of the modular
Table 8 Installed cost (which includes site preparation engishyneering amp design permitting capital and installation costs) and hydrogen cost for modular stations with delivered hydrogen for two cases of uninstalled modular cost $15M and $10M
capacity uninstalled installed H2 cost (kgday) modular cost ($) cost ($) ($kg)
100 $15M $186M $3390 200 $15M $186M $1916 300 $15M $186M $1425 100 $1M $136M $2912 200 $1M $136M $1677 300 $1M $136M $1265
31
site
pre
p
85
stationcapital 423
statio
n
install
17d
elive
red
H2
294
labor
58
maintenance107
electricity
17
-2000
-1500
-1000
-500
0
500
1000
1500
2000co
st o
r re
ven
ue (
k$
yr)
tax
site preparationstation capitalstation install
delivered H2labor
maintenanceelectricity
revenue ($3390kg)net income
100 kgday
site
prep
75
station
capital 374
station
install15
delive
red
H2
360
labor
52
maintenance94
electricity
30
-2000
-1500
-1000
-500
0
500
1000
1500
2000
cost
or
reve
nu
e (
k$
yr)
tax
site preparationstation capitalstation install
delivered H2labor
maintenanceelectricity
revenue ($1916kg)net income
200 kgday
site
prep
67
station
capital336
stationinstall 13
del
iver
ed H2
413
labor
46
maintenance85
electricity
40
2020 2025 2030 2035year
-2000
-1500
-1000
-500
0
500
1000
1500
2000
cost
or
reve
nu
e (
k$y
r)
tax
site preparationstation capitalstation install
delivered H2labor
maintenanceelectricity
revenue ($1425kg)net income
300 kgday
modular station delivered hydrogen
Figure 13 Cost and revenue associated with a modular station with centrally produced delivered hydrogen to break even at year 7 (2023) assuming a $15M uninstalled capital cost of the modular station The net income includes the effects from depreciation and taxes Capital replacement costs and intervals are not included in this model Pie charts on the right show the breakdown of cumulashytive capital and operating costs over the 7-year analysis period to the cost of dispensed hydrogen
32
stations This capital investment for a 300 kgday modular station (including site preparation station capital and installation) is coincidentally the same as for a 300 kgday conventional station
If an estimate of $1M (as compared to the conservative estimate of $15M) for the uninstalled capital cost of the modular fueling station unit is used (note that this is still within the range of costs vendors estimated as described in Section 25) the cost of hydrogen will be $2912 $1677 and $1265 for the 100 200 and 300 kgday capacities respectively These costs are all lower than the cost of hydrogen at the equivalent capacity conventional stations As this technology matures and the installed capital cost of the modular units continues to decrease below the installed capital cost of the conventional stations it will make economic sense to site modular stations rather than assembling components on-site Parts standardization and the increased quality control that can be achieved by having modular station components may also lead to reduced maintenance requirements but that potential benefit is not included in this analysis
Figure 14 shows that a modular unit requires a slightly smaller installation area than the conshyventional station components shown in Fig 9 However the tube trailers acting as the hydrogen source and on-site storage still require significant space Similar to the conventional station with delivered hydrogen delivery routes must also be considered when siting a modular station with deshylivered hydrogen The hydrogen components are shown as being housed in a 20 ft ISO container although some 300 kgday modular stations are smaller than this While a slightly overall reduced footprint (relative to as drawn in Fig 14) could be realized we show this layout on the same lot as before Removing the need to store two 40-foot tube trailers by adding on-site low pressure storage could also drastically reduce the footprint by reducing the need to have an open wall for delivery A discussion of how the separation distances can be impacted and the footprints might be reduced due to fire-rated walls is included at the end of the Section 35
33
140
0
168 0
50 0
30 0
dispenser island
tube trailer
modular station(20 ft ISO)
conveniencestore
Figure 14 Renderings of a modular station layout with delivered hydrogen
34
35 Modular Station with Hydrogen Produced On-site via Electrolysis
The final configuration considered in this analysis is a modular station with an electrolysis unit attached to produce hydrogen The economics of this station design are shown in Fig 15 The installed capital costs and hydrogen costs at each of the three capacity stations with two different uninstalled modular unit costs are tabulated in Table 9 Similar to the results in the previous section the cost of hydrogen at the low volume modular electrolysis stations with an assumed $15M uninstalled modular station cost are higher than at the conventional electrolysis station counterpart We find that the cost of hydrogen at these modular stations with electrolysis produced hydrogen will be $4303kg $2730kg and $2173kg (for the 100 200 and 300 kgday stations) These costs are once again $337kg higher $079kg higher and the same (respectively) as the costs at the conventional stations with electrolysis produced hydrogen discussed in Section 33 This cost difference between the analogous conventional station is once again solely due to the differing capital cost of the installed modular station If the capital cost of the modular unit is $1M the hydrogen costs reduce to $3825 $2491 or $2013kg (for the 100 200 and 300 kgday stations) which are all lower than the cost at the similarly sized conventional stations with on-site electrolysis due to the lower installed station cost
Having on-site production using an electrolyzer and modular fueling station components only requires a small footprint for installation as shown in Fig 16 The ISO containers can house apshypropriate fire-rated barrier walls reducing separation distance for Group 1 and 2 exposures (except for air intakes) by half and eliminating separation distances for Group 3 exposures as described in Section 732312 of NFPA 2 The Hydrogen Technologies Code (2016) [10] Group 1 exshyposures are lot lines air intakes (HVAC compressors other) operable openings in buildings and structures and ignition sources such as open flames and welding Group 2 exposures are exshyposed persons (other than those servicing the system) and parked cars Group 3 exposures include buildings flammable gas storage hazardous materials storage ordinary combustibles horizontal distance to overhead electrical wire and piping containing other hazardous material This means
Table 9 Installed cost (which includes site preparation engishyneering amp design permitting capital and installation costs) and hydrogen cost for modular stations with on-site electrolysis proshyduced hydrogen for two cases of uninstalled modular cost $15M and $10M
capacity uninstalled installed H2 cost (kgday) modular cost ($) cost ($) ($kg)
100 $15M $274M $4303 200 $15M $314M $2730 300 $15M $345M $2173 100 $1M $224M $3825 200 $1M $264M $2491 300 $1M $295M $2013
35
site prep67
stat
ion
capit
al
333
stationinstall 13
eleccapital 181
elec
install
13
elec
el
ectr
icity
163
wate
r0
2
labor
46
maintenance
168
stationelectricity
13
-3000
-2000
-1000
0
1000
2000
3000co
st o
r re
ven
ue (
k$
yr)
taxsite preparationstation capitalstation installelec capitalelec install
elec electricitywater
labormaintenance
station electricity
revenue ($4303kg)net income
100 kgday
site prep53
stat
ion
capi
tal
263
station
install
11
eleccapital 214
elec
install11
elec
elec
tric
ity
257
water
03
lab
or
36
maintenance
132
stationelectricity
21
-4000
-3000
-2000
-1000
0
1000
2000
3000
4000
cost
or
reve
nu
e (
k$
yr)
taxsite preparationstation capitalstation installelec capitalelec install
elec electricitywater
labormaintenance
station electricity
revenue ($2730kg)net income
200 kgday
site prep44
stat
ion
capi
tal
220
stati
on
inst
all
09
elec
capital 224
elecinstall 09
elec
elec
tric
ity32
3
water
04
labor
30 maintenance
111
stationelectricity
26
2020 2025 2030 2035year
-4000
-3000
-2000
-1000
0
1000
2000
3000
4000
cost
or
reve
nu
e (
k$y
r)
taxsite preparationstation capitalstation installelec capitalelec install
elec electricitywater
labormaintenance
station electricity
revenue ($2173kg)net income
300 kgday
modular station electrolysis on-site
Figure 15 Cost and revenue associated with a modular station with on-site electrolysis produced hydrogen to break even at year 7 (2023) assuming a $15M uninstalled capital cost of the modular station The net income includes the effects from depreciation and taxes Capital replacement costs and intervals are not included in this model Pie charts on the right show the breakdown of cumulashytive capital and operating costs over the 7-year analysis period to the cost of dispensed hydrogen
36
electrolyzer(20 ft ISO)
modular station(20 ft ISO)
convenience store
dispenser island
100
0
100 0
17 0
Figure 16 Renderings of a modular station layout with an elecshytrolyzer for on-site production with a small reduced footprint
37
for a typical pipe diameter of 028rdquo and up to 15000 psi pressure (within the operating range of the cascade storage at a refueling station) air intakes must remain 34 ft from the containers while lot lines other building openings or ignition sources only need 17 ft of separation Exposed persons and parked cars must be 8 ft or more away from the containers and other exposures (including other combustibles like gasoline) do not need any separation from the containers This will allow a compact layout an example of which is shown in Fig 16
38
4 Conclusions
Five station designs were considered in this analysis with three capacities of each station deshysign With the current technology the lowest cost hydrogen source assessed here11 is tube-trailers delivering centrally produced gaseous hydrogen Shown in Table 10 or graphically in Fig 17 for either a conventional or modular station with a 300 kgday capacity and delivered hydrogen gas (using our conservative $15M cost estimate for the modular unit) it would cost approximately $186M to prepare the site and build the station and at a dispensed hydrogen cost of $1425kg a station operator would break even on their capital investments and operational costs in 7 years If the capital cost of the modular station unit is only $1M which is still in the range of cost estimates by manufacturers a modular station with delivered hydrogen would cost $136M to build and for a 300 kgday capacity hydrogen would cost $1265kg Embedded in all of these analyses is the utilization profile shown in Fig 2 which is the reason that the hydrogen cost increases as the cashypacity (and utilization) decreases for the modular stations with delivered hydrogen although they have the same installed cost
The specified 7-year return on investment results in higher cost hydrogen for smaller stations than for larger ones due to less throughput and higher capital cost per kg of capacity (see the lower left frame of Fig 17) If the SDO charges customers a price lower than this cost the result will be a longer return on investment Setting the same price regardless of station capacity will result in the 100 kgday station having the longest return on investment and the 300 kgday having the shortest
The addition of a steam methane reformer or an electrolyzer to a hydrogen refueling station increases the capital cost significantly with the steam methane reformer estimated to have the
11The cost of liquid delivery was not included in this analysis
Table 10 Installed cost (which includes site preparation engishyneering amp design permitting component capital and installation costs) and resulting hydrogen cost to break even at year 7 for the stations analyzed in this work
station capacity rarr 100 kgday 200 kgday 300 kgday
station type darr installed cost ($)
H2 cost ($kg)
installed cost ($)
H2 cost ($kg)
installed cost ($)
H2 cost ($kg)
conventional delivered H2 conventional SMR H2 conventional electrolysis H2 modular ($15M) delivered H2 modular ($1M) delivered H2 modular ($15M) electrolysis H2 modular ($1M) electrolysis H2
$151M $274M $238M $186M $136M $274M $224M
$3053 $3847 $3966 $3390 $2912 $4303 $3825
$169M $383M $298M $186M $136M $314M $264M
$1837 $2596 $2651 $1916 $1677 $2730 $2491
$186M $443M $345M $186M $136M $345M $295M
$1426 $2023 $2174 $1425 $1265 $2173 $2013
39
$00M$05M$10M$15M$20M$25M$30M$35M$40M$45M
inst
all
ed
cost
($)
capacity (kgday)
100 200 300
conv
ention
al d
eliv
ered
gas
conv
ention
al S
MR
conv
ention
al e
lect
roly
sis
mod
ular
($1
5M
) d
eliv
ered
gas
mod
ular
($1
M) d
eliv
ered
gas
mod
ular
($1
5M
) e
lect
roly
sis
mod
ular
($1
M) e
lect
roly
sis
$0k
$5k
$10k
$15k
$20k
$25k
$30k
inst
all
ed
cost
($[
kg
day]
)
conv
ention
al d
eliv
ered
gas
conv
ention
al S
MR
conv
ention
al e
lect
roly
sis
mod
ular
($1
5M
) d
eliv
ered
gas
mod
ular
($1
M) d
eliv
ered
gas
mod
ular
($1
5M
) e
lect
roly
sis
mod
ular
($1
M) e
lect
roly
sis
$0$5
$10$15$20$25$30$35$40$45
H2 c
ost
($k
g)
capacity (kgday)
100 200 300
Figure 17 Installed cost (which includes site preparation engishyneering amp design permitting component capital and installation costs) are shown in the left frames The top frame is the total inshyvestment in 2016$ while the bottom left frame is the installed cost per mass of hydrogen dispensed (kgday) The hydrogen cost to break even at year 7 is shown in the right frame for the stations analyzed in this work
40
highest capital cost On-site production does allow for a more compact station footprint and does not require consideration for tube-trailer delivery routes With current technology and projected utility prices operating a steam methane reformer costs slightly less than operating an electrolyzer These offsetting differences in capital vs operational costs causes the price of hydrogen to be very similar for a station with SMR produced hydrogen and electrolysis produced hydrogen In both cases the cost of hydrogen is $6-$10kg more for the stations that produce hydrogen on-site than the stations that have hydrogen delivered This analysis does not include the startup and shutdown inefficiencies (and associated costs) for either the SMR or electrolyzer The penalty for cycling a SMR is likely greater than for cycling an electrolyzer potentially giving an electrolyzer an economic advantage for on-site production
Electrolyzers also have the potential to produce less carbon dioxide than SMRrsquos By definishytion SMRrsquos require methane which contains carbon to produce hydrogen releasing the carbon molecules as carbon dioxide and contributing to climate change A reduced carbon footprint could be achieved by using bio-gas or implementing carbon capture and storage (although this would incur an efficiency penalty) Electrolyzers on the other hand require only electricity and water giving this technology the potential to be completely carbon free given the right source of elecshytricity such as solar wind hydroelectric or nuclear The key to making on-site production more cost competitive with delivered hydrogen is reducing the utility costs For electrolysis this can be achieved through efficiency improvements (although around 50-70 efficiencies are achieved with current technology) through the purchase of low cost off-peak electricity or by using elecshytricity generated behind the meter Of course reducing capital cost and maintenance requirements of on-site production units will also improve the economics of this technology
According to our research current modular fueling stations where components are assembled and tested at a central production facility have installed costs no higher than conventional stations Using our high estimate of $15M for the modular unit the installed cost of the 300 kgday modular station is nearly the same as for a 300 kgday conventional station Using a lower cost estimate of $1M for the modular unit the installed cost of a 100 kgday conventional station is 11 higher than the modular station With greater industry experience and higher volume production we would anticipate the cost of modular stations to reduce in the near-future Developing stations in this manner may lead to better quality control and reduced maintenance requirements for hydrogen fueling stations It is also possible to achieve more compact station footprints by modularizing the station components by building in appropriate fire-rated barrier walls Because of these potential benefits we anticipate modularization and standardization to increase in the future
This report details the economics of current hydrogen refueling stations and includes some sketches of potential layouts We have visually depicted the contributions to capital and operational costs of hydrogen for different station concepts making it easy to find the largest contributors to a high cost of hydrogen to the consumer This information can be used to devote research and development towards these high contributors At the station the dispenser compressors and chillers are expensive pieces where additional development or higher volume production could reduce station costs For electrolysis the purchase of low-priced electricity could serve to make on-site production cost competitive with central production and delivery This report enables the comparison of different station concepts that could be implemented in various market scenarios
41
A Piping amp Instrumentation Diagram
The following pages show the piping and instrumentation diagram for the included reference stations For the conventional stations all components need to be assembled on-site The dashed boxes show the components that are often modularized for the modular stations For reference the utility requirements shown in the PampID are also included here in Table A1
Table A1 Utility requirement estimateslowast for the stations in this report
capacity 100 kgday 200 kgday 300 kgday
compressor power electrolyzer power electrolyzer water SMR power SMR water SMR gas
25 kW 260 kW 110 lhr 16 kW 400 lhr 34 Nm3hr
60 kW 510 kW 220 lhr 33 kW 800 lhr 68 Nm3hr
100 kW 770 kW 330 lhr 49 kW 1200 lhr 101 Nm3hr
lowast These are averages based on manufacturer specifications and literature and are meant to give an estimate of site requirements For exact specifishycations to meet station requirements consult a manufacturer directly
42
ABCDEFGHIJK1
2
3
4
5
6
7
Measured Variable Readout of function Output Function ModifierA Air AlarmB Burner Storage Users Choice Users ChoiceC Compressor ClosedD DispenserE Electrolyzer Sensor (primary Element)F Flow FilterG Chiller Glass viewingH Hand HighI Current IndicatorJ PowerK Time Control StationL Level Light LowM Conductivity MiddleN Users Choice Users Choice Hydrogen Users ChoiceO Water Orifice restriction Air OpenP PressureQ QuantityR Reformer Record ReduceS Speed Frequency SwitchT Temperature TransmitU Multivariate Multifunction Multifunction MultifunctionV Vibration ValveW Weight Well WaterX Unclassified Unclassified Unclassified UnclassifiedY State RelayZ Position Actuator
PROCESS AND SIGNAL LINES
HYDROGEN PROCESS LINE
DEIONIZED WATER PROCESS LINE
PNEUMATIC SIGNAL LINE
NITROGEN SIGNAL LINE
ELECTRICAL SIGNAL LINE
SV
VALVES
BALL VALVE
NEEDLE VALVE
CHECK VALVE
SOLENOID VALVE
AIR ACTUATED VALVE SPRING RETURN CLOSE
PRESSURE REDUCING VALVE
TWO WAY PRESSURE RELIEF
THREE WAY PRESSURE RELIEF
EQUIPMENT
FILTER
PUMP
DRYER
HYDROGEN COMPRESSOR
STORAGE TANK
IR FLAME DETECTOR
Line Service Identification codesCCA-CLEAN COMPRESSED AIRCHW-CHILLED WATERH-HYDROGENN-NITROGEN
Pipe Specification Details3000PSI Min pressure rating of 3000 PSI 316316L austenitic stainless steel tubing UNS S31600 (316) UNS S31603 (316L)6500PSI Min pressure rating of 6500 PSI 316316L austenitic stainless steel tubing UNS S31600 (316) UNS S31603 (316L)15000PSI Min pressure rating of 15000 PSI 316316L austenitic stainless steel tubing UNS S31600 (316) UNS S31603 (316L)POLY Polyamide (Nylon) pneumatic tubing light and heat stabilized0032CU 0032 wall copper alloy 122 seamless tubingSCH40 Schedule 40 iron pipe
Line symbolsXrdquo-XXX-XXXX-XXX-XXX
Line size nominal inches
Service
Line Number (if assigned)
Pipe Spec
Insulation (if applicable)
Insulation codesF1- Soda-lime silicate glass (FOAMGLAS) 1 wall thicknessF2- Buna N Foam 38 thick
ABCDEFGHIJK1
2
3
4
5
6
7
CNH-300
HV-202HV-203
HV-201PT-300PI-300 HV-300
HV-301
Motor460-V 3Oslash SEE NOTE 1
Heater120-V 1Oslash 500 W
PT-202PI-202
34-H-VENT
1-frac14rdquo-CHW-800-SCH40
1-frac14rdquo-CHW-800-SCH40-F2
CW-800
GW-800
HV-202
HV-300
FV-100
ZSO-100
ZSC-100
ZI-100
FSV-100
ZZO-100
FSV-30038-H-3000PSI
38-H-5000PSI
38-H-5000PSI
38-H-15000PSI
34-H-VENT
OF-802TO COMMON frac34rdquo VENT MAST LOCATED ON BACK OF GMP
10 ABOVE GRADE
REFERENCE STATION 100-300 KGDAY
FF-300
GW-801
PI-101 PT-101
H2 Storage PBNH-402MAWP-15000 PSIG
H2 Storage PBNH-403MAWP-15000 PSIG
H2 Storage PBNH-401MAWP-15000 PSIG
FV-401
ZSO-401 ZSC-401
ZZO-401
FV-402
ZSO-402 ZSC-402
ZZO-402
FV-403
ZSO-403 ZSC-403
ZZO-403
FV-400
ZSO-400 ZSC-400
ZZO-400 GN-900
CHILLER 75-kW
DN-900JSS-901(EPO)
To EPO circuit
700-BAR NOZZLE
350-BAR NOZZLE
38-H-15000PSI
H70-T40H70-Warm
H35-T0
3570MPa DISPENSERWUN-900
FVControls Internal120V 1p 15A
GN-901
HEAT EXCHANGER1350 lbs
HV-901
H70-Cold
H2 Delivery Trailer multiple tubes one outlet
COH-100Air Compressor
PBAL-100
HV-100
AF-100
Air DryerAF-101
HV-900
PT-403PI-403
HV-403
PT-402PI-402
HV-402
PT-401PI-401
HV-401
HV-411
HV-412
HV-413
ZI-401
ZI-402
ZI-403
FV-101
ZSO-101 ZSC-101 ZI-101
ZZO-101
ZVO-100
ZVO-101
ZVO-900
ZVO-401
ZVO-400
ZVO-402
ZVO-403
RAH-100IR FLAME DETECTOR
AIMED AT HYDROGEN SOURCEAND ZONE 400
HIGH PRESSURE STORAGE
TO FIRE PANEL
RAH-900
IR FLAME DETECTORAIMED AT DISP HOSES
TO FIRE PANEL
HV-101
38-H-15000PSI
ZI-400
HV-400
FSV-200
EN-100ELECTROLYZER SKID
20 BAR (300 PSI) OUTPUT
RN-100STEAM METHANE REFORMER (SMR)
SKID13 BAR (200 PSI) OUTPUT
ZVO-102
Power460-V 3OslashSEE NOTE 1
Power460-V 3OslashSEE NOTE 1
ONLY ONE HYDROGEN SUPPLY OPTION IS USED PER STATION 1 TUBE TRAILER DELIVERY2 ON-SITE ELECTROLYSIS3 ON-SITE STEAM METHANE REFORMER
MUNICIPAL WATER SUPPLY
SEE NOTE 1
NATURAL GAS BIOGAS METHANE SUPPLY
SEE NOTE 1
NOTE 1 UTILITY REQUIREMENTS DEPEND ON STATION CAPACITY AND CAN BE ESTIMATED BASED ON THE FOLLOWING TABLESTATION CAPACITY 100 KGDAY 200 KGDAY 300 KGDAYELECTROLYZER POWER 260 KW 510 KW 770 KWELECTROLYZER WATER 110 LHR 220 LHR 330 LHRSMR POWER 16 KW 33 KW 49 KWSMR WATER 400 LHR 800 LHR 1200 LHRSMR GAS 34 NM3HR 68 NM3HR 101 NM3HRCOMPRESSOR POWER 25 KW 60 KW 100 KW
NOTE 2 ON-SITE PRODUCTION UNITS MAY INCORPORATE THEIR OWN INSTRUMENT AIR SYSTEM AND INTERCONNECTION WITH CSD SKIDCONTAINER MAY NOT BE NECESSARYNOTE 3 APPLIES TO MODULAR STATION ONLY A BUILD-ON-SITE STATION WILL NOT HAVE A SKID-OR CONTAINER-MOUNTED PRE-ASSEMBLED SYSTEMNOTE 4 IN SOME MODULAR STATIONS THE DISPENSER WILL BE A SEPARATELY-INSTALLED COMPONENTNOTE 5 IN MANY MODULAR STATIONS THE HEAT EXCHANGE EQUIPMENT WILL BE ROOF-MOUNTED
NOTE 2
COMPRESSION STORAGE AND DISPENSER (CSD) SKID OR CONTAINER BOUNDARY SEE NOTE 3
NOTE 4
NOTE 5
NOTE 5
PLCGas Control Cabinet
COMPRESSORMULTIPLE STAGES
References
[1] US Energy Information Administration EIA Open Data - Intro - US Energy Information Administration (EIA) accessed July 2016 httpwwweiagovopendata
[2] US DOE DOE H2A Production Analysis accessed May 2016 httpswwwhydrogen energygovh2a_productionhtml
[3] Joseph Pratt Danny Terlip Chris Ainscough Jennifer Kurtz and Amgad Elgowainy H2FIRST reference station design task Technical Report SAND2015-2660 R Sandia National Laboratories April 2015 Available at httpenergygoveerefuelcells h2first
[4] US DOE DOE H2A Delivery Analysis accessed May 2016 httpswwwhydrogen energygovh2a_deliveryhtml
[5] 2016 Annual Evaluation of Hydrogen Fuel Cell Electric Vehicle Deployment and Hydrogen Fuel Station Network Development Technical report California Environmental Protection Agency Air Resources Board July 2016 Available at httpswwwarbcagovmsprog zevproghydrogenhydrogenhtm
[6] E Sutherland and F Joseck Low volume production and delivery cost Technical Report 15011 Department of Energy Hydrogen and Fuel Cells Program Record 2015
[7] Ricardo Guerrero Lemus and Jose Manuel Martinez Duart Updated hydrogen production costs and parities for conventional and renewable technologies International Journal of Hydrogen Energy 35(9)3929ndash3936 2010
[8] Alfredo Ursua Luis M Gandia and Pablo Sanchis Hydrogen production from water elecshytrolysis current status and future trends Proceedings of the IEEE 100(2)410ndash426 2012
[9] G Parks R Boyd J Cornish and R Remick Hydrogen station compression storage and dispensing technical status and costs Systems integration Technical Report NRELBKshy6A10-58564 National Renewable Energy Laboratory (NREL) Golden CO May 2014
[10] NFPA 2 Hydrogen Technologies Code Technical report National Fire Protection Associashytion 2016
45
- Executive Summary
- Acknowledgment
- Contents
- Figures
- Tables
- 1 Introduction
-
- 11 Background and Contents
- 12 Approach
- 13 Method Overview
-
- 2 Station Cost Components
-
- 21 Centrally Produced Hydrogen and Delivery
- 22 Hydrogen Produced On-Site via Steam Methane Reforming
- 23 Hydrogen Produced On-Site via Electrolysis
- 24 Compression Storage and Ancillary Equipment for a Conventional Station
- 25 Packaged Compression Storage and Ancillary Equpiment for a Modular Station
- 26 Hydrogen Dispensers
-
- 3 Results Station Designs and Costs
-
- 31 Conventional Station with Delivered Centrally Produced Hydrogen
- 32 Conventional Station with Hydrogen Produced On-Site via Steam Methane Reforming
- 33 Conventional Station with Hydrogen Produced On-Site via Electrolysis
- 34 Modular Station with Delivered Centrally Produced Hydrogen
- 35 Modular Station with Hydrogen Produced On-Site via Electrolysis
-
- 4 Conclusions
- Appendix A Piping and Instrumentation Diagram
- References
-
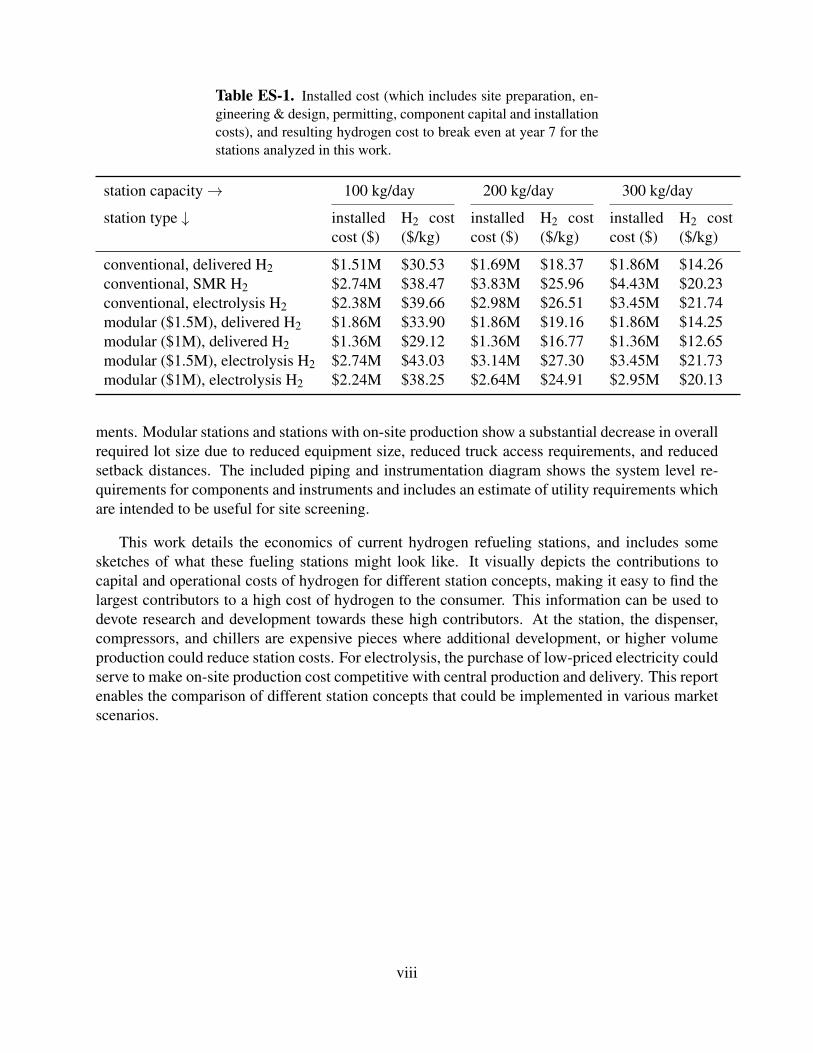
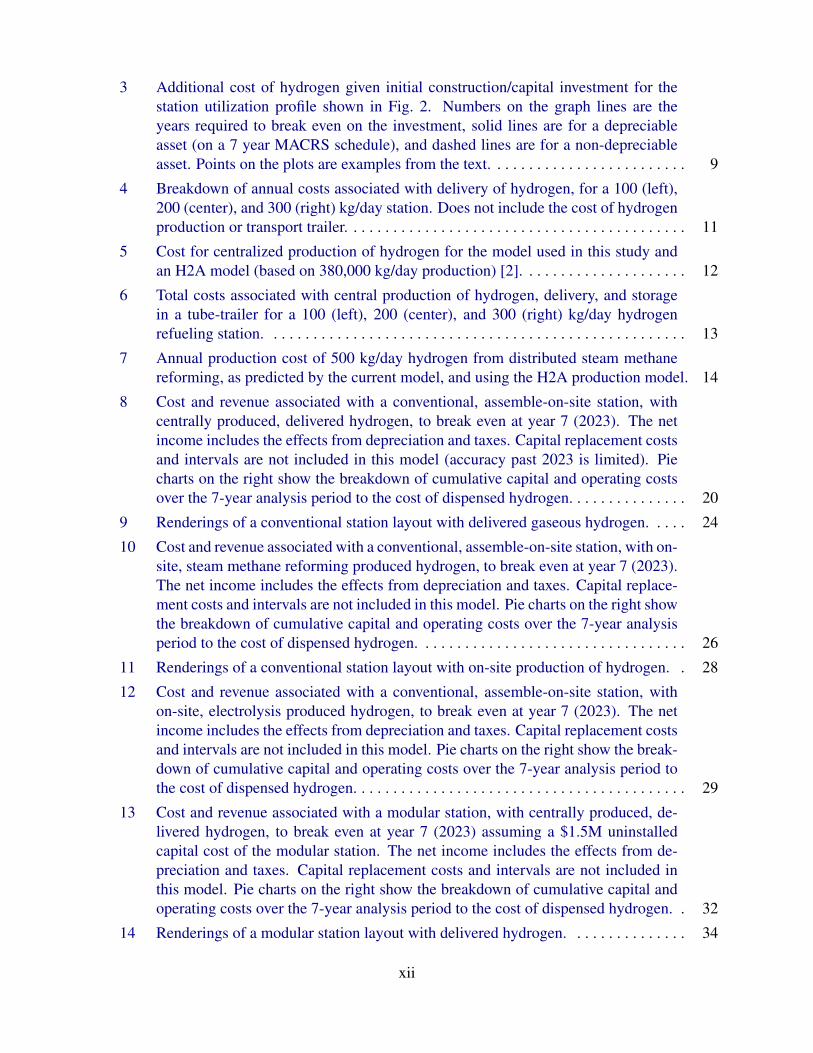
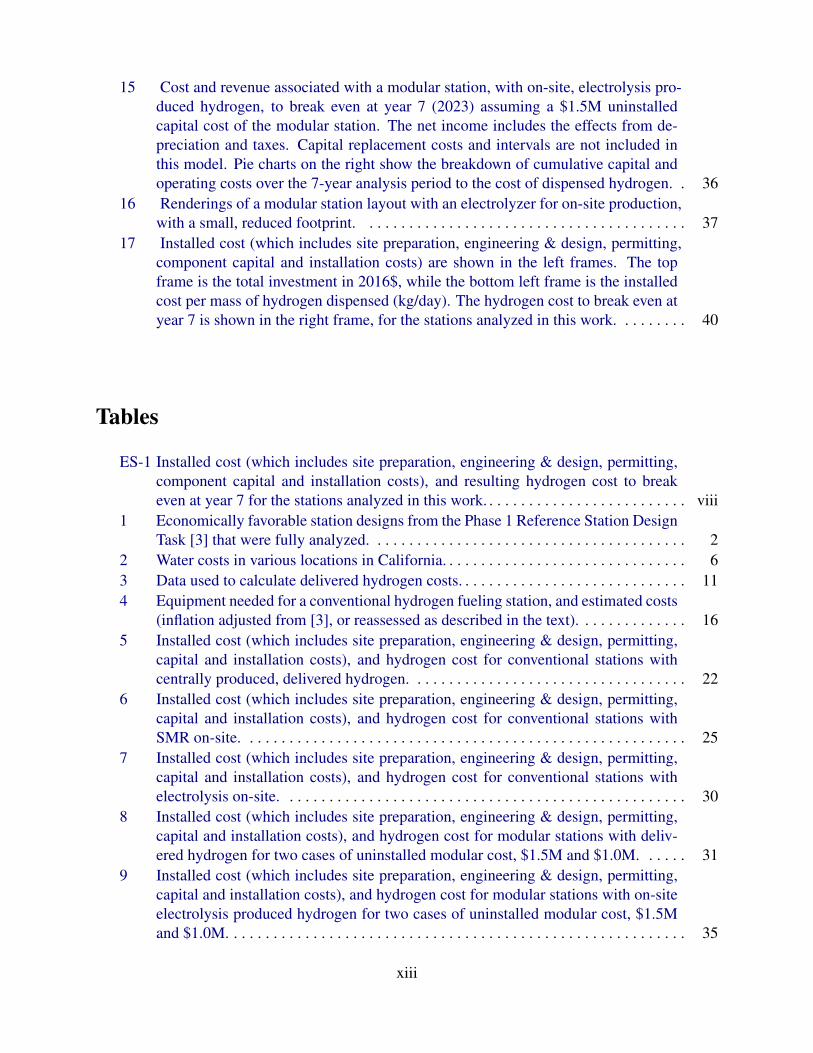
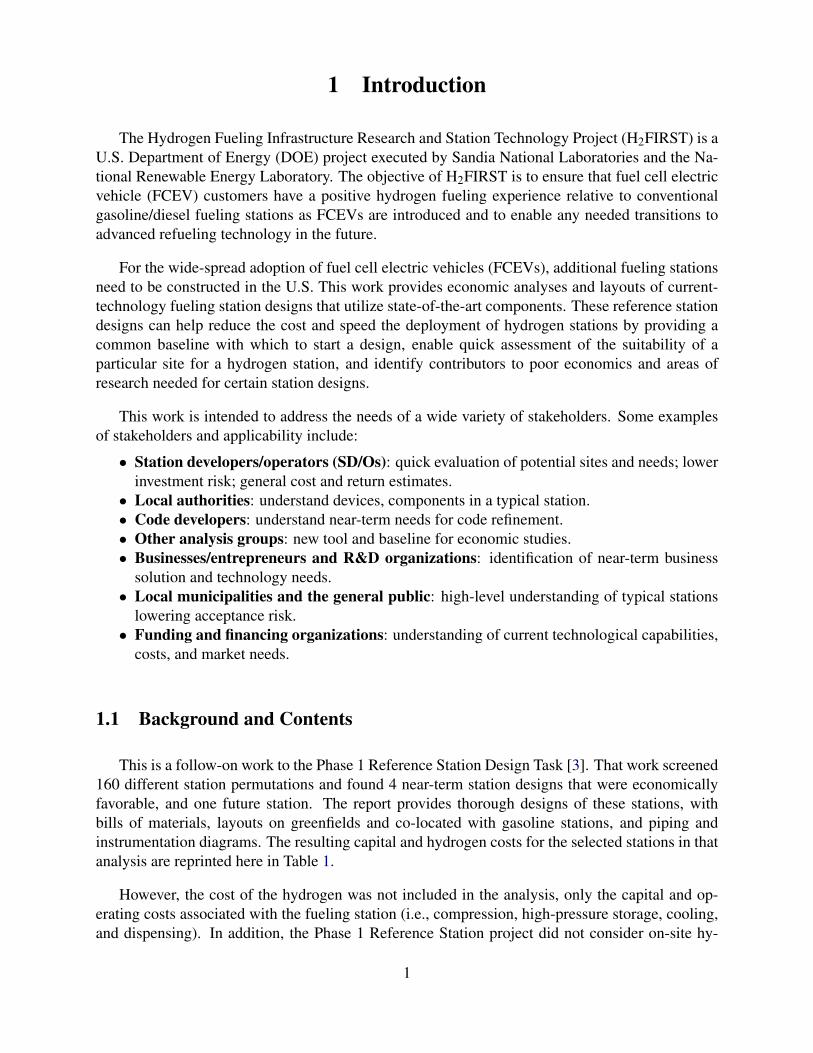
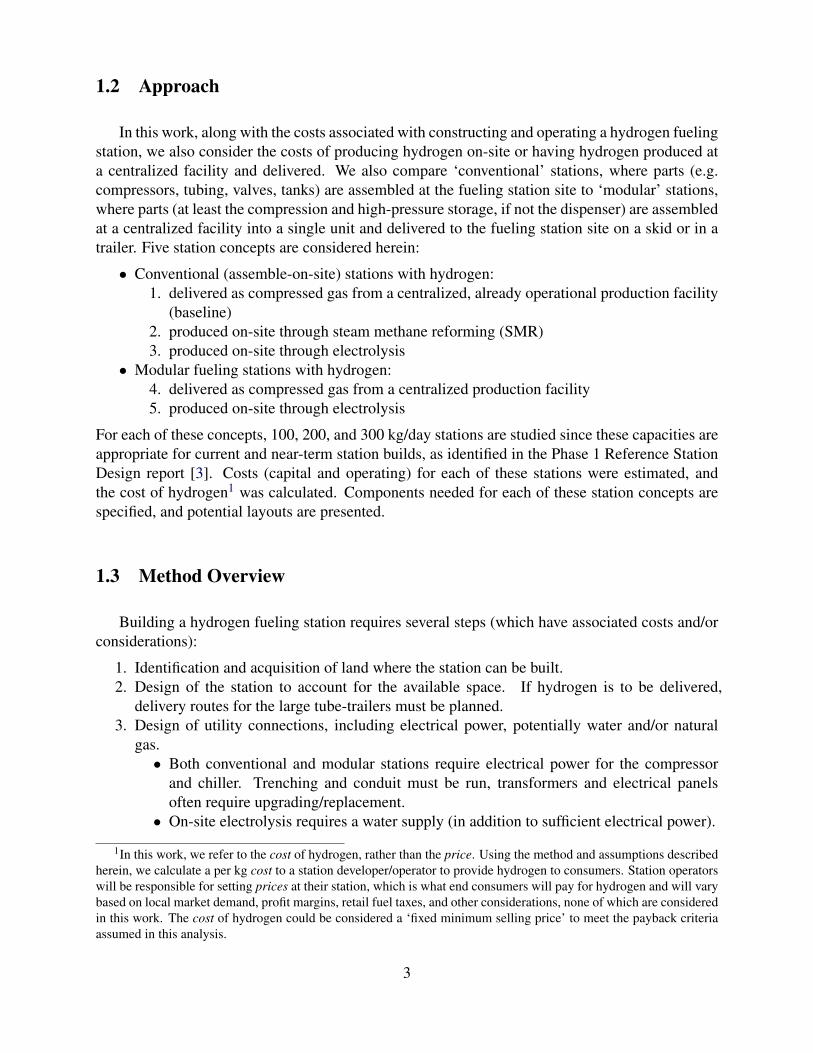
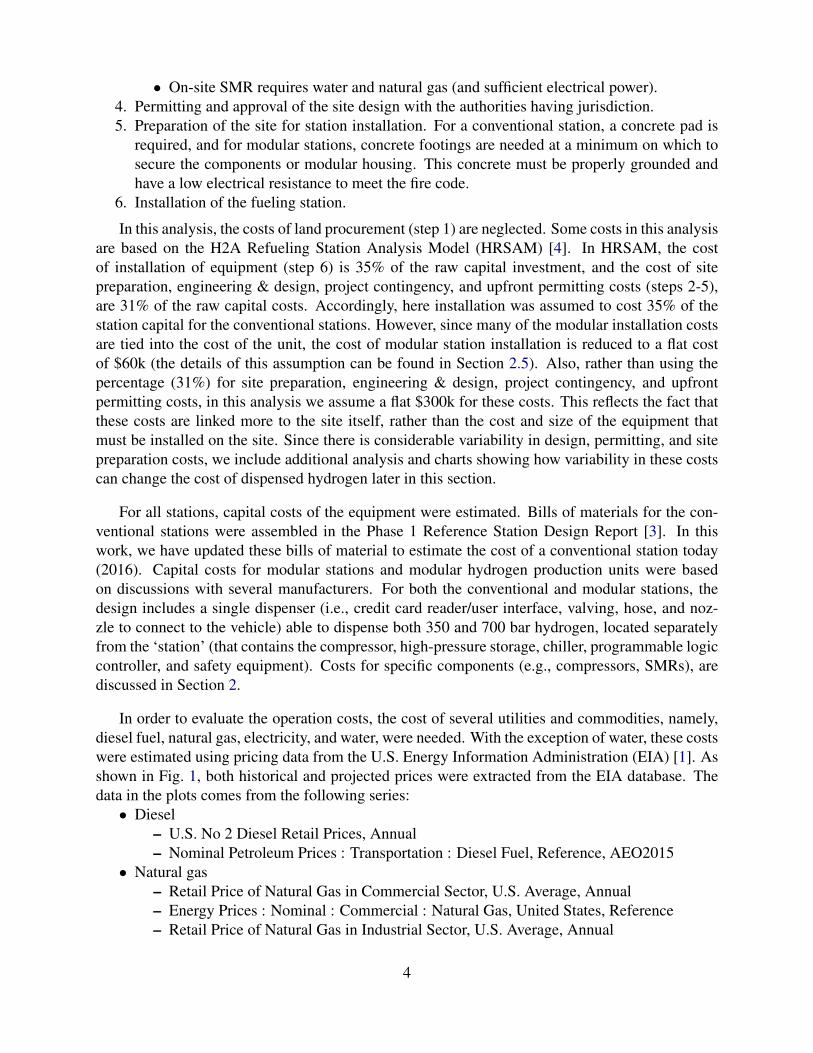
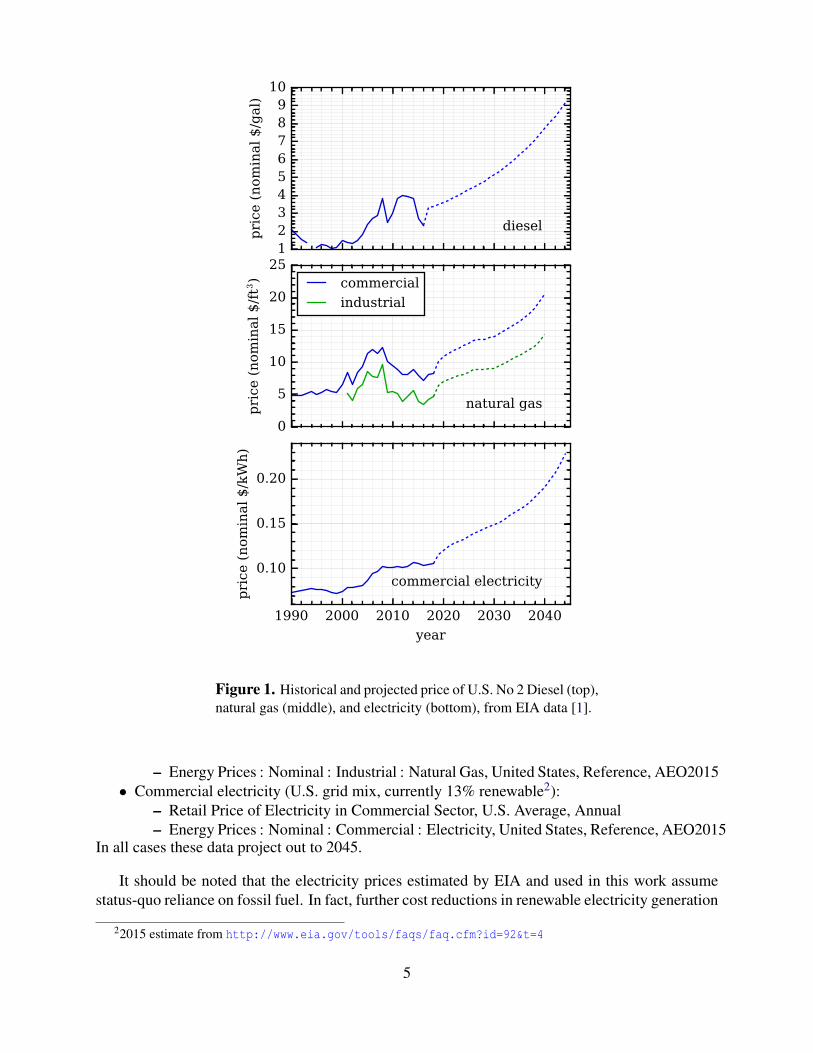
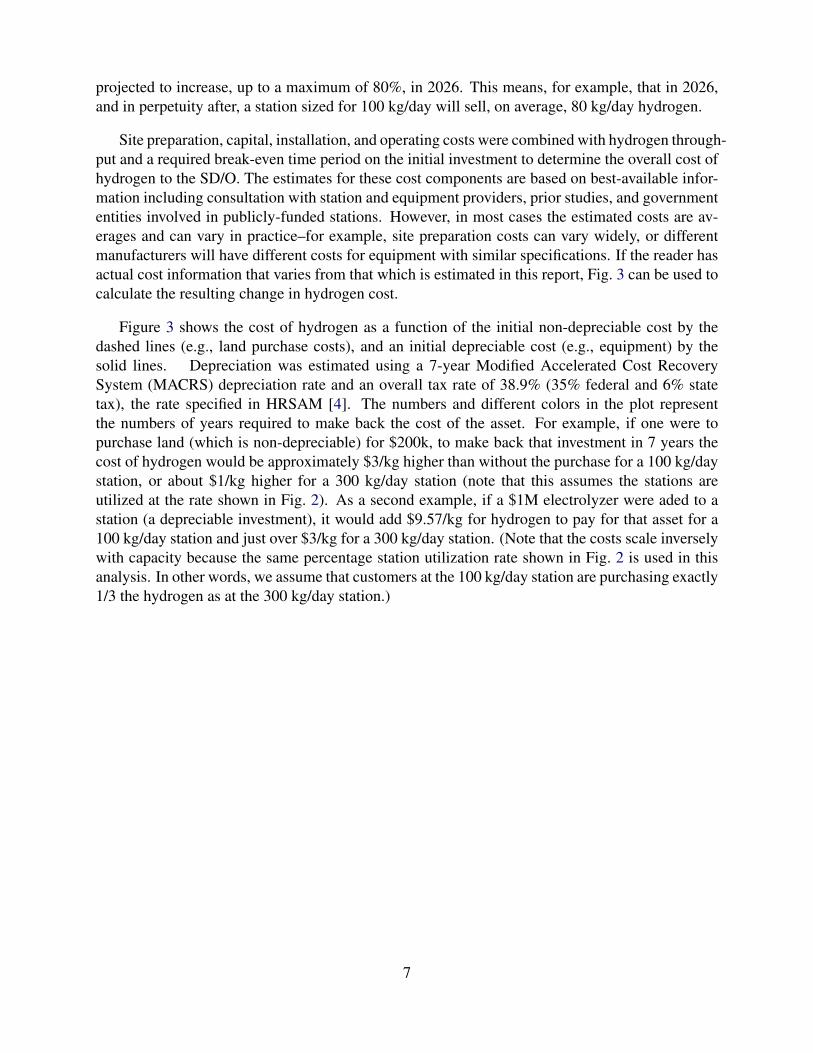
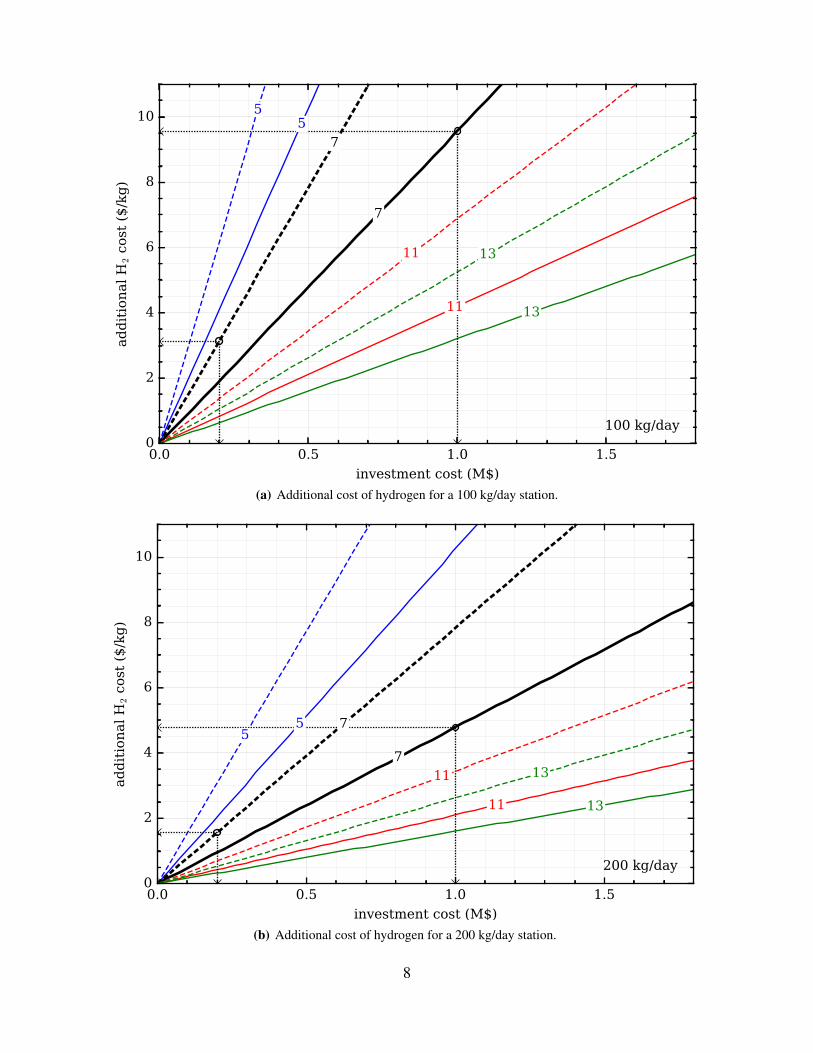
00 05 10 15
investment cost (M$)
0
2
4
6
8
10
ad
dit
ion
al
H2 c
ost
($k
g)
5
5 7
711
11
13
13
300 kgday
(c) Additional cost of hydrogen for a 300 kgday station
Figure 3 Additional cost of hydrogen given initial construcshytioncapital investment for the station utilization profile shown in Fig 2 Numbers on the graph lines are the years required to break even on the investment solid lines are for a depreciable asset (on a 7 year MACRS schedule) and dashed lines are for a non-depreciable asset Points on the plots are examples from the text
9
2 Station Cost Components
This section describes the primary contributors to the cost of hydrogen
bull Centrally Produced Hydrogen and Delivery bull Hydrogen Produced On-site via Steam Methane Reforming bull Hydrogen Produced On-site via Electrolysis bull Compression Storage and Ancillary Equipment for a Conventional Station bull Packaged Compression Storage and Ancillary Equpiment for a Modular Station bull Hydrogen Dispensers
Each subsection describes the technical details of the components and the rational for the assumed costs in the economic model
21 Centrally Produced Hydrogen and Delivery
For delivered hydrogen we included the cost of buying hydrogen from a centrally located production facility delivering it in tube-trailers and leasing tube-trailers for storage at the fueling station Initially the H2A Delivery Scenario Analysis Model (HDSAM) [4] was evaluated for its applicability to this project but this model did not have enough flexibility in its scenarios In this analysis we wanted to consider a single station and not consider savings from multiple station deliveries due to tractortrailer sharing In this analysis we did not model the cost of tractortrailer purchase and payment but rather considered a very early market scenario (ie the current market conditions) where the industrial gas company would own and control the delivery tractors and lease the tube-trailers to the station owners (assuming that they are left on-site until empty) Some of the data from HDSAM was used in this analysis including some parameters shown in Table 3 The delivery distance was assumed to be 200 miles so that delivered hydrogen costs could be compared to estimates from industrial gas companies [6] The trailers were assumed to have 300 kg of usable hydrogen There are some jumbo high-capacity tube-trailers in the market with closer to 1100 kg usable hydrogen3 but for these current market scenario simulations we assumed more conventional tube trailers with steel tubes and the smaller capacity With a 300 kg usable H2 capacity the utilization scenario shown in Fig 2 and a given station capacity were used to calculate the time to consume a tube-trailer The trips per year were calculated and fuel labor and other costs for delivering hydrogen were calculated Frequent deliveries of hydrogen would be necessary and it is likely that a fueling station would need to have multiple tube-trailers on site to ameliorate outages Especially for the 300 kgday station as the peak nameplate capacity is approached it may become infeasible to get daily tube-trailer deliveries and another type of hydrogen storage (ie liquid) or some on-site production would probably be required Nonetheless we performed the analysis with the assumption that the industrial gas companies would be able to provide near daily deliveries of tube-trailers in the out-years
Figure 4 shows the costs components associated with delivering tube trailers to a single station Because each station is assumed to follow the same utilization projections the costs follow the
3httpwwwthe-linde-groupcomennews_and_mediapress_releasesnews_20130925html
10
Table 3 Data used to calculate delivered hydrogen costs
description value
average delivery gas mileage1 6 mpg average delivery speed1 378 mph tube-trailer capacity2 300 kg tube-trailer maximum pressure2 250 bar delivery labor cost1 2121 $hr overhead on labor1 20 insurance cost1 $0106 mile licensing amp permits1 $0116 mile maintenance cost1 $0078 mile lease price3 $3500 month
1 data from HDSAM [4] 2 data from energygov
3 data from personal communications
2020 2025 2030 2035year
050
100150200250300350
deli
very
cost
(k$y
r)
diesellabor
insurancemaintenance
permitting
2020 2025 2030 2035year
diesellabor
insurancemaintenance
permitting
2020 2025 2030 2035year
diesellabor
insurancemaintenance
permitting
Figure 4 Breakdown of annual costs associated with delivery of hydrogen for a 100 (left) 200 (center) and 300 (right) kgday stashytion Does not include the cost of hydrogen production or transport trailer
11
2010
2015
2020
2025
2030
2035
2040
2045
2050
year
1
2
3
4
5
6
7
cost
(n
om
inal
$k
g)
centralized H2 production
current model (commercial NG)
H2A production
current model (industrial NG)
Figure 5 Cost for centralized production of hydrogen for the model used in this study and an H2A model (based on 380000 kgday production) [2]
same increasing trend out to 2026 The continued increase past 2026 is due to inflation which is estimated at 194 and the increasing cost of diesel fuel (Fig 1) This chart shows that labor is the largest contributor to hydrogen delivery costs followed by the cost of diesel to fuel the delivery truck All of these delivery costs scale proportionally if the delivery distance were to be smaller or larger than 200 miles The costs also scale proportionally with the nameplate capacity because the utilization scales with the nameplate capacity causing the larger stations to require proportionately more deliveries labor maintenance etc
Along with delivery costs in this analysis we also include the cost of the centrally produced hydrogen The cost of centrally produced hydrogen was estimated using a correlation from Lemus and Duart [7] Because the central hydrogen production plants that exist today make hydrogen from steam-methane reforming they found that production was linearly dependent on the price of natural gas
H2production cost = 12 middot NGprice + 6
where the cost and price are in $GJ Using the pricing data shown in Fig 1 this centrally produced hydrogen cost was calculated The DOErsquos H2A production model (version 301) [2] is compared to this calculation in Fig 5 using both commercial and industrial costs for natural gas As shown the Lemus and Duart model agrees quite well with the H2A production model until about 2042 Thus the commercial natural gas price was selected for use in further calculations of the costs associated with hydrogen production for conventional delivered hydrogen stations
Finally for delivered centrally produced hydrogen the cost of the tube trailer lease was inshycluded Shown in Table 3 the lease price was estimated at $3500 per month We assumed in
4Inflation rate taken from HRSAM [4]
12
2020 2025 2030 2035year
0100200300400500600700
deli
vere
d H
2 c
ost
(k$y
r)cent productiontube trailer lease
delivery
2020 2025 2030 2035year
cent productiontube trailer lease
delivery
2020 2025 2030 2035year
cent productiontube trailer lease
delivery
Figure 6 Total costs associated with central production of hyshydrogen delivery and storage in a tube-trailer for a 100 (left) 200 (center) and 300 (right) kgday hydrogen refueling station
this analysis that the stations would continually lease 2 tube trailers at $7000 per month so there would be no outages as the empty hydrogen tube trailers were exchanged We assumed that the lease cost was not affected by the number of deliveries required Figure 6 shows the total costs associated with delivered centrally produced hydrogen Within the red delivery bar are all of the costs shown in Fig 4 All three of the costs broken out in the plot (central production tube-trailer leasing and delivery) are significant contributors to the cost of centrally produced delivered hyshydrogen As shown the cost of the tube-trailer lease was fixed in this model for any station capacity resulting in a smaller percentage of the costs for 200 and 300 kgday stations This is far from a certain assumption The high lease price might cause a station operator to think about purchasing a tube-trailer (or fleet of tube-trailers) but the estimated cost of a tube trailer within HDSAM [4] is around $1 million At least two trailers would be required unless the station were shutdown while the tube trailers were being refilled so purchase might not make financial sense without an adshyvanced network of stations andor a long-term financial horizon An additional option to eliminate the trailer lease expense is to install a similar amount of low pressure hydrogen storage on site allowing the trailer to discharge its contents and depart This would add several hundred thousand dollars of capital cost to the station (depending on the amount and type of storage installed)
22 Hydrogen Produced On-site via Steam Methane Reforming
Cost information for on-site reformers was gathered from several manufacturers An estimate for capital cost is $115M for a 100 kgday unit $204M for a 200 kgday unit and $246M for a 300 kgday unit A functional fit was found to several data points including the H2A production model [2] capital cost for a 1500 kgH2day unit which is $325M As with most products the per kg cost of production reduces as the production rate increases
Feedstock consumption rates were also collected from manufacturers for several on-site reshyforming units Based on this information assumed rates of 39 kWhkgH2 96 lH2OkgH2 and 35
13
2010 2015 2020 2025 2030year
0
100000
200000
300000
400000
500000
600000
700000
800000
H2 p
rod
uct
ion
cost
($
)current model
H2A production
Figure 7 Annual production cost of 500 kgday hydrogen from distributed steam methane reforming as predicted by the current model and using the H2A production model
kgNGkgH2 were used to estimate operating costs The operating costs for the H2A production model for distributed SMR scaled down to 500 kgday [2] was compared to the operating costs calculated using the current model (using the cost information shown in Fig 1 and the commershycial price of natural gas) This comparison is shown in Fig 7 The annual operating costs of the current model which is based on recent manufacturer information are within 20 of the H2A model predictions
One factor that is not taken into account in this analysis is startup and shutdown production efficiencies and losses Because SMRs operate at high temperature start-up is slow and frequent shutdownstartup cycles can drastically reduce production efficiency It may be cheaper to simply produce and vent hydrogen continuously rather than cycling the unit off and back on The addishytional cost of running the SMR when it is not needed is not included in this analysis it is assumed that this process occurs instantaneously and without an efficiency penalty The impact of this assumption is that the operational costs of the SMR may be under-predicted by this model
23 Hydrogen Produced On-site via Electrolysis
The two most common type of electrolysis units on the market today are polymer electrolyte membrane (PEM) and alkaline PEM electrolysis units use the same technology as PEM fuel cells (which are found in vehicles) but the cells are biased and protons move in the opposite direction from a fuel cell Alkaline fuel cells have a liquid electrolyte solution that serves to transport ions from the electrodes Alkaline electrolyzers are a more mature technology can be cheaper and may have a longer lifetime than PEM electrolyzers but PEM electrolyzers produce higher purity hydrogen with less sensitivity to water purity are smaller can respond more quickly to changes in production rate and can produce hydrogen at pressure reducing compression needs In this
14
analysis we are not specifying the type of electrolyzer since costs (which are not precisely quoted in any case) are reasonably similar
Electrolyzer electricity consumption was estimated to be 56 kW-hrm3 = 624 kW-hrkgH2H2 There is some variability in electricity consumption depending on each manufacturerrsquos equipment but this value is in line with an analysis by Ursua et al [8] and is the average value from the Electrolyzer Energy composite data product (CDP)5 from NREL The municipal water consumpshytion was calculated as just under 3-times the stoichiometric value required based on the reacshytion (H2O rarr H2 + 12O2) (which accounts for purification system losses and other cooling water needs) at 264 lH2OkgH2 An informal survey of several companies led to capital cost estimates of $800k $12M and $15M for the 100 200 and 300 kgday stations These capital costs are lower than the SMR capital costs used in this analysis for an equivalent hydrogen production capacity For the modular electrolyzer units considered herein the installation cost was assumed to be a flat $60k regardless of the hydrogen production capacity an estimate based on discussions from several companies
Similar to the SMR the efficiency penalty for shutting down the unit and restarting it is not taken into account in this analysis This inefficiency is expected to be lower for electrolysis than SMR since the operation temperatures are much lower and the startup process is simpler Nonetheshyless there will be an efficiency penalty for cycling the electrolyzer off and back on so the elecshytrolyzer and storage sizes need to be optimized for the station utilization rates during station design
24 Compression Storage and Ancillary Equipment for a Conventional Stashytion
For conventional stations most equipment costs from Phase 1 of the reference station design report [3] were used in this analysis Shown in Table 4 costs for all but the compressor dispenser and chillercooling block were inflation adjusted from 2009$ to 2016$ at a 19 inflation rate The cost of the compressor was not simply inflated but rather re-estimated using the compressor size evaluated by HRSAM [4] and Fig 2 from the Phase 1 Reference Station Design report [3] The $100kndash$150k capital cost estimates for the compressors given in the first report were based on a specific station design with a smaller compressor rather than the compressor sizing evaluated by HRSAM The HRSAM estimates for compressor needs for the 100 200 and 300 kgday stations are 6 14 and 23 kghr as shown in the table Compressor energy consumption was assumed to be 42 kWhrkgH2 This is consistent with NRELrsquos Compressor Energy CDP6 and manufacturer specifications This factor was used to calculate the energy utilization and size the compressors at 25 60 and 100 kW for the 100 200 and 300 kgday stations respectively The electrical requirements are a bit more than those calculated by HRSAM which assumes that the compressors have a 65 isentropic efficiency but correspond well with literature [9] and manufacturer data
As with the Phase 1 report [3] the compressor is the only variable cost in different-sized station
5httpwwwnrelgovhydrogenimagescdp_infr_36jpg 6httpwwwnrelgovhydrogenimagescdp_infr_35jpg
15
Table 4 Equipment needed for a conventional hydrogen fuelshying station and estimated costs (inflation adjusted from [3] or reshyassessed as described in the text)
description quantity cost total tanks [13 kg each 945 bar MAWP Type II] 3 $45633 $136899 pressure transducer and indicator 6 $1141 $6845 block and bleed valve 6 $570 $3422 air operated valve 6 $2282 $13690 pilot solenoid valve 7 $57 $399 isolation hand valve 12 $570 $6845 check valve 3 $456 $1369 coolant pump 1 $1369 $1369 water chiller 2 $4563 $9127 coolant filter 1 $57 $57 instrument air compressor 1 $1141 $1141 instrument air dryer and filter 1 $2909 $2909 hydrogen compressor [2-stage 950 bar outlet]
100 kgday station - 6 kghr 25 kW $189827 $189827 200 kgday station - 14 kghr 60 kW 1 $328774 $328774 300 kgday station - 23 kghr 100 kW $453010 $453010
hydrogen dispenser [(1) 350 bar and (1) 700 bar hose] 1 $250000 $250000 hydrogen chiller and cooling block 1 $150000 $150000 IR flame detector 2 $1711 $3422 hydrogen filter 1 $2852 $2852 PLC 1 $5704 $5704 tubing - $22817 $22817 fittings - $17112 $17112 electrical upgrades - $57041 $57041 fencing - $5704 $5704 bollards - $5704 $5704
total (100 kgday station) total (200 kgday station) total (300 kgday station)
$894256 $1033203 $1157439
16
designs The developers of HRSAM [4] found the minimum size of the commonly available high pressure ground storage tanks to be 13 kg and three of these are needed for a cascade fill giving a minimum installed high-pressure storage amount of 39 kg This size was found to be sufficient for each station modeled in this work Since each station only has a single dispenser that cost also remains constant Using the varied compressor costs the conventional station equipment costs range from $900k to $12M
Costs for the hydrogen dispenser and the hydrogen chiller and cooling block were separated out and updated in this report where they were lumped together in the previous report The chiller and cooling block was estimated to cost $150k while the dispenser was estimated at $250k These costs are based on discussions with manufacturers and station operators who have purchased these pieces of equipment and are 15 higher than the estimated $350k combined cost in the previous report Part of the reason for this update is the evolution of dispenser design from an industrial-type interface to one that provides a retail customer experience more similar to that at a gasoline station and the associated cost of these newer dispensers
One high cost subsystem shown in Table 4 is the hydrogen compressor where cost savings can be realized by reducing the size of the compressor However the compressor size needs to be balanced by the high pressure storage and station utilization The hydrogen dispenser is also a significant cost as production volume increases on the components needed in the dispensers and the assembled dispensers this cost will likely decrease The same number and type (or at least cost) of dispenser valves pumps filters tanks tubing safety equipment etc are needed for the 100 kgday station as the 200 and 300 kgday stations
25 Packaged Compression Storage and Ancillary Equpiment for a Modushylar Station
Modular stations have the compressor hydrogen cooling block chiller high-pressure storage and control electronics housed in andor on a single container Manufacturing and installing these components in this way reduces installation labor allows leak and operation checking at a dedishycated facility and can potentially reduce equipment costs by enabling high volume production of standardized components Most station designers and companies are currently producing modular units and having at least some components in a modular shippable fashion is the preferred way of constructing stations at this time Our research shows that the primary savings associated with modular stations are in the installation costs Based on conversations with manufacturers capital costs of modular stations are currently on par with conventional stations This is likely because much of the same equipment is used in both types of stations We estimate modular fueling stations to cost between $750k to $15M depending on the manufacturer and whether or not a dispenser is included This price range is for a unit that can compress and provide 200-400 kgday hydrogen and spans the $890k-$12M capital cost range of the conventional station equipment While inshystallation of conventional stations is expected to be about 35 of capital costs [4] installation of equipment for a modular station is expected to be very low likely no more than 5 of the capital costs of the modular unit In this report installation cost was estimated to be $60k regardless of
17
station size the same as the electrolyzer unit installation costs since the installation requirements are similar
Most manufacturers make just one size of modular units so there might not be potential to save by having a smaller nameplate capacity In this analysis we provide estimates for total station costs for two cases of modular unit costs ($1M and $15M) to elucidate the effect of differing capital costs These costs are assumed to include the cost of the dispenser even though is is shown as being separated from the modular system in the layout sketches In the analysis below these two different costs are also used as a further example to show how Fig 3 can be used to adjust resulting hydrogen cost to account for variability in capital cost estimates
26 Hydrogen Dispensers
Both the modular and conventional on-site station components need to interface with a disshypenser The dispenser includes valving high pressure break-away(s) hose(s) nozzle(s) flow meshytering control electronics and a customer interface (point of sale system) Stations often provide both 350 and 700 bar fills requiring two hoses break-aways nozzles and additional plumbing and control electronics Dispensing units range in price from approximately $150k-$350k For a high utilization area where one would want to allow multiple simultaneous fills the cost of additional dispensers would need to be factored into an analysis In this analysis both the conventional stashytion and modular station total cost estimates include the cost of a single dispenser with both a 350 and 700 bar hose
18
3 Results Station Designs and Costs
Multiple approaches exist to financially model fueling stations and determine the cost of hydroshygen One approach is to perform a discount cash flow analysis specifying a return on investment that is desired after a given time-frame This is the approach taken in HRSAM [4] and used in the Phase 1 Reference Station Design report [3] Specifying a 30 year analysis period and a discount rate of 15 the cost of hydrogen was determined for the different station designs These specishyfications led to a payback period (break-even time) of approximately 75 years In this work an alternative approach to the discount cash flow analysis was used wherein we calculated the cost of hydrogen considering a 7-year payback period A solution for the cost of hydrogen is found such that the sum of all costs and revenues is zero at the end of a 7-year period By taking this approach we do not need to include replacement costs for components over the entire 20 or 30 year discount cash flow analysis we only need to include replacement costs for components that need to be replaced within 7-year time-frame While some maintenance costs will be required over this 7 year time-frame we assume that no major component of the fueling station would need to be replaced in this period The validity of this assumption varies with equipment type manufacturer and duty cycle We project station costs and incomes out 20 years in this analysis but these results are missing capital replacement costs
As discussed earlier site-preparation costs can vary widely In this analysis we assume a flat $300k to cover the site-preparation including engineering and design permitting and a project contingency The cost to install the conventional components is assumed to be 35 of the capital cost while the cost to install the modular stations electrolyzer or SMR units is assumed to be $60k regardless of unit size or station capacity It should be noted that should any of these assumed costs be different from a real-world station build the black lines in the chart of Fig 3 can be used to determine the resulting change in the cost of hydrogen for the 7-year payback period For example if the site preparation costs $600k rather than the assumed $300k one could use Fig 3 to determine that for a depreciable asset7 the excess $300k would add nearly $3kg to the cost of hydrogen for a 100 kgday station or approximately $1kg to the cost for a 300 kgday station
It is assumed that the station construction takes one year (the year of 2016) and utilization begins the following year (2017) at the rate shown by Fig 2 Just like the analysis that was used to generate Fig 3 when calculating the cost of hydrogen depreciation was estimated using a 7-year Modified Accelerated Cost Recovery System (MACRS) depreciation rate and an overall tax rate of 389 (35 federal and 6 state tax)
31 Conventional Station with Delivered Centrally Produced Hydrogen
Figure 8 shows the cost and revenue model for a conventional assemble-on-site station with delivered hydrogen In 2016 there is no revenue and the costs for building the station are incurred The capital of the station (green bar) is the largest contributor to costs in 2016 The 35 of capital
7Site preparation is likely considered depreciable because it is preparing the land for business use and is closely associated with the station equipment
19
site prep
94
stati
on
cap
ital
280
stationinstall 98
deliv
ered
H 232
6
labor
65
maintenance
118
electricity19
-2000
-1500
-1000
-500
0
500
1000
1500
2000co
st o
r re
ven
ue (
k$
yr)
tax
site preparationstation capitalstation install
delivered H2labor
maintenanceelectricity
revenue ($3053kg)net income
100 kgday
site prep
78
stat
ion
capit
al
269
stationinstall 94
deliv
ered
H 237
6
labor
54
maintenance
98
electricity31
-2000
-1500
-1000
-500
0
500
1000
1500
2000
cost
or
reve
nu
e (
k$
yr)
tax
site preparationstation capitalstation install
delivered H2labor
maintenanceelectricity
revenue ($1837kg)net income
200 kgday
site prep
67
stat
ion
capit
al
259
station
install 91
deliv
ered
H 2
413
labor
46
maintenance
84
electricity40
2020 2025 2030 2035year
-2000
-1500
-1000
-500
0
500
1000
1500
2000
cost
or
reve
nu
e (
k$y
r)
tax
site preparationstation capitalstation install
delivered H2labor
maintenanceelectricity
revenue ($1426kg)net income
300 kgday
conventional delivered H2
Figure 8 Cost and revenue associated with a conventional assemble-on-site station with centrally produced delivered hydroshygen to break even at year 7 (2023) The net income includes the effects from depreciation and taxes Capital replacement costs and intervals are not included in this model (accuracy past 2023 is limshyited) Pie charts on the right show the breakdown of cumulative capital and operating costs over the 7-year analysis period to the cost of dispensed hydrogen
20
costs needed to install the station (red bar) and the $300k site preparation cost (blue bar) make up the balance As discussed earlier land costs are not included in this analysis and site preparation costs can vary quite widely Figure 3 should be used to calculate the change in the cost of hydrogen given any land purchase costs differences in real-world capital or site preparation costs The total installed station costs range from $15M to $19M for the 100 to 300 kgday stations
In 2017 as hydrogen begins to sell at the station revenue begins to roll in but operating costs are also incurred The largest incurred operation cost is the hydrogen fuel supply including the cost of production delivery and storage at the station represented by the light blue bar in Fig 8 This cost increases as the utilization of the station increases (due to more hydrogen required by the station) until 2026 when utilization stabilizes After 2026 the delivered hydrogen costs continue to increase solely due to inflation Contributors to the hydrogen production delivery and tube-trailer storage (labeled delivered H2 in Fig 8) are shown by Figs 4 and 6 and are discussed in Section 21
The purple labor bar in Fig 8 makes up a small percentage of the operating costs This value is calculated using a labor rate of $1370 hr in 2016$ the default rate in HRSAM [4] This labor rate is fixed regardless of the size of the station or the amount of hydrogen sold Maintenance shown by the yellow bar is a slightly larger operating cost contributor Maintenance was estimated at $50kyr (in 2016$ with increases due only to inflation over time) regardless of the station size Maintenance costs can vary quite widely from station to station and from quarter to quarter but this number is near the average annual cost suggested by NRELrsquos Maintenance Costs Over Time CDP8
Electrical costs to run the compressor and chiller at the station make up the balance of the operational cost in Fig 8 shown by the slim gray bar The average compressor energy usage at stations is 42 kW-hrkgH2 according to the Compressor Energy CDP9 from NREL An additional 20 of the compressor energy use was assumed for the refrigeration energy use a factor consistent with HRSAM [4] The cost for electricity shown in Fig 1 was used with this assumed compression and refrigeration energy use to calculate the cost of electricity at the station This cost increases with the amount of hydrogen dispensed and is approximately the same as the maintenance costs for the 300 kgday station after the 80 utilization rate is reached in 2026 For the 200 and 100 kgday stations the electricity usage is proportionately less
For each of the three stations the cost of hydrogen was calculated such that the capital and operating costs were recovered by revenue over 7 years Shown in Fig 8 and tabulated in Table 5 the cost of hydrogen is $3053kg $1837kg and $1426kg for the 100 200 and 300 kgday stations respectively The decrease in hydrogen cost with increasing station capacity is consistent with the Phase 1 Reference Station results [3] and is because the increased revenue from hydrogen sales more than compensates for the increased cost of capital due to the larger station capacity The decreasing hydrogen cost with station capacity also shows a trend of diminishing returns also consistent with the Phase 1 work [3] and increasing the capacity further will not decrease the hydrogen cost so dramatically In fact increasing station capacity will eventually result in
8httpwwwnrelgovhydrogenimagescdp_infr_30jpg 9httpwwwnrelgovhydrogenimagescdp_infr_35jpg
21
Table 5 Installed cost (which includes site preparation engishyneering amp design permitting capital and installation costs) and hydrogen cost for conventional stations with centrally produced delivered hydrogen
capacity (kgday) installed cost ($) H2 cost ($kg)
100 $151M $3053 200 $169M $1837 300 $186M $1426
added capital not considered in this analysis such as multiple dispensers and associated hydrogen chilling equipment additional high pressure cascade storage and additional compressors as station capacity exceeds the throughput of available single compressors
The net income is shown by the purple lines in Fig 8 In 2016 the net income (which is actually an expense in this year without revenue) is not quite the entire capital costs This is due to the depreciation deduction (tax credit) on the capital investment shown by the brown bar In 2017 the net income is slightly greater than the revenue generated by selling hydrogen Once again this is the depreciation deduction on the capital investment which is occurring on a 7 year schedule The overall net expenses and income in all cases reaches a summed value of zero in year 7 (2023) and all income after that point would be earned by the investor (although as stated earlier replacement intervals of equipment are not included in this analysis) Including capital replacement costs would not affect the revenue but would affect the costs in replacement years the tax burden (as this replaced equipment depreciated) and net income in the years past 2023 For all three capacity stations the net income increases (due to inflation and varying operating costs) from about $300-400k year in 2024 to $500-600k yr in 2036
The pie charts on the right in Fig 8 show the contribution from the capital and operating costs over the 7 year payback period to the cost of hydrogen For the 100 kgday station the delivered hydrogen is the largest contributor at 33 followed by the station capital (28) Maintenance is also a large contributor to the cost of hydrogen responsible for 12 of the $3053kg Site preparation and station installation costs are each responsible for roughly 95 of the hydrogen cost Labor accounts for 65 of the hydrogen cost and electricity to run the compressor and chiller is a small contributor at only 2 Overall taxes do not have a net effect on the cost of hydrogen (and therefore do not appear in the pie charts) due to the fact that the capital investment is depreciating on a 7 year schedule providing tax credits in the early years and the fact that we are specifying the cost of hydrogen based on the operator breaking even on their investment in year 7 If we were to determine the cost of hydrogen using a different criterion or if there were capital investments that were not depreciating (or depreciating on an alternative schedule) taxes would have a role in the cost of hydrogen Taxes will also have an impact on the revenue and return on investment over a longer analysis period Note that in this analysis we are not considering the tax to the consumer that is placed on the dispensed fuel
Comparison of the pie charts in Fig 8 shows that as the station capacity increases the stashy
22
tion capital reduces slightly as a percentage of the hydrogen cost while the delivered hydrogen increases its share of the hydrogen cost However the overall cost of delivered hydrogen reduces with increasing capacity from $995kg for the 100 kgday station down to $589kg for the 300 kgday station Electricity on the other hand while increasing as a percentage of the hydrogen cost with increasing capacity contributes approximately $057kg to the cost of hydrogen regardless of the station capacity because the same amount of energy is required to compress and chill each dispensed kg of hydrogen
Figure 9 shows how a conventional station with delivered hydrogen might be organized on a site This is nearly the same layout sketched in the previous reference station design report [3] As with the previous layout the air compressor dryer and cooling water equipment are located near the convenience station so that the air compressor inlet is at least 45 feet away from the hydrogen trailers a prescriptive requirement of NFPA 2 [10] This also prevents this equipment outside the wall from requiring electrical classification The equipment in this layout is spaced out and one could probably devise a smaller footprint The largest contributors to the space requirement are the two tube trailers on-site which would be necessary to prevent interruptions in service The tube trailers drawn are 40rsquo long and sufficient space and delivery routes need to be designed into the layout so that the drivers can drop them off and pick them up
Cost of Delivered Hydrogen
To gain insight into the cost of delivered hydrogen its contribution to the overall cost of hyshydrogen was removed and the overall cost was recalculated Without the delivered hydrogen cost the cost of hydrogen would be $2058 $1147 and $837 for the 100 200 and 300 kgday stashytions respectively The difference between these two scenarios results in delivered hydrogen costs of $995 $690 and $589 per kg Note that these costs includes the leasing two tube-trailers for storage on-site and the cost of delivered centrally produced hydrogen (without the cost of the tube-trailer lease) is $387kg for all three capacity stations The delivered hydrogen cost of $6ndash 10kg is in line with the $6ndash$8kg (in 2014$) reported by Sutherland and Joseck [6] for centrally produced delivered hydrogen of 500ndash1000 kgmonth with a delivery distance of up to 200 miles The delivery distance (assumed to be 200 miles in this analysis) will have a large impact on the cost of delivered hydrogen proportionately changing all of the associated delivery costs shown in Fig 4 which are cumulatively shown as the red bar in Fig 6 The tube-trailer lease price to store hydrogen on-site which is fixed for all three capacity stations is responsible for the decreasing cost of the centrally produced delivered and stored hydrogen as the station capacity increases By having a higher throughput of hydrogen the larger capacity stations are able to spread the cost of the tube trailer lease over a greater quantity of dispensed hydrogen
Comparison of Costs to Previous Study
Neglecting the cost of the delivered hydrogen also allows a comparison to the results of the Phase 1 Reference Station Design report [3] The calculated hydrogen costs without production
23
conveniencestore
50 0
dispenser island
H2 cooling blockH2 chiller
gas panel
high pressure H2storage
compressorwater chillerair compressor
tube trailer
168 0
140
0
30 0
Figure 9 Renderings of a conventional station layout with delivshyered gaseous hydrogen
24
and delivery of $2058 $1147 and $837 are higher than the Phase 1 calculated costs of $1328 $782 and $603 for the 100 200 and 300 kgday stations (shown in Table 1) Several factors contribute to the differences in the calculated fuel cost First the installed capital costs of $15M $17 and $19M in this analysis are higher than those calculated previously of $11M $12M and $13M (even after adjusting for inflation) Second the previous analysis used HRSAM in which the operating costs are calculated a bit differently than this analysis Finally in the previous analshyysis the criteria for hydrogen cost was a 15 discount rate based on a 30 year analysis period which led to a 75 year payback period In this analysis the payback period was set to exactly 7 years (and the discount rate was not considered) If in this analysis the capital costs are reduced to match the previously reported capital costs ($11M $12M and $13M) and the payback period is extended from 7 to 75 years the cost for dispensed hydrogen (without including the cost of hydrogen production and delivery) is calculated as $1521 $823 and $590 for the 100 200 and 300 kgday stations respectively These costs are within 15 of the HRSAM values found in the previous analysis The differences in this case must all be attributed to the second cause of differshying assumptions on operation costs in this analysis method vs the HRSAM method This exercise shows that the economic assumptions in this analysis are in-line with the HRSAM assumptions albeit not exactly the same This exercise also demonstrates that solving for the hydrogen cost to match a payback periodndashas long as that payback period is less than the capital replacement interval on partsndashis a valid alternative to the discount rate analysis used in HRSAM
32 Conventional Station with Hydrogen Produced On-site via Steam Methane Reforming
The costs and revenue for a conventional assemble-on-site station with an on-site steam methane reformer to produce hydrogen are shown in Fig 10 with the installed costs and cost of hydrogen tabulated in Table 6 Inspection of the capital costs incurred in 2016 shows that the largest conshytributor is the SMR unit itself As discussed in Section 22 these SMR units are estimated to cost from just over $1M for a 100 kgday capacity to just under $25M for a 300 kgday capacity Usshying Fig 3 adding a $1M capital investment (depreciable) to a 100 kgday station will add nearly $10kg to the cost of hydrogen to make back that investment in 7 years But for the 100 kgday stashytion with on-site SMR the $3847kg cost of hydrogen is only about $8 higher than the $3053kg for the conventional station with delivered hydrogen The hydrogen cost is calculated based on
Table 6 Installed cost (which includes site preparation engishyneering amp design permitting capital and installation costs) and hydrogen cost for conventional stations with SMR on-site
capacity (kgday) installed cost ($) H2 cost ($kg)
100 $274M $3847 200 $383M $2596 300 $443M $2023
25
site
pre
p
75
station
capital
222
stationinstall 78
SMR c
ap
292
SM
R in
st
15
labor
51
SMR elec
12 natural gas
45 water
07
maintenance188
stat
ion
elec
tric
ity
15
-3000
-2000
-1000
0
1000
2000
3000co
st o
r re
ven
ue (
k$
yr)
tax
site preparationstation capitalstation installSMR capitalSMR install
laborSMR electricity
natural gaswater
maintenancestation electricity
revenue ($3847kg)net income
100 kgday
site
pre
p
55
statio
n
capita
l190
stationinstall 67
SMR c
ap
382
SM
R inst
11
labor
38 SMR elec
17 natural gas
67water
11
maintenance
139
stat
ion
elec
tricit
y
22
-4000
-3000
-2000
-1000
0
1000
2000
3000
4000
cost
or
reve
nu
e (
k$
yr)
tax
site preparationstation capitalstation installSMR capitalSMR install
laborSMR electricity
natural gaswater
maintenancestation electricity
revenue ($2596kg)net income
200 kgday
site
pre
p
47
statio
nca
pita
l182
stationinstall 64
SMR c
ap
395
SM
R in
st
09
labor
33
SMR elec
22
natural gas
86water
14
maintenance
119
stat
ion
elec
tricit
y
28
2020 2025 2030 2035year
-6000
-4000
-2000
0
2000
4000
6000
cost
or
reve
nu
e (
k$y
r)
tax
site preparationstation capitalstation installSMR capitalSMR install
laborSMR electricity
natural gaswater
maintenancestation electricity
revenue ($2023kg)net income
300 kgday
conventional SMR on-site
Figure 10 Cost and revenue associated with a conventional assemble-on-site station with on-site steam methane reforming produced hydrogen to break even at year 7 (2023) The net inshycome includes the effects from depreciation and taxes Capital replacement costs and intervals are not included in this model Pie charts on the right show the breakdown of cumulative capital and operating costs over the 7-year analysis period to the cost of disshypensed hydrogen
26
both capital and operating costs so we can conclude that the operating costs for the 100 kgday SMR are less than the operating costs for the 100 kgday delivered hydrogen station In addition to the common costs for labor station maintenance and station electricity the station with the SMR unit has a nominal operating cost for water for the SMR unit (nearly indistinguishable green bar) requires electricity and natural gas to run the unit (shown by the blue and black bars) and requires additional maintenance over the conventional station with delivered hydrogen (included in the red bar) Maintenance for the SMR unit is assumed to be $50kyear bringing total station maintenance costs to $100k yr However the sum of these costs is less than the cost to deliver and store censhytrally produced hydrogen for the 100 kgday station Operating costs for the SMR station neglect the inefficiencies in shutdownstartup cycles (or venting excess hydrogen) when production is not matched by demand which would further increase costs
The cost of hydrogen for the conventional 100 200 and 300 kgday stations with on-site SMR are $3847kg $2596kg and $2023kg These costs are 26 41 and 42 higher than the costs of hydrogen for a conventional station with delivered gaseous hydrogen As discussed the increased cost of hydrogen comes from the high capital costs for the on-site SMR units slightly offset by a reduced operating cost This can be seen by inspecting the pie charts on the right side of Fig 10 where the SMR capital costs is the largest contributor to the cost of hydrogen accounting for approximately 30-40 of the hydrogen cost For the 200 and 300 kgday stations the capital costs of $2M and $25M add approximately $10kg and $8kg While the operating costs for these stations are lower than the same capacity delivered hydrogen stations these differences fail to decrease the cost of hydrogen to the same level as the delivered hydrogen station Overall this analysis would suggest that while there may be some advantages to utilizing on-site SMR there is not much of a financial case to produce hydrogen on-site using steam methane reforming rather than having hydrogen delivered for 100-300 kgday hydrogen refueling stations unless the capital cost can be reduced significantly
A station with an on-site SMR unit could have a smaller footprint than a station with delivered hydrogen One potential layout is shown in Fig 11 By replacing the tube trailers with an SMR unit significantly less space is required for the fueling station components (compare to Fig 9) Since all hydrogen is produced on-site delivery routes can also be neglected from consideration and walls can enclose all of the hydrogen components reducing setback distances on all sides The SMR unit is shown as being housed in a 20 ft ISO container footprint although to produce 300 kgday it may be possible to have a smaller footprint and even smaller for the stations that only require 100 or 200 kgday For on-site SMR the fueling station components (eg compressor high pressure storage) take up relatively more space than the low pressure hydrogen source (because the SMR is much smaller than the two tube trailers) and laying out these components in a compact manner is important in space-constrained sites
33 Conventional Station with Hydrogen Produced On-site via Electrolysis
Conventional stations with on-site electrolysis have the costs and revenues shown in Fig 12 The installed capital costs and hydrogen costs at each of the three stations are tabulated in Table 7 Similar to the conventional station with a steam methane reforming unit on-site each of these
27
30 0
50 0
154 0
100
0
conveniencestore
dispenser island
compressor
high pressure storagegas panel
H2 chillerH2 cooling block
air compressorwater chiller
20 ft ISO container(electrolyzer or SMR)
Figure 11 Renderings of a conventional station layout with on-site production of hydrogen
28
site prep
72
stat
ion
capit
al
216
station
install 75
eleccapital 197
elec
install
14
elec
el
ectr
icity
177
wate
r02
lab
or
50
maintenance
182
stationelectricity
14
-3000
-2000
-1000
0
1000
2000
3000co
st o
r re
ven
ue (
k$
yr)
taxsite preparationstation capitalstation installelec capitalelec install
elec electricitywater
labormaintenance
station electricity
revenue ($3966kg)net income
100 kgday
site prep
54
stat
ion
capi
tal
186
statio
n
insta
ll65
eleccapital 221
elec
install11
elec
el
ectr
icit
y26
5
water
03
labor
37
maintenance
136
stationelectricity
21
-3000
-2000
-1000
0
1000
2000
3000
cost
or
reve
nu
e (
k$
yr)
taxsite preparationstation capitalstation installelec capitalelec install
elec electricitywater
labormaintenance
station electricity
revenue ($2651kg)net income
200 kgday
site prep44
stat
ion
capi
tal
170
stati
on
inst
all
59
elec
capital 224
elecinstall
09
elec
el
ectr
icit
y32
3
water
04
labor
30
maintenance
111
stationelectricity
26
2020 2025 2030 2035year
-4000
-3000
-2000
-1000
0
1000
2000
3000
4000
cost
or
reve
nu
e (
k$y
r)
taxsite preparationstation capitalstation installelec capitalelec install
elec electricitywater
labormaintenance
station electricity
revenue ($2174kg)net income
300 kgday
conventional electrolysis on-site
Figure 12 Cost and revenue associated with a conventional assemble-on-site station with on-site electrolysis produced hyshydrogen to break even at year 7 (2023) The net income includes the effects from depreciation and taxes Capital replacement costs and intervals are not included in this model Pie charts on the right show the breakdown of cumulative capital and operating costs over the 7-year analysis period to the cost of dispensed hydrogen
29
Table 7 Installed cost (which includes site preparation engishyneering amp design permitting capital and installation costs) and hydrogen cost for conventional stations with electrolysis on-site
capacity (kgday) installed cost ($) H2 cost ($kg)
100 $238M $3966 200 $298M $2651 300 $345M $2174
station designs has a large capital cost due to the electrolysis unit As discussed in Section 23 the electrolysis units cost approximately $800k $12M and $15M for 100 200 and 300 kgday capacities These capital investments will add approximately $8kg $6kg and $5kg to the cost of hydrogen over a conventional station assuming equivalent operating costs During operation there is a large cost associated with electricity to run the electrolysis unit (shown by the yellow bar) This cost scales with the amount of hydrogen produced and is a large factor in the station economics The pie charts on the right show that this electricity accounts for approximately 20-30 of the cost of hydrogen Other additional costs over the conventional delivered hydrogen station are the cost of water to run the electrolysis unit and additional maintenance on the electrolyzer (assumed to be $50k annually as with the SMR)
The electricity required for the electrolyzer costs approximately $300k $600k and $900k (for the 100 200 and 300 kgday stations) in 2036 where utilization has topped out at 80 Centrally produced delivered hydrogen by comparison as shown in Fig 8 costs around $300k $450k and $650k in 2036 with overall operating costs for the delivered hydrogen station (neglecting taxes) topping out at approximately $400k $600k and $800k In addition to the additional capital costs for the electrolyzer (and the other operational costs) it is clear that the economics of a station with an electrolyzer are challenging due to the high electricity consumption even when the electricity is from the current national grid mix with 13 renewable content10 Higher renewable content may further increase this cost component in the near term although fossil-fuel free electricity may become less expensive in the longer term
The cost of hydrogen for the conventional station with an electrolyzer is $3966kg $2651kg and $2174kg for the 100 200 and 300 kgday stations receptively These costs are on-par with the conventional station with SMR within $150kg for all three capacities The cost of hydrogen for a station with on-site production is significantly higher than for a station with delivered hydroshygen Besides improvements in electrical efficiency one strategy for minimizing operating costs is to only operate the electrolyzer at off-peak hours enabling the purchase of lower priced electricity However this might require oversizing the electrolyzer to produce enough hydrogen at off-peak hours to meet demand increasing the capital costs associated with the unit Another method is inshytentionally oversizing the electrolyzer to enable operation at a higher efficiency thereby reducing operating expenses
102015 estimate from httpwwweiagovtoolsfaqsfaqcfmid=92ampt=4
30
To estimate the impact of these methods of operation and aslo gain insight into less expensive renewable electricity costs in the future the model was run with the cost of electricity zeroed-out to calculate the lowest possible cost of hydrogen with cheap electricity In this scenario the cost of hydrogen is $3264kg $1949kg and $1472kg (for the 100 200 and 300 kgday stations) These costs are only slightly higher (by 3-7) than the conventional delivered hydrogen cost due to the capital investment in the electrolyzer and the remaining electrolyzer maintenance and water costs
A station with on-site electrolysis can also be represented by the layout shown in Fig 11 Housing the components necessary for alkaline electrolysis of 100-300 kgday hydrogen might be challenging in a 20 ft ISO container and the layout might need to be increased (to a 30 or 40 ft ISO container) For PEM electrolysis however the components should fit in the 20 ft ISO container and potentially smaller containers for the 100 or 200 kgday stations Similar to the reforming layout the hydrogen components fit in a much more compact space than for the conventional station with delivered hydrogen (shown in Fig 9) and the lot size is reduced
34 Modular Station with Delivered Centrally Produced Hydrogen
Figure 13 shows the cost revenue and income model for a modular station with delivered centrally produced hydrogen and an uninstalled modular unit cost of $15M The installed capital costs and hydrogen costs at each of the three capacity stations are tabulated in Table 8 Recall from Section 25 that the capital costs for modular stations do not follow the same trend as for build-on-site stations because modular stations come in discrete sizes Table 8 shows the installed capital and hydrogen costs for two cases of uninstalled modular station costs of $15M and $1M The only difference in costs between this scenario and the conventional station with delivered centrally produced hydrogen (see Table 5 and Fig 8) are in the capital costs While the installed capital costs including site preparation station capital and installation were $15M and $17M for the 100 and 200 kgday conventional stations it is $186M for all three capacities of the modular
Table 8 Installed cost (which includes site preparation engishyneering amp design permitting capital and installation costs) and hydrogen cost for modular stations with delivered hydrogen for two cases of uninstalled modular cost $15M and $10M
capacity uninstalled installed H2 cost (kgday) modular cost ($) cost ($) ($kg)
100 $15M $186M $3390 200 $15M $186M $1916 300 $15M $186M $1425 100 $1M $136M $2912 200 $1M $136M $1677 300 $1M $136M $1265
31
site
pre
p
85
stationcapital 423
statio
n
install
17d
elive
red
H2
294
labor
58
maintenance107
electricity
17
-2000
-1500
-1000
-500
0
500
1000
1500
2000co
st o
r re
ven
ue (
k$
yr)
tax
site preparationstation capitalstation install
delivered H2labor
maintenanceelectricity
revenue ($3390kg)net income
100 kgday
site
prep
75
station
capital 374
station
install15
delive
red
H2
360
labor
52
maintenance94
electricity
30
-2000
-1500
-1000
-500
0
500
1000
1500
2000
cost
or
reve
nu
e (
k$
yr)
tax
site preparationstation capitalstation install
delivered H2labor
maintenanceelectricity
revenue ($1916kg)net income
200 kgday
site
prep
67
station
capital336
stationinstall 13
del
iver
ed H2
413
labor
46
maintenance85
electricity
40
2020 2025 2030 2035year
-2000
-1500
-1000
-500
0
500
1000
1500
2000
cost
or
reve
nu
e (
k$y
r)
tax
site preparationstation capitalstation install
delivered H2labor
maintenanceelectricity
revenue ($1425kg)net income
300 kgday
modular station delivered hydrogen
Figure 13 Cost and revenue associated with a modular station with centrally produced delivered hydrogen to break even at year 7 (2023) assuming a $15M uninstalled capital cost of the modular station The net income includes the effects from depreciation and taxes Capital replacement costs and intervals are not included in this model Pie charts on the right show the breakdown of cumulashytive capital and operating costs over the 7-year analysis period to the cost of dispensed hydrogen
32
stations This capital investment for a 300 kgday modular station (including site preparation station capital and installation) is coincidentally the same as for a 300 kgday conventional station
If an estimate of $1M (as compared to the conservative estimate of $15M) for the uninstalled capital cost of the modular fueling station unit is used (note that this is still within the range of costs vendors estimated as described in Section 25) the cost of hydrogen will be $2912 $1677 and $1265 for the 100 200 and 300 kgday capacities respectively These costs are all lower than the cost of hydrogen at the equivalent capacity conventional stations As this technology matures and the installed capital cost of the modular units continues to decrease below the installed capital cost of the conventional stations it will make economic sense to site modular stations rather than assembling components on-site Parts standardization and the increased quality control that can be achieved by having modular station components may also lead to reduced maintenance requirements but that potential benefit is not included in this analysis
Figure 14 shows that a modular unit requires a slightly smaller installation area than the conshyventional station components shown in Fig 9 However the tube trailers acting as the hydrogen source and on-site storage still require significant space Similar to the conventional station with delivered hydrogen delivery routes must also be considered when siting a modular station with deshylivered hydrogen The hydrogen components are shown as being housed in a 20 ft ISO container although some 300 kgday modular stations are smaller than this While a slightly overall reduced footprint (relative to as drawn in Fig 14) could be realized we show this layout on the same lot as before Removing the need to store two 40-foot tube trailers by adding on-site low pressure storage could also drastically reduce the footprint by reducing the need to have an open wall for delivery A discussion of how the separation distances can be impacted and the footprints might be reduced due to fire-rated walls is included at the end of the Section 35
33
140
0
168 0
50 0
30 0
dispenser island
tube trailer
modular station(20 ft ISO)
conveniencestore
Figure 14 Renderings of a modular station layout with delivered hydrogen
34
35 Modular Station with Hydrogen Produced On-site via Electrolysis
The final configuration considered in this analysis is a modular station with an electrolysis unit attached to produce hydrogen The economics of this station design are shown in Fig 15 The installed capital costs and hydrogen costs at each of the three capacity stations with two different uninstalled modular unit costs are tabulated in Table 9 Similar to the results in the previous section the cost of hydrogen at the low volume modular electrolysis stations with an assumed $15M uninstalled modular station cost are higher than at the conventional electrolysis station counterpart We find that the cost of hydrogen at these modular stations with electrolysis produced hydrogen will be $4303kg $2730kg and $2173kg (for the 100 200 and 300 kgday stations) These costs are once again $337kg higher $079kg higher and the same (respectively) as the costs at the conventional stations with electrolysis produced hydrogen discussed in Section 33 This cost difference between the analogous conventional station is once again solely due to the differing capital cost of the installed modular station If the capital cost of the modular unit is $1M the hydrogen costs reduce to $3825 $2491 or $2013kg (for the 100 200 and 300 kgday stations) which are all lower than the cost at the similarly sized conventional stations with on-site electrolysis due to the lower installed station cost
Having on-site production using an electrolyzer and modular fueling station components only requires a small footprint for installation as shown in Fig 16 The ISO containers can house apshypropriate fire-rated barrier walls reducing separation distance for Group 1 and 2 exposures (except for air intakes) by half and eliminating separation distances for Group 3 exposures as described in Section 732312 of NFPA 2 The Hydrogen Technologies Code (2016) [10] Group 1 exshyposures are lot lines air intakes (HVAC compressors other) operable openings in buildings and structures and ignition sources such as open flames and welding Group 2 exposures are exshyposed persons (other than those servicing the system) and parked cars Group 3 exposures include buildings flammable gas storage hazardous materials storage ordinary combustibles horizontal distance to overhead electrical wire and piping containing other hazardous material This means
Table 9 Installed cost (which includes site preparation engishyneering amp design permitting capital and installation costs) and hydrogen cost for modular stations with on-site electrolysis proshyduced hydrogen for two cases of uninstalled modular cost $15M and $10M
capacity uninstalled installed H2 cost (kgday) modular cost ($) cost ($) ($kg)
100 $15M $274M $4303 200 $15M $314M $2730 300 $15M $345M $2173 100 $1M $224M $3825 200 $1M $264M $2491 300 $1M $295M $2013
35
site prep67
stat
ion
capit
al
333
stationinstall 13
eleccapital 181
elec
install
13
elec
el
ectr
icity
163
wate
r0
2
labor
46
maintenance
168
stationelectricity
13
-3000
-2000
-1000
0
1000
2000
3000co
st o
r re
ven
ue (
k$
yr)
taxsite preparationstation capitalstation installelec capitalelec install
elec electricitywater
labormaintenance
station electricity
revenue ($4303kg)net income
100 kgday
site prep53
stat
ion
capi
tal
263
station
install
11
eleccapital 214
elec
install11
elec
elec
tric
ity
257
water
03
lab
or
36
maintenance
132
stationelectricity
21
-4000
-3000
-2000
-1000
0
1000
2000
3000
4000
cost
or
reve
nu
e (
k$
yr)
taxsite preparationstation capitalstation installelec capitalelec install
elec electricitywater
labormaintenance
station electricity
revenue ($2730kg)net income
200 kgday
site prep44
stat
ion
capi
tal
220
stati
on
inst
all
09
elec
capital 224
elecinstall 09
elec
elec
tric
ity32
3
water
04
labor
30 maintenance
111
stationelectricity
26
2020 2025 2030 2035year
-4000
-3000
-2000
-1000
0
1000
2000
3000
4000
cost
or
reve
nu
e (
k$y
r)
taxsite preparationstation capitalstation installelec capitalelec install
elec electricitywater
labormaintenance
station electricity
revenue ($2173kg)net income
300 kgday
modular station electrolysis on-site
Figure 15 Cost and revenue associated with a modular station with on-site electrolysis produced hydrogen to break even at year 7 (2023) assuming a $15M uninstalled capital cost of the modular station The net income includes the effects from depreciation and taxes Capital replacement costs and intervals are not included in this model Pie charts on the right show the breakdown of cumulashytive capital and operating costs over the 7-year analysis period to the cost of dispensed hydrogen
36
electrolyzer(20 ft ISO)
modular station(20 ft ISO)
convenience store
dispenser island
100
0
100 0
17 0
Figure 16 Renderings of a modular station layout with an elecshytrolyzer for on-site production with a small reduced footprint
37
for a typical pipe diameter of 028rdquo and up to 15000 psi pressure (within the operating range of the cascade storage at a refueling station) air intakes must remain 34 ft from the containers while lot lines other building openings or ignition sources only need 17 ft of separation Exposed persons and parked cars must be 8 ft or more away from the containers and other exposures (including other combustibles like gasoline) do not need any separation from the containers This will allow a compact layout an example of which is shown in Fig 16
38
4 Conclusions
Five station designs were considered in this analysis with three capacities of each station deshysign With the current technology the lowest cost hydrogen source assessed here11 is tube-trailers delivering centrally produced gaseous hydrogen Shown in Table 10 or graphically in Fig 17 for either a conventional or modular station with a 300 kgday capacity and delivered hydrogen gas (using our conservative $15M cost estimate for the modular unit) it would cost approximately $186M to prepare the site and build the station and at a dispensed hydrogen cost of $1425kg a station operator would break even on their capital investments and operational costs in 7 years If the capital cost of the modular station unit is only $1M which is still in the range of cost estimates by manufacturers a modular station with delivered hydrogen would cost $136M to build and for a 300 kgday capacity hydrogen would cost $1265kg Embedded in all of these analyses is the utilization profile shown in Fig 2 which is the reason that the hydrogen cost increases as the cashypacity (and utilization) decreases for the modular stations with delivered hydrogen although they have the same installed cost
The specified 7-year return on investment results in higher cost hydrogen for smaller stations than for larger ones due to less throughput and higher capital cost per kg of capacity (see the lower left frame of Fig 17) If the SDO charges customers a price lower than this cost the result will be a longer return on investment Setting the same price regardless of station capacity will result in the 100 kgday station having the longest return on investment and the 300 kgday having the shortest
The addition of a steam methane reformer or an electrolyzer to a hydrogen refueling station increases the capital cost significantly with the steam methane reformer estimated to have the
11The cost of liquid delivery was not included in this analysis
Table 10 Installed cost (which includes site preparation engishyneering amp design permitting component capital and installation costs) and resulting hydrogen cost to break even at year 7 for the stations analyzed in this work
station capacity rarr 100 kgday 200 kgday 300 kgday
station type darr installed cost ($)
H2 cost ($kg)
installed cost ($)
H2 cost ($kg)
installed cost ($)
H2 cost ($kg)
conventional delivered H2 conventional SMR H2 conventional electrolysis H2 modular ($15M) delivered H2 modular ($1M) delivered H2 modular ($15M) electrolysis H2 modular ($1M) electrolysis H2
$151M $274M $238M $186M $136M $274M $224M
$3053 $3847 $3966 $3390 $2912 $4303 $3825
$169M $383M $298M $186M $136M $314M $264M
$1837 $2596 $2651 $1916 $1677 $2730 $2491
$186M $443M $345M $186M $136M $345M $295M
$1426 $2023 $2174 $1425 $1265 $2173 $2013
39
$00M$05M$10M$15M$20M$25M$30M$35M$40M$45M
inst
all
ed
cost
($)
capacity (kgday)
100 200 300
conv
ention
al d
eliv
ered
gas
conv
ention
al S
MR
conv
ention
al e
lect
roly
sis
mod
ular
($1
5M
) d
eliv
ered
gas
mod
ular
($1
M) d
eliv
ered
gas
mod
ular
($1
5M
) e
lect
roly
sis
mod
ular
($1
M) e
lect
roly
sis
$0k
$5k
$10k
$15k
$20k
$25k
$30k
inst
all
ed
cost
($[
kg
day]
)
conv
ention
al d
eliv
ered
gas
conv
ention
al S
MR
conv
ention
al e
lect
roly
sis
mod
ular
($1
5M
) d
eliv
ered
gas
mod
ular
($1
M) d
eliv
ered
gas
mod
ular
($1
5M
) e
lect
roly
sis
mod
ular
($1
M) e
lect
roly
sis
$0$5
$10$15$20$25$30$35$40$45
H2 c
ost
($k
g)
capacity (kgday)
100 200 300
Figure 17 Installed cost (which includes site preparation engishyneering amp design permitting component capital and installation costs) are shown in the left frames The top frame is the total inshyvestment in 2016$ while the bottom left frame is the installed cost per mass of hydrogen dispensed (kgday) The hydrogen cost to break even at year 7 is shown in the right frame for the stations analyzed in this work
40
highest capital cost On-site production does allow for a more compact station footprint and does not require consideration for tube-trailer delivery routes With current technology and projected utility prices operating a steam methane reformer costs slightly less than operating an electrolyzer These offsetting differences in capital vs operational costs causes the price of hydrogen to be very similar for a station with SMR produced hydrogen and electrolysis produced hydrogen In both cases the cost of hydrogen is $6-$10kg more for the stations that produce hydrogen on-site than the stations that have hydrogen delivered This analysis does not include the startup and shutdown inefficiencies (and associated costs) for either the SMR or electrolyzer The penalty for cycling a SMR is likely greater than for cycling an electrolyzer potentially giving an electrolyzer an economic advantage for on-site production
Electrolyzers also have the potential to produce less carbon dioxide than SMRrsquos By definishytion SMRrsquos require methane which contains carbon to produce hydrogen releasing the carbon molecules as carbon dioxide and contributing to climate change A reduced carbon footprint could be achieved by using bio-gas or implementing carbon capture and storage (although this would incur an efficiency penalty) Electrolyzers on the other hand require only electricity and water giving this technology the potential to be completely carbon free given the right source of elecshytricity such as solar wind hydroelectric or nuclear The key to making on-site production more cost competitive with delivered hydrogen is reducing the utility costs For electrolysis this can be achieved through efficiency improvements (although around 50-70 efficiencies are achieved with current technology) through the purchase of low cost off-peak electricity or by using elecshytricity generated behind the meter Of course reducing capital cost and maintenance requirements of on-site production units will also improve the economics of this technology
According to our research current modular fueling stations where components are assembled and tested at a central production facility have installed costs no higher than conventional stations Using our high estimate of $15M for the modular unit the installed cost of the 300 kgday modular station is nearly the same as for a 300 kgday conventional station Using a lower cost estimate of $1M for the modular unit the installed cost of a 100 kgday conventional station is 11 higher than the modular station With greater industry experience and higher volume production we would anticipate the cost of modular stations to reduce in the near-future Developing stations in this manner may lead to better quality control and reduced maintenance requirements for hydrogen fueling stations It is also possible to achieve more compact station footprints by modularizing the station components by building in appropriate fire-rated barrier walls Because of these potential benefits we anticipate modularization and standardization to increase in the future
This report details the economics of current hydrogen refueling stations and includes some sketches of potential layouts We have visually depicted the contributions to capital and operational costs of hydrogen for different station concepts making it easy to find the largest contributors to a high cost of hydrogen to the consumer This information can be used to devote research and development towards these high contributors At the station the dispenser compressors and chillers are expensive pieces where additional development or higher volume production could reduce station costs For electrolysis the purchase of low-priced electricity could serve to make on-site production cost competitive with central production and delivery This report enables the comparison of different station concepts that could be implemented in various market scenarios
41
A Piping amp Instrumentation Diagram
The following pages show the piping and instrumentation diagram for the included reference stations For the conventional stations all components need to be assembled on-site The dashed boxes show the components that are often modularized for the modular stations For reference the utility requirements shown in the PampID are also included here in Table A1
Table A1 Utility requirement estimateslowast for the stations in this report
capacity 100 kgday 200 kgday 300 kgday
compressor power electrolyzer power electrolyzer water SMR power SMR water SMR gas
25 kW 260 kW 110 lhr 16 kW 400 lhr 34 Nm3hr
60 kW 510 kW 220 lhr 33 kW 800 lhr 68 Nm3hr
100 kW 770 kW 330 lhr 49 kW 1200 lhr 101 Nm3hr
lowast These are averages based on manufacturer specifications and literature and are meant to give an estimate of site requirements For exact specifishycations to meet station requirements consult a manufacturer directly
42
ABCDEFGHIJK1
2
3
4
5
6
7
Measured Variable Readout of function Output Function ModifierA Air AlarmB Burner Storage Users Choice Users ChoiceC Compressor ClosedD DispenserE Electrolyzer Sensor (primary Element)F Flow FilterG Chiller Glass viewingH Hand HighI Current IndicatorJ PowerK Time Control StationL Level Light LowM Conductivity MiddleN Users Choice Users Choice Hydrogen Users ChoiceO Water Orifice restriction Air OpenP PressureQ QuantityR Reformer Record ReduceS Speed Frequency SwitchT Temperature TransmitU Multivariate Multifunction Multifunction MultifunctionV Vibration ValveW Weight Well WaterX Unclassified Unclassified Unclassified UnclassifiedY State RelayZ Position Actuator
PROCESS AND SIGNAL LINES
HYDROGEN PROCESS LINE
DEIONIZED WATER PROCESS LINE
PNEUMATIC SIGNAL LINE
NITROGEN SIGNAL LINE
ELECTRICAL SIGNAL LINE
SV
VALVES
BALL VALVE
NEEDLE VALVE
CHECK VALVE
SOLENOID VALVE
AIR ACTUATED VALVE SPRING RETURN CLOSE
PRESSURE REDUCING VALVE
TWO WAY PRESSURE RELIEF
THREE WAY PRESSURE RELIEF
EQUIPMENT
FILTER
PUMP
DRYER
HYDROGEN COMPRESSOR
STORAGE TANK
IR FLAME DETECTOR
Line Service Identification codesCCA-CLEAN COMPRESSED AIRCHW-CHILLED WATERH-HYDROGENN-NITROGEN
Pipe Specification Details3000PSI Min pressure rating of 3000 PSI 316316L austenitic stainless steel tubing UNS S31600 (316) UNS S31603 (316L)6500PSI Min pressure rating of 6500 PSI 316316L austenitic stainless steel tubing UNS S31600 (316) UNS S31603 (316L)15000PSI Min pressure rating of 15000 PSI 316316L austenitic stainless steel tubing UNS S31600 (316) UNS S31603 (316L)POLY Polyamide (Nylon) pneumatic tubing light and heat stabilized0032CU 0032 wall copper alloy 122 seamless tubingSCH40 Schedule 40 iron pipe
Line symbolsXrdquo-XXX-XXXX-XXX-XXX
Line size nominal inches
Service
Line Number (if assigned)
Pipe Spec
Insulation (if applicable)
Insulation codesF1- Soda-lime silicate glass (FOAMGLAS) 1 wall thicknessF2- Buna N Foam 38 thick
ABCDEFGHIJK1
2
3
4
5
6
7
CNH-300
HV-202HV-203
HV-201PT-300PI-300 HV-300
HV-301
Motor460-V 3Oslash SEE NOTE 1
Heater120-V 1Oslash 500 W
PT-202PI-202
34-H-VENT
1-frac14rdquo-CHW-800-SCH40
1-frac14rdquo-CHW-800-SCH40-F2
CW-800
GW-800
HV-202
HV-300
FV-100
ZSO-100
ZSC-100
ZI-100
FSV-100
ZZO-100
FSV-30038-H-3000PSI
38-H-5000PSI
38-H-5000PSI
38-H-15000PSI
34-H-VENT
OF-802TO COMMON frac34rdquo VENT MAST LOCATED ON BACK OF GMP
10 ABOVE GRADE
REFERENCE STATION 100-300 KGDAY
FF-300
GW-801
PI-101 PT-101
H2 Storage PBNH-402MAWP-15000 PSIG
H2 Storage PBNH-403MAWP-15000 PSIG
H2 Storage PBNH-401MAWP-15000 PSIG
FV-401
ZSO-401 ZSC-401
ZZO-401
FV-402
ZSO-402 ZSC-402
ZZO-402
FV-403
ZSO-403 ZSC-403
ZZO-403
FV-400
ZSO-400 ZSC-400
ZZO-400 GN-900
CHILLER 75-kW
DN-900JSS-901(EPO)
To EPO circuit
700-BAR NOZZLE
350-BAR NOZZLE
38-H-15000PSI
H70-T40H70-Warm
H35-T0
3570MPa DISPENSERWUN-900
FVControls Internal120V 1p 15A
GN-901
HEAT EXCHANGER1350 lbs
HV-901
H70-Cold
H2 Delivery Trailer multiple tubes one outlet
COH-100Air Compressor
PBAL-100
HV-100
AF-100
Air DryerAF-101
HV-900
PT-403PI-403
HV-403
PT-402PI-402
HV-402
PT-401PI-401
HV-401
HV-411
HV-412
HV-413
ZI-401
ZI-402
ZI-403
FV-101
ZSO-101 ZSC-101 ZI-101
ZZO-101
ZVO-100
ZVO-101
ZVO-900
ZVO-401
ZVO-400
ZVO-402
ZVO-403
RAH-100IR FLAME DETECTOR
AIMED AT HYDROGEN SOURCEAND ZONE 400
HIGH PRESSURE STORAGE
TO FIRE PANEL
RAH-900
IR FLAME DETECTORAIMED AT DISP HOSES
TO FIRE PANEL
HV-101
38-H-15000PSI
ZI-400
HV-400
FSV-200
EN-100ELECTROLYZER SKID
20 BAR (300 PSI) OUTPUT
RN-100STEAM METHANE REFORMER (SMR)
SKID13 BAR (200 PSI) OUTPUT
ZVO-102
Power460-V 3OslashSEE NOTE 1
Power460-V 3OslashSEE NOTE 1
ONLY ONE HYDROGEN SUPPLY OPTION IS USED PER STATION 1 TUBE TRAILER DELIVERY2 ON-SITE ELECTROLYSIS3 ON-SITE STEAM METHANE REFORMER
MUNICIPAL WATER SUPPLY
SEE NOTE 1
NATURAL GAS BIOGAS METHANE SUPPLY
SEE NOTE 1
NOTE 1 UTILITY REQUIREMENTS DEPEND ON STATION CAPACITY AND CAN BE ESTIMATED BASED ON THE FOLLOWING TABLESTATION CAPACITY 100 KGDAY 200 KGDAY 300 KGDAYELECTROLYZER POWER 260 KW 510 KW 770 KWELECTROLYZER WATER 110 LHR 220 LHR 330 LHRSMR POWER 16 KW 33 KW 49 KWSMR WATER 400 LHR 800 LHR 1200 LHRSMR GAS 34 NM3HR 68 NM3HR 101 NM3HRCOMPRESSOR POWER 25 KW 60 KW 100 KW
NOTE 2 ON-SITE PRODUCTION UNITS MAY INCORPORATE THEIR OWN INSTRUMENT AIR SYSTEM AND INTERCONNECTION WITH CSD SKIDCONTAINER MAY NOT BE NECESSARYNOTE 3 APPLIES TO MODULAR STATION ONLY A BUILD-ON-SITE STATION WILL NOT HAVE A SKID-OR CONTAINER-MOUNTED PRE-ASSEMBLED SYSTEMNOTE 4 IN SOME MODULAR STATIONS THE DISPENSER WILL BE A SEPARATELY-INSTALLED COMPONENTNOTE 5 IN MANY MODULAR STATIONS THE HEAT EXCHANGE EQUIPMENT WILL BE ROOF-MOUNTED
NOTE 2
COMPRESSION STORAGE AND DISPENSER (CSD) SKID OR CONTAINER BOUNDARY SEE NOTE 3
NOTE 4
NOTE 5
NOTE 5
PLCGas Control Cabinet
COMPRESSORMULTIPLE STAGES
References
[1] US Energy Information Administration EIA Open Data - Intro - US Energy Information Administration (EIA) accessed July 2016 httpwwweiagovopendata
[2] US DOE DOE H2A Production Analysis accessed May 2016 httpswwwhydrogen energygovh2a_productionhtml
[3] Joseph Pratt Danny Terlip Chris Ainscough Jennifer Kurtz and Amgad Elgowainy H2FIRST reference station design task Technical Report SAND2015-2660 R Sandia National Laboratories April 2015 Available at httpenergygoveerefuelcells h2first
[4] US DOE DOE H2A Delivery Analysis accessed May 2016 httpswwwhydrogen energygovh2a_deliveryhtml
[5] 2016 Annual Evaluation of Hydrogen Fuel Cell Electric Vehicle Deployment and Hydrogen Fuel Station Network Development Technical report California Environmental Protection Agency Air Resources Board July 2016 Available at httpswwwarbcagovmsprog zevproghydrogenhydrogenhtm
[6] E Sutherland and F Joseck Low volume production and delivery cost Technical Report 15011 Department of Energy Hydrogen and Fuel Cells Program Record 2015
[7] Ricardo Guerrero Lemus and Jose Manuel Martinez Duart Updated hydrogen production costs and parities for conventional and renewable technologies International Journal of Hydrogen Energy 35(9)3929ndash3936 2010
[8] Alfredo Ursua Luis M Gandia and Pablo Sanchis Hydrogen production from water elecshytrolysis current status and future trends Proceedings of the IEEE 100(2)410ndash426 2012
[9] G Parks R Boyd J Cornish and R Remick Hydrogen station compression storage and dispensing technical status and costs Systems integration Technical Report NRELBKshy6A10-58564 National Renewable Energy Laboratory (NREL) Golden CO May 2014
[10] NFPA 2 Hydrogen Technologies Code Technical report National Fire Protection Associashytion 2016
45
- Executive Summary
- Acknowledgment
- Contents
- Figures
- Tables
- 1 Introduction
-
- 11 Background and Contents
- 12 Approach
- 13 Method Overview
-
- 2 Station Cost Components
-
- 21 Centrally Produced Hydrogen and Delivery
- 22 Hydrogen Produced On-Site via Steam Methane Reforming
- 23 Hydrogen Produced On-Site via Electrolysis
- 24 Compression Storage and Ancillary Equipment for a Conventional Station
- 25 Packaged Compression Storage and Ancillary Equpiment for a Modular Station
- 26 Hydrogen Dispensers
-
- 3 Results Station Designs and Costs
-
- 31 Conventional Station with Delivered Centrally Produced Hydrogen
- 32 Conventional Station with Hydrogen Produced On-Site via Steam Methane Reforming
- 33 Conventional Station with Hydrogen Produced On-Site via Electrolysis
- 34 Modular Station with Delivered Centrally Produced Hydrogen
- 35 Modular Station with Hydrogen Produced On-Site via Electrolysis
-
- 4 Conclusions
- Appendix A Piping and Instrumentation Diagram
- References
-
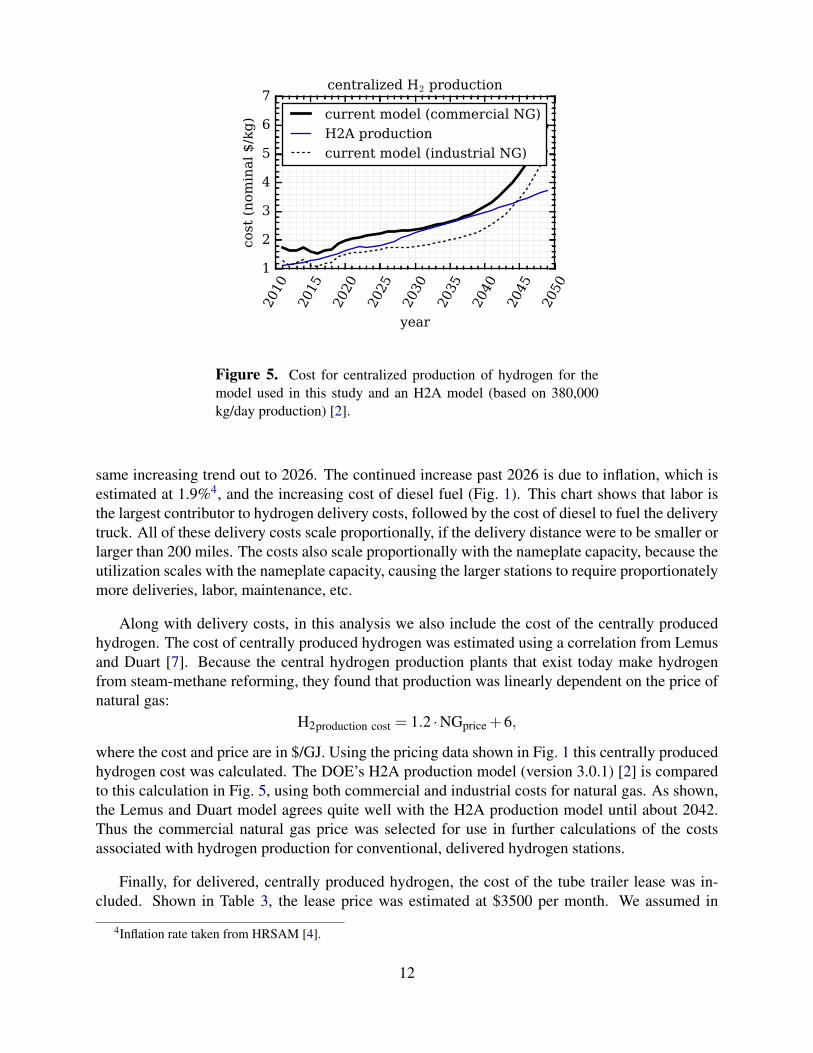

2020 2025 2030 2035year
0100200300400500600700
deli
vere
d H
2 c
ost
(k$y
r)cent productiontube trailer lease
delivery
2020 2025 2030 2035year
cent productiontube trailer lease
delivery
2020 2025 2030 2035year
cent productiontube trailer lease
delivery
Figure 6 Total costs associated with central production of hyshydrogen delivery and storage in a tube-trailer for a 100 (left) 200 (center) and 300 (right) kgday hydrogen refueling station
this analysis that the stations would continually lease 2 tube trailers at $7000 per month so there would be no outages as the empty hydrogen tube trailers were exchanged We assumed that the lease cost was not affected by the number of deliveries required Figure 6 shows the total costs associated with delivered centrally produced hydrogen Within the red delivery bar are all of the costs shown in Fig 4 All three of the costs broken out in the plot (central production tube-trailer leasing and delivery) are significant contributors to the cost of centrally produced delivered hyshydrogen As shown the cost of the tube-trailer lease was fixed in this model for any station capacity resulting in a smaller percentage of the costs for 200 and 300 kgday stations This is far from a certain assumption The high lease price might cause a station operator to think about purchasing a tube-trailer (or fleet of tube-trailers) but the estimated cost of a tube trailer within HDSAM [4] is around $1 million At least two trailers would be required unless the station were shutdown while the tube trailers were being refilled so purchase might not make financial sense without an adshyvanced network of stations andor a long-term financial horizon An additional option to eliminate the trailer lease expense is to install a similar amount of low pressure hydrogen storage on site allowing the trailer to discharge its contents and depart This would add several hundred thousand dollars of capital cost to the station (depending on the amount and type of storage installed)
22 Hydrogen Produced On-site via Steam Methane Reforming
Cost information for on-site reformers was gathered from several manufacturers An estimate for capital cost is $115M for a 100 kgday unit $204M for a 200 kgday unit and $246M for a 300 kgday unit A functional fit was found to several data points including the H2A production model [2] capital cost for a 1500 kgH2day unit which is $325M As with most products the per kg cost of production reduces as the production rate increases
Feedstock consumption rates were also collected from manufacturers for several on-site reshyforming units Based on this information assumed rates of 39 kWhkgH2 96 lH2OkgH2 and 35
13
2010 2015 2020 2025 2030year
0
100000
200000
300000
400000
500000
600000
700000
800000
H2 p
rod
uct
ion
cost
($
)current model
H2A production
Figure 7 Annual production cost of 500 kgday hydrogen from distributed steam methane reforming as predicted by the current model and using the H2A production model
kgNGkgH2 were used to estimate operating costs The operating costs for the H2A production model for distributed SMR scaled down to 500 kgday [2] was compared to the operating costs calculated using the current model (using the cost information shown in Fig 1 and the commershycial price of natural gas) This comparison is shown in Fig 7 The annual operating costs of the current model which is based on recent manufacturer information are within 20 of the H2A model predictions
One factor that is not taken into account in this analysis is startup and shutdown production efficiencies and losses Because SMRs operate at high temperature start-up is slow and frequent shutdownstartup cycles can drastically reduce production efficiency It may be cheaper to simply produce and vent hydrogen continuously rather than cycling the unit off and back on The addishytional cost of running the SMR when it is not needed is not included in this analysis it is assumed that this process occurs instantaneously and without an efficiency penalty The impact of this assumption is that the operational costs of the SMR may be under-predicted by this model
23 Hydrogen Produced On-site via Electrolysis
The two most common type of electrolysis units on the market today are polymer electrolyte membrane (PEM) and alkaline PEM electrolysis units use the same technology as PEM fuel cells (which are found in vehicles) but the cells are biased and protons move in the opposite direction from a fuel cell Alkaline fuel cells have a liquid electrolyte solution that serves to transport ions from the electrodes Alkaline electrolyzers are a more mature technology can be cheaper and may have a longer lifetime than PEM electrolyzers but PEM electrolyzers produce higher purity hydrogen with less sensitivity to water purity are smaller can respond more quickly to changes in production rate and can produce hydrogen at pressure reducing compression needs In this
14
analysis we are not specifying the type of electrolyzer since costs (which are not precisely quoted in any case) are reasonably similar
Electrolyzer electricity consumption was estimated to be 56 kW-hrm3 = 624 kW-hrkgH2H2 There is some variability in electricity consumption depending on each manufacturerrsquos equipment but this value is in line with an analysis by Ursua et al [8] and is the average value from the Electrolyzer Energy composite data product (CDP)5 from NREL The municipal water consumpshytion was calculated as just under 3-times the stoichiometric value required based on the reacshytion (H2O rarr H2 + 12O2) (which accounts for purification system losses and other cooling water needs) at 264 lH2OkgH2 An informal survey of several companies led to capital cost estimates of $800k $12M and $15M for the 100 200 and 300 kgday stations These capital costs are lower than the SMR capital costs used in this analysis for an equivalent hydrogen production capacity For the modular electrolyzer units considered herein the installation cost was assumed to be a flat $60k regardless of the hydrogen production capacity an estimate based on discussions from several companies
Similar to the SMR the efficiency penalty for shutting down the unit and restarting it is not taken into account in this analysis This inefficiency is expected to be lower for electrolysis than SMR since the operation temperatures are much lower and the startup process is simpler Nonetheshyless there will be an efficiency penalty for cycling the electrolyzer off and back on so the elecshytrolyzer and storage sizes need to be optimized for the station utilization rates during station design
24 Compression Storage and Ancillary Equipment for a Conventional Stashytion
For conventional stations most equipment costs from Phase 1 of the reference station design report [3] were used in this analysis Shown in Table 4 costs for all but the compressor dispenser and chillercooling block were inflation adjusted from 2009$ to 2016$ at a 19 inflation rate The cost of the compressor was not simply inflated but rather re-estimated using the compressor size evaluated by HRSAM [4] and Fig 2 from the Phase 1 Reference Station Design report [3] The $100kndash$150k capital cost estimates for the compressors given in the first report were based on a specific station design with a smaller compressor rather than the compressor sizing evaluated by HRSAM The HRSAM estimates for compressor needs for the 100 200 and 300 kgday stations are 6 14 and 23 kghr as shown in the table Compressor energy consumption was assumed to be 42 kWhrkgH2 This is consistent with NRELrsquos Compressor Energy CDP6 and manufacturer specifications This factor was used to calculate the energy utilization and size the compressors at 25 60 and 100 kW for the 100 200 and 300 kgday stations respectively The electrical requirements are a bit more than those calculated by HRSAM which assumes that the compressors have a 65 isentropic efficiency but correspond well with literature [9] and manufacturer data
As with the Phase 1 report [3] the compressor is the only variable cost in different-sized station
5httpwwwnrelgovhydrogenimagescdp_infr_36jpg 6httpwwwnrelgovhydrogenimagescdp_infr_35jpg
15
Table 4 Equipment needed for a conventional hydrogen fuelshying station and estimated costs (inflation adjusted from [3] or reshyassessed as described in the text)
description quantity cost total tanks [13 kg each 945 bar MAWP Type II] 3 $45633 $136899 pressure transducer and indicator 6 $1141 $6845 block and bleed valve 6 $570 $3422 air operated valve 6 $2282 $13690 pilot solenoid valve 7 $57 $399 isolation hand valve 12 $570 $6845 check valve 3 $456 $1369 coolant pump 1 $1369 $1369 water chiller 2 $4563 $9127 coolant filter 1 $57 $57 instrument air compressor 1 $1141 $1141 instrument air dryer and filter 1 $2909 $2909 hydrogen compressor [2-stage 950 bar outlet]
100 kgday station - 6 kghr 25 kW $189827 $189827 200 kgday station - 14 kghr 60 kW 1 $328774 $328774 300 kgday station - 23 kghr 100 kW $453010 $453010
hydrogen dispenser [(1) 350 bar and (1) 700 bar hose] 1 $250000 $250000 hydrogen chiller and cooling block 1 $150000 $150000 IR flame detector 2 $1711 $3422 hydrogen filter 1 $2852 $2852 PLC 1 $5704 $5704 tubing - $22817 $22817 fittings - $17112 $17112 electrical upgrades - $57041 $57041 fencing - $5704 $5704 bollards - $5704 $5704
total (100 kgday station) total (200 kgday station) total (300 kgday station)
$894256 $1033203 $1157439
16
designs The developers of HRSAM [4] found the minimum size of the commonly available high pressure ground storage tanks to be 13 kg and three of these are needed for a cascade fill giving a minimum installed high-pressure storage amount of 39 kg This size was found to be sufficient for each station modeled in this work Since each station only has a single dispenser that cost also remains constant Using the varied compressor costs the conventional station equipment costs range from $900k to $12M
Costs for the hydrogen dispenser and the hydrogen chiller and cooling block were separated out and updated in this report where they were lumped together in the previous report The chiller and cooling block was estimated to cost $150k while the dispenser was estimated at $250k These costs are based on discussions with manufacturers and station operators who have purchased these pieces of equipment and are 15 higher than the estimated $350k combined cost in the previous report Part of the reason for this update is the evolution of dispenser design from an industrial-type interface to one that provides a retail customer experience more similar to that at a gasoline station and the associated cost of these newer dispensers
One high cost subsystem shown in Table 4 is the hydrogen compressor where cost savings can be realized by reducing the size of the compressor However the compressor size needs to be balanced by the high pressure storage and station utilization The hydrogen dispenser is also a significant cost as production volume increases on the components needed in the dispensers and the assembled dispensers this cost will likely decrease The same number and type (or at least cost) of dispenser valves pumps filters tanks tubing safety equipment etc are needed for the 100 kgday station as the 200 and 300 kgday stations
25 Packaged Compression Storage and Ancillary Equpiment for a Modushylar Station
Modular stations have the compressor hydrogen cooling block chiller high-pressure storage and control electronics housed in andor on a single container Manufacturing and installing these components in this way reduces installation labor allows leak and operation checking at a dedishycated facility and can potentially reduce equipment costs by enabling high volume production of standardized components Most station designers and companies are currently producing modular units and having at least some components in a modular shippable fashion is the preferred way of constructing stations at this time Our research shows that the primary savings associated with modular stations are in the installation costs Based on conversations with manufacturers capital costs of modular stations are currently on par with conventional stations This is likely because much of the same equipment is used in both types of stations We estimate modular fueling stations to cost between $750k to $15M depending on the manufacturer and whether or not a dispenser is included This price range is for a unit that can compress and provide 200-400 kgday hydrogen and spans the $890k-$12M capital cost range of the conventional station equipment While inshystallation of conventional stations is expected to be about 35 of capital costs [4] installation of equipment for a modular station is expected to be very low likely no more than 5 of the capital costs of the modular unit In this report installation cost was estimated to be $60k regardless of
17
station size the same as the electrolyzer unit installation costs since the installation requirements are similar
Most manufacturers make just one size of modular units so there might not be potential to save by having a smaller nameplate capacity In this analysis we provide estimates for total station costs for two cases of modular unit costs ($1M and $15M) to elucidate the effect of differing capital costs These costs are assumed to include the cost of the dispenser even though is is shown as being separated from the modular system in the layout sketches In the analysis below these two different costs are also used as a further example to show how Fig 3 can be used to adjust resulting hydrogen cost to account for variability in capital cost estimates
26 Hydrogen Dispensers
Both the modular and conventional on-site station components need to interface with a disshypenser The dispenser includes valving high pressure break-away(s) hose(s) nozzle(s) flow meshytering control electronics and a customer interface (point of sale system) Stations often provide both 350 and 700 bar fills requiring two hoses break-aways nozzles and additional plumbing and control electronics Dispensing units range in price from approximately $150k-$350k For a high utilization area where one would want to allow multiple simultaneous fills the cost of additional dispensers would need to be factored into an analysis In this analysis both the conventional stashytion and modular station total cost estimates include the cost of a single dispenser with both a 350 and 700 bar hose
18
3 Results Station Designs and Costs
Multiple approaches exist to financially model fueling stations and determine the cost of hydroshygen One approach is to perform a discount cash flow analysis specifying a return on investment that is desired after a given time-frame This is the approach taken in HRSAM [4] and used in the Phase 1 Reference Station Design report [3] Specifying a 30 year analysis period and a discount rate of 15 the cost of hydrogen was determined for the different station designs These specishyfications led to a payback period (break-even time) of approximately 75 years In this work an alternative approach to the discount cash flow analysis was used wherein we calculated the cost of hydrogen considering a 7-year payback period A solution for the cost of hydrogen is found such that the sum of all costs and revenues is zero at the end of a 7-year period By taking this approach we do not need to include replacement costs for components over the entire 20 or 30 year discount cash flow analysis we only need to include replacement costs for components that need to be replaced within 7-year time-frame While some maintenance costs will be required over this 7 year time-frame we assume that no major component of the fueling station would need to be replaced in this period The validity of this assumption varies with equipment type manufacturer and duty cycle We project station costs and incomes out 20 years in this analysis but these results are missing capital replacement costs
As discussed earlier site-preparation costs can vary widely In this analysis we assume a flat $300k to cover the site-preparation including engineering and design permitting and a project contingency The cost to install the conventional components is assumed to be 35 of the capital cost while the cost to install the modular stations electrolyzer or SMR units is assumed to be $60k regardless of unit size or station capacity It should be noted that should any of these assumed costs be different from a real-world station build the black lines in the chart of Fig 3 can be used to determine the resulting change in the cost of hydrogen for the 7-year payback period For example if the site preparation costs $600k rather than the assumed $300k one could use Fig 3 to determine that for a depreciable asset7 the excess $300k would add nearly $3kg to the cost of hydrogen for a 100 kgday station or approximately $1kg to the cost for a 300 kgday station
It is assumed that the station construction takes one year (the year of 2016) and utilization begins the following year (2017) at the rate shown by Fig 2 Just like the analysis that was used to generate Fig 3 when calculating the cost of hydrogen depreciation was estimated using a 7-year Modified Accelerated Cost Recovery System (MACRS) depreciation rate and an overall tax rate of 389 (35 federal and 6 state tax)
31 Conventional Station with Delivered Centrally Produced Hydrogen
Figure 8 shows the cost and revenue model for a conventional assemble-on-site station with delivered hydrogen In 2016 there is no revenue and the costs for building the station are incurred The capital of the station (green bar) is the largest contributor to costs in 2016 The 35 of capital
7Site preparation is likely considered depreciable because it is preparing the land for business use and is closely associated with the station equipment
19
site prep
94
stati
on
cap
ital
280
stationinstall 98
deliv
ered
H 232
6
labor
65
maintenance
118
electricity19
-2000
-1500
-1000
-500
0
500
1000
1500
2000co
st o
r re
ven
ue (
k$
yr)
tax
site preparationstation capitalstation install
delivered H2labor
maintenanceelectricity
revenue ($3053kg)net income
100 kgday
site prep
78
stat
ion
capit
al
269
stationinstall 94
deliv
ered
H 237
6
labor
54
maintenance
98
electricity31
-2000
-1500
-1000
-500
0
500
1000
1500
2000
cost
or
reve
nu
e (
k$
yr)
tax
site preparationstation capitalstation install
delivered H2labor
maintenanceelectricity
revenue ($1837kg)net income
200 kgday
site prep
67
stat
ion
capit
al
259
station
install 91
deliv
ered
H 2
413
labor
46
maintenance
84
electricity40
2020 2025 2030 2035year
-2000
-1500
-1000
-500
0
500
1000
1500
2000
cost
or
reve
nu
e (
k$y
r)
tax
site preparationstation capitalstation install
delivered H2labor
maintenanceelectricity
revenue ($1426kg)net income
300 kgday
conventional delivered H2
Figure 8 Cost and revenue associated with a conventional assemble-on-site station with centrally produced delivered hydroshygen to break even at year 7 (2023) The net income includes the effects from depreciation and taxes Capital replacement costs and intervals are not included in this model (accuracy past 2023 is limshyited) Pie charts on the right show the breakdown of cumulative capital and operating costs over the 7-year analysis period to the cost of dispensed hydrogen
20
costs needed to install the station (red bar) and the $300k site preparation cost (blue bar) make up the balance As discussed earlier land costs are not included in this analysis and site preparation costs can vary quite widely Figure 3 should be used to calculate the change in the cost of hydrogen given any land purchase costs differences in real-world capital or site preparation costs The total installed station costs range from $15M to $19M for the 100 to 300 kgday stations
In 2017 as hydrogen begins to sell at the station revenue begins to roll in but operating costs are also incurred The largest incurred operation cost is the hydrogen fuel supply including the cost of production delivery and storage at the station represented by the light blue bar in Fig 8 This cost increases as the utilization of the station increases (due to more hydrogen required by the station) until 2026 when utilization stabilizes After 2026 the delivered hydrogen costs continue to increase solely due to inflation Contributors to the hydrogen production delivery and tube-trailer storage (labeled delivered H2 in Fig 8) are shown by Figs 4 and 6 and are discussed in Section 21
The purple labor bar in Fig 8 makes up a small percentage of the operating costs This value is calculated using a labor rate of $1370 hr in 2016$ the default rate in HRSAM [4] This labor rate is fixed regardless of the size of the station or the amount of hydrogen sold Maintenance shown by the yellow bar is a slightly larger operating cost contributor Maintenance was estimated at $50kyr (in 2016$ with increases due only to inflation over time) regardless of the station size Maintenance costs can vary quite widely from station to station and from quarter to quarter but this number is near the average annual cost suggested by NRELrsquos Maintenance Costs Over Time CDP8
Electrical costs to run the compressor and chiller at the station make up the balance of the operational cost in Fig 8 shown by the slim gray bar The average compressor energy usage at stations is 42 kW-hrkgH2 according to the Compressor Energy CDP9 from NREL An additional 20 of the compressor energy use was assumed for the refrigeration energy use a factor consistent with HRSAM [4] The cost for electricity shown in Fig 1 was used with this assumed compression and refrigeration energy use to calculate the cost of electricity at the station This cost increases with the amount of hydrogen dispensed and is approximately the same as the maintenance costs for the 300 kgday station after the 80 utilization rate is reached in 2026 For the 200 and 100 kgday stations the electricity usage is proportionately less
For each of the three stations the cost of hydrogen was calculated such that the capital and operating costs were recovered by revenue over 7 years Shown in Fig 8 and tabulated in Table 5 the cost of hydrogen is $3053kg $1837kg and $1426kg for the 100 200 and 300 kgday stations respectively The decrease in hydrogen cost with increasing station capacity is consistent with the Phase 1 Reference Station results [3] and is because the increased revenue from hydrogen sales more than compensates for the increased cost of capital due to the larger station capacity The decreasing hydrogen cost with station capacity also shows a trend of diminishing returns also consistent with the Phase 1 work [3] and increasing the capacity further will not decrease the hydrogen cost so dramatically In fact increasing station capacity will eventually result in
8httpwwwnrelgovhydrogenimagescdp_infr_30jpg 9httpwwwnrelgovhydrogenimagescdp_infr_35jpg
21
Table 5 Installed cost (which includes site preparation engishyneering amp design permitting capital and installation costs) and hydrogen cost for conventional stations with centrally produced delivered hydrogen
capacity (kgday) installed cost ($) H2 cost ($kg)
100 $151M $3053 200 $169M $1837 300 $186M $1426
added capital not considered in this analysis such as multiple dispensers and associated hydrogen chilling equipment additional high pressure cascade storage and additional compressors as station capacity exceeds the throughput of available single compressors
The net income is shown by the purple lines in Fig 8 In 2016 the net income (which is actually an expense in this year without revenue) is not quite the entire capital costs This is due to the depreciation deduction (tax credit) on the capital investment shown by the brown bar In 2017 the net income is slightly greater than the revenue generated by selling hydrogen Once again this is the depreciation deduction on the capital investment which is occurring on a 7 year schedule The overall net expenses and income in all cases reaches a summed value of zero in year 7 (2023) and all income after that point would be earned by the investor (although as stated earlier replacement intervals of equipment are not included in this analysis) Including capital replacement costs would not affect the revenue but would affect the costs in replacement years the tax burden (as this replaced equipment depreciated) and net income in the years past 2023 For all three capacity stations the net income increases (due to inflation and varying operating costs) from about $300-400k year in 2024 to $500-600k yr in 2036
The pie charts on the right in Fig 8 show the contribution from the capital and operating costs over the 7 year payback period to the cost of hydrogen For the 100 kgday station the delivered hydrogen is the largest contributor at 33 followed by the station capital (28) Maintenance is also a large contributor to the cost of hydrogen responsible for 12 of the $3053kg Site preparation and station installation costs are each responsible for roughly 95 of the hydrogen cost Labor accounts for 65 of the hydrogen cost and electricity to run the compressor and chiller is a small contributor at only 2 Overall taxes do not have a net effect on the cost of hydrogen (and therefore do not appear in the pie charts) due to the fact that the capital investment is depreciating on a 7 year schedule providing tax credits in the early years and the fact that we are specifying the cost of hydrogen based on the operator breaking even on their investment in year 7 If we were to determine the cost of hydrogen using a different criterion or if there were capital investments that were not depreciating (or depreciating on an alternative schedule) taxes would have a role in the cost of hydrogen Taxes will also have an impact on the revenue and return on investment over a longer analysis period Note that in this analysis we are not considering the tax to the consumer that is placed on the dispensed fuel
Comparison of the pie charts in Fig 8 shows that as the station capacity increases the stashy
22
tion capital reduces slightly as a percentage of the hydrogen cost while the delivered hydrogen increases its share of the hydrogen cost However the overall cost of delivered hydrogen reduces with increasing capacity from $995kg for the 100 kgday station down to $589kg for the 300 kgday station Electricity on the other hand while increasing as a percentage of the hydrogen cost with increasing capacity contributes approximately $057kg to the cost of hydrogen regardless of the station capacity because the same amount of energy is required to compress and chill each dispensed kg of hydrogen
Figure 9 shows how a conventional station with delivered hydrogen might be organized on a site This is nearly the same layout sketched in the previous reference station design report [3] As with the previous layout the air compressor dryer and cooling water equipment are located near the convenience station so that the air compressor inlet is at least 45 feet away from the hydrogen trailers a prescriptive requirement of NFPA 2 [10] This also prevents this equipment outside the wall from requiring electrical classification The equipment in this layout is spaced out and one could probably devise a smaller footprint The largest contributors to the space requirement are the two tube trailers on-site which would be necessary to prevent interruptions in service The tube trailers drawn are 40rsquo long and sufficient space and delivery routes need to be designed into the layout so that the drivers can drop them off and pick them up
Cost of Delivered Hydrogen
To gain insight into the cost of delivered hydrogen its contribution to the overall cost of hyshydrogen was removed and the overall cost was recalculated Without the delivered hydrogen cost the cost of hydrogen would be $2058 $1147 and $837 for the 100 200 and 300 kgday stashytions respectively The difference between these two scenarios results in delivered hydrogen costs of $995 $690 and $589 per kg Note that these costs includes the leasing two tube-trailers for storage on-site and the cost of delivered centrally produced hydrogen (without the cost of the tube-trailer lease) is $387kg for all three capacity stations The delivered hydrogen cost of $6ndash 10kg is in line with the $6ndash$8kg (in 2014$) reported by Sutherland and Joseck [6] for centrally produced delivered hydrogen of 500ndash1000 kgmonth with a delivery distance of up to 200 miles The delivery distance (assumed to be 200 miles in this analysis) will have a large impact on the cost of delivered hydrogen proportionately changing all of the associated delivery costs shown in Fig 4 which are cumulatively shown as the red bar in Fig 6 The tube-trailer lease price to store hydrogen on-site which is fixed for all three capacity stations is responsible for the decreasing cost of the centrally produced delivered and stored hydrogen as the station capacity increases By having a higher throughput of hydrogen the larger capacity stations are able to spread the cost of the tube trailer lease over a greater quantity of dispensed hydrogen
Comparison of Costs to Previous Study
Neglecting the cost of the delivered hydrogen also allows a comparison to the results of the Phase 1 Reference Station Design report [3] The calculated hydrogen costs without production
23
conveniencestore
50 0
dispenser island
H2 cooling blockH2 chiller
gas panel
high pressure H2storage
compressorwater chillerair compressor
tube trailer
168 0
140
0
30 0
Figure 9 Renderings of a conventional station layout with delivshyered gaseous hydrogen
24
and delivery of $2058 $1147 and $837 are higher than the Phase 1 calculated costs of $1328 $782 and $603 for the 100 200 and 300 kgday stations (shown in Table 1) Several factors contribute to the differences in the calculated fuel cost First the installed capital costs of $15M $17 and $19M in this analysis are higher than those calculated previously of $11M $12M and $13M (even after adjusting for inflation) Second the previous analysis used HRSAM in which the operating costs are calculated a bit differently than this analysis Finally in the previous analshyysis the criteria for hydrogen cost was a 15 discount rate based on a 30 year analysis period which led to a 75 year payback period In this analysis the payback period was set to exactly 7 years (and the discount rate was not considered) If in this analysis the capital costs are reduced to match the previously reported capital costs ($11M $12M and $13M) and the payback period is extended from 7 to 75 years the cost for dispensed hydrogen (without including the cost of hydrogen production and delivery) is calculated as $1521 $823 and $590 for the 100 200 and 300 kgday stations respectively These costs are within 15 of the HRSAM values found in the previous analysis The differences in this case must all be attributed to the second cause of differshying assumptions on operation costs in this analysis method vs the HRSAM method This exercise shows that the economic assumptions in this analysis are in-line with the HRSAM assumptions albeit not exactly the same This exercise also demonstrates that solving for the hydrogen cost to match a payback periodndashas long as that payback period is less than the capital replacement interval on partsndashis a valid alternative to the discount rate analysis used in HRSAM
32 Conventional Station with Hydrogen Produced On-site via Steam Methane Reforming
The costs and revenue for a conventional assemble-on-site station with an on-site steam methane reformer to produce hydrogen are shown in Fig 10 with the installed costs and cost of hydrogen tabulated in Table 6 Inspection of the capital costs incurred in 2016 shows that the largest conshytributor is the SMR unit itself As discussed in Section 22 these SMR units are estimated to cost from just over $1M for a 100 kgday capacity to just under $25M for a 300 kgday capacity Usshying Fig 3 adding a $1M capital investment (depreciable) to a 100 kgday station will add nearly $10kg to the cost of hydrogen to make back that investment in 7 years But for the 100 kgday stashytion with on-site SMR the $3847kg cost of hydrogen is only about $8 higher than the $3053kg for the conventional station with delivered hydrogen The hydrogen cost is calculated based on
Table 6 Installed cost (which includes site preparation engishyneering amp design permitting capital and installation costs) and hydrogen cost for conventional stations with SMR on-site
capacity (kgday) installed cost ($) H2 cost ($kg)
100 $274M $3847 200 $383M $2596 300 $443M $2023
25
site
pre
p
75
station
capital
222
stationinstall 78
SMR c
ap
292
SM
R in
st
15
labor
51
SMR elec
12 natural gas
45 water
07
maintenance188
stat
ion
elec
tric
ity
15
-3000
-2000
-1000
0
1000
2000
3000co
st o
r re
ven
ue (
k$
yr)
tax
site preparationstation capitalstation installSMR capitalSMR install
laborSMR electricity
natural gaswater
maintenancestation electricity
revenue ($3847kg)net income
100 kgday
site
pre
p
55
statio
n
capita
l190
stationinstall 67
SMR c
ap
382
SM
R inst
11
labor
38 SMR elec
17 natural gas
67water
11
maintenance
139
stat
ion
elec
tricit
y
22
-4000
-3000
-2000
-1000
0
1000
2000
3000
4000
cost
or
reve
nu
e (
k$
yr)
tax
site preparationstation capitalstation installSMR capitalSMR install
laborSMR electricity
natural gaswater
maintenancestation electricity
revenue ($2596kg)net income
200 kgday
site
pre
p
47
statio
nca
pita
l182
stationinstall 64
SMR c
ap
395
SM
R in
st
09
labor
33
SMR elec
22
natural gas
86water
14
maintenance
119
stat
ion
elec
tricit
y
28
2020 2025 2030 2035year
-6000
-4000
-2000
0
2000
4000
6000
cost
or
reve
nu
e (
k$y
r)
tax
site preparationstation capitalstation installSMR capitalSMR install
laborSMR electricity
natural gaswater
maintenancestation electricity
revenue ($2023kg)net income
300 kgday
conventional SMR on-site
Figure 10 Cost and revenue associated with a conventional assemble-on-site station with on-site steam methane reforming produced hydrogen to break even at year 7 (2023) The net inshycome includes the effects from depreciation and taxes Capital replacement costs and intervals are not included in this model Pie charts on the right show the breakdown of cumulative capital and operating costs over the 7-year analysis period to the cost of disshypensed hydrogen
26
both capital and operating costs so we can conclude that the operating costs for the 100 kgday SMR are less than the operating costs for the 100 kgday delivered hydrogen station In addition to the common costs for labor station maintenance and station electricity the station with the SMR unit has a nominal operating cost for water for the SMR unit (nearly indistinguishable green bar) requires electricity and natural gas to run the unit (shown by the blue and black bars) and requires additional maintenance over the conventional station with delivered hydrogen (included in the red bar) Maintenance for the SMR unit is assumed to be $50kyear bringing total station maintenance costs to $100k yr However the sum of these costs is less than the cost to deliver and store censhytrally produced hydrogen for the 100 kgday station Operating costs for the SMR station neglect the inefficiencies in shutdownstartup cycles (or venting excess hydrogen) when production is not matched by demand which would further increase costs
The cost of hydrogen for the conventional 100 200 and 300 kgday stations with on-site SMR are $3847kg $2596kg and $2023kg These costs are 26 41 and 42 higher than the costs of hydrogen for a conventional station with delivered gaseous hydrogen As discussed the increased cost of hydrogen comes from the high capital costs for the on-site SMR units slightly offset by a reduced operating cost This can be seen by inspecting the pie charts on the right side of Fig 10 where the SMR capital costs is the largest contributor to the cost of hydrogen accounting for approximately 30-40 of the hydrogen cost For the 200 and 300 kgday stations the capital costs of $2M and $25M add approximately $10kg and $8kg While the operating costs for these stations are lower than the same capacity delivered hydrogen stations these differences fail to decrease the cost of hydrogen to the same level as the delivered hydrogen station Overall this analysis would suggest that while there may be some advantages to utilizing on-site SMR there is not much of a financial case to produce hydrogen on-site using steam methane reforming rather than having hydrogen delivered for 100-300 kgday hydrogen refueling stations unless the capital cost can be reduced significantly
A station with an on-site SMR unit could have a smaller footprint than a station with delivered hydrogen One potential layout is shown in Fig 11 By replacing the tube trailers with an SMR unit significantly less space is required for the fueling station components (compare to Fig 9) Since all hydrogen is produced on-site delivery routes can also be neglected from consideration and walls can enclose all of the hydrogen components reducing setback distances on all sides The SMR unit is shown as being housed in a 20 ft ISO container footprint although to produce 300 kgday it may be possible to have a smaller footprint and even smaller for the stations that only require 100 or 200 kgday For on-site SMR the fueling station components (eg compressor high pressure storage) take up relatively more space than the low pressure hydrogen source (because the SMR is much smaller than the two tube trailers) and laying out these components in a compact manner is important in space-constrained sites
33 Conventional Station with Hydrogen Produced On-site via Electrolysis
Conventional stations with on-site electrolysis have the costs and revenues shown in Fig 12 The installed capital costs and hydrogen costs at each of the three stations are tabulated in Table 7 Similar to the conventional station with a steam methane reforming unit on-site each of these
27
30 0
50 0
154 0
100
0
conveniencestore
dispenser island
compressor
high pressure storagegas panel
H2 chillerH2 cooling block
air compressorwater chiller
20 ft ISO container(electrolyzer or SMR)
Figure 11 Renderings of a conventional station layout with on-site production of hydrogen
28
site prep
72
stat
ion
capit
al
216
station
install 75
eleccapital 197
elec
install
14
elec
el
ectr
icity
177
wate
r02
lab
or
50
maintenance
182
stationelectricity
14
-3000
-2000
-1000
0
1000
2000
3000co
st o
r re
ven
ue (
k$
yr)
taxsite preparationstation capitalstation installelec capitalelec install
elec electricitywater
labormaintenance
station electricity
revenue ($3966kg)net income
100 kgday
site prep
54
stat
ion
capi
tal
186
statio
n
insta
ll65
eleccapital 221
elec
install11
elec
el
ectr
icit
y26
5
water
03
labor
37
maintenance
136
stationelectricity
21
-3000
-2000
-1000
0
1000
2000
3000
cost
or
reve
nu
e (
k$
yr)
taxsite preparationstation capitalstation installelec capitalelec install
elec electricitywater
labormaintenance
station electricity
revenue ($2651kg)net income
200 kgday
site prep44
stat
ion
capi
tal
170
stati
on
inst
all
59
elec
capital 224
elecinstall
09
elec
el
ectr
icit
y32
3
water
04
labor
30
maintenance
111
stationelectricity
26
2020 2025 2030 2035year
-4000
-3000
-2000
-1000
0
1000
2000
3000
4000
cost
or
reve
nu
e (
k$y
r)
taxsite preparationstation capitalstation installelec capitalelec install
elec electricitywater
labormaintenance
station electricity
revenue ($2174kg)net income
300 kgday
conventional electrolysis on-site
Figure 12 Cost and revenue associated with a conventional assemble-on-site station with on-site electrolysis produced hyshydrogen to break even at year 7 (2023) The net income includes the effects from depreciation and taxes Capital replacement costs and intervals are not included in this model Pie charts on the right show the breakdown of cumulative capital and operating costs over the 7-year analysis period to the cost of dispensed hydrogen
29
Table 7 Installed cost (which includes site preparation engishyneering amp design permitting capital and installation costs) and hydrogen cost for conventional stations with electrolysis on-site
capacity (kgday) installed cost ($) H2 cost ($kg)
100 $238M $3966 200 $298M $2651 300 $345M $2174
station designs has a large capital cost due to the electrolysis unit As discussed in Section 23 the electrolysis units cost approximately $800k $12M and $15M for 100 200 and 300 kgday capacities These capital investments will add approximately $8kg $6kg and $5kg to the cost of hydrogen over a conventional station assuming equivalent operating costs During operation there is a large cost associated with electricity to run the electrolysis unit (shown by the yellow bar) This cost scales with the amount of hydrogen produced and is a large factor in the station economics The pie charts on the right show that this electricity accounts for approximately 20-30 of the cost of hydrogen Other additional costs over the conventional delivered hydrogen station are the cost of water to run the electrolysis unit and additional maintenance on the electrolyzer (assumed to be $50k annually as with the SMR)
The electricity required for the electrolyzer costs approximately $300k $600k and $900k (for the 100 200 and 300 kgday stations) in 2036 where utilization has topped out at 80 Centrally produced delivered hydrogen by comparison as shown in Fig 8 costs around $300k $450k and $650k in 2036 with overall operating costs for the delivered hydrogen station (neglecting taxes) topping out at approximately $400k $600k and $800k In addition to the additional capital costs for the electrolyzer (and the other operational costs) it is clear that the economics of a station with an electrolyzer are challenging due to the high electricity consumption even when the electricity is from the current national grid mix with 13 renewable content10 Higher renewable content may further increase this cost component in the near term although fossil-fuel free electricity may become less expensive in the longer term
The cost of hydrogen for the conventional station with an electrolyzer is $3966kg $2651kg and $2174kg for the 100 200 and 300 kgday stations receptively These costs are on-par with the conventional station with SMR within $150kg for all three capacities The cost of hydrogen for a station with on-site production is significantly higher than for a station with delivered hydroshygen Besides improvements in electrical efficiency one strategy for minimizing operating costs is to only operate the electrolyzer at off-peak hours enabling the purchase of lower priced electricity However this might require oversizing the electrolyzer to produce enough hydrogen at off-peak hours to meet demand increasing the capital costs associated with the unit Another method is inshytentionally oversizing the electrolyzer to enable operation at a higher efficiency thereby reducing operating expenses
102015 estimate from httpwwweiagovtoolsfaqsfaqcfmid=92ampt=4
30
To estimate the impact of these methods of operation and aslo gain insight into less expensive renewable electricity costs in the future the model was run with the cost of electricity zeroed-out to calculate the lowest possible cost of hydrogen with cheap electricity In this scenario the cost of hydrogen is $3264kg $1949kg and $1472kg (for the 100 200 and 300 kgday stations) These costs are only slightly higher (by 3-7) than the conventional delivered hydrogen cost due to the capital investment in the electrolyzer and the remaining electrolyzer maintenance and water costs
A station with on-site electrolysis can also be represented by the layout shown in Fig 11 Housing the components necessary for alkaline electrolysis of 100-300 kgday hydrogen might be challenging in a 20 ft ISO container and the layout might need to be increased (to a 30 or 40 ft ISO container) For PEM electrolysis however the components should fit in the 20 ft ISO container and potentially smaller containers for the 100 or 200 kgday stations Similar to the reforming layout the hydrogen components fit in a much more compact space than for the conventional station with delivered hydrogen (shown in Fig 9) and the lot size is reduced
34 Modular Station with Delivered Centrally Produced Hydrogen
Figure 13 shows the cost revenue and income model for a modular station with delivered centrally produced hydrogen and an uninstalled modular unit cost of $15M The installed capital costs and hydrogen costs at each of the three capacity stations are tabulated in Table 8 Recall from Section 25 that the capital costs for modular stations do not follow the same trend as for build-on-site stations because modular stations come in discrete sizes Table 8 shows the installed capital and hydrogen costs for two cases of uninstalled modular station costs of $15M and $1M The only difference in costs between this scenario and the conventional station with delivered centrally produced hydrogen (see Table 5 and Fig 8) are in the capital costs While the installed capital costs including site preparation station capital and installation were $15M and $17M for the 100 and 200 kgday conventional stations it is $186M for all three capacities of the modular
Table 8 Installed cost (which includes site preparation engishyneering amp design permitting capital and installation costs) and hydrogen cost for modular stations with delivered hydrogen for two cases of uninstalled modular cost $15M and $10M
capacity uninstalled installed H2 cost (kgday) modular cost ($) cost ($) ($kg)
100 $15M $186M $3390 200 $15M $186M $1916 300 $15M $186M $1425 100 $1M $136M $2912 200 $1M $136M $1677 300 $1M $136M $1265
31
site
pre
p
85
stationcapital 423
statio
n
install
17d
elive
red
H2
294
labor
58
maintenance107
electricity
17
-2000
-1500
-1000
-500
0
500
1000
1500
2000co
st o
r re
ven
ue (
k$
yr)
tax
site preparationstation capitalstation install
delivered H2labor
maintenanceelectricity
revenue ($3390kg)net income
100 kgday
site
prep
75
station
capital 374
station
install15
delive
red
H2
360
labor
52
maintenance94
electricity
30
-2000
-1500
-1000
-500
0
500
1000
1500
2000
cost
or
reve
nu
e (
k$
yr)
tax
site preparationstation capitalstation install
delivered H2labor
maintenanceelectricity
revenue ($1916kg)net income
200 kgday
site
prep
67
station
capital336
stationinstall 13
del
iver
ed H2
413
labor
46
maintenance85
electricity
40
2020 2025 2030 2035year
-2000
-1500
-1000
-500
0
500
1000
1500
2000
cost
or
reve
nu
e (
k$y
r)
tax
site preparationstation capitalstation install
delivered H2labor
maintenanceelectricity
revenue ($1425kg)net income
300 kgday
modular station delivered hydrogen
Figure 13 Cost and revenue associated with a modular station with centrally produced delivered hydrogen to break even at year 7 (2023) assuming a $15M uninstalled capital cost of the modular station The net income includes the effects from depreciation and taxes Capital replacement costs and intervals are not included in this model Pie charts on the right show the breakdown of cumulashytive capital and operating costs over the 7-year analysis period to the cost of dispensed hydrogen
32
stations This capital investment for a 300 kgday modular station (including site preparation station capital and installation) is coincidentally the same as for a 300 kgday conventional station
If an estimate of $1M (as compared to the conservative estimate of $15M) for the uninstalled capital cost of the modular fueling station unit is used (note that this is still within the range of costs vendors estimated as described in Section 25) the cost of hydrogen will be $2912 $1677 and $1265 for the 100 200 and 300 kgday capacities respectively These costs are all lower than the cost of hydrogen at the equivalent capacity conventional stations As this technology matures and the installed capital cost of the modular units continues to decrease below the installed capital cost of the conventional stations it will make economic sense to site modular stations rather than assembling components on-site Parts standardization and the increased quality control that can be achieved by having modular station components may also lead to reduced maintenance requirements but that potential benefit is not included in this analysis
Figure 14 shows that a modular unit requires a slightly smaller installation area than the conshyventional station components shown in Fig 9 However the tube trailers acting as the hydrogen source and on-site storage still require significant space Similar to the conventional station with delivered hydrogen delivery routes must also be considered when siting a modular station with deshylivered hydrogen The hydrogen components are shown as being housed in a 20 ft ISO container although some 300 kgday modular stations are smaller than this While a slightly overall reduced footprint (relative to as drawn in Fig 14) could be realized we show this layout on the same lot as before Removing the need to store two 40-foot tube trailers by adding on-site low pressure storage could also drastically reduce the footprint by reducing the need to have an open wall for delivery A discussion of how the separation distances can be impacted and the footprints might be reduced due to fire-rated walls is included at the end of the Section 35
33
140
0
168 0
50 0
30 0
dispenser island
tube trailer
modular station(20 ft ISO)
conveniencestore
Figure 14 Renderings of a modular station layout with delivered hydrogen
34
35 Modular Station with Hydrogen Produced On-site via Electrolysis
The final configuration considered in this analysis is a modular station with an electrolysis unit attached to produce hydrogen The economics of this station design are shown in Fig 15 The installed capital costs and hydrogen costs at each of the three capacity stations with two different uninstalled modular unit costs are tabulated in Table 9 Similar to the results in the previous section the cost of hydrogen at the low volume modular electrolysis stations with an assumed $15M uninstalled modular station cost are higher than at the conventional electrolysis station counterpart We find that the cost of hydrogen at these modular stations with electrolysis produced hydrogen will be $4303kg $2730kg and $2173kg (for the 100 200 and 300 kgday stations) These costs are once again $337kg higher $079kg higher and the same (respectively) as the costs at the conventional stations with electrolysis produced hydrogen discussed in Section 33 This cost difference between the analogous conventional station is once again solely due to the differing capital cost of the installed modular station If the capital cost of the modular unit is $1M the hydrogen costs reduce to $3825 $2491 or $2013kg (for the 100 200 and 300 kgday stations) which are all lower than the cost at the similarly sized conventional stations with on-site electrolysis due to the lower installed station cost
Having on-site production using an electrolyzer and modular fueling station components only requires a small footprint for installation as shown in Fig 16 The ISO containers can house apshypropriate fire-rated barrier walls reducing separation distance for Group 1 and 2 exposures (except for air intakes) by half and eliminating separation distances for Group 3 exposures as described in Section 732312 of NFPA 2 The Hydrogen Technologies Code (2016) [10] Group 1 exshyposures are lot lines air intakes (HVAC compressors other) operable openings in buildings and structures and ignition sources such as open flames and welding Group 2 exposures are exshyposed persons (other than those servicing the system) and parked cars Group 3 exposures include buildings flammable gas storage hazardous materials storage ordinary combustibles horizontal distance to overhead electrical wire and piping containing other hazardous material This means
Table 9 Installed cost (which includes site preparation engishyneering amp design permitting capital and installation costs) and hydrogen cost for modular stations with on-site electrolysis proshyduced hydrogen for two cases of uninstalled modular cost $15M and $10M
capacity uninstalled installed H2 cost (kgday) modular cost ($) cost ($) ($kg)
100 $15M $274M $4303 200 $15M $314M $2730 300 $15M $345M $2173 100 $1M $224M $3825 200 $1M $264M $2491 300 $1M $295M $2013
35
site prep67
stat
ion
capit
al
333
stationinstall 13
eleccapital 181
elec
install
13
elec
el
ectr
icity
163
wate
r0
2
labor
46
maintenance
168
stationelectricity
13
-3000
-2000
-1000
0
1000
2000
3000co
st o
r re
ven
ue (
k$
yr)
taxsite preparationstation capitalstation installelec capitalelec install
elec electricitywater
labormaintenance
station electricity
revenue ($4303kg)net income
100 kgday
site prep53
stat
ion
capi
tal
263
station
install
11
eleccapital 214
elec
install11
elec
elec
tric
ity
257
water
03
lab
or
36
maintenance
132
stationelectricity
21
-4000
-3000
-2000
-1000
0
1000
2000
3000
4000
cost
or
reve
nu
e (
k$
yr)
taxsite preparationstation capitalstation installelec capitalelec install
elec electricitywater
labormaintenance
station electricity
revenue ($2730kg)net income
200 kgday
site prep44
stat
ion
capi
tal
220
stati
on
inst
all
09
elec
capital 224
elecinstall 09
elec
elec
tric
ity32
3
water
04
labor
30 maintenance
111
stationelectricity
26
2020 2025 2030 2035year
-4000
-3000
-2000
-1000
0
1000
2000
3000
4000
cost
or
reve
nu
e (
k$y
r)
taxsite preparationstation capitalstation installelec capitalelec install
elec electricitywater
labormaintenance
station electricity
revenue ($2173kg)net income
300 kgday
modular station electrolysis on-site
Figure 15 Cost and revenue associated with a modular station with on-site electrolysis produced hydrogen to break even at year 7 (2023) assuming a $15M uninstalled capital cost of the modular station The net income includes the effects from depreciation and taxes Capital replacement costs and intervals are not included in this model Pie charts on the right show the breakdown of cumulashytive capital and operating costs over the 7-year analysis period to the cost of dispensed hydrogen
36
electrolyzer(20 ft ISO)
modular station(20 ft ISO)
convenience store
dispenser island
100
0
100 0
17 0
Figure 16 Renderings of a modular station layout with an elecshytrolyzer for on-site production with a small reduced footprint
37
for a typical pipe diameter of 028rdquo and up to 15000 psi pressure (within the operating range of the cascade storage at a refueling station) air intakes must remain 34 ft from the containers while lot lines other building openings or ignition sources only need 17 ft of separation Exposed persons and parked cars must be 8 ft or more away from the containers and other exposures (including other combustibles like gasoline) do not need any separation from the containers This will allow a compact layout an example of which is shown in Fig 16
38
4 Conclusions
Five station designs were considered in this analysis with three capacities of each station deshysign With the current technology the lowest cost hydrogen source assessed here11 is tube-trailers delivering centrally produced gaseous hydrogen Shown in Table 10 or graphically in Fig 17 for either a conventional or modular station with a 300 kgday capacity and delivered hydrogen gas (using our conservative $15M cost estimate for the modular unit) it would cost approximately $186M to prepare the site and build the station and at a dispensed hydrogen cost of $1425kg a station operator would break even on their capital investments and operational costs in 7 years If the capital cost of the modular station unit is only $1M which is still in the range of cost estimates by manufacturers a modular station with delivered hydrogen would cost $136M to build and for a 300 kgday capacity hydrogen would cost $1265kg Embedded in all of these analyses is the utilization profile shown in Fig 2 which is the reason that the hydrogen cost increases as the cashypacity (and utilization) decreases for the modular stations with delivered hydrogen although they have the same installed cost
The specified 7-year return on investment results in higher cost hydrogen for smaller stations than for larger ones due to less throughput and higher capital cost per kg of capacity (see the lower left frame of Fig 17) If the SDO charges customers a price lower than this cost the result will be a longer return on investment Setting the same price regardless of station capacity will result in the 100 kgday station having the longest return on investment and the 300 kgday having the shortest
The addition of a steam methane reformer or an electrolyzer to a hydrogen refueling station increases the capital cost significantly with the steam methane reformer estimated to have the
11The cost of liquid delivery was not included in this analysis
Table 10 Installed cost (which includes site preparation engishyneering amp design permitting component capital and installation costs) and resulting hydrogen cost to break even at year 7 for the stations analyzed in this work
station capacity rarr 100 kgday 200 kgday 300 kgday
station type darr installed cost ($)
H2 cost ($kg)
installed cost ($)
H2 cost ($kg)
installed cost ($)
H2 cost ($kg)
conventional delivered H2 conventional SMR H2 conventional electrolysis H2 modular ($15M) delivered H2 modular ($1M) delivered H2 modular ($15M) electrolysis H2 modular ($1M) electrolysis H2
$151M $274M $238M $186M $136M $274M $224M
$3053 $3847 $3966 $3390 $2912 $4303 $3825
$169M $383M $298M $186M $136M $314M $264M
$1837 $2596 $2651 $1916 $1677 $2730 $2491
$186M $443M $345M $186M $136M $345M $295M
$1426 $2023 $2174 $1425 $1265 $2173 $2013
39
$00M$05M$10M$15M$20M$25M$30M$35M$40M$45M
inst
all
ed
cost
($)
capacity (kgday)
100 200 300
conv
ention
al d
eliv
ered
gas
conv
ention
al S
MR
conv
ention
al e
lect
roly
sis
mod
ular
($1
5M
) d
eliv
ered
gas
mod
ular
($1
M) d
eliv
ered
gas
mod
ular
($1
5M
) e
lect
roly
sis
mod
ular
($1
M) e
lect
roly
sis
$0k
$5k
$10k
$15k
$20k
$25k
$30k
inst
all
ed
cost
($[
kg
day]
)
conv
ention
al d
eliv
ered
gas
conv
ention
al S
MR
conv
ention
al e
lect
roly
sis
mod
ular
($1
5M
) d
eliv
ered
gas
mod
ular
($1
M) d
eliv
ered
gas
mod
ular
($1
5M
) e
lect
roly
sis
mod
ular
($1
M) e
lect
roly
sis
$0$5
$10$15$20$25$30$35$40$45
H2 c
ost
($k
g)
capacity (kgday)
100 200 300
Figure 17 Installed cost (which includes site preparation engishyneering amp design permitting component capital and installation costs) are shown in the left frames The top frame is the total inshyvestment in 2016$ while the bottom left frame is the installed cost per mass of hydrogen dispensed (kgday) The hydrogen cost to break even at year 7 is shown in the right frame for the stations analyzed in this work
40
highest capital cost On-site production does allow for a more compact station footprint and does not require consideration for tube-trailer delivery routes With current technology and projected utility prices operating a steam methane reformer costs slightly less than operating an electrolyzer These offsetting differences in capital vs operational costs causes the price of hydrogen to be very similar for a station with SMR produced hydrogen and electrolysis produced hydrogen In both cases the cost of hydrogen is $6-$10kg more for the stations that produce hydrogen on-site than the stations that have hydrogen delivered This analysis does not include the startup and shutdown inefficiencies (and associated costs) for either the SMR or electrolyzer The penalty for cycling a SMR is likely greater than for cycling an electrolyzer potentially giving an electrolyzer an economic advantage for on-site production
Electrolyzers also have the potential to produce less carbon dioxide than SMRrsquos By definishytion SMRrsquos require methane which contains carbon to produce hydrogen releasing the carbon molecules as carbon dioxide and contributing to climate change A reduced carbon footprint could be achieved by using bio-gas or implementing carbon capture and storage (although this would incur an efficiency penalty) Electrolyzers on the other hand require only electricity and water giving this technology the potential to be completely carbon free given the right source of elecshytricity such as solar wind hydroelectric or nuclear The key to making on-site production more cost competitive with delivered hydrogen is reducing the utility costs For electrolysis this can be achieved through efficiency improvements (although around 50-70 efficiencies are achieved with current technology) through the purchase of low cost off-peak electricity or by using elecshytricity generated behind the meter Of course reducing capital cost and maintenance requirements of on-site production units will also improve the economics of this technology
According to our research current modular fueling stations where components are assembled and tested at a central production facility have installed costs no higher than conventional stations Using our high estimate of $15M for the modular unit the installed cost of the 300 kgday modular station is nearly the same as for a 300 kgday conventional station Using a lower cost estimate of $1M for the modular unit the installed cost of a 100 kgday conventional station is 11 higher than the modular station With greater industry experience and higher volume production we would anticipate the cost of modular stations to reduce in the near-future Developing stations in this manner may lead to better quality control and reduced maintenance requirements for hydrogen fueling stations It is also possible to achieve more compact station footprints by modularizing the station components by building in appropriate fire-rated barrier walls Because of these potential benefits we anticipate modularization and standardization to increase in the future
This report details the economics of current hydrogen refueling stations and includes some sketches of potential layouts We have visually depicted the contributions to capital and operational costs of hydrogen for different station concepts making it easy to find the largest contributors to a high cost of hydrogen to the consumer This information can be used to devote research and development towards these high contributors At the station the dispenser compressors and chillers are expensive pieces where additional development or higher volume production could reduce station costs For electrolysis the purchase of low-priced electricity could serve to make on-site production cost competitive with central production and delivery This report enables the comparison of different station concepts that could be implemented in various market scenarios
41
A Piping amp Instrumentation Diagram
The following pages show the piping and instrumentation diagram for the included reference stations For the conventional stations all components need to be assembled on-site The dashed boxes show the components that are often modularized for the modular stations For reference the utility requirements shown in the PampID are also included here in Table A1
Table A1 Utility requirement estimateslowast for the stations in this report
capacity 100 kgday 200 kgday 300 kgday
compressor power electrolyzer power electrolyzer water SMR power SMR water SMR gas
25 kW 260 kW 110 lhr 16 kW 400 lhr 34 Nm3hr
60 kW 510 kW 220 lhr 33 kW 800 lhr 68 Nm3hr
100 kW 770 kW 330 lhr 49 kW 1200 lhr 101 Nm3hr
lowast These are averages based on manufacturer specifications and literature and are meant to give an estimate of site requirements For exact specifishycations to meet station requirements consult a manufacturer directly
42
ABCDEFGHIJK1
2
3
4
5
6
7
Measured Variable Readout of function Output Function ModifierA Air AlarmB Burner Storage Users Choice Users ChoiceC Compressor ClosedD DispenserE Electrolyzer Sensor (primary Element)F Flow FilterG Chiller Glass viewingH Hand HighI Current IndicatorJ PowerK Time Control StationL Level Light LowM Conductivity MiddleN Users Choice Users Choice Hydrogen Users ChoiceO Water Orifice restriction Air OpenP PressureQ QuantityR Reformer Record ReduceS Speed Frequency SwitchT Temperature TransmitU Multivariate Multifunction Multifunction MultifunctionV Vibration ValveW Weight Well WaterX Unclassified Unclassified Unclassified UnclassifiedY State RelayZ Position Actuator
PROCESS AND SIGNAL LINES
HYDROGEN PROCESS LINE
DEIONIZED WATER PROCESS LINE
PNEUMATIC SIGNAL LINE
NITROGEN SIGNAL LINE
ELECTRICAL SIGNAL LINE
SV
VALVES
BALL VALVE
NEEDLE VALVE
CHECK VALVE
SOLENOID VALVE
AIR ACTUATED VALVE SPRING RETURN CLOSE
PRESSURE REDUCING VALVE
TWO WAY PRESSURE RELIEF
THREE WAY PRESSURE RELIEF
EQUIPMENT
FILTER
PUMP
DRYER
HYDROGEN COMPRESSOR
STORAGE TANK
IR FLAME DETECTOR
Line Service Identification codesCCA-CLEAN COMPRESSED AIRCHW-CHILLED WATERH-HYDROGENN-NITROGEN
Pipe Specification Details3000PSI Min pressure rating of 3000 PSI 316316L austenitic stainless steel tubing UNS S31600 (316) UNS S31603 (316L)6500PSI Min pressure rating of 6500 PSI 316316L austenitic stainless steel tubing UNS S31600 (316) UNS S31603 (316L)15000PSI Min pressure rating of 15000 PSI 316316L austenitic stainless steel tubing UNS S31600 (316) UNS S31603 (316L)POLY Polyamide (Nylon) pneumatic tubing light and heat stabilized0032CU 0032 wall copper alloy 122 seamless tubingSCH40 Schedule 40 iron pipe
Line symbolsXrdquo-XXX-XXXX-XXX-XXX
Line size nominal inches
Service
Line Number (if assigned)
Pipe Spec
Insulation (if applicable)
Insulation codesF1- Soda-lime silicate glass (FOAMGLAS) 1 wall thicknessF2- Buna N Foam 38 thick
ABCDEFGHIJK1
2
3
4
5
6
7
CNH-300
HV-202HV-203
HV-201PT-300PI-300 HV-300
HV-301
Motor460-V 3Oslash SEE NOTE 1
Heater120-V 1Oslash 500 W
PT-202PI-202
34-H-VENT
1-frac14rdquo-CHW-800-SCH40
1-frac14rdquo-CHW-800-SCH40-F2
CW-800
GW-800
HV-202
HV-300
FV-100
ZSO-100
ZSC-100
ZI-100
FSV-100
ZZO-100
FSV-30038-H-3000PSI
38-H-5000PSI
38-H-5000PSI
38-H-15000PSI
34-H-VENT
OF-802TO COMMON frac34rdquo VENT MAST LOCATED ON BACK OF GMP
10 ABOVE GRADE
REFERENCE STATION 100-300 KGDAY
FF-300
GW-801
PI-101 PT-101
H2 Storage PBNH-402MAWP-15000 PSIG
H2 Storage PBNH-403MAWP-15000 PSIG
H2 Storage PBNH-401MAWP-15000 PSIG
FV-401
ZSO-401 ZSC-401
ZZO-401
FV-402
ZSO-402 ZSC-402
ZZO-402
FV-403
ZSO-403 ZSC-403
ZZO-403
FV-400
ZSO-400 ZSC-400
ZZO-400 GN-900
CHILLER 75-kW
DN-900JSS-901(EPO)
To EPO circuit
700-BAR NOZZLE
350-BAR NOZZLE
38-H-15000PSI
H70-T40H70-Warm
H35-T0
3570MPa DISPENSERWUN-900
FVControls Internal120V 1p 15A
GN-901
HEAT EXCHANGER1350 lbs
HV-901
H70-Cold
H2 Delivery Trailer multiple tubes one outlet
COH-100Air Compressor
PBAL-100
HV-100
AF-100
Air DryerAF-101
HV-900
PT-403PI-403
HV-403
PT-402PI-402
HV-402
PT-401PI-401
HV-401
HV-411
HV-412
HV-413
ZI-401
ZI-402
ZI-403
FV-101
ZSO-101 ZSC-101 ZI-101
ZZO-101
ZVO-100
ZVO-101
ZVO-900
ZVO-401
ZVO-400
ZVO-402
ZVO-403
RAH-100IR FLAME DETECTOR
AIMED AT HYDROGEN SOURCEAND ZONE 400
HIGH PRESSURE STORAGE
TO FIRE PANEL
RAH-900
IR FLAME DETECTORAIMED AT DISP HOSES
TO FIRE PANEL
HV-101
38-H-15000PSI
ZI-400
HV-400
FSV-200
EN-100ELECTROLYZER SKID
20 BAR (300 PSI) OUTPUT
RN-100STEAM METHANE REFORMER (SMR)
SKID13 BAR (200 PSI) OUTPUT
ZVO-102
Power460-V 3OslashSEE NOTE 1
Power460-V 3OslashSEE NOTE 1
ONLY ONE HYDROGEN SUPPLY OPTION IS USED PER STATION 1 TUBE TRAILER DELIVERY2 ON-SITE ELECTROLYSIS3 ON-SITE STEAM METHANE REFORMER
MUNICIPAL WATER SUPPLY
SEE NOTE 1
NATURAL GAS BIOGAS METHANE SUPPLY
SEE NOTE 1
NOTE 1 UTILITY REQUIREMENTS DEPEND ON STATION CAPACITY AND CAN BE ESTIMATED BASED ON THE FOLLOWING TABLESTATION CAPACITY 100 KGDAY 200 KGDAY 300 KGDAYELECTROLYZER POWER 260 KW 510 KW 770 KWELECTROLYZER WATER 110 LHR 220 LHR 330 LHRSMR POWER 16 KW 33 KW 49 KWSMR WATER 400 LHR 800 LHR 1200 LHRSMR GAS 34 NM3HR 68 NM3HR 101 NM3HRCOMPRESSOR POWER 25 KW 60 KW 100 KW
NOTE 2 ON-SITE PRODUCTION UNITS MAY INCORPORATE THEIR OWN INSTRUMENT AIR SYSTEM AND INTERCONNECTION WITH CSD SKIDCONTAINER MAY NOT BE NECESSARYNOTE 3 APPLIES TO MODULAR STATION ONLY A BUILD-ON-SITE STATION WILL NOT HAVE A SKID-OR CONTAINER-MOUNTED PRE-ASSEMBLED SYSTEMNOTE 4 IN SOME MODULAR STATIONS THE DISPENSER WILL BE A SEPARATELY-INSTALLED COMPONENTNOTE 5 IN MANY MODULAR STATIONS THE HEAT EXCHANGE EQUIPMENT WILL BE ROOF-MOUNTED
NOTE 2
COMPRESSION STORAGE AND DISPENSER (CSD) SKID OR CONTAINER BOUNDARY SEE NOTE 3
NOTE 4
NOTE 5
NOTE 5
PLCGas Control Cabinet
COMPRESSORMULTIPLE STAGES
References
[1] US Energy Information Administration EIA Open Data - Intro - US Energy Information Administration (EIA) accessed July 2016 httpwwweiagovopendata
[2] US DOE DOE H2A Production Analysis accessed May 2016 httpswwwhydrogen energygovh2a_productionhtml
[3] Joseph Pratt Danny Terlip Chris Ainscough Jennifer Kurtz and Amgad Elgowainy H2FIRST reference station design task Technical Report SAND2015-2660 R Sandia National Laboratories April 2015 Available at httpenergygoveerefuelcells h2first
[4] US DOE DOE H2A Delivery Analysis accessed May 2016 httpswwwhydrogen energygovh2a_deliveryhtml
[5] 2016 Annual Evaluation of Hydrogen Fuel Cell Electric Vehicle Deployment and Hydrogen Fuel Station Network Development Technical report California Environmental Protection Agency Air Resources Board July 2016 Available at httpswwwarbcagovmsprog zevproghydrogenhydrogenhtm
[6] E Sutherland and F Joseck Low volume production and delivery cost Technical Report 15011 Department of Energy Hydrogen and Fuel Cells Program Record 2015
[7] Ricardo Guerrero Lemus and Jose Manuel Martinez Duart Updated hydrogen production costs and parities for conventional and renewable technologies International Journal of Hydrogen Energy 35(9)3929ndash3936 2010
[8] Alfredo Ursua Luis M Gandia and Pablo Sanchis Hydrogen production from water elecshytrolysis current status and future trends Proceedings of the IEEE 100(2)410ndash426 2012
[9] G Parks R Boyd J Cornish and R Remick Hydrogen station compression storage and dispensing technical status and costs Systems integration Technical Report NRELBKshy6A10-58564 National Renewable Energy Laboratory (NREL) Golden CO May 2014
[10] NFPA 2 Hydrogen Technologies Code Technical report National Fire Protection Associashytion 2016
45
- Executive Summary
- Acknowledgment
- Contents
- Figures
- Tables
- 1 Introduction
-
- 11 Background and Contents
- 12 Approach
- 13 Method Overview
-
- 2 Station Cost Components
-
- 21 Centrally Produced Hydrogen and Delivery
- 22 Hydrogen Produced On-Site via Steam Methane Reforming
- 23 Hydrogen Produced On-Site via Electrolysis
- 24 Compression Storage and Ancillary Equipment for a Conventional Station
- 25 Packaged Compression Storage and Ancillary Equpiment for a Modular Station
- 26 Hydrogen Dispensers
-
- 3 Results Station Designs and Costs
-
- 31 Conventional Station with Delivered Centrally Produced Hydrogen
- 32 Conventional Station with Hydrogen Produced On-Site via Steam Methane Reforming
- 33 Conventional Station with Hydrogen Produced On-Site via Electrolysis
- 34 Modular Station with Delivered Centrally Produced Hydrogen
- 35 Modular Station with Hydrogen Produced On-Site via Electrolysis
-
- 4 Conclusions
- Appendix A Piping and Instrumentation Diagram
- References
-
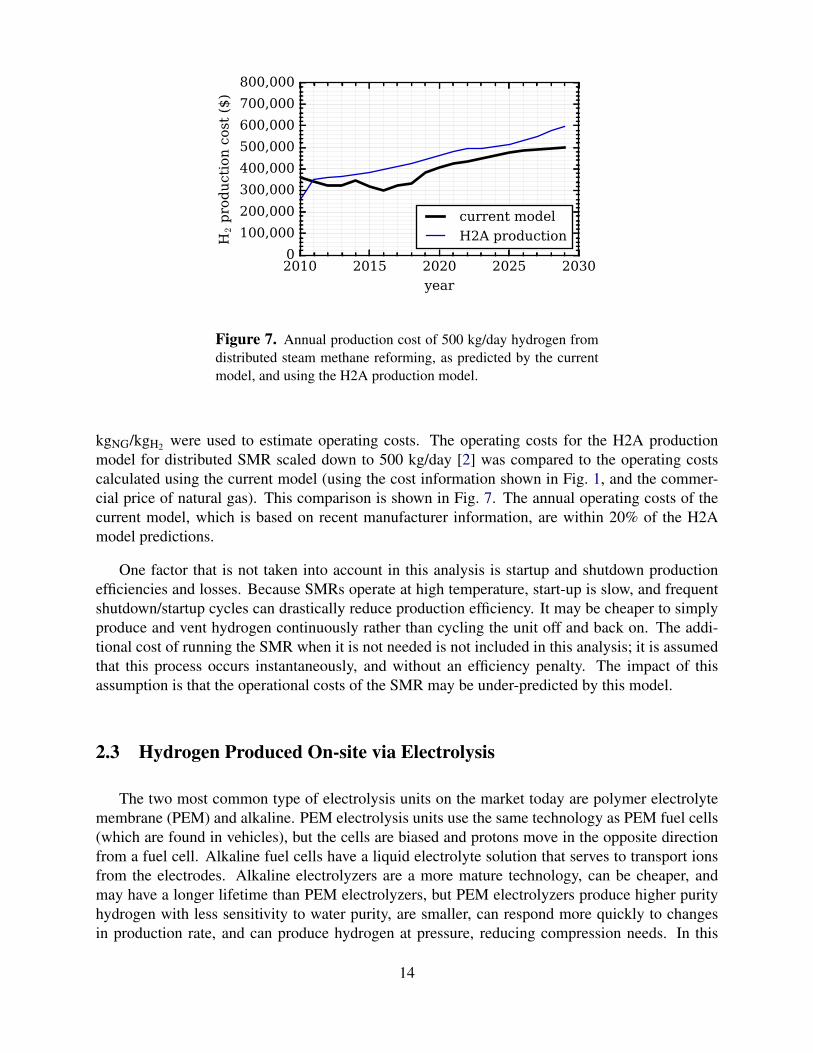

site prep
94
stati
on
cap
ital
280
stationinstall 98
deliv
ered
H 232
6
labor
65
maintenance
118
electricity19
-2000
-1500
-1000
-500
0
500
1000
1500
2000co
st o
r re
ven
ue (
k$
yr)
tax
site preparationstation capitalstation install
delivered H2labor
maintenanceelectricity
revenue ($3053kg)net income
100 kgday
site prep
78
stat
ion
capit
al
269
stationinstall 94
deliv
ered
H 237
6
labor
54
maintenance
98
electricity31
-2000
-1500
-1000
-500
0
500
1000
1500
2000
cost
or
reve
nu
e (
k$
yr)
tax
site preparationstation capitalstation install
delivered H2labor
maintenanceelectricity
revenue ($1837kg)net income
200 kgday
site prep
67
stat
ion
capit
al
259
station
install 91
deliv
ered
H 2
413
labor
46
maintenance
84
electricity40
2020 2025 2030 2035year
-2000
-1500
-1000
-500
0
500
1000
1500
2000
cost
or
reve
nu
e (
k$y
r)
tax
site preparationstation capitalstation install
delivered H2labor
maintenanceelectricity
revenue ($1426kg)net income
300 kgday
conventional delivered H2
Figure 8 Cost and revenue associated with a conventional assemble-on-site station with centrally produced delivered hydroshygen to break even at year 7 (2023) The net income includes the effects from depreciation and taxes Capital replacement costs and intervals are not included in this model (accuracy past 2023 is limshyited) Pie charts on the right show the breakdown of cumulative capital and operating costs over the 7-year analysis period to the cost of dispensed hydrogen
20
costs needed to install the station (red bar) and the $300k site preparation cost (blue bar) make up the balance As discussed earlier land costs are not included in this analysis and site preparation costs can vary quite widely Figure 3 should be used to calculate the change in the cost of hydrogen given any land purchase costs differences in real-world capital or site preparation costs The total installed station costs range from $15M to $19M for the 100 to 300 kgday stations
In 2017 as hydrogen begins to sell at the station revenue begins to roll in but operating costs are also incurred The largest incurred operation cost is the hydrogen fuel supply including the cost of production delivery and storage at the station represented by the light blue bar in Fig 8 This cost increases as the utilization of the station increases (due to more hydrogen required by the station) until 2026 when utilization stabilizes After 2026 the delivered hydrogen costs continue to increase solely due to inflation Contributors to the hydrogen production delivery and tube-trailer storage (labeled delivered H2 in Fig 8) are shown by Figs 4 and 6 and are discussed in Section 21
The purple labor bar in Fig 8 makes up a small percentage of the operating costs This value is calculated using a labor rate of $1370 hr in 2016$ the default rate in HRSAM [4] This labor rate is fixed regardless of the size of the station or the amount of hydrogen sold Maintenance shown by the yellow bar is a slightly larger operating cost contributor Maintenance was estimated at $50kyr (in 2016$ with increases due only to inflation over time) regardless of the station size Maintenance costs can vary quite widely from station to station and from quarter to quarter but this number is near the average annual cost suggested by NRELrsquos Maintenance Costs Over Time CDP8
Electrical costs to run the compressor and chiller at the station make up the balance of the operational cost in Fig 8 shown by the slim gray bar The average compressor energy usage at stations is 42 kW-hrkgH2 according to the Compressor Energy CDP9 from NREL An additional 20 of the compressor energy use was assumed for the refrigeration energy use a factor consistent with HRSAM [4] The cost for electricity shown in Fig 1 was used with this assumed compression and refrigeration energy use to calculate the cost of electricity at the station This cost increases with the amount of hydrogen dispensed and is approximately the same as the maintenance costs for the 300 kgday station after the 80 utilization rate is reached in 2026 For the 200 and 100 kgday stations the electricity usage is proportionately less
For each of the three stations the cost of hydrogen was calculated such that the capital and operating costs were recovered by revenue over 7 years Shown in Fig 8 and tabulated in Table 5 the cost of hydrogen is $3053kg $1837kg and $1426kg for the 100 200 and 300 kgday stations respectively The decrease in hydrogen cost with increasing station capacity is consistent with the Phase 1 Reference Station results [3] and is because the increased revenue from hydrogen sales more than compensates for the increased cost of capital due to the larger station capacity The decreasing hydrogen cost with station capacity also shows a trend of diminishing returns also consistent with the Phase 1 work [3] and increasing the capacity further will not decrease the hydrogen cost so dramatically In fact increasing station capacity will eventually result in
8httpwwwnrelgovhydrogenimagescdp_infr_30jpg 9httpwwwnrelgovhydrogenimagescdp_infr_35jpg
21
Table 5 Installed cost (which includes site preparation engishyneering amp design permitting capital and installation costs) and hydrogen cost for conventional stations with centrally produced delivered hydrogen
capacity (kgday) installed cost ($) H2 cost ($kg)
100 $151M $3053 200 $169M $1837 300 $186M $1426
added capital not considered in this analysis such as multiple dispensers and associated hydrogen chilling equipment additional high pressure cascade storage and additional compressors as station capacity exceeds the throughput of available single compressors
The net income is shown by the purple lines in Fig 8 In 2016 the net income (which is actually an expense in this year without revenue) is not quite the entire capital costs This is due to the depreciation deduction (tax credit) on the capital investment shown by the brown bar In 2017 the net income is slightly greater than the revenue generated by selling hydrogen Once again this is the depreciation deduction on the capital investment which is occurring on a 7 year schedule The overall net expenses and income in all cases reaches a summed value of zero in year 7 (2023) and all income after that point would be earned by the investor (although as stated earlier replacement intervals of equipment are not included in this analysis) Including capital replacement costs would not affect the revenue but would affect the costs in replacement years the tax burden (as this replaced equipment depreciated) and net income in the years past 2023 For all three capacity stations the net income increases (due to inflation and varying operating costs) from about $300-400k year in 2024 to $500-600k yr in 2036
The pie charts on the right in Fig 8 show the contribution from the capital and operating costs over the 7 year payback period to the cost of hydrogen For the 100 kgday station the delivered hydrogen is the largest contributor at 33 followed by the station capital (28) Maintenance is also a large contributor to the cost of hydrogen responsible for 12 of the $3053kg Site preparation and station installation costs are each responsible for roughly 95 of the hydrogen cost Labor accounts for 65 of the hydrogen cost and electricity to run the compressor and chiller is a small contributor at only 2 Overall taxes do not have a net effect on the cost of hydrogen (and therefore do not appear in the pie charts) due to the fact that the capital investment is depreciating on a 7 year schedule providing tax credits in the early years and the fact that we are specifying the cost of hydrogen based on the operator breaking even on their investment in year 7 If we were to determine the cost of hydrogen using a different criterion or if there were capital investments that were not depreciating (or depreciating on an alternative schedule) taxes would have a role in the cost of hydrogen Taxes will also have an impact on the revenue and return on investment over a longer analysis period Note that in this analysis we are not considering the tax to the consumer that is placed on the dispensed fuel
Comparison of the pie charts in Fig 8 shows that as the station capacity increases the stashy
22
tion capital reduces slightly as a percentage of the hydrogen cost while the delivered hydrogen increases its share of the hydrogen cost However the overall cost of delivered hydrogen reduces with increasing capacity from $995kg for the 100 kgday station down to $589kg for the 300 kgday station Electricity on the other hand while increasing as a percentage of the hydrogen cost with increasing capacity contributes approximately $057kg to the cost of hydrogen regardless of the station capacity because the same amount of energy is required to compress and chill each dispensed kg of hydrogen
Figure 9 shows how a conventional station with delivered hydrogen might be organized on a site This is nearly the same layout sketched in the previous reference station design report [3] As with the previous layout the air compressor dryer and cooling water equipment are located near the convenience station so that the air compressor inlet is at least 45 feet away from the hydrogen trailers a prescriptive requirement of NFPA 2 [10] This also prevents this equipment outside the wall from requiring electrical classification The equipment in this layout is spaced out and one could probably devise a smaller footprint The largest contributors to the space requirement are the two tube trailers on-site which would be necessary to prevent interruptions in service The tube trailers drawn are 40rsquo long and sufficient space and delivery routes need to be designed into the layout so that the drivers can drop them off and pick them up
Cost of Delivered Hydrogen
To gain insight into the cost of delivered hydrogen its contribution to the overall cost of hyshydrogen was removed and the overall cost was recalculated Without the delivered hydrogen cost the cost of hydrogen would be $2058 $1147 and $837 for the 100 200 and 300 kgday stashytions respectively The difference between these two scenarios results in delivered hydrogen costs of $995 $690 and $589 per kg Note that these costs includes the leasing two tube-trailers for storage on-site and the cost of delivered centrally produced hydrogen (without the cost of the tube-trailer lease) is $387kg for all three capacity stations The delivered hydrogen cost of $6ndash 10kg is in line with the $6ndash$8kg (in 2014$) reported by Sutherland and Joseck [6] for centrally produced delivered hydrogen of 500ndash1000 kgmonth with a delivery distance of up to 200 miles The delivery distance (assumed to be 200 miles in this analysis) will have a large impact on the cost of delivered hydrogen proportionately changing all of the associated delivery costs shown in Fig 4 which are cumulatively shown as the red bar in Fig 6 The tube-trailer lease price to store hydrogen on-site which is fixed for all three capacity stations is responsible for the decreasing cost of the centrally produced delivered and stored hydrogen as the station capacity increases By having a higher throughput of hydrogen the larger capacity stations are able to spread the cost of the tube trailer lease over a greater quantity of dispensed hydrogen
Comparison of Costs to Previous Study
Neglecting the cost of the delivered hydrogen also allows a comparison to the results of the Phase 1 Reference Station Design report [3] The calculated hydrogen costs without production
23
conveniencestore
50 0
dispenser island
H2 cooling blockH2 chiller
gas panel
high pressure H2storage
compressorwater chillerair compressor
tube trailer
168 0
140
0
30 0
Figure 9 Renderings of a conventional station layout with delivshyered gaseous hydrogen
24
and delivery of $2058 $1147 and $837 are higher than the Phase 1 calculated costs of $1328 $782 and $603 for the 100 200 and 300 kgday stations (shown in Table 1) Several factors contribute to the differences in the calculated fuel cost First the installed capital costs of $15M $17 and $19M in this analysis are higher than those calculated previously of $11M $12M and $13M (even after adjusting for inflation) Second the previous analysis used HRSAM in which the operating costs are calculated a bit differently than this analysis Finally in the previous analshyysis the criteria for hydrogen cost was a 15 discount rate based on a 30 year analysis period which led to a 75 year payback period In this analysis the payback period was set to exactly 7 years (and the discount rate was not considered) If in this analysis the capital costs are reduced to match the previously reported capital costs ($11M $12M and $13M) and the payback period is extended from 7 to 75 years the cost for dispensed hydrogen (without including the cost of hydrogen production and delivery) is calculated as $1521 $823 and $590 for the 100 200 and 300 kgday stations respectively These costs are within 15 of the HRSAM values found in the previous analysis The differences in this case must all be attributed to the second cause of differshying assumptions on operation costs in this analysis method vs the HRSAM method This exercise shows that the economic assumptions in this analysis are in-line with the HRSAM assumptions albeit not exactly the same This exercise also demonstrates that solving for the hydrogen cost to match a payback periodndashas long as that payback period is less than the capital replacement interval on partsndashis a valid alternative to the discount rate analysis used in HRSAM
32 Conventional Station with Hydrogen Produced On-site via Steam Methane Reforming
The costs and revenue for a conventional assemble-on-site station with an on-site steam methane reformer to produce hydrogen are shown in Fig 10 with the installed costs and cost of hydrogen tabulated in Table 6 Inspection of the capital costs incurred in 2016 shows that the largest conshytributor is the SMR unit itself As discussed in Section 22 these SMR units are estimated to cost from just over $1M for a 100 kgday capacity to just under $25M for a 300 kgday capacity Usshying Fig 3 adding a $1M capital investment (depreciable) to a 100 kgday station will add nearly $10kg to the cost of hydrogen to make back that investment in 7 years But for the 100 kgday stashytion with on-site SMR the $3847kg cost of hydrogen is only about $8 higher than the $3053kg for the conventional station with delivered hydrogen The hydrogen cost is calculated based on
Table 6 Installed cost (which includes site preparation engishyneering amp design permitting capital and installation costs) and hydrogen cost for conventional stations with SMR on-site
capacity (kgday) installed cost ($) H2 cost ($kg)
100 $274M $3847 200 $383M $2596 300 $443M $2023
25
site
pre
p
75
station
capital
222
stationinstall 78
SMR c
ap
292
SM
R in
st
15
labor
51
SMR elec
12 natural gas
45 water
07
maintenance188
stat
ion
elec
tric
ity
15
-3000
-2000
-1000
0
1000
2000
3000co
st o
r re
ven
ue (
k$
yr)
tax
site preparationstation capitalstation installSMR capitalSMR install
laborSMR electricity
natural gaswater
maintenancestation electricity
revenue ($3847kg)net income
100 kgday
site
pre
p
55
statio
n
capita
l190
stationinstall 67
SMR c
ap
382
SM
R inst
11
labor
38 SMR elec
17 natural gas
67water
11
maintenance
139
stat
ion
elec
tricit
y
22
-4000
-3000
-2000
-1000
0
1000
2000
3000
4000
cost
or
reve
nu
e (
k$
yr)
tax
site preparationstation capitalstation installSMR capitalSMR install
laborSMR electricity
natural gaswater
maintenancestation electricity
revenue ($2596kg)net income
200 kgday
site
pre
p
47
statio
nca
pita
l182
stationinstall 64
SMR c
ap
395
SM
R in
st
09
labor
33
SMR elec
22
natural gas
86water
14
maintenance
119
stat
ion
elec
tricit
y
28
2020 2025 2030 2035year
-6000
-4000
-2000
0
2000
4000
6000
cost
or
reve
nu
e (
k$y
r)
tax
site preparationstation capitalstation installSMR capitalSMR install
laborSMR electricity
natural gaswater
maintenancestation electricity
revenue ($2023kg)net income
300 kgday
conventional SMR on-site
Figure 10 Cost and revenue associated with a conventional assemble-on-site station with on-site steam methane reforming produced hydrogen to break even at year 7 (2023) The net inshycome includes the effects from depreciation and taxes Capital replacement costs and intervals are not included in this model Pie charts on the right show the breakdown of cumulative capital and operating costs over the 7-year analysis period to the cost of disshypensed hydrogen
26
both capital and operating costs so we can conclude that the operating costs for the 100 kgday SMR are less than the operating costs for the 100 kgday delivered hydrogen station In addition to the common costs for labor station maintenance and station electricity the station with the SMR unit has a nominal operating cost for water for the SMR unit (nearly indistinguishable green bar) requires electricity and natural gas to run the unit (shown by the blue and black bars) and requires additional maintenance over the conventional station with delivered hydrogen (included in the red bar) Maintenance for the SMR unit is assumed to be $50kyear bringing total station maintenance costs to $100k yr However the sum of these costs is less than the cost to deliver and store censhytrally produced hydrogen for the 100 kgday station Operating costs for the SMR station neglect the inefficiencies in shutdownstartup cycles (or venting excess hydrogen) when production is not matched by demand which would further increase costs
The cost of hydrogen for the conventional 100 200 and 300 kgday stations with on-site SMR are $3847kg $2596kg and $2023kg These costs are 26 41 and 42 higher than the costs of hydrogen for a conventional station with delivered gaseous hydrogen As discussed the increased cost of hydrogen comes from the high capital costs for the on-site SMR units slightly offset by a reduced operating cost This can be seen by inspecting the pie charts on the right side of Fig 10 where the SMR capital costs is the largest contributor to the cost of hydrogen accounting for approximately 30-40 of the hydrogen cost For the 200 and 300 kgday stations the capital costs of $2M and $25M add approximately $10kg and $8kg While the operating costs for these stations are lower than the same capacity delivered hydrogen stations these differences fail to decrease the cost of hydrogen to the same level as the delivered hydrogen station Overall this analysis would suggest that while there may be some advantages to utilizing on-site SMR there is not much of a financial case to produce hydrogen on-site using steam methane reforming rather than having hydrogen delivered for 100-300 kgday hydrogen refueling stations unless the capital cost can be reduced significantly
A station with an on-site SMR unit could have a smaller footprint than a station with delivered hydrogen One potential layout is shown in Fig 11 By replacing the tube trailers with an SMR unit significantly less space is required for the fueling station components (compare to Fig 9) Since all hydrogen is produced on-site delivery routes can also be neglected from consideration and walls can enclose all of the hydrogen components reducing setback distances on all sides The SMR unit is shown as being housed in a 20 ft ISO container footprint although to produce 300 kgday it may be possible to have a smaller footprint and even smaller for the stations that only require 100 or 200 kgday For on-site SMR the fueling station components (eg compressor high pressure storage) take up relatively more space than the low pressure hydrogen source (because the SMR is much smaller than the two tube trailers) and laying out these components in a compact manner is important in space-constrained sites
33 Conventional Station with Hydrogen Produced On-site via Electrolysis
Conventional stations with on-site electrolysis have the costs and revenues shown in Fig 12 The installed capital costs and hydrogen costs at each of the three stations are tabulated in Table 7 Similar to the conventional station with a steam methane reforming unit on-site each of these
27
30 0
50 0
154 0
100
0
conveniencestore
dispenser island
compressor
high pressure storagegas panel
H2 chillerH2 cooling block
air compressorwater chiller
20 ft ISO container(electrolyzer or SMR)
Figure 11 Renderings of a conventional station layout with on-site production of hydrogen
28
site prep
72
stat
ion
capit
al
216
station
install 75
eleccapital 197
elec
install
14
elec
el
ectr
icity
177
wate
r02
lab
or
50
maintenance
182
stationelectricity
14
-3000
-2000
-1000
0
1000
2000
3000co
st o
r re
ven
ue (
k$
yr)
taxsite preparationstation capitalstation installelec capitalelec install
elec electricitywater
labormaintenance
station electricity
revenue ($3966kg)net income
100 kgday
site prep
54
stat
ion
capi
tal
186
statio
n
insta
ll65
eleccapital 221
elec
install11
elec
el
ectr
icit
y26
5
water
03
labor
37
maintenance
136
stationelectricity
21
-3000
-2000
-1000
0
1000
2000
3000
cost
or
reve
nu
e (
k$
yr)
taxsite preparationstation capitalstation installelec capitalelec install
elec electricitywater
labormaintenance
station electricity
revenue ($2651kg)net income
200 kgday
site prep44
stat
ion
capi
tal
170
stati
on
inst
all
59
elec
capital 224
elecinstall
09
elec
el
ectr
icit
y32
3
water
04
labor
30
maintenance
111
stationelectricity
26
2020 2025 2030 2035year
-4000
-3000
-2000
-1000
0
1000
2000
3000
4000
cost
or
reve
nu
e (
k$y
r)
taxsite preparationstation capitalstation installelec capitalelec install
elec electricitywater
labormaintenance
station electricity
revenue ($2174kg)net income
300 kgday
conventional electrolysis on-site
Figure 12 Cost and revenue associated with a conventional assemble-on-site station with on-site electrolysis produced hyshydrogen to break even at year 7 (2023) The net income includes the effects from depreciation and taxes Capital replacement costs and intervals are not included in this model Pie charts on the right show the breakdown of cumulative capital and operating costs over the 7-year analysis period to the cost of dispensed hydrogen
29
Table 7 Installed cost (which includes site preparation engishyneering amp design permitting capital and installation costs) and hydrogen cost for conventional stations with electrolysis on-site
capacity (kgday) installed cost ($) H2 cost ($kg)
100 $238M $3966 200 $298M $2651 300 $345M $2174
station designs has a large capital cost due to the electrolysis unit As discussed in Section 23 the electrolysis units cost approximately $800k $12M and $15M for 100 200 and 300 kgday capacities These capital investments will add approximately $8kg $6kg and $5kg to the cost of hydrogen over a conventional station assuming equivalent operating costs During operation there is a large cost associated with electricity to run the electrolysis unit (shown by the yellow bar) This cost scales with the amount of hydrogen produced and is a large factor in the station economics The pie charts on the right show that this electricity accounts for approximately 20-30 of the cost of hydrogen Other additional costs over the conventional delivered hydrogen station are the cost of water to run the electrolysis unit and additional maintenance on the electrolyzer (assumed to be $50k annually as with the SMR)
The electricity required for the electrolyzer costs approximately $300k $600k and $900k (for the 100 200 and 300 kgday stations) in 2036 where utilization has topped out at 80 Centrally produced delivered hydrogen by comparison as shown in Fig 8 costs around $300k $450k and $650k in 2036 with overall operating costs for the delivered hydrogen station (neglecting taxes) topping out at approximately $400k $600k and $800k In addition to the additional capital costs for the electrolyzer (and the other operational costs) it is clear that the economics of a station with an electrolyzer are challenging due to the high electricity consumption even when the electricity is from the current national grid mix with 13 renewable content10 Higher renewable content may further increase this cost component in the near term although fossil-fuel free electricity may become less expensive in the longer term
The cost of hydrogen for the conventional station with an electrolyzer is $3966kg $2651kg and $2174kg for the 100 200 and 300 kgday stations receptively These costs are on-par with the conventional station with SMR within $150kg for all three capacities The cost of hydrogen for a station with on-site production is significantly higher than for a station with delivered hydroshygen Besides improvements in electrical efficiency one strategy for minimizing operating costs is to only operate the electrolyzer at off-peak hours enabling the purchase of lower priced electricity However this might require oversizing the electrolyzer to produce enough hydrogen at off-peak hours to meet demand increasing the capital costs associated with the unit Another method is inshytentionally oversizing the electrolyzer to enable operation at a higher efficiency thereby reducing operating expenses
102015 estimate from httpwwweiagovtoolsfaqsfaqcfmid=92ampt=4
30
To estimate the impact of these methods of operation and aslo gain insight into less expensive renewable electricity costs in the future the model was run with the cost of electricity zeroed-out to calculate the lowest possible cost of hydrogen with cheap electricity In this scenario the cost of hydrogen is $3264kg $1949kg and $1472kg (for the 100 200 and 300 kgday stations) These costs are only slightly higher (by 3-7) than the conventional delivered hydrogen cost due to the capital investment in the electrolyzer and the remaining electrolyzer maintenance and water costs
A station with on-site electrolysis can also be represented by the layout shown in Fig 11 Housing the components necessary for alkaline electrolysis of 100-300 kgday hydrogen might be challenging in a 20 ft ISO container and the layout might need to be increased (to a 30 or 40 ft ISO container) For PEM electrolysis however the components should fit in the 20 ft ISO container and potentially smaller containers for the 100 or 200 kgday stations Similar to the reforming layout the hydrogen components fit in a much more compact space than for the conventional station with delivered hydrogen (shown in Fig 9) and the lot size is reduced
34 Modular Station with Delivered Centrally Produced Hydrogen
Figure 13 shows the cost revenue and income model for a modular station with delivered centrally produced hydrogen and an uninstalled modular unit cost of $15M The installed capital costs and hydrogen costs at each of the three capacity stations are tabulated in Table 8 Recall from Section 25 that the capital costs for modular stations do not follow the same trend as for build-on-site stations because modular stations come in discrete sizes Table 8 shows the installed capital and hydrogen costs for two cases of uninstalled modular station costs of $15M and $1M The only difference in costs between this scenario and the conventional station with delivered centrally produced hydrogen (see Table 5 and Fig 8) are in the capital costs While the installed capital costs including site preparation station capital and installation were $15M and $17M for the 100 and 200 kgday conventional stations it is $186M for all three capacities of the modular
Table 8 Installed cost (which includes site preparation engishyneering amp design permitting capital and installation costs) and hydrogen cost for modular stations with delivered hydrogen for two cases of uninstalled modular cost $15M and $10M
capacity uninstalled installed H2 cost (kgday) modular cost ($) cost ($) ($kg)
100 $15M $186M $3390 200 $15M $186M $1916 300 $15M $186M $1425 100 $1M $136M $2912 200 $1M $136M $1677 300 $1M $136M $1265
31
site
pre
p
85
stationcapital 423
statio
n
install
17d
elive
red
H2
294
labor
58
maintenance107
electricity
17
-2000
-1500
-1000
-500
0
500
1000
1500
2000co
st o
r re
ven
ue (
k$
yr)
tax
site preparationstation capitalstation install
delivered H2labor
maintenanceelectricity
revenue ($3390kg)net income
100 kgday
site
prep
75
station
capital 374
station
install15
delive
red
H2
360
labor
52
maintenance94
electricity
30
-2000
-1500
-1000
-500
0
500
1000
1500
2000
cost
or
reve
nu
e (
k$
yr)
tax
site preparationstation capitalstation install
delivered H2labor
maintenanceelectricity
revenue ($1916kg)net income
200 kgday
site
prep
67
station
capital336
stationinstall 13
del
iver
ed H2
413
labor
46
maintenance85
electricity
40
2020 2025 2030 2035year
-2000
-1500
-1000
-500
0
500
1000
1500
2000
cost
or
reve
nu
e (
k$y
r)
tax
site preparationstation capitalstation install
delivered H2labor
maintenanceelectricity
revenue ($1425kg)net income
300 kgday
modular station delivered hydrogen
Figure 13 Cost and revenue associated with a modular station with centrally produced delivered hydrogen to break even at year 7 (2023) assuming a $15M uninstalled capital cost of the modular station The net income includes the effects from depreciation and taxes Capital replacement costs and intervals are not included in this model Pie charts on the right show the breakdown of cumulashytive capital and operating costs over the 7-year analysis period to the cost of dispensed hydrogen
32
stations This capital investment for a 300 kgday modular station (including site preparation station capital and installation) is coincidentally the same as for a 300 kgday conventional station
If an estimate of $1M (as compared to the conservative estimate of $15M) for the uninstalled capital cost of the modular fueling station unit is used (note that this is still within the range of costs vendors estimated as described in Section 25) the cost of hydrogen will be $2912 $1677 and $1265 for the 100 200 and 300 kgday capacities respectively These costs are all lower than the cost of hydrogen at the equivalent capacity conventional stations As this technology matures and the installed capital cost of the modular units continues to decrease below the installed capital cost of the conventional stations it will make economic sense to site modular stations rather than assembling components on-site Parts standardization and the increased quality control that can be achieved by having modular station components may also lead to reduced maintenance requirements but that potential benefit is not included in this analysis
Figure 14 shows that a modular unit requires a slightly smaller installation area than the conshyventional station components shown in Fig 9 However the tube trailers acting as the hydrogen source and on-site storage still require significant space Similar to the conventional station with delivered hydrogen delivery routes must also be considered when siting a modular station with deshylivered hydrogen The hydrogen components are shown as being housed in a 20 ft ISO container although some 300 kgday modular stations are smaller than this While a slightly overall reduced footprint (relative to as drawn in Fig 14) could be realized we show this layout on the same lot as before Removing the need to store two 40-foot tube trailers by adding on-site low pressure storage could also drastically reduce the footprint by reducing the need to have an open wall for delivery A discussion of how the separation distances can be impacted and the footprints might be reduced due to fire-rated walls is included at the end of the Section 35
33
140
0
168 0
50 0
30 0
dispenser island
tube trailer
modular station(20 ft ISO)
conveniencestore
Figure 14 Renderings of a modular station layout with delivered hydrogen
34
35 Modular Station with Hydrogen Produced On-site via Electrolysis
The final configuration considered in this analysis is a modular station with an electrolysis unit attached to produce hydrogen The economics of this station design are shown in Fig 15 The installed capital costs and hydrogen costs at each of the three capacity stations with two different uninstalled modular unit costs are tabulated in Table 9 Similar to the results in the previous section the cost of hydrogen at the low volume modular electrolysis stations with an assumed $15M uninstalled modular station cost are higher than at the conventional electrolysis station counterpart We find that the cost of hydrogen at these modular stations with electrolysis produced hydrogen will be $4303kg $2730kg and $2173kg (for the 100 200 and 300 kgday stations) These costs are once again $337kg higher $079kg higher and the same (respectively) as the costs at the conventional stations with electrolysis produced hydrogen discussed in Section 33 This cost difference between the analogous conventional station is once again solely due to the differing capital cost of the installed modular station If the capital cost of the modular unit is $1M the hydrogen costs reduce to $3825 $2491 or $2013kg (for the 100 200 and 300 kgday stations) which are all lower than the cost at the similarly sized conventional stations with on-site electrolysis due to the lower installed station cost
Having on-site production using an electrolyzer and modular fueling station components only requires a small footprint for installation as shown in Fig 16 The ISO containers can house apshypropriate fire-rated barrier walls reducing separation distance for Group 1 and 2 exposures (except for air intakes) by half and eliminating separation distances for Group 3 exposures as described in Section 732312 of NFPA 2 The Hydrogen Technologies Code (2016) [10] Group 1 exshyposures are lot lines air intakes (HVAC compressors other) operable openings in buildings and structures and ignition sources such as open flames and welding Group 2 exposures are exshyposed persons (other than those servicing the system) and parked cars Group 3 exposures include buildings flammable gas storage hazardous materials storage ordinary combustibles horizontal distance to overhead electrical wire and piping containing other hazardous material This means
Table 9 Installed cost (which includes site preparation engishyneering amp design permitting capital and installation costs) and hydrogen cost for modular stations with on-site electrolysis proshyduced hydrogen for two cases of uninstalled modular cost $15M and $10M
capacity uninstalled installed H2 cost (kgday) modular cost ($) cost ($) ($kg)
100 $15M $274M $4303 200 $15M $314M $2730 300 $15M $345M $2173 100 $1M $224M $3825 200 $1M $264M $2491 300 $1M $295M $2013
35
site prep67
stat
ion
capit
al
333
stationinstall 13
eleccapital 181
elec
install
13
elec
el
ectr
icity
163
wate
r0
2
labor
46
maintenance
168
stationelectricity
13
-3000
-2000
-1000
0
1000
2000
3000co
st o
r re
ven
ue (
k$
yr)
taxsite preparationstation capitalstation installelec capitalelec install
elec electricitywater
labormaintenance
station electricity
revenue ($4303kg)net income
100 kgday
site prep53
stat
ion
capi
tal
263
station
install
11
eleccapital 214
elec
install11
elec
elec
tric
ity
257
water
03
lab
or
36
maintenance
132
stationelectricity
21
-4000
-3000
-2000
-1000
0
1000
2000
3000
4000
cost
or
reve
nu
e (
k$
yr)
taxsite preparationstation capitalstation installelec capitalelec install
elec electricitywater
labormaintenance
station electricity
revenue ($2730kg)net income
200 kgday
site prep44
stat
ion
capi
tal
220
stati
on
inst
all
09
elec
capital 224
elecinstall 09
elec
elec
tric
ity32
3
water
04
labor
30 maintenance
111
stationelectricity
26
2020 2025 2030 2035year
-4000
-3000
-2000
-1000
0
1000
2000
3000
4000
cost
or
reve
nu
e (
k$y
r)
taxsite preparationstation capitalstation installelec capitalelec install
elec electricitywater
labormaintenance
station electricity
revenue ($2173kg)net income
300 kgday
modular station electrolysis on-site
Figure 15 Cost and revenue associated with a modular station with on-site electrolysis produced hydrogen to break even at year 7 (2023) assuming a $15M uninstalled capital cost of the modular station The net income includes the effects from depreciation and taxes Capital replacement costs and intervals are not included in this model Pie charts on the right show the breakdown of cumulashytive capital and operating costs over the 7-year analysis period to the cost of dispensed hydrogen
36
electrolyzer(20 ft ISO)
modular station(20 ft ISO)
convenience store
dispenser island
100
0
100 0
17 0
Figure 16 Renderings of a modular station layout with an elecshytrolyzer for on-site production with a small reduced footprint
37
for a typical pipe diameter of 028rdquo and up to 15000 psi pressure (within the operating range of the cascade storage at a refueling station) air intakes must remain 34 ft from the containers while lot lines other building openings or ignition sources only need 17 ft of separation Exposed persons and parked cars must be 8 ft or more away from the containers and other exposures (including other combustibles like gasoline) do not need any separation from the containers This will allow a compact layout an example of which is shown in Fig 16
38
4 Conclusions
Five station designs were considered in this analysis with three capacities of each station deshysign With the current technology the lowest cost hydrogen source assessed here11 is tube-trailers delivering centrally produced gaseous hydrogen Shown in Table 10 or graphically in Fig 17 for either a conventional or modular station with a 300 kgday capacity and delivered hydrogen gas (using our conservative $15M cost estimate for the modular unit) it would cost approximately $186M to prepare the site and build the station and at a dispensed hydrogen cost of $1425kg a station operator would break even on their capital investments and operational costs in 7 years If the capital cost of the modular station unit is only $1M which is still in the range of cost estimates by manufacturers a modular station with delivered hydrogen would cost $136M to build and for a 300 kgday capacity hydrogen would cost $1265kg Embedded in all of these analyses is the utilization profile shown in Fig 2 which is the reason that the hydrogen cost increases as the cashypacity (and utilization) decreases for the modular stations with delivered hydrogen although they have the same installed cost
The specified 7-year return on investment results in higher cost hydrogen for smaller stations than for larger ones due to less throughput and higher capital cost per kg of capacity (see the lower left frame of Fig 17) If the SDO charges customers a price lower than this cost the result will be a longer return on investment Setting the same price regardless of station capacity will result in the 100 kgday station having the longest return on investment and the 300 kgday having the shortest
The addition of a steam methane reformer or an electrolyzer to a hydrogen refueling station increases the capital cost significantly with the steam methane reformer estimated to have the
11The cost of liquid delivery was not included in this analysis
Table 10 Installed cost (which includes site preparation engishyneering amp design permitting component capital and installation costs) and resulting hydrogen cost to break even at year 7 for the stations analyzed in this work
station capacity rarr 100 kgday 200 kgday 300 kgday
station type darr installed cost ($)
H2 cost ($kg)
installed cost ($)
H2 cost ($kg)
installed cost ($)
H2 cost ($kg)
conventional delivered H2 conventional SMR H2 conventional electrolysis H2 modular ($15M) delivered H2 modular ($1M) delivered H2 modular ($15M) electrolysis H2 modular ($1M) electrolysis H2
$151M $274M $238M $186M $136M $274M $224M
$3053 $3847 $3966 $3390 $2912 $4303 $3825
$169M $383M $298M $186M $136M $314M $264M
$1837 $2596 $2651 $1916 $1677 $2730 $2491
$186M $443M $345M $186M $136M $345M $295M
$1426 $2023 $2174 $1425 $1265 $2173 $2013
39
$00M$05M$10M$15M$20M$25M$30M$35M$40M$45M
inst
all
ed
cost
($)
capacity (kgday)
100 200 300
conv
ention
al d
eliv
ered
gas
conv
ention
al S
MR
conv
ention
al e
lect
roly
sis
mod
ular
($1
5M
) d
eliv
ered
gas
mod
ular
($1
M) d
eliv
ered
gas
mod
ular
($1
5M
) e
lect
roly
sis
mod
ular
($1
M) e
lect
roly
sis
$0k
$5k
$10k
$15k
$20k
$25k
$30k
inst
all
ed
cost
($[
kg
day]
)
conv
ention
al d
eliv
ered
gas
conv
ention
al S
MR
conv
ention
al e
lect
roly
sis
mod
ular
($1
5M
) d
eliv
ered
gas
mod
ular
($1
M) d
eliv
ered
gas
mod
ular
($1
5M
) e
lect
roly
sis
mod
ular
($1
M) e
lect
roly
sis
$0$5
$10$15$20$25$30$35$40$45
H2 c
ost
($k
g)
capacity (kgday)
100 200 300
Figure 17 Installed cost (which includes site preparation engishyneering amp design permitting component capital and installation costs) are shown in the left frames The top frame is the total inshyvestment in 2016$ while the bottom left frame is the installed cost per mass of hydrogen dispensed (kgday) The hydrogen cost to break even at year 7 is shown in the right frame for the stations analyzed in this work
40
highest capital cost On-site production does allow for a more compact station footprint and does not require consideration for tube-trailer delivery routes With current technology and projected utility prices operating a steam methane reformer costs slightly less than operating an electrolyzer These offsetting differences in capital vs operational costs causes the price of hydrogen to be very similar for a station with SMR produced hydrogen and electrolysis produced hydrogen In both cases the cost of hydrogen is $6-$10kg more for the stations that produce hydrogen on-site than the stations that have hydrogen delivered This analysis does not include the startup and shutdown inefficiencies (and associated costs) for either the SMR or electrolyzer The penalty for cycling a SMR is likely greater than for cycling an electrolyzer potentially giving an electrolyzer an economic advantage for on-site production
Electrolyzers also have the potential to produce less carbon dioxide than SMRrsquos By definishytion SMRrsquos require methane which contains carbon to produce hydrogen releasing the carbon molecules as carbon dioxide and contributing to climate change A reduced carbon footprint could be achieved by using bio-gas or implementing carbon capture and storage (although this would incur an efficiency penalty) Electrolyzers on the other hand require only electricity and water giving this technology the potential to be completely carbon free given the right source of elecshytricity such as solar wind hydroelectric or nuclear The key to making on-site production more cost competitive with delivered hydrogen is reducing the utility costs For electrolysis this can be achieved through efficiency improvements (although around 50-70 efficiencies are achieved with current technology) through the purchase of low cost off-peak electricity or by using elecshytricity generated behind the meter Of course reducing capital cost and maintenance requirements of on-site production units will also improve the economics of this technology
According to our research current modular fueling stations where components are assembled and tested at a central production facility have installed costs no higher than conventional stations Using our high estimate of $15M for the modular unit the installed cost of the 300 kgday modular station is nearly the same as for a 300 kgday conventional station Using a lower cost estimate of $1M for the modular unit the installed cost of a 100 kgday conventional station is 11 higher than the modular station With greater industry experience and higher volume production we would anticipate the cost of modular stations to reduce in the near-future Developing stations in this manner may lead to better quality control and reduced maintenance requirements for hydrogen fueling stations It is also possible to achieve more compact station footprints by modularizing the station components by building in appropriate fire-rated barrier walls Because of these potential benefits we anticipate modularization and standardization to increase in the future
This report details the economics of current hydrogen refueling stations and includes some sketches of potential layouts We have visually depicted the contributions to capital and operational costs of hydrogen for different station concepts making it easy to find the largest contributors to a high cost of hydrogen to the consumer This information can be used to devote research and development towards these high contributors At the station the dispenser compressors and chillers are expensive pieces where additional development or higher volume production could reduce station costs For electrolysis the purchase of low-priced electricity could serve to make on-site production cost competitive with central production and delivery This report enables the comparison of different station concepts that could be implemented in various market scenarios
41
A Piping amp Instrumentation Diagram
The following pages show the piping and instrumentation diagram for the included reference stations For the conventional stations all components need to be assembled on-site The dashed boxes show the components that are often modularized for the modular stations For reference the utility requirements shown in the PampID are also included here in Table A1
Table A1 Utility requirement estimateslowast for the stations in this report
capacity 100 kgday 200 kgday 300 kgday
compressor power electrolyzer power electrolyzer water SMR power SMR water SMR gas
25 kW 260 kW 110 lhr 16 kW 400 lhr 34 Nm3hr
60 kW 510 kW 220 lhr 33 kW 800 lhr 68 Nm3hr
100 kW 770 kW 330 lhr 49 kW 1200 lhr 101 Nm3hr
lowast These are averages based on manufacturer specifications and literature and are meant to give an estimate of site requirements For exact specifishycations to meet station requirements consult a manufacturer directly
42
ABCDEFGHIJK1
2
3
4
5
6
7
Measured Variable Readout of function Output Function ModifierA Air AlarmB Burner Storage Users Choice Users ChoiceC Compressor ClosedD DispenserE Electrolyzer Sensor (primary Element)F Flow FilterG Chiller Glass viewingH Hand HighI Current IndicatorJ PowerK Time Control StationL Level Light LowM Conductivity MiddleN Users Choice Users Choice Hydrogen Users ChoiceO Water Orifice restriction Air OpenP PressureQ QuantityR Reformer Record ReduceS Speed Frequency SwitchT Temperature TransmitU Multivariate Multifunction Multifunction MultifunctionV Vibration ValveW Weight Well WaterX Unclassified Unclassified Unclassified UnclassifiedY State RelayZ Position Actuator
PROCESS AND SIGNAL LINES
HYDROGEN PROCESS LINE
DEIONIZED WATER PROCESS LINE
PNEUMATIC SIGNAL LINE
NITROGEN SIGNAL LINE
ELECTRICAL SIGNAL LINE
SV
VALVES
BALL VALVE
NEEDLE VALVE
CHECK VALVE
SOLENOID VALVE
AIR ACTUATED VALVE SPRING RETURN CLOSE
PRESSURE REDUCING VALVE
TWO WAY PRESSURE RELIEF
THREE WAY PRESSURE RELIEF
EQUIPMENT
FILTER
PUMP
DRYER
HYDROGEN COMPRESSOR
STORAGE TANK
IR FLAME DETECTOR
Line Service Identification codesCCA-CLEAN COMPRESSED AIRCHW-CHILLED WATERH-HYDROGENN-NITROGEN
Pipe Specification Details3000PSI Min pressure rating of 3000 PSI 316316L austenitic stainless steel tubing UNS S31600 (316) UNS S31603 (316L)6500PSI Min pressure rating of 6500 PSI 316316L austenitic stainless steel tubing UNS S31600 (316) UNS S31603 (316L)15000PSI Min pressure rating of 15000 PSI 316316L austenitic stainless steel tubing UNS S31600 (316) UNS S31603 (316L)POLY Polyamide (Nylon) pneumatic tubing light and heat stabilized0032CU 0032 wall copper alloy 122 seamless tubingSCH40 Schedule 40 iron pipe
Line symbolsXrdquo-XXX-XXXX-XXX-XXX
Line size nominal inches
Service
Line Number (if assigned)
Pipe Spec
Insulation (if applicable)
Insulation codesF1- Soda-lime silicate glass (FOAMGLAS) 1 wall thicknessF2- Buna N Foam 38 thick
ABCDEFGHIJK1
2
3
4
5
6
7
CNH-300
HV-202HV-203
HV-201PT-300PI-300 HV-300
HV-301
Motor460-V 3Oslash SEE NOTE 1
Heater120-V 1Oslash 500 W
PT-202PI-202
34-H-VENT
1-frac14rdquo-CHW-800-SCH40
1-frac14rdquo-CHW-800-SCH40-F2
CW-800
GW-800
HV-202
HV-300
FV-100
ZSO-100
ZSC-100
ZI-100
FSV-100
ZZO-100
FSV-30038-H-3000PSI
38-H-5000PSI
38-H-5000PSI
38-H-15000PSI
34-H-VENT
OF-802TO COMMON frac34rdquo VENT MAST LOCATED ON BACK OF GMP
10 ABOVE GRADE
REFERENCE STATION 100-300 KGDAY
FF-300
GW-801
PI-101 PT-101
H2 Storage PBNH-402MAWP-15000 PSIG
H2 Storage PBNH-403MAWP-15000 PSIG
H2 Storage PBNH-401MAWP-15000 PSIG
FV-401
ZSO-401 ZSC-401
ZZO-401
FV-402
ZSO-402 ZSC-402
ZZO-402
FV-403
ZSO-403 ZSC-403
ZZO-403
FV-400
ZSO-400 ZSC-400
ZZO-400 GN-900
CHILLER 75-kW
DN-900JSS-901(EPO)
To EPO circuit
700-BAR NOZZLE
350-BAR NOZZLE
38-H-15000PSI
H70-T40H70-Warm
H35-T0
3570MPa DISPENSERWUN-900
FVControls Internal120V 1p 15A
GN-901
HEAT EXCHANGER1350 lbs
HV-901
H70-Cold
H2 Delivery Trailer multiple tubes one outlet
COH-100Air Compressor
PBAL-100
HV-100
AF-100
Air DryerAF-101
HV-900
PT-403PI-403
HV-403
PT-402PI-402
HV-402
PT-401PI-401
HV-401
HV-411
HV-412
HV-413
ZI-401
ZI-402
ZI-403
FV-101
ZSO-101 ZSC-101 ZI-101
ZZO-101
ZVO-100
ZVO-101
ZVO-900
ZVO-401
ZVO-400
ZVO-402
ZVO-403
RAH-100IR FLAME DETECTOR
AIMED AT HYDROGEN SOURCEAND ZONE 400
HIGH PRESSURE STORAGE
TO FIRE PANEL
RAH-900
IR FLAME DETECTORAIMED AT DISP HOSES
TO FIRE PANEL
HV-101
38-H-15000PSI
ZI-400
HV-400
FSV-200
EN-100ELECTROLYZER SKID
20 BAR (300 PSI) OUTPUT
RN-100STEAM METHANE REFORMER (SMR)
SKID13 BAR (200 PSI) OUTPUT
ZVO-102
Power460-V 3OslashSEE NOTE 1
Power460-V 3OslashSEE NOTE 1
ONLY ONE HYDROGEN SUPPLY OPTION IS USED PER STATION 1 TUBE TRAILER DELIVERY2 ON-SITE ELECTROLYSIS3 ON-SITE STEAM METHANE REFORMER
MUNICIPAL WATER SUPPLY
SEE NOTE 1
NATURAL GAS BIOGAS METHANE SUPPLY
SEE NOTE 1
NOTE 1 UTILITY REQUIREMENTS DEPEND ON STATION CAPACITY AND CAN BE ESTIMATED BASED ON THE FOLLOWING TABLESTATION CAPACITY 100 KGDAY 200 KGDAY 300 KGDAYELECTROLYZER POWER 260 KW 510 KW 770 KWELECTROLYZER WATER 110 LHR 220 LHR 330 LHRSMR POWER 16 KW 33 KW 49 KWSMR WATER 400 LHR 800 LHR 1200 LHRSMR GAS 34 NM3HR 68 NM3HR 101 NM3HRCOMPRESSOR POWER 25 KW 60 KW 100 KW
NOTE 2 ON-SITE PRODUCTION UNITS MAY INCORPORATE THEIR OWN INSTRUMENT AIR SYSTEM AND INTERCONNECTION WITH CSD SKIDCONTAINER MAY NOT BE NECESSARYNOTE 3 APPLIES TO MODULAR STATION ONLY A BUILD-ON-SITE STATION WILL NOT HAVE A SKID-OR CONTAINER-MOUNTED PRE-ASSEMBLED SYSTEMNOTE 4 IN SOME MODULAR STATIONS THE DISPENSER WILL BE A SEPARATELY-INSTALLED COMPONENTNOTE 5 IN MANY MODULAR STATIONS THE HEAT EXCHANGE EQUIPMENT WILL BE ROOF-MOUNTED
NOTE 2
COMPRESSION STORAGE AND DISPENSER (CSD) SKID OR CONTAINER BOUNDARY SEE NOTE 3
NOTE 4
NOTE 5
NOTE 5
PLCGas Control Cabinet
COMPRESSORMULTIPLE STAGES
References
[1] US Energy Information Administration EIA Open Data - Intro - US Energy Information Administration (EIA) accessed July 2016 httpwwweiagovopendata
[2] US DOE DOE H2A Production Analysis accessed May 2016 httpswwwhydrogen energygovh2a_productionhtml
[3] Joseph Pratt Danny Terlip Chris Ainscough Jennifer Kurtz and Amgad Elgowainy H2FIRST reference station design task Technical Report SAND2015-2660 R Sandia National Laboratories April 2015 Available at httpenergygoveerefuelcells h2first
[4] US DOE DOE H2A Delivery Analysis accessed May 2016 httpswwwhydrogen energygovh2a_deliveryhtml
[5] 2016 Annual Evaluation of Hydrogen Fuel Cell Electric Vehicle Deployment and Hydrogen Fuel Station Network Development Technical report California Environmental Protection Agency Air Resources Board July 2016 Available at httpswwwarbcagovmsprog zevproghydrogenhydrogenhtm
[6] E Sutherland and F Joseck Low volume production and delivery cost Technical Report 15011 Department of Energy Hydrogen and Fuel Cells Program Record 2015
[7] Ricardo Guerrero Lemus and Jose Manuel Martinez Duart Updated hydrogen production costs and parities for conventional and renewable technologies International Journal of Hydrogen Energy 35(9)3929ndash3936 2010
[8] Alfredo Ursua Luis M Gandia and Pablo Sanchis Hydrogen production from water elecshytrolysis current status and future trends Proceedings of the IEEE 100(2)410ndash426 2012
[9] G Parks R Boyd J Cornish and R Remick Hydrogen station compression storage and dispensing technical status and costs Systems integration Technical Report NRELBKshy6A10-58564 National Renewable Energy Laboratory (NREL) Golden CO May 2014
[10] NFPA 2 Hydrogen Technologies Code Technical report National Fire Protection Associashytion 2016
45
- Executive Summary
- Acknowledgment
- Contents
- Figures
- Tables
- 1 Introduction
-
- 11 Background and Contents
- 12 Approach
- 13 Method Overview
-
- 2 Station Cost Components
-
- 21 Centrally Produced Hydrogen and Delivery
- 22 Hydrogen Produced On-Site via Steam Methane Reforming
- 23 Hydrogen Produced On-Site via Electrolysis
- 24 Compression Storage and Ancillary Equipment for a Conventional Station
- 25 Packaged Compression Storage and Ancillary Equpiment for a Modular Station
- 26 Hydrogen Dispensers
-
- 3 Results Station Designs and Costs
-
- 31 Conventional Station with Delivered Centrally Produced Hydrogen
- 32 Conventional Station with Hydrogen Produced On-Site via Steam Methane Reforming
- 33 Conventional Station with Hydrogen Produced On-Site via Electrolysis
- 34 Modular Station with Delivered Centrally Produced Hydrogen
- 35 Modular Station with Hydrogen Produced On-Site via Electrolysis
-
- 4 Conclusions
- Appendix A Piping and Instrumentation Diagram
- References
-
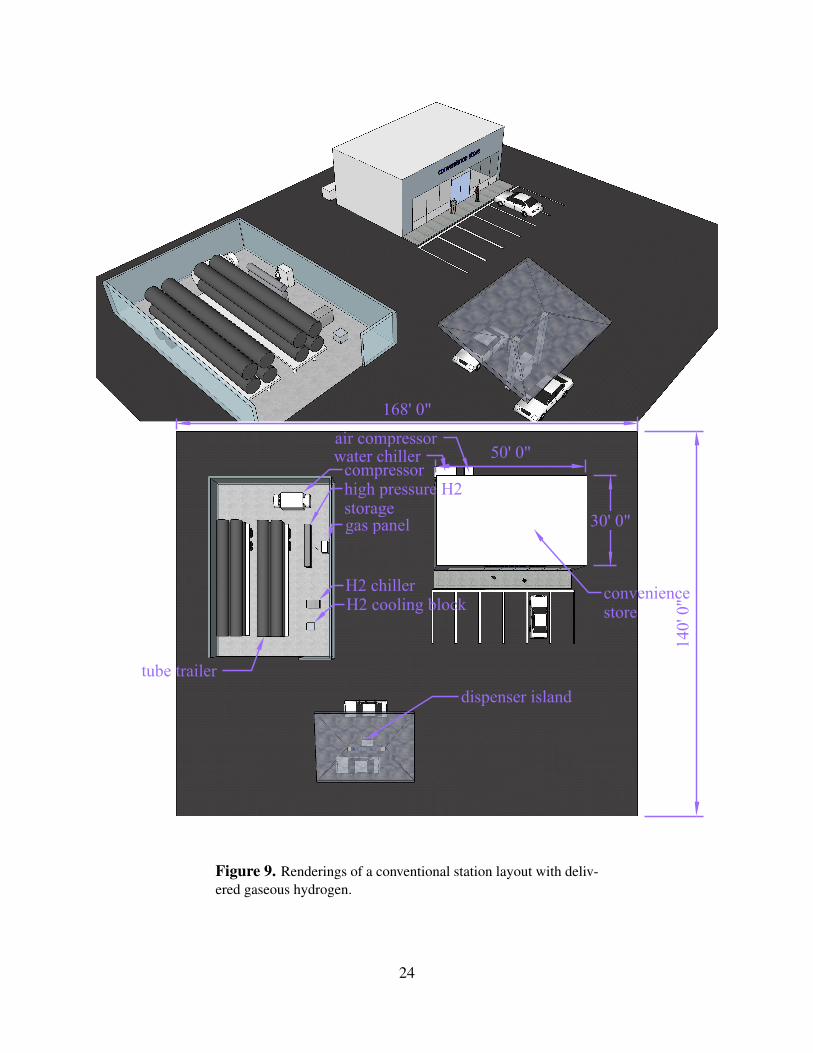
conveniencestore
50 0
dispenser island
H2 cooling blockH2 chiller
gas panel
high pressure H2storage
compressorwater chillerair compressor
tube trailer
168 0
140
0
30 0
Figure 9 Renderings of a conventional station layout with delivshyered gaseous hydrogen
24
and delivery of $2058 $1147 and $837 are higher than the Phase 1 calculated costs of $1328 $782 and $603 for the 100 200 and 300 kgday stations (shown in Table 1) Several factors contribute to the differences in the calculated fuel cost First the installed capital costs of $15M $17 and $19M in this analysis are higher than those calculated previously of $11M $12M and $13M (even after adjusting for inflation) Second the previous analysis used HRSAM in which the operating costs are calculated a bit differently than this analysis Finally in the previous analshyysis the criteria for hydrogen cost was a 15 discount rate based on a 30 year analysis period which led to a 75 year payback period In this analysis the payback period was set to exactly 7 years (and the discount rate was not considered) If in this analysis the capital costs are reduced to match the previously reported capital costs ($11M $12M and $13M) and the payback period is extended from 7 to 75 years the cost for dispensed hydrogen (without including the cost of hydrogen production and delivery) is calculated as $1521 $823 and $590 for the 100 200 and 300 kgday stations respectively These costs are within 15 of the HRSAM values found in the previous analysis The differences in this case must all be attributed to the second cause of differshying assumptions on operation costs in this analysis method vs the HRSAM method This exercise shows that the economic assumptions in this analysis are in-line with the HRSAM assumptions albeit not exactly the same This exercise also demonstrates that solving for the hydrogen cost to match a payback periodndashas long as that payback period is less than the capital replacement interval on partsndashis a valid alternative to the discount rate analysis used in HRSAM
32 Conventional Station with Hydrogen Produced On-site via Steam Methane Reforming
The costs and revenue for a conventional assemble-on-site station with an on-site steam methane reformer to produce hydrogen are shown in Fig 10 with the installed costs and cost of hydrogen tabulated in Table 6 Inspection of the capital costs incurred in 2016 shows that the largest conshytributor is the SMR unit itself As discussed in Section 22 these SMR units are estimated to cost from just over $1M for a 100 kgday capacity to just under $25M for a 300 kgday capacity Usshying Fig 3 adding a $1M capital investment (depreciable) to a 100 kgday station will add nearly $10kg to the cost of hydrogen to make back that investment in 7 years But for the 100 kgday stashytion with on-site SMR the $3847kg cost of hydrogen is only about $8 higher than the $3053kg for the conventional station with delivered hydrogen The hydrogen cost is calculated based on
Table 6 Installed cost (which includes site preparation engishyneering amp design permitting capital and installation costs) and hydrogen cost for conventional stations with SMR on-site
capacity (kgday) installed cost ($) H2 cost ($kg)
100 $274M $3847 200 $383M $2596 300 $443M $2023
25
site
pre
p
75
station
capital
222
stationinstall 78
SMR c
ap
292
SM
R in
st
15
labor
51
SMR elec
12 natural gas
45 water
07
maintenance188
stat
ion
elec
tric
ity
15
-3000
-2000
-1000
0
1000
2000
3000co
st o
r re
ven
ue (
k$
yr)
tax
site preparationstation capitalstation installSMR capitalSMR install
laborSMR electricity
natural gaswater
maintenancestation electricity
revenue ($3847kg)net income
100 kgday
site
pre
p
55
statio
n
capita
l190
stationinstall 67
SMR c
ap
382
SM
R inst
11
labor
38 SMR elec
17 natural gas
67water
11
maintenance
139
stat
ion
elec
tricit
y
22
-4000
-3000
-2000
-1000
0
1000
2000
3000
4000
cost
or
reve
nu
e (
k$
yr)
tax
site preparationstation capitalstation installSMR capitalSMR install
laborSMR electricity
natural gaswater
maintenancestation electricity
revenue ($2596kg)net income
200 kgday
site
pre
p
47
statio
nca
pita
l182
stationinstall 64
SMR c
ap
395
SM
R in
st
09
labor
33
SMR elec
22
natural gas
86water
14
maintenance
119
stat
ion
elec
tricit
y
28
2020 2025 2030 2035year
-6000
-4000
-2000
0
2000
4000
6000
cost
or
reve
nu
e (
k$y
r)
tax
site preparationstation capitalstation installSMR capitalSMR install
laborSMR electricity
natural gaswater
maintenancestation electricity
revenue ($2023kg)net income
300 kgday
conventional SMR on-site
Figure 10 Cost and revenue associated with a conventional assemble-on-site station with on-site steam methane reforming produced hydrogen to break even at year 7 (2023) The net inshycome includes the effects from depreciation and taxes Capital replacement costs and intervals are not included in this model Pie charts on the right show the breakdown of cumulative capital and operating costs over the 7-year analysis period to the cost of disshypensed hydrogen
26
both capital and operating costs so we can conclude that the operating costs for the 100 kgday SMR are less than the operating costs for the 100 kgday delivered hydrogen station In addition to the common costs for labor station maintenance and station electricity the station with the SMR unit has a nominal operating cost for water for the SMR unit (nearly indistinguishable green bar) requires electricity and natural gas to run the unit (shown by the blue and black bars) and requires additional maintenance over the conventional station with delivered hydrogen (included in the red bar) Maintenance for the SMR unit is assumed to be $50kyear bringing total station maintenance costs to $100k yr However the sum of these costs is less than the cost to deliver and store censhytrally produced hydrogen for the 100 kgday station Operating costs for the SMR station neglect the inefficiencies in shutdownstartup cycles (or venting excess hydrogen) when production is not matched by demand which would further increase costs
The cost of hydrogen for the conventional 100 200 and 300 kgday stations with on-site SMR are $3847kg $2596kg and $2023kg These costs are 26 41 and 42 higher than the costs of hydrogen for a conventional station with delivered gaseous hydrogen As discussed the increased cost of hydrogen comes from the high capital costs for the on-site SMR units slightly offset by a reduced operating cost This can be seen by inspecting the pie charts on the right side of Fig 10 where the SMR capital costs is the largest contributor to the cost of hydrogen accounting for approximately 30-40 of the hydrogen cost For the 200 and 300 kgday stations the capital costs of $2M and $25M add approximately $10kg and $8kg While the operating costs for these stations are lower than the same capacity delivered hydrogen stations these differences fail to decrease the cost of hydrogen to the same level as the delivered hydrogen station Overall this analysis would suggest that while there may be some advantages to utilizing on-site SMR there is not much of a financial case to produce hydrogen on-site using steam methane reforming rather than having hydrogen delivered for 100-300 kgday hydrogen refueling stations unless the capital cost can be reduced significantly
A station with an on-site SMR unit could have a smaller footprint than a station with delivered hydrogen One potential layout is shown in Fig 11 By replacing the tube trailers with an SMR unit significantly less space is required for the fueling station components (compare to Fig 9) Since all hydrogen is produced on-site delivery routes can also be neglected from consideration and walls can enclose all of the hydrogen components reducing setback distances on all sides The SMR unit is shown as being housed in a 20 ft ISO container footprint although to produce 300 kgday it may be possible to have a smaller footprint and even smaller for the stations that only require 100 or 200 kgday For on-site SMR the fueling station components (eg compressor high pressure storage) take up relatively more space than the low pressure hydrogen source (because the SMR is much smaller than the two tube trailers) and laying out these components in a compact manner is important in space-constrained sites
33 Conventional Station with Hydrogen Produced On-site via Electrolysis
Conventional stations with on-site electrolysis have the costs and revenues shown in Fig 12 The installed capital costs and hydrogen costs at each of the three stations are tabulated in Table 7 Similar to the conventional station with a steam methane reforming unit on-site each of these
27
30 0
50 0
154 0
100
0
conveniencestore
dispenser island
compressor
high pressure storagegas panel
H2 chillerH2 cooling block
air compressorwater chiller
20 ft ISO container(electrolyzer or SMR)
Figure 11 Renderings of a conventional station layout with on-site production of hydrogen
28
site prep
72
stat
ion
capit
al
216
station
install 75
eleccapital 197
elec
install
14
elec
el
ectr
icity
177
wate
r02
lab
or
50
maintenance
182
stationelectricity
14
-3000
-2000
-1000
0
1000
2000
3000co
st o
r re
ven
ue (
k$
yr)
taxsite preparationstation capitalstation installelec capitalelec install
elec electricitywater
labormaintenance
station electricity
revenue ($3966kg)net income
100 kgday
site prep
54
stat
ion
capi
tal
186
statio
n
insta
ll65
eleccapital 221
elec
install11
elec
el
ectr
icit
y26
5
water
03
labor
37
maintenance
136
stationelectricity
21
-3000
-2000
-1000
0
1000
2000
3000
cost
or
reve
nu
e (
k$
yr)
taxsite preparationstation capitalstation installelec capitalelec install
elec electricitywater
labormaintenance
station electricity
revenue ($2651kg)net income
200 kgday
site prep44
stat
ion
capi
tal
170
stati
on
inst
all
59
elec
capital 224
elecinstall
09
elec
el
ectr
icit
y32
3
water
04
labor
30
maintenance
111
stationelectricity
26
2020 2025 2030 2035year
-4000
-3000
-2000
-1000
0
1000
2000
3000
4000
cost
or
reve
nu
e (
k$y
r)
taxsite preparationstation capitalstation installelec capitalelec install
elec electricitywater
labormaintenance
station electricity
revenue ($2174kg)net income
300 kgday
conventional electrolysis on-site
Figure 12 Cost and revenue associated with a conventional assemble-on-site station with on-site electrolysis produced hyshydrogen to break even at year 7 (2023) The net income includes the effects from depreciation and taxes Capital replacement costs and intervals are not included in this model Pie charts on the right show the breakdown of cumulative capital and operating costs over the 7-year analysis period to the cost of dispensed hydrogen
29
Table 7 Installed cost (which includes site preparation engishyneering amp design permitting capital and installation costs) and hydrogen cost for conventional stations with electrolysis on-site
capacity (kgday) installed cost ($) H2 cost ($kg)
100 $238M $3966 200 $298M $2651 300 $345M $2174
station designs has a large capital cost due to the electrolysis unit As discussed in Section 23 the electrolysis units cost approximately $800k $12M and $15M for 100 200 and 300 kgday capacities These capital investments will add approximately $8kg $6kg and $5kg to the cost of hydrogen over a conventional station assuming equivalent operating costs During operation there is a large cost associated with electricity to run the electrolysis unit (shown by the yellow bar) This cost scales with the amount of hydrogen produced and is a large factor in the station economics The pie charts on the right show that this electricity accounts for approximately 20-30 of the cost of hydrogen Other additional costs over the conventional delivered hydrogen station are the cost of water to run the electrolysis unit and additional maintenance on the electrolyzer (assumed to be $50k annually as with the SMR)
The electricity required for the electrolyzer costs approximately $300k $600k and $900k (for the 100 200 and 300 kgday stations) in 2036 where utilization has topped out at 80 Centrally produced delivered hydrogen by comparison as shown in Fig 8 costs around $300k $450k and $650k in 2036 with overall operating costs for the delivered hydrogen station (neglecting taxes) topping out at approximately $400k $600k and $800k In addition to the additional capital costs for the electrolyzer (and the other operational costs) it is clear that the economics of a station with an electrolyzer are challenging due to the high electricity consumption even when the electricity is from the current national grid mix with 13 renewable content10 Higher renewable content may further increase this cost component in the near term although fossil-fuel free electricity may become less expensive in the longer term
The cost of hydrogen for the conventional station with an electrolyzer is $3966kg $2651kg and $2174kg for the 100 200 and 300 kgday stations receptively These costs are on-par with the conventional station with SMR within $150kg for all three capacities The cost of hydrogen for a station with on-site production is significantly higher than for a station with delivered hydroshygen Besides improvements in electrical efficiency one strategy for minimizing operating costs is to only operate the electrolyzer at off-peak hours enabling the purchase of lower priced electricity However this might require oversizing the electrolyzer to produce enough hydrogen at off-peak hours to meet demand increasing the capital costs associated with the unit Another method is inshytentionally oversizing the electrolyzer to enable operation at a higher efficiency thereby reducing operating expenses
102015 estimate from httpwwweiagovtoolsfaqsfaqcfmid=92ampt=4
30
To estimate the impact of these methods of operation and aslo gain insight into less expensive renewable electricity costs in the future the model was run with the cost of electricity zeroed-out to calculate the lowest possible cost of hydrogen with cheap electricity In this scenario the cost of hydrogen is $3264kg $1949kg and $1472kg (for the 100 200 and 300 kgday stations) These costs are only slightly higher (by 3-7) than the conventional delivered hydrogen cost due to the capital investment in the electrolyzer and the remaining electrolyzer maintenance and water costs
A station with on-site electrolysis can also be represented by the layout shown in Fig 11 Housing the components necessary for alkaline electrolysis of 100-300 kgday hydrogen might be challenging in a 20 ft ISO container and the layout might need to be increased (to a 30 or 40 ft ISO container) For PEM electrolysis however the components should fit in the 20 ft ISO container and potentially smaller containers for the 100 or 200 kgday stations Similar to the reforming layout the hydrogen components fit in a much more compact space than for the conventional station with delivered hydrogen (shown in Fig 9) and the lot size is reduced
34 Modular Station with Delivered Centrally Produced Hydrogen
Figure 13 shows the cost revenue and income model for a modular station with delivered centrally produced hydrogen and an uninstalled modular unit cost of $15M The installed capital costs and hydrogen costs at each of the three capacity stations are tabulated in Table 8 Recall from Section 25 that the capital costs for modular stations do not follow the same trend as for build-on-site stations because modular stations come in discrete sizes Table 8 shows the installed capital and hydrogen costs for two cases of uninstalled modular station costs of $15M and $1M The only difference in costs between this scenario and the conventional station with delivered centrally produced hydrogen (see Table 5 and Fig 8) are in the capital costs While the installed capital costs including site preparation station capital and installation were $15M and $17M for the 100 and 200 kgday conventional stations it is $186M for all three capacities of the modular
Table 8 Installed cost (which includes site preparation engishyneering amp design permitting capital and installation costs) and hydrogen cost for modular stations with delivered hydrogen for two cases of uninstalled modular cost $15M and $10M
capacity uninstalled installed H2 cost (kgday) modular cost ($) cost ($) ($kg)
100 $15M $186M $3390 200 $15M $186M $1916 300 $15M $186M $1425 100 $1M $136M $2912 200 $1M $136M $1677 300 $1M $136M $1265
31
site
pre
p
85
stationcapital 423
statio
n
install
17d
elive
red
H2
294
labor
58
maintenance107
electricity
17
-2000
-1500
-1000
-500
0
500
1000
1500
2000co
st o
r re
ven
ue (
k$
yr)
tax
site preparationstation capitalstation install
delivered H2labor
maintenanceelectricity
revenue ($3390kg)net income
100 kgday
site
prep
75
station
capital 374
station
install15
delive
red
H2
360
labor
52
maintenance94
electricity
30
-2000
-1500
-1000
-500
0
500
1000
1500
2000
cost
or
reve
nu
e (
k$
yr)
tax
site preparationstation capitalstation install
delivered H2labor
maintenanceelectricity
revenue ($1916kg)net income
200 kgday
site
prep
67
station
capital336
stationinstall 13
del
iver
ed H2
413
labor
46
maintenance85
electricity
40
2020 2025 2030 2035year
-2000
-1500
-1000
-500
0
500
1000
1500
2000
cost
or
reve
nu
e (
k$y
r)
tax
site preparationstation capitalstation install
delivered H2labor
maintenanceelectricity
revenue ($1425kg)net income
300 kgday
modular station delivered hydrogen
Figure 13 Cost and revenue associated with a modular station with centrally produced delivered hydrogen to break even at year 7 (2023) assuming a $15M uninstalled capital cost of the modular station The net income includes the effects from depreciation and taxes Capital replacement costs and intervals are not included in this model Pie charts on the right show the breakdown of cumulashytive capital and operating costs over the 7-year analysis period to the cost of dispensed hydrogen
32
stations This capital investment for a 300 kgday modular station (including site preparation station capital and installation) is coincidentally the same as for a 300 kgday conventional station
If an estimate of $1M (as compared to the conservative estimate of $15M) for the uninstalled capital cost of the modular fueling station unit is used (note that this is still within the range of costs vendors estimated as described in Section 25) the cost of hydrogen will be $2912 $1677 and $1265 for the 100 200 and 300 kgday capacities respectively These costs are all lower than the cost of hydrogen at the equivalent capacity conventional stations As this technology matures and the installed capital cost of the modular units continues to decrease below the installed capital cost of the conventional stations it will make economic sense to site modular stations rather than assembling components on-site Parts standardization and the increased quality control that can be achieved by having modular station components may also lead to reduced maintenance requirements but that potential benefit is not included in this analysis
Figure 14 shows that a modular unit requires a slightly smaller installation area than the conshyventional station components shown in Fig 9 However the tube trailers acting as the hydrogen source and on-site storage still require significant space Similar to the conventional station with delivered hydrogen delivery routes must also be considered when siting a modular station with deshylivered hydrogen The hydrogen components are shown as being housed in a 20 ft ISO container although some 300 kgday modular stations are smaller than this While a slightly overall reduced footprint (relative to as drawn in Fig 14) could be realized we show this layout on the same lot as before Removing the need to store two 40-foot tube trailers by adding on-site low pressure storage could also drastically reduce the footprint by reducing the need to have an open wall for delivery A discussion of how the separation distances can be impacted and the footprints might be reduced due to fire-rated walls is included at the end of the Section 35
33
140
0
168 0
50 0
30 0
dispenser island
tube trailer
modular station(20 ft ISO)
conveniencestore
Figure 14 Renderings of a modular station layout with delivered hydrogen
34
35 Modular Station with Hydrogen Produced On-site via Electrolysis
The final configuration considered in this analysis is a modular station with an electrolysis unit attached to produce hydrogen The economics of this station design are shown in Fig 15 The installed capital costs and hydrogen costs at each of the three capacity stations with two different uninstalled modular unit costs are tabulated in Table 9 Similar to the results in the previous section the cost of hydrogen at the low volume modular electrolysis stations with an assumed $15M uninstalled modular station cost are higher than at the conventional electrolysis station counterpart We find that the cost of hydrogen at these modular stations with electrolysis produced hydrogen will be $4303kg $2730kg and $2173kg (for the 100 200 and 300 kgday stations) These costs are once again $337kg higher $079kg higher and the same (respectively) as the costs at the conventional stations with electrolysis produced hydrogen discussed in Section 33 This cost difference between the analogous conventional station is once again solely due to the differing capital cost of the installed modular station If the capital cost of the modular unit is $1M the hydrogen costs reduce to $3825 $2491 or $2013kg (for the 100 200 and 300 kgday stations) which are all lower than the cost at the similarly sized conventional stations with on-site electrolysis due to the lower installed station cost
Having on-site production using an electrolyzer and modular fueling station components only requires a small footprint for installation as shown in Fig 16 The ISO containers can house apshypropriate fire-rated barrier walls reducing separation distance for Group 1 and 2 exposures (except for air intakes) by half and eliminating separation distances for Group 3 exposures as described in Section 732312 of NFPA 2 The Hydrogen Technologies Code (2016) [10] Group 1 exshyposures are lot lines air intakes (HVAC compressors other) operable openings in buildings and structures and ignition sources such as open flames and welding Group 2 exposures are exshyposed persons (other than those servicing the system) and parked cars Group 3 exposures include buildings flammable gas storage hazardous materials storage ordinary combustibles horizontal distance to overhead electrical wire and piping containing other hazardous material This means
Table 9 Installed cost (which includes site preparation engishyneering amp design permitting capital and installation costs) and hydrogen cost for modular stations with on-site electrolysis proshyduced hydrogen for two cases of uninstalled modular cost $15M and $10M
capacity uninstalled installed H2 cost (kgday) modular cost ($) cost ($) ($kg)
100 $15M $274M $4303 200 $15M $314M $2730 300 $15M $345M $2173 100 $1M $224M $3825 200 $1M $264M $2491 300 $1M $295M $2013
35
site prep67
stat
ion
capit
al
333
stationinstall 13
eleccapital 181
elec
install
13
elec
el
ectr
icity
163
wate
r0
2
labor
46
maintenance
168
stationelectricity
13
-3000
-2000
-1000
0
1000
2000
3000co
st o
r re
ven
ue (
k$
yr)
taxsite preparationstation capitalstation installelec capitalelec install
elec electricitywater
labormaintenance
station electricity
revenue ($4303kg)net income
100 kgday
site prep53
stat
ion
capi
tal
263
station
install
11
eleccapital 214
elec
install11
elec
elec
tric
ity
257
water
03
lab
or
36
maintenance
132
stationelectricity
21
-4000
-3000
-2000
-1000
0
1000
2000
3000
4000
cost
or
reve
nu
e (
k$
yr)
taxsite preparationstation capitalstation installelec capitalelec install
elec electricitywater
labormaintenance
station electricity
revenue ($2730kg)net income
200 kgday
site prep44
stat
ion
capi
tal
220
stati
on
inst
all
09
elec
capital 224
elecinstall 09
elec
elec
tric
ity32
3
water
04
labor
30 maintenance
111
stationelectricity
26
2020 2025 2030 2035year
-4000
-3000
-2000
-1000
0
1000
2000
3000
4000
cost
or
reve
nu
e (
k$y
r)
taxsite preparationstation capitalstation installelec capitalelec install
elec electricitywater
labormaintenance
station electricity
revenue ($2173kg)net income
300 kgday
modular station electrolysis on-site
Figure 15 Cost and revenue associated with a modular station with on-site electrolysis produced hydrogen to break even at year 7 (2023) assuming a $15M uninstalled capital cost of the modular station The net income includes the effects from depreciation and taxes Capital replacement costs and intervals are not included in this model Pie charts on the right show the breakdown of cumulashytive capital and operating costs over the 7-year analysis period to the cost of dispensed hydrogen
36
electrolyzer(20 ft ISO)
modular station(20 ft ISO)
convenience store
dispenser island
100
0
100 0
17 0
Figure 16 Renderings of a modular station layout with an elecshytrolyzer for on-site production with a small reduced footprint
37
for a typical pipe diameter of 028rdquo and up to 15000 psi pressure (within the operating range of the cascade storage at a refueling station) air intakes must remain 34 ft from the containers while lot lines other building openings or ignition sources only need 17 ft of separation Exposed persons and parked cars must be 8 ft or more away from the containers and other exposures (including other combustibles like gasoline) do not need any separation from the containers This will allow a compact layout an example of which is shown in Fig 16
38
4 Conclusions
Five station designs were considered in this analysis with three capacities of each station deshysign With the current technology the lowest cost hydrogen source assessed here11 is tube-trailers delivering centrally produced gaseous hydrogen Shown in Table 10 or graphically in Fig 17 for either a conventional or modular station with a 300 kgday capacity and delivered hydrogen gas (using our conservative $15M cost estimate for the modular unit) it would cost approximately $186M to prepare the site and build the station and at a dispensed hydrogen cost of $1425kg a station operator would break even on their capital investments and operational costs in 7 years If the capital cost of the modular station unit is only $1M which is still in the range of cost estimates by manufacturers a modular station with delivered hydrogen would cost $136M to build and for a 300 kgday capacity hydrogen would cost $1265kg Embedded in all of these analyses is the utilization profile shown in Fig 2 which is the reason that the hydrogen cost increases as the cashypacity (and utilization) decreases for the modular stations with delivered hydrogen although they have the same installed cost
The specified 7-year return on investment results in higher cost hydrogen for smaller stations than for larger ones due to less throughput and higher capital cost per kg of capacity (see the lower left frame of Fig 17) If the SDO charges customers a price lower than this cost the result will be a longer return on investment Setting the same price regardless of station capacity will result in the 100 kgday station having the longest return on investment and the 300 kgday having the shortest
The addition of a steam methane reformer or an electrolyzer to a hydrogen refueling station increases the capital cost significantly with the steam methane reformer estimated to have the
11The cost of liquid delivery was not included in this analysis
Table 10 Installed cost (which includes site preparation engishyneering amp design permitting component capital and installation costs) and resulting hydrogen cost to break even at year 7 for the stations analyzed in this work
station capacity rarr 100 kgday 200 kgday 300 kgday
station type darr installed cost ($)
H2 cost ($kg)
installed cost ($)
H2 cost ($kg)
installed cost ($)
H2 cost ($kg)
conventional delivered H2 conventional SMR H2 conventional electrolysis H2 modular ($15M) delivered H2 modular ($1M) delivered H2 modular ($15M) electrolysis H2 modular ($1M) electrolysis H2
$151M $274M $238M $186M $136M $274M $224M
$3053 $3847 $3966 $3390 $2912 $4303 $3825
$169M $383M $298M $186M $136M $314M $264M
$1837 $2596 $2651 $1916 $1677 $2730 $2491
$186M $443M $345M $186M $136M $345M $295M
$1426 $2023 $2174 $1425 $1265 $2173 $2013
39
$00M$05M$10M$15M$20M$25M$30M$35M$40M$45M
inst
all
ed
cost
($)
capacity (kgday)
100 200 300
conv
ention
al d
eliv
ered
gas
conv
ention
al S
MR
conv
ention
al e
lect
roly
sis
mod
ular
($1
5M
) d
eliv
ered
gas
mod
ular
($1
M) d
eliv
ered
gas
mod
ular
($1
5M
) e
lect
roly
sis
mod
ular
($1
M) e
lect
roly
sis
$0k
$5k
$10k
$15k
$20k
$25k
$30k
inst
all
ed
cost
($[
kg
day]
)
conv
ention
al d
eliv
ered
gas
conv
ention
al S
MR
conv
ention
al e
lect
roly
sis
mod
ular
($1
5M
) d
eliv
ered
gas
mod
ular
($1
M) d
eliv
ered
gas
mod
ular
($1
5M
) e
lect
roly
sis
mod
ular
($1
M) e
lect
roly
sis
$0$5
$10$15$20$25$30$35$40$45
H2 c
ost
($k
g)
capacity (kgday)
100 200 300
Figure 17 Installed cost (which includes site preparation engishyneering amp design permitting component capital and installation costs) are shown in the left frames The top frame is the total inshyvestment in 2016$ while the bottom left frame is the installed cost per mass of hydrogen dispensed (kgday) The hydrogen cost to break even at year 7 is shown in the right frame for the stations analyzed in this work
40
highest capital cost On-site production does allow for a more compact station footprint and does not require consideration for tube-trailer delivery routes With current technology and projected utility prices operating a steam methane reformer costs slightly less than operating an electrolyzer These offsetting differences in capital vs operational costs causes the price of hydrogen to be very similar for a station with SMR produced hydrogen and electrolysis produced hydrogen In both cases the cost of hydrogen is $6-$10kg more for the stations that produce hydrogen on-site than the stations that have hydrogen delivered This analysis does not include the startup and shutdown inefficiencies (and associated costs) for either the SMR or electrolyzer The penalty for cycling a SMR is likely greater than for cycling an electrolyzer potentially giving an electrolyzer an economic advantage for on-site production
Electrolyzers also have the potential to produce less carbon dioxide than SMRrsquos By definishytion SMRrsquos require methane which contains carbon to produce hydrogen releasing the carbon molecules as carbon dioxide and contributing to climate change A reduced carbon footprint could be achieved by using bio-gas or implementing carbon capture and storage (although this would incur an efficiency penalty) Electrolyzers on the other hand require only electricity and water giving this technology the potential to be completely carbon free given the right source of elecshytricity such as solar wind hydroelectric or nuclear The key to making on-site production more cost competitive with delivered hydrogen is reducing the utility costs For electrolysis this can be achieved through efficiency improvements (although around 50-70 efficiencies are achieved with current technology) through the purchase of low cost off-peak electricity or by using elecshytricity generated behind the meter Of course reducing capital cost and maintenance requirements of on-site production units will also improve the economics of this technology
According to our research current modular fueling stations where components are assembled and tested at a central production facility have installed costs no higher than conventional stations Using our high estimate of $15M for the modular unit the installed cost of the 300 kgday modular station is nearly the same as for a 300 kgday conventional station Using a lower cost estimate of $1M for the modular unit the installed cost of a 100 kgday conventional station is 11 higher than the modular station With greater industry experience and higher volume production we would anticipate the cost of modular stations to reduce in the near-future Developing stations in this manner may lead to better quality control and reduced maintenance requirements for hydrogen fueling stations It is also possible to achieve more compact station footprints by modularizing the station components by building in appropriate fire-rated barrier walls Because of these potential benefits we anticipate modularization and standardization to increase in the future
This report details the economics of current hydrogen refueling stations and includes some sketches of potential layouts We have visually depicted the contributions to capital and operational costs of hydrogen for different station concepts making it easy to find the largest contributors to a high cost of hydrogen to the consumer This information can be used to devote research and development towards these high contributors At the station the dispenser compressors and chillers are expensive pieces where additional development or higher volume production could reduce station costs For electrolysis the purchase of low-priced electricity could serve to make on-site production cost competitive with central production and delivery This report enables the comparison of different station concepts that could be implemented in various market scenarios
41
A Piping amp Instrumentation Diagram
The following pages show the piping and instrumentation diagram for the included reference stations For the conventional stations all components need to be assembled on-site The dashed boxes show the components that are often modularized for the modular stations For reference the utility requirements shown in the PampID are also included here in Table A1
Table A1 Utility requirement estimateslowast for the stations in this report
capacity 100 kgday 200 kgday 300 kgday
compressor power electrolyzer power electrolyzer water SMR power SMR water SMR gas
25 kW 260 kW 110 lhr 16 kW 400 lhr 34 Nm3hr
60 kW 510 kW 220 lhr 33 kW 800 lhr 68 Nm3hr
100 kW 770 kW 330 lhr 49 kW 1200 lhr 101 Nm3hr
lowast These are averages based on manufacturer specifications and literature and are meant to give an estimate of site requirements For exact specifishycations to meet station requirements consult a manufacturer directly
42
ABCDEFGHIJK1
2
3
4
5
6
7
Measured Variable Readout of function Output Function ModifierA Air AlarmB Burner Storage Users Choice Users ChoiceC Compressor ClosedD DispenserE Electrolyzer Sensor (primary Element)F Flow FilterG Chiller Glass viewingH Hand HighI Current IndicatorJ PowerK Time Control StationL Level Light LowM Conductivity MiddleN Users Choice Users Choice Hydrogen Users ChoiceO Water Orifice restriction Air OpenP PressureQ QuantityR Reformer Record ReduceS Speed Frequency SwitchT Temperature TransmitU Multivariate Multifunction Multifunction MultifunctionV Vibration ValveW Weight Well WaterX Unclassified Unclassified Unclassified UnclassifiedY State RelayZ Position Actuator
PROCESS AND SIGNAL LINES
HYDROGEN PROCESS LINE
DEIONIZED WATER PROCESS LINE
PNEUMATIC SIGNAL LINE
NITROGEN SIGNAL LINE
ELECTRICAL SIGNAL LINE
SV
VALVES
BALL VALVE
NEEDLE VALVE
CHECK VALVE
SOLENOID VALVE
AIR ACTUATED VALVE SPRING RETURN CLOSE
PRESSURE REDUCING VALVE
TWO WAY PRESSURE RELIEF
THREE WAY PRESSURE RELIEF
EQUIPMENT
FILTER
PUMP
DRYER
HYDROGEN COMPRESSOR
STORAGE TANK
IR FLAME DETECTOR
Line Service Identification codesCCA-CLEAN COMPRESSED AIRCHW-CHILLED WATERH-HYDROGENN-NITROGEN
Pipe Specification Details3000PSI Min pressure rating of 3000 PSI 316316L austenitic stainless steel tubing UNS S31600 (316) UNS S31603 (316L)6500PSI Min pressure rating of 6500 PSI 316316L austenitic stainless steel tubing UNS S31600 (316) UNS S31603 (316L)15000PSI Min pressure rating of 15000 PSI 316316L austenitic stainless steel tubing UNS S31600 (316) UNS S31603 (316L)POLY Polyamide (Nylon) pneumatic tubing light and heat stabilized0032CU 0032 wall copper alloy 122 seamless tubingSCH40 Schedule 40 iron pipe
Line symbolsXrdquo-XXX-XXXX-XXX-XXX
Line size nominal inches
Service
Line Number (if assigned)
Pipe Spec
Insulation (if applicable)
Insulation codesF1- Soda-lime silicate glass (FOAMGLAS) 1 wall thicknessF2- Buna N Foam 38 thick
ABCDEFGHIJK1
2
3
4
5
6
7
CNH-300
HV-202HV-203
HV-201PT-300PI-300 HV-300
HV-301
Motor460-V 3Oslash SEE NOTE 1
Heater120-V 1Oslash 500 W
PT-202PI-202
34-H-VENT
1-frac14rdquo-CHW-800-SCH40
1-frac14rdquo-CHW-800-SCH40-F2
CW-800
GW-800
HV-202
HV-300
FV-100
ZSO-100
ZSC-100
ZI-100
FSV-100
ZZO-100
FSV-30038-H-3000PSI
38-H-5000PSI
38-H-5000PSI
38-H-15000PSI
34-H-VENT
OF-802TO COMMON frac34rdquo VENT MAST LOCATED ON BACK OF GMP
10 ABOVE GRADE
REFERENCE STATION 100-300 KGDAY
FF-300
GW-801
PI-101 PT-101
H2 Storage PBNH-402MAWP-15000 PSIG
H2 Storage PBNH-403MAWP-15000 PSIG
H2 Storage PBNH-401MAWP-15000 PSIG
FV-401
ZSO-401 ZSC-401
ZZO-401
FV-402
ZSO-402 ZSC-402
ZZO-402
FV-403
ZSO-403 ZSC-403
ZZO-403
FV-400
ZSO-400 ZSC-400
ZZO-400 GN-900
CHILLER 75-kW
DN-900JSS-901(EPO)
To EPO circuit
700-BAR NOZZLE
350-BAR NOZZLE
38-H-15000PSI
H70-T40H70-Warm
H35-T0
3570MPa DISPENSERWUN-900
FVControls Internal120V 1p 15A
GN-901
HEAT EXCHANGER1350 lbs
HV-901
H70-Cold
H2 Delivery Trailer multiple tubes one outlet
COH-100Air Compressor
PBAL-100
HV-100
AF-100
Air DryerAF-101
HV-900
PT-403PI-403
HV-403
PT-402PI-402
HV-402
PT-401PI-401
HV-401
HV-411
HV-412
HV-413
ZI-401
ZI-402
ZI-403
FV-101
ZSO-101 ZSC-101 ZI-101
ZZO-101
ZVO-100
ZVO-101
ZVO-900
ZVO-401
ZVO-400
ZVO-402
ZVO-403
RAH-100IR FLAME DETECTOR
AIMED AT HYDROGEN SOURCEAND ZONE 400
HIGH PRESSURE STORAGE
TO FIRE PANEL
RAH-900
IR FLAME DETECTORAIMED AT DISP HOSES
TO FIRE PANEL
HV-101
38-H-15000PSI
ZI-400
HV-400
FSV-200
EN-100ELECTROLYZER SKID
20 BAR (300 PSI) OUTPUT
RN-100STEAM METHANE REFORMER (SMR)
SKID13 BAR (200 PSI) OUTPUT
ZVO-102
Power460-V 3OslashSEE NOTE 1
Power460-V 3OslashSEE NOTE 1
ONLY ONE HYDROGEN SUPPLY OPTION IS USED PER STATION 1 TUBE TRAILER DELIVERY2 ON-SITE ELECTROLYSIS3 ON-SITE STEAM METHANE REFORMER
MUNICIPAL WATER SUPPLY
SEE NOTE 1
NATURAL GAS BIOGAS METHANE SUPPLY
SEE NOTE 1
NOTE 1 UTILITY REQUIREMENTS DEPEND ON STATION CAPACITY AND CAN BE ESTIMATED BASED ON THE FOLLOWING TABLESTATION CAPACITY 100 KGDAY 200 KGDAY 300 KGDAYELECTROLYZER POWER 260 KW 510 KW 770 KWELECTROLYZER WATER 110 LHR 220 LHR 330 LHRSMR POWER 16 KW 33 KW 49 KWSMR WATER 400 LHR 800 LHR 1200 LHRSMR GAS 34 NM3HR 68 NM3HR 101 NM3HRCOMPRESSOR POWER 25 KW 60 KW 100 KW
NOTE 2 ON-SITE PRODUCTION UNITS MAY INCORPORATE THEIR OWN INSTRUMENT AIR SYSTEM AND INTERCONNECTION WITH CSD SKIDCONTAINER MAY NOT BE NECESSARYNOTE 3 APPLIES TO MODULAR STATION ONLY A BUILD-ON-SITE STATION WILL NOT HAVE A SKID-OR CONTAINER-MOUNTED PRE-ASSEMBLED SYSTEMNOTE 4 IN SOME MODULAR STATIONS THE DISPENSER WILL BE A SEPARATELY-INSTALLED COMPONENTNOTE 5 IN MANY MODULAR STATIONS THE HEAT EXCHANGE EQUIPMENT WILL BE ROOF-MOUNTED
NOTE 2
COMPRESSION STORAGE AND DISPENSER (CSD) SKID OR CONTAINER BOUNDARY SEE NOTE 3
NOTE 4
NOTE 5
NOTE 5
PLCGas Control Cabinet
COMPRESSORMULTIPLE STAGES
References
[1] US Energy Information Administration EIA Open Data - Intro - US Energy Information Administration (EIA) accessed July 2016 httpwwweiagovopendata
[2] US DOE DOE H2A Production Analysis accessed May 2016 httpswwwhydrogen energygovh2a_productionhtml
[3] Joseph Pratt Danny Terlip Chris Ainscough Jennifer Kurtz and Amgad Elgowainy H2FIRST reference station design task Technical Report SAND2015-2660 R Sandia National Laboratories April 2015 Available at httpenergygoveerefuelcells h2first
[4] US DOE DOE H2A Delivery Analysis accessed May 2016 httpswwwhydrogen energygovh2a_deliveryhtml
[5] 2016 Annual Evaluation of Hydrogen Fuel Cell Electric Vehicle Deployment and Hydrogen Fuel Station Network Development Technical report California Environmental Protection Agency Air Resources Board July 2016 Available at httpswwwarbcagovmsprog zevproghydrogenhydrogenhtm
[6] E Sutherland and F Joseck Low volume production and delivery cost Technical Report 15011 Department of Energy Hydrogen and Fuel Cells Program Record 2015
[7] Ricardo Guerrero Lemus and Jose Manuel Martinez Duart Updated hydrogen production costs and parities for conventional and renewable technologies International Journal of Hydrogen Energy 35(9)3929ndash3936 2010
[8] Alfredo Ursua Luis M Gandia and Pablo Sanchis Hydrogen production from water elecshytrolysis current status and future trends Proceedings of the IEEE 100(2)410ndash426 2012
[9] G Parks R Boyd J Cornish and R Remick Hydrogen station compression storage and dispensing technical status and costs Systems integration Technical Report NRELBKshy6A10-58564 National Renewable Energy Laboratory (NREL) Golden CO May 2014
[10] NFPA 2 Hydrogen Technologies Code Technical report National Fire Protection Associashytion 2016
45
- Executive Summary
- Acknowledgment
- Contents
- Figures
- Tables
- 1 Introduction
-
- 11 Background and Contents
- 12 Approach
- 13 Method Overview
-
- 2 Station Cost Components
-
- 21 Centrally Produced Hydrogen and Delivery
- 22 Hydrogen Produced On-Site via Steam Methane Reforming
- 23 Hydrogen Produced On-Site via Electrolysis
- 24 Compression Storage and Ancillary Equipment for a Conventional Station
- 25 Packaged Compression Storage and Ancillary Equpiment for a Modular Station
- 26 Hydrogen Dispensers
-
- 3 Results Station Designs and Costs
-
- 31 Conventional Station with Delivered Centrally Produced Hydrogen
- 32 Conventional Station with Hydrogen Produced On-Site via Steam Methane Reforming
- 33 Conventional Station with Hydrogen Produced On-Site via Electrolysis
- 34 Modular Station with Delivered Centrally Produced Hydrogen
- 35 Modular Station with Hydrogen Produced On-Site via Electrolysis
-
- 4 Conclusions
- Appendix A Piping and Instrumentation Diagram
- References
-
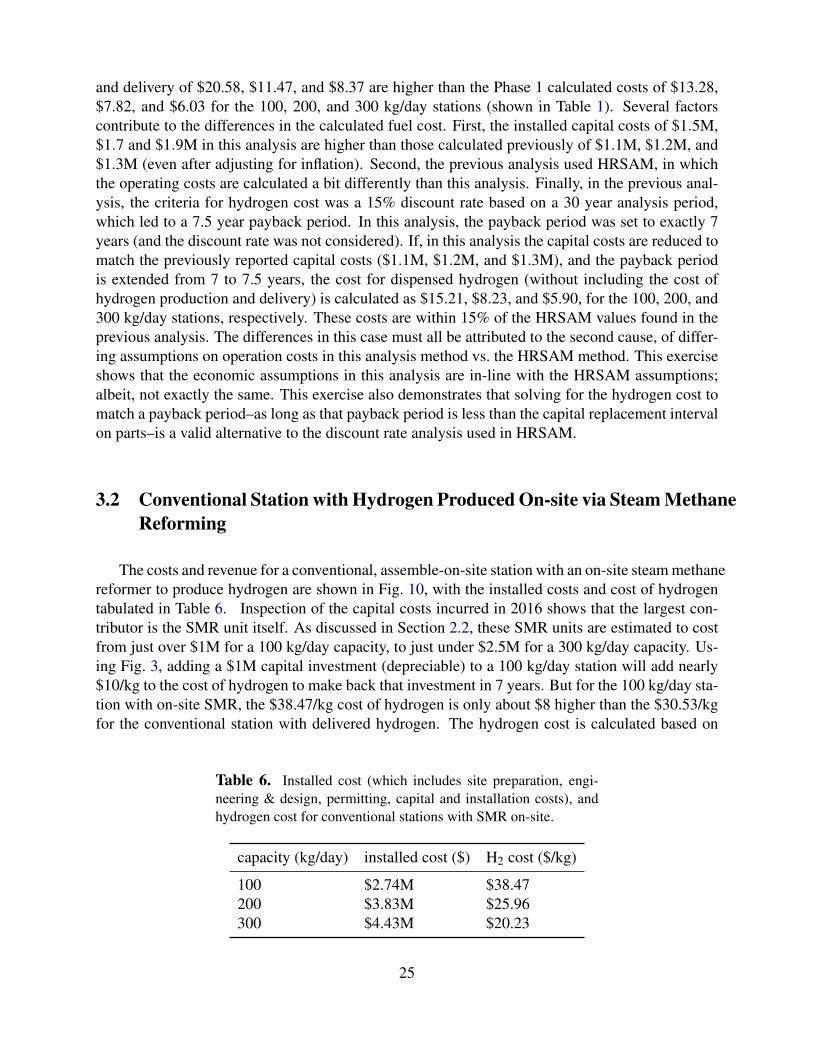

site
pre
p
75
station
capital
222
stationinstall 78
SMR c
ap
292
SM
R in
st
15
labor
51
SMR elec
12 natural gas
45 water
07
maintenance188
stat
ion
elec
tric
ity
15
-3000
-2000
-1000
0
1000
2000
3000co
st o
r re
ven
ue (
k$
yr)
tax
site preparationstation capitalstation installSMR capitalSMR install
laborSMR electricity
natural gaswater
maintenancestation electricity
revenue ($3847kg)net income
100 kgday
site
pre
p
55
statio
n
capita
l190
stationinstall 67
SMR c
ap
382
SM
R inst
11
labor
38 SMR elec
17 natural gas
67water
11
maintenance
139
stat
ion
elec
tricit
y
22
-4000
-3000
-2000
-1000
0
1000
2000
3000
4000
cost
or
reve
nu
e (
k$
yr)
tax
site preparationstation capitalstation installSMR capitalSMR install
laborSMR electricity
natural gaswater
maintenancestation electricity
revenue ($2596kg)net income
200 kgday
site
pre
p
47
statio
nca
pita
l182
stationinstall 64
SMR c
ap
395
SM
R in
st
09
labor
33
SMR elec
22
natural gas
86water
14
maintenance
119
stat
ion
elec
tricit
y
28
2020 2025 2030 2035year
-6000
-4000
-2000
0
2000
4000
6000
cost
or
reve
nu
e (
k$y
r)
tax
site preparationstation capitalstation installSMR capitalSMR install
laborSMR electricity
natural gaswater
maintenancestation electricity
revenue ($2023kg)net income
300 kgday
conventional SMR on-site
Figure 10 Cost and revenue associated with a conventional assemble-on-site station with on-site steam methane reforming produced hydrogen to break even at year 7 (2023) The net inshycome includes the effects from depreciation and taxes Capital replacement costs and intervals are not included in this model Pie charts on the right show the breakdown of cumulative capital and operating costs over the 7-year analysis period to the cost of disshypensed hydrogen
26
both capital and operating costs so we can conclude that the operating costs for the 100 kgday SMR are less than the operating costs for the 100 kgday delivered hydrogen station In addition to the common costs for labor station maintenance and station electricity the station with the SMR unit has a nominal operating cost for water for the SMR unit (nearly indistinguishable green bar) requires electricity and natural gas to run the unit (shown by the blue and black bars) and requires additional maintenance over the conventional station with delivered hydrogen (included in the red bar) Maintenance for the SMR unit is assumed to be $50kyear bringing total station maintenance costs to $100k yr However the sum of these costs is less than the cost to deliver and store censhytrally produced hydrogen for the 100 kgday station Operating costs for the SMR station neglect the inefficiencies in shutdownstartup cycles (or venting excess hydrogen) when production is not matched by demand which would further increase costs
The cost of hydrogen for the conventional 100 200 and 300 kgday stations with on-site SMR are $3847kg $2596kg and $2023kg These costs are 26 41 and 42 higher than the costs of hydrogen for a conventional station with delivered gaseous hydrogen As discussed the increased cost of hydrogen comes from the high capital costs for the on-site SMR units slightly offset by a reduced operating cost This can be seen by inspecting the pie charts on the right side of Fig 10 where the SMR capital costs is the largest contributor to the cost of hydrogen accounting for approximately 30-40 of the hydrogen cost For the 200 and 300 kgday stations the capital costs of $2M and $25M add approximately $10kg and $8kg While the operating costs for these stations are lower than the same capacity delivered hydrogen stations these differences fail to decrease the cost of hydrogen to the same level as the delivered hydrogen station Overall this analysis would suggest that while there may be some advantages to utilizing on-site SMR there is not much of a financial case to produce hydrogen on-site using steam methane reforming rather than having hydrogen delivered for 100-300 kgday hydrogen refueling stations unless the capital cost can be reduced significantly
A station with an on-site SMR unit could have a smaller footprint than a station with delivered hydrogen One potential layout is shown in Fig 11 By replacing the tube trailers with an SMR unit significantly less space is required for the fueling station components (compare to Fig 9) Since all hydrogen is produced on-site delivery routes can also be neglected from consideration and walls can enclose all of the hydrogen components reducing setback distances on all sides The SMR unit is shown as being housed in a 20 ft ISO container footprint although to produce 300 kgday it may be possible to have a smaller footprint and even smaller for the stations that only require 100 or 200 kgday For on-site SMR the fueling station components (eg compressor high pressure storage) take up relatively more space than the low pressure hydrogen source (because the SMR is much smaller than the two tube trailers) and laying out these components in a compact manner is important in space-constrained sites
33 Conventional Station with Hydrogen Produced On-site via Electrolysis
Conventional stations with on-site electrolysis have the costs and revenues shown in Fig 12 The installed capital costs and hydrogen costs at each of the three stations are tabulated in Table 7 Similar to the conventional station with a steam methane reforming unit on-site each of these
27
30 0
50 0
154 0
100
0
conveniencestore
dispenser island
compressor
high pressure storagegas panel
H2 chillerH2 cooling block
air compressorwater chiller
20 ft ISO container(electrolyzer or SMR)
Figure 11 Renderings of a conventional station layout with on-site production of hydrogen
28
site prep
72
stat
ion
capit
al
216
station
install 75
eleccapital 197
elec
install
14
elec
el
ectr
icity
177
wate
r02
lab
or
50
maintenance
182
stationelectricity
14
-3000
-2000
-1000
0
1000
2000
3000co
st o
r re
ven
ue (
k$
yr)
taxsite preparationstation capitalstation installelec capitalelec install
elec electricitywater
labormaintenance
station electricity
revenue ($3966kg)net income
100 kgday
site prep
54
stat
ion
capi
tal
186
statio
n
insta
ll65
eleccapital 221
elec
install11
elec
el
ectr
icit
y26
5
water
03
labor
37
maintenance
136
stationelectricity
21
-3000
-2000
-1000
0
1000
2000
3000
cost
or
reve
nu
e (
k$
yr)
taxsite preparationstation capitalstation installelec capitalelec install
elec electricitywater
labormaintenance
station electricity
revenue ($2651kg)net income
200 kgday
site prep44
stat
ion
capi
tal
170
stati
on
inst
all
59
elec
capital 224
elecinstall
09
elec
el
ectr
icit
y32
3
water
04
labor
30
maintenance
111
stationelectricity
26
2020 2025 2030 2035year
-4000
-3000
-2000
-1000
0
1000
2000
3000
4000
cost
or
reve
nu
e (
k$y
r)
taxsite preparationstation capitalstation installelec capitalelec install
elec electricitywater
labormaintenance
station electricity
revenue ($2174kg)net income
300 kgday
conventional electrolysis on-site
Figure 12 Cost and revenue associated with a conventional assemble-on-site station with on-site electrolysis produced hyshydrogen to break even at year 7 (2023) The net income includes the effects from depreciation and taxes Capital replacement costs and intervals are not included in this model Pie charts on the right show the breakdown of cumulative capital and operating costs over the 7-year analysis period to the cost of dispensed hydrogen
29
Table 7 Installed cost (which includes site preparation engishyneering amp design permitting capital and installation costs) and hydrogen cost for conventional stations with electrolysis on-site
capacity (kgday) installed cost ($) H2 cost ($kg)
100 $238M $3966 200 $298M $2651 300 $345M $2174
station designs has a large capital cost due to the electrolysis unit As discussed in Section 23 the electrolysis units cost approximately $800k $12M and $15M for 100 200 and 300 kgday capacities These capital investments will add approximately $8kg $6kg and $5kg to the cost of hydrogen over a conventional station assuming equivalent operating costs During operation there is a large cost associated with electricity to run the electrolysis unit (shown by the yellow bar) This cost scales with the amount of hydrogen produced and is a large factor in the station economics The pie charts on the right show that this electricity accounts for approximately 20-30 of the cost of hydrogen Other additional costs over the conventional delivered hydrogen station are the cost of water to run the electrolysis unit and additional maintenance on the electrolyzer (assumed to be $50k annually as with the SMR)
The electricity required for the electrolyzer costs approximately $300k $600k and $900k (for the 100 200 and 300 kgday stations) in 2036 where utilization has topped out at 80 Centrally produced delivered hydrogen by comparison as shown in Fig 8 costs around $300k $450k and $650k in 2036 with overall operating costs for the delivered hydrogen station (neglecting taxes) topping out at approximately $400k $600k and $800k In addition to the additional capital costs for the electrolyzer (and the other operational costs) it is clear that the economics of a station with an electrolyzer are challenging due to the high electricity consumption even when the electricity is from the current national grid mix with 13 renewable content10 Higher renewable content may further increase this cost component in the near term although fossil-fuel free electricity may become less expensive in the longer term
The cost of hydrogen for the conventional station with an electrolyzer is $3966kg $2651kg and $2174kg for the 100 200 and 300 kgday stations receptively These costs are on-par with the conventional station with SMR within $150kg for all three capacities The cost of hydrogen for a station with on-site production is significantly higher than for a station with delivered hydroshygen Besides improvements in electrical efficiency one strategy for minimizing operating costs is to only operate the electrolyzer at off-peak hours enabling the purchase of lower priced electricity However this might require oversizing the electrolyzer to produce enough hydrogen at off-peak hours to meet demand increasing the capital costs associated with the unit Another method is inshytentionally oversizing the electrolyzer to enable operation at a higher efficiency thereby reducing operating expenses
102015 estimate from httpwwweiagovtoolsfaqsfaqcfmid=92ampt=4
30
To estimate the impact of these methods of operation and aslo gain insight into less expensive renewable electricity costs in the future the model was run with the cost of electricity zeroed-out to calculate the lowest possible cost of hydrogen with cheap electricity In this scenario the cost of hydrogen is $3264kg $1949kg and $1472kg (for the 100 200 and 300 kgday stations) These costs are only slightly higher (by 3-7) than the conventional delivered hydrogen cost due to the capital investment in the electrolyzer and the remaining electrolyzer maintenance and water costs
A station with on-site electrolysis can also be represented by the layout shown in Fig 11 Housing the components necessary for alkaline electrolysis of 100-300 kgday hydrogen might be challenging in a 20 ft ISO container and the layout might need to be increased (to a 30 or 40 ft ISO container) For PEM electrolysis however the components should fit in the 20 ft ISO container and potentially smaller containers for the 100 or 200 kgday stations Similar to the reforming layout the hydrogen components fit in a much more compact space than for the conventional station with delivered hydrogen (shown in Fig 9) and the lot size is reduced
34 Modular Station with Delivered Centrally Produced Hydrogen
Figure 13 shows the cost revenue and income model for a modular station with delivered centrally produced hydrogen and an uninstalled modular unit cost of $15M The installed capital costs and hydrogen costs at each of the three capacity stations are tabulated in Table 8 Recall from Section 25 that the capital costs for modular stations do not follow the same trend as for build-on-site stations because modular stations come in discrete sizes Table 8 shows the installed capital and hydrogen costs for two cases of uninstalled modular station costs of $15M and $1M The only difference in costs between this scenario and the conventional station with delivered centrally produced hydrogen (see Table 5 and Fig 8) are in the capital costs While the installed capital costs including site preparation station capital and installation were $15M and $17M for the 100 and 200 kgday conventional stations it is $186M for all three capacities of the modular
Table 8 Installed cost (which includes site preparation engishyneering amp design permitting capital and installation costs) and hydrogen cost for modular stations with delivered hydrogen for two cases of uninstalled modular cost $15M and $10M
capacity uninstalled installed H2 cost (kgday) modular cost ($) cost ($) ($kg)
100 $15M $186M $3390 200 $15M $186M $1916 300 $15M $186M $1425 100 $1M $136M $2912 200 $1M $136M $1677 300 $1M $136M $1265
31
site
pre
p
85
stationcapital 423
statio
n
install
17d
elive
red
H2
294
labor
58
maintenance107
electricity
17
-2000
-1500
-1000
-500
0
500
1000
1500
2000co
st o
r re
ven
ue (
k$
yr)
tax
site preparationstation capitalstation install
delivered H2labor
maintenanceelectricity
revenue ($3390kg)net income
100 kgday
site
prep
75
station
capital 374
station
install15
delive
red
H2
360
labor
52
maintenance94
electricity
30
-2000
-1500
-1000
-500
0
500
1000
1500
2000
cost
or
reve
nu
e (
k$
yr)
tax
site preparationstation capitalstation install
delivered H2labor
maintenanceelectricity
revenue ($1916kg)net income
200 kgday
site
prep
67
station
capital336
stationinstall 13
del
iver
ed H2
413
labor
46
maintenance85
electricity
40
2020 2025 2030 2035year
-2000
-1500
-1000
-500
0
500
1000
1500
2000
cost
or
reve
nu
e (
k$y
r)
tax
site preparationstation capitalstation install
delivered H2labor
maintenanceelectricity
revenue ($1425kg)net income
300 kgday
modular station delivered hydrogen
Figure 13 Cost and revenue associated with a modular station with centrally produced delivered hydrogen to break even at year 7 (2023) assuming a $15M uninstalled capital cost of the modular station The net income includes the effects from depreciation and taxes Capital replacement costs and intervals are not included in this model Pie charts on the right show the breakdown of cumulashytive capital and operating costs over the 7-year analysis period to the cost of dispensed hydrogen
32
stations This capital investment for a 300 kgday modular station (including site preparation station capital and installation) is coincidentally the same as for a 300 kgday conventional station
If an estimate of $1M (as compared to the conservative estimate of $15M) for the uninstalled capital cost of the modular fueling station unit is used (note that this is still within the range of costs vendors estimated as described in Section 25) the cost of hydrogen will be $2912 $1677 and $1265 for the 100 200 and 300 kgday capacities respectively These costs are all lower than the cost of hydrogen at the equivalent capacity conventional stations As this technology matures and the installed capital cost of the modular units continues to decrease below the installed capital cost of the conventional stations it will make economic sense to site modular stations rather than assembling components on-site Parts standardization and the increased quality control that can be achieved by having modular station components may also lead to reduced maintenance requirements but that potential benefit is not included in this analysis
Figure 14 shows that a modular unit requires a slightly smaller installation area than the conshyventional station components shown in Fig 9 However the tube trailers acting as the hydrogen source and on-site storage still require significant space Similar to the conventional station with delivered hydrogen delivery routes must also be considered when siting a modular station with deshylivered hydrogen The hydrogen components are shown as being housed in a 20 ft ISO container although some 300 kgday modular stations are smaller than this While a slightly overall reduced footprint (relative to as drawn in Fig 14) could be realized we show this layout on the same lot as before Removing the need to store two 40-foot tube trailers by adding on-site low pressure storage could also drastically reduce the footprint by reducing the need to have an open wall for delivery A discussion of how the separation distances can be impacted and the footprints might be reduced due to fire-rated walls is included at the end of the Section 35
33
140
0
168 0
50 0
30 0
dispenser island
tube trailer
modular station(20 ft ISO)
conveniencestore
Figure 14 Renderings of a modular station layout with delivered hydrogen
34
35 Modular Station with Hydrogen Produced On-site via Electrolysis
The final configuration considered in this analysis is a modular station with an electrolysis unit attached to produce hydrogen The economics of this station design are shown in Fig 15 The installed capital costs and hydrogen costs at each of the three capacity stations with two different uninstalled modular unit costs are tabulated in Table 9 Similar to the results in the previous section the cost of hydrogen at the low volume modular electrolysis stations with an assumed $15M uninstalled modular station cost are higher than at the conventional electrolysis station counterpart We find that the cost of hydrogen at these modular stations with electrolysis produced hydrogen will be $4303kg $2730kg and $2173kg (for the 100 200 and 300 kgday stations) These costs are once again $337kg higher $079kg higher and the same (respectively) as the costs at the conventional stations with electrolysis produced hydrogen discussed in Section 33 This cost difference between the analogous conventional station is once again solely due to the differing capital cost of the installed modular station If the capital cost of the modular unit is $1M the hydrogen costs reduce to $3825 $2491 or $2013kg (for the 100 200 and 300 kgday stations) which are all lower than the cost at the similarly sized conventional stations with on-site electrolysis due to the lower installed station cost
Having on-site production using an electrolyzer and modular fueling station components only requires a small footprint for installation as shown in Fig 16 The ISO containers can house apshypropriate fire-rated barrier walls reducing separation distance for Group 1 and 2 exposures (except for air intakes) by half and eliminating separation distances for Group 3 exposures as described in Section 732312 of NFPA 2 The Hydrogen Technologies Code (2016) [10] Group 1 exshyposures are lot lines air intakes (HVAC compressors other) operable openings in buildings and structures and ignition sources such as open flames and welding Group 2 exposures are exshyposed persons (other than those servicing the system) and parked cars Group 3 exposures include buildings flammable gas storage hazardous materials storage ordinary combustibles horizontal distance to overhead electrical wire and piping containing other hazardous material This means
Table 9 Installed cost (which includes site preparation engishyneering amp design permitting capital and installation costs) and hydrogen cost for modular stations with on-site electrolysis proshyduced hydrogen for two cases of uninstalled modular cost $15M and $10M
capacity uninstalled installed H2 cost (kgday) modular cost ($) cost ($) ($kg)
100 $15M $274M $4303 200 $15M $314M $2730 300 $15M $345M $2173 100 $1M $224M $3825 200 $1M $264M $2491 300 $1M $295M $2013
35
site prep67
stat
ion
capit
al
333
stationinstall 13
eleccapital 181
elec
install
13
elec
el
ectr
icity
163
wate
r0
2
labor
46
maintenance
168
stationelectricity
13
-3000
-2000
-1000
0
1000
2000
3000co
st o
r re
ven
ue (
k$
yr)
taxsite preparationstation capitalstation installelec capitalelec install
elec electricitywater
labormaintenance
station electricity
revenue ($4303kg)net income
100 kgday
site prep53
stat
ion
capi
tal
263
station
install
11
eleccapital 214
elec
install11
elec
elec
tric
ity
257
water
03
lab
or
36
maintenance
132
stationelectricity
21
-4000
-3000
-2000
-1000
0
1000
2000
3000
4000
cost
or
reve
nu
e (
k$
yr)
taxsite preparationstation capitalstation installelec capitalelec install
elec electricitywater
labormaintenance
station electricity
revenue ($2730kg)net income
200 kgday
site prep44
stat
ion
capi
tal
220
stati
on
inst
all
09
elec
capital 224
elecinstall 09
elec
elec
tric
ity32
3
water
04
labor
30 maintenance
111
stationelectricity
26
2020 2025 2030 2035year
-4000
-3000
-2000
-1000
0
1000
2000
3000
4000
cost
or
reve
nu
e (
k$y
r)
taxsite preparationstation capitalstation installelec capitalelec install
elec electricitywater
labormaintenance
station electricity
revenue ($2173kg)net income
300 kgday
modular station electrolysis on-site
Figure 15 Cost and revenue associated with a modular station with on-site electrolysis produced hydrogen to break even at year 7 (2023) assuming a $15M uninstalled capital cost of the modular station The net income includes the effects from depreciation and taxes Capital replacement costs and intervals are not included in this model Pie charts on the right show the breakdown of cumulashytive capital and operating costs over the 7-year analysis period to the cost of dispensed hydrogen
36
electrolyzer(20 ft ISO)
modular station(20 ft ISO)
convenience store
dispenser island
100
0
100 0
17 0
Figure 16 Renderings of a modular station layout with an elecshytrolyzer for on-site production with a small reduced footprint
37
for a typical pipe diameter of 028rdquo and up to 15000 psi pressure (within the operating range of the cascade storage at a refueling station) air intakes must remain 34 ft from the containers while lot lines other building openings or ignition sources only need 17 ft of separation Exposed persons and parked cars must be 8 ft or more away from the containers and other exposures (including other combustibles like gasoline) do not need any separation from the containers This will allow a compact layout an example of which is shown in Fig 16
38
4 Conclusions
Five station designs were considered in this analysis with three capacities of each station deshysign With the current technology the lowest cost hydrogen source assessed here11 is tube-trailers delivering centrally produced gaseous hydrogen Shown in Table 10 or graphically in Fig 17 for either a conventional or modular station with a 300 kgday capacity and delivered hydrogen gas (using our conservative $15M cost estimate for the modular unit) it would cost approximately $186M to prepare the site and build the station and at a dispensed hydrogen cost of $1425kg a station operator would break even on their capital investments and operational costs in 7 years If the capital cost of the modular station unit is only $1M which is still in the range of cost estimates by manufacturers a modular station with delivered hydrogen would cost $136M to build and for a 300 kgday capacity hydrogen would cost $1265kg Embedded in all of these analyses is the utilization profile shown in Fig 2 which is the reason that the hydrogen cost increases as the cashypacity (and utilization) decreases for the modular stations with delivered hydrogen although they have the same installed cost
The specified 7-year return on investment results in higher cost hydrogen for smaller stations than for larger ones due to less throughput and higher capital cost per kg of capacity (see the lower left frame of Fig 17) If the SDO charges customers a price lower than this cost the result will be a longer return on investment Setting the same price regardless of station capacity will result in the 100 kgday station having the longest return on investment and the 300 kgday having the shortest
The addition of a steam methane reformer or an electrolyzer to a hydrogen refueling station increases the capital cost significantly with the steam methane reformer estimated to have the
11The cost of liquid delivery was not included in this analysis
Table 10 Installed cost (which includes site preparation engishyneering amp design permitting component capital and installation costs) and resulting hydrogen cost to break even at year 7 for the stations analyzed in this work
station capacity rarr 100 kgday 200 kgday 300 kgday
station type darr installed cost ($)
H2 cost ($kg)
installed cost ($)
H2 cost ($kg)
installed cost ($)
H2 cost ($kg)
conventional delivered H2 conventional SMR H2 conventional electrolysis H2 modular ($15M) delivered H2 modular ($1M) delivered H2 modular ($15M) electrolysis H2 modular ($1M) electrolysis H2
$151M $274M $238M $186M $136M $274M $224M
$3053 $3847 $3966 $3390 $2912 $4303 $3825
$169M $383M $298M $186M $136M $314M $264M
$1837 $2596 $2651 $1916 $1677 $2730 $2491
$186M $443M $345M $186M $136M $345M $295M
$1426 $2023 $2174 $1425 $1265 $2173 $2013
39
$00M$05M$10M$15M$20M$25M$30M$35M$40M$45M
inst
all
ed
cost
($)
capacity (kgday)
100 200 300
conv
ention
al d
eliv
ered
gas
conv
ention
al S
MR
conv
ention
al e
lect
roly
sis
mod
ular
($1
5M
) d
eliv
ered
gas
mod
ular
($1
M) d
eliv
ered
gas
mod
ular
($1
5M
) e
lect
roly
sis
mod
ular
($1
M) e
lect
roly
sis
$0k
$5k
$10k
$15k
$20k
$25k
$30k
inst
all
ed
cost
($[
kg
day]
)
conv
ention
al d
eliv
ered
gas
conv
ention
al S
MR
conv
ention
al e
lect
roly
sis
mod
ular
($1
5M
) d
eliv
ered
gas
mod
ular
($1
M) d
eliv
ered
gas
mod
ular
($1
5M
) e
lect
roly
sis
mod
ular
($1
M) e
lect
roly
sis
$0$5
$10$15$20$25$30$35$40$45
H2 c
ost
($k
g)
capacity (kgday)
100 200 300
Figure 17 Installed cost (which includes site preparation engishyneering amp design permitting component capital and installation costs) are shown in the left frames The top frame is the total inshyvestment in 2016$ while the bottom left frame is the installed cost per mass of hydrogen dispensed (kgday) The hydrogen cost to break even at year 7 is shown in the right frame for the stations analyzed in this work
40
highest capital cost On-site production does allow for a more compact station footprint and does not require consideration for tube-trailer delivery routes With current technology and projected utility prices operating a steam methane reformer costs slightly less than operating an electrolyzer These offsetting differences in capital vs operational costs causes the price of hydrogen to be very similar for a station with SMR produced hydrogen and electrolysis produced hydrogen In both cases the cost of hydrogen is $6-$10kg more for the stations that produce hydrogen on-site than the stations that have hydrogen delivered This analysis does not include the startup and shutdown inefficiencies (and associated costs) for either the SMR or electrolyzer The penalty for cycling a SMR is likely greater than for cycling an electrolyzer potentially giving an electrolyzer an economic advantage for on-site production
Electrolyzers also have the potential to produce less carbon dioxide than SMRrsquos By definishytion SMRrsquos require methane which contains carbon to produce hydrogen releasing the carbon molecules as carbon dioxide and contributing to climate change A reduced carbon footprint could be achieved by using bio-gas or implementing carbon capture and storage (although this would incur an efficiency penalty) Electrolyzers on the other hand require only electricity and water giving this technology the potential to be completely carbon free given the right source of elecshytricity such as solar wind hydroelectric or nuclear The key to making on-site production more cost competitive with delivered hydrogen is reducing the utility costs For electrolysis this can be achieved through efficiency improvements (although around 50-70 efficiencies are achieved with current technology) through the purchase of low cost off-peak electricity or by using elecshytricity generated behind the meter Of course reducing capital cost and maintenance requirements of on-site production units will also improve the economics of this technology
According to our research current modular fueling stations where components are assembled and tested at a central production facility have installed costs no higher than conventional stations Using our high estimate of $15M for the modular unit the installed cost of the 300 kgday modular station is nearly the same as for a 300 kgday conventional station Using a lower cost estimate of $1M for the modular unit the installed cost of a 100 kgday conventional station is 11 higher than the modular station With greater industry experience and higher volume production we would anticipate the cost of modular stations to reduce in the near-future Developing stations in this manner may lead to better quality control and reduced maintenance requirements for hydrogen fueling stations It is also possible to achieve more compact station footprints by modularizing the station components by building in appropriate fire-rated barrier walls Because of these potential benefits we anticipate modularization and standardization to increase in the future
This report details the economics of current hydrogen refueling stations and includes some sketches of potential layouts We have visually depicted the contributions to capital and operational costs of hydrogen for different station concepts making it easy to find the largest contributors to a high cost of hydrogen to the consumer This information can be used to devote research and development towards these high contributors At the station the dispenser compressors and chillers are expensive pieces where additional development or higher volume production could reduce station costs For electrolysis the purchase of low-priced electricity could serve to make on-site production cost competitive with central production and delivery This report enables the comparison of different station concepts that could be implemented in various market scenarios
41
A Piping amp Instrumentation Diagram
The following pages show the piping and instrumentation diagram for the included reference stations For the conventional stations all components need to be assembled on-site The dashed boxes show the components that are often modularized for the modular stations For reference the utility requirements shown in the PampID are also included here in Table A1
Table A1 Utility requirement estimateslowast for the stations in this report
capacity 100 kgday 200 kgday 300 kgday
compressor power electrolyzer power electrolyzer water SMR power SMR water SMR gas
25 kW 260 kW 110 lhr 16 kW 400 lhr 34 Nm3hr
60 kW 510 kW 220 lhr 33 kW 800 lhr 68 Nm3hr
100 kW 770 kW 330 lhr 49 kW 1200 lhr 101 Nm3hr
lowast These are averages based on manufacturer specifications and literature and are meant to give an estimate of site requirements For exact specifishycations to meet station requirements consult a manufacturer directly
42
ABCDEFGHIJK1
2
3
4
5
6
7
Measured Variable Readout of function Output Function ModifierA Air AlarmB Burner Storage Users Choice Users ChoiceC Compressor ClosedD DispenserE Electrolyzer Sensor (primary Element)F Flow FilterG Chiller Glass viewingH Hand HighI Current IndicatorJ PowerK Time Control StationL Level Light LowM Conductivity MiddleN Users Choice Users Choice Hydrogen Users ChoiceO Water Orifice restriction Air OpenP PressureQ QuantityR Reformer Record ReduceS Speed Frequency SwitchT Temperature TransmitU Multivariate Multifunction Multifunction MultifunctionV Vibration ValveW Weight Well WaterX Unclassified Unclassified Unclassified UnclassifiedY State RelayZ Position Actuator
PROCESS AND SIGNAL LINES
HYDROGEN PROCESS LINE
DEIONIZED WATER PROCESS LINE
PNEUMATIC SIGNAL LINE
NITROGEN SIGNAL LINE
ELECTRICAL SIGNAL LINE
SV
VALVES
BALL VALVE
NEEDLE VALVE
CHECK VALVE
SOLENOID VALVE
AIR ACTUATED VALVE SPRING RETURN CLOSE
PRESSURE REDUCING VALVE
TWO WAY PRESSURE RELIEF
THREE WAY PRESSURE RELIEF
EQUIPMENT
FILTER
PUMP
DRYER
HYDROGEN COMPRESSOR
STORAGE TANK
IR FLAME DETECTOR
Line Service Identification codesCCA-CLEAN COMPRESSED AIRCHW-CHILLED WATERH-HYDROGENN-NITROGEN
Pipe Specification Details3000PSI Min pressure rating of 3000 PSI 316316L austenitic stainless steel tubing UNS S31600 (316) UNS S31603 (316L)6500PSI Min pressure rating of 6500 PSI 316316L austenitic stainless steel tubing UNS S31600 (316) UNS S31603 (316L)15000PSI Min pressure rating of 15000 PSI 316316L austenitic stainless steel tubing UNS S31600 (316) UNS S31603 (316L)POLY Polyamide (Nylon) pneumatic tubing light and heat stabilized0032CU 0032 wall copper alloy 122 seamless tubingSCH40 Schedule 40 iron pipe
Line symbolsXrdquo-XXX-XXXX-XXX-XXX
Line size nominal inches
Service
Line Number (if assigned)
Pipe Spec
Insulation (if applicable)
Insulation codesF1- Soda-lime silicate glass (FOAMGLAS) 1 wall thicknessF2- Buna N Foam 38 thick
ABCDEFGHIJK1
2
3
4
5
6
7
CNH-300
HV-202HV-203
HV-201PT-300PI-300 HV-300
HV-301
Motor460-V 3Oslash SEE NOTE 1
Heater120-V 1Oslash 500 W
PT-202PI-202
34-H-VENT
1-frac14rdquo-CHW-800-SCH40
1-frac14rdquo-CHW-800-SCH40-F2
CW-800
GW-800
HV-202
HV-300
FV-100
ZSO-100
ZSC-100
ZI-100
FSV-100
ZZO-100
FSV-30038-H-3000PSI
38-H-5000PSI
38-H-5000PSI
38-H-15000PSI
34-H-VENT
OF-802TO COMMON frac34rdquo VENT MAST LOCATED ON BACK OF GMP
10 ABOVE GRADE
REFERENCE STATION 100-300 KGDAY
FF-300
GW-801
PI-101 PT-101
H2 Storage PBNH-402MAWP-15000 PSIG
H2 Storage PBNH-403MAWP-15000 PSIG
H2 Storage PBNH-401MAWP-15000 PSIG
FV-401
ZSO-401 ZSC-401
ZZO-401
FV-402
ZSO-402 ZSC-402
ZZO-402
FV-403
ZSO-403 ZSC-403
ZZO-403
FV-400
ZSO-400 ZSC-400
ZZO-400 GN-900
CHILLER 75-kW
DN-900JSS-901(EPO)
To EPO circuit
700-BAR NOZZLE
350-BAR NOZZLE
38-H-15000PSI
H70-T40H70-Warm
H35-T0
3570MPa DISPENSERWUN-900
FVControls Internal120V 1p 15A
GN-901
HEAT EXCHANGER1350 lbs
HV-901
H70-Cold
H2 Delivery Trailer multiple tubes one outlet
COH-100Air Compressor
PBAL-100
HV-100
AF-100
Air DryerAF-101
HV-900
PT-403PI-403
HV-403
PT-402PI-402
HV-402
PT-401PI-401
HV-401
HV-411
HV-412
HV-413
ZI-401
ZI-402
ZI-403
FV-101
ZSO-101 ZSC-101 ZI-101
ZZO-101
ZVO-100
ZVO-101
ZVO-900
ZVO-401
ZVO-400
ZVO-402
ZVO-403
RAH-100IR FLAME DETECTOR
AIMED AT HYDROGEN SOURCEAND ZONE 400
HIGH PRESSURE STORAGE
TO FIRE PANEL
RAH-900
IR FLAME DETECTORAIMED AT DISP HOSES
TO FIRE PANEL
HV-101
38-H-15000PSI
ZI-400
HV-400
FSV-200
EN-100ELECTROLYZER SKID
20 BAR (300 PSI) OUTPUT
RN-100STEAM METHANE REFORMER (SMR)
SKID13 BAR (200 PSI) OUTPUT
ZVO-102
Power460-V 3OslashSEE NOTE 1
Power460-V 3OslashSEE NOTE 1
ONLY ONE HYDROGEN SUPPLY OPTION IS USED PER STATION 1 TUBE TRAILER DELIVERY2 ON-SITE ELECTROLYSIS3 ON-SITE STEAM METHANE REFORMER
MUNICIPAL WATER SUPPLY
SEE NOTE 1
NATURAL GAS BIOGAS METHANE SUPPLY
SEE NOTE 1
NOTE 1 UTILITY REQUIREMENTS DEPEND ON STATION CAPACITY AND CAN BE ESTIMATED BASED ON THE FOLLOWING TABLESTATION CAPACITY 100 KGDAY 200 KGDAY 300 KGDAYELECTROLYZER POWER 260 KW 510 KW 770 KWELECTROLYZER WATER 110 LHR 220 LHR 330 LHRSMR POWER 16 KW 33 KW 49 KWSMR WATER 400 LHR 800 LHR 1200 LHRSMR GAS 34 NM3HR 68 NM3HR 101 NM3HRCOMPRESSOR POWER 25 KW 60 KW 100 KW
NOTE 2 ON-SITE PRODUCTION UNITS MAY INCORPORATE THEIR OWN INSTRUMENT AIR SYSTEM AND INTERCONNECTION WITH CSD SKIDCONTAINER MAY NOT BE NECESSARYNOTE 3 APPLIES TO MODULAR STATION ONLY A BUILD-ON-SITE STATION WILL NOT HAVE A SKID-OR CONTAINER-MOUNTED PRE-ASSEMBLED SYSTEMNOTE 4 IN SOME MODULAR STATIONS THE DISPENSER WILL BE A SEPARATELY-INSTALLED COMPONENTNOTE 5 IN MANY MODULAR STATIONS THE HEAT EXCHANGE EQUIPMENT WILL BE ROOF-MOUNTED
NOTE 2
COMPRESSION STORAGE AND DISPENSER (CSD) SKID OR CONTAINER BOUNDARY SEE NOTE 3
NOTE 4
NOTE 5
NOTE 5
PLCGas Control Cabinet
COMPRESSORMULTIPLE STAGES
References
[1] US Energy Information Administration EIA Open Data - Intro - US Energy Information Administration (EIA) accessed July 2016 httpwwweiagovopendata
[2] US DOE DOE H2A Production Analysis accessed May 2016 httpswwwhydrogen energygovh2a_productionhtml
[3] Joseph Pratt Danny Terlip Chris Ainscough Jennifer Kurtz and Amgad Elgowainy H2FIRST reference station design task Technical Report SAND2015-2660 R Sandia National Laboratories April 2015 Available at httpenergygoveerefuelcells h2first
[4] US DOE DOE H2A Delivery Analysis accessed May 2016 httpswwwhydrogen energygovh2a_deliveryhtml
[5] 2016 Annual Evaluation of Hydrogen Fuel Cell Electric Vehicle Deployment and Hydrogen Fuel Station Network Development Technical report California Environmental Protection Agency Air Resources Board July 2016 Available at httpswwwarbcagovmsprog zevproghydrogenhydrogenhtm
[6] E Sutherland and F Joseck Low volume production and delivery cost Technical Report 15011 Department of Energy Hydrogen and Fuel Cells Program Record 2015
[7] Ricardo Guerrero Lemus and Jose Manuel Martinez Duart Updated hydrogen production costs and parities for conventional and renewable technologies International Journal of Hydrogen Energy 35(9)3929ndash3936 2010
[8] Alfredo Ursua Luis M Gandia and Pablo Sanchis Hydrogen production from water elecshytrolysis current status and future trends Proceedings of the IEEE 100(2)410ndash426 2012
[9] G Parks R Boyd J Cornish and R Remick Hydrogen station compression storage and dispensing technical status and costs Systems integration Technical Report NRELBKshy6A10-58564 National Renewable Energy Laboratory (NREL) Golden CO May 2014
[10] NFPA 2 Hydrogen Technologies Code Technical report National Fire Protection Associashytion 2016
45
- Executive Summary
- Acknowledgment
- Contents
- Figures
- Tables
- 1 Introduction
-
- 11 Background and Contents
- 12 Approach
- 13 Method Overview
-
- 2 Station Cost Components
-
- 21 Centrally Produced Hydrogen and Delivery
- 22 Hydrogen Produced On-Site via Steam Methane Reforming
- 23 Hydrogen Produced On-Site via Electrolysis
- 24 Compression Storage and Ancillary Equipment for a Conventional Station
- 25 Packaged Compression Storage and Ancillary Equpiment for a Modular Station
- 26 Hydrogen Dispensers
-
- 3 Results Station Designs and Costs
-
- 31 Conventional Station with Delivered Centrally Produced Hydrogen
- 32 Conventional Station with Hydrogen Produced On-Site via Steam Methane Reforming
- 33 Conventional Station with Hydrogen Produced On-Site via Electrolysis
- 34 Modular Station with Delivered Centrally Produced Hydrogen
- 35 Modular Station with Hydrogen Produced On-Site via Electrolysis
-
- 4 Conclusions
- Appendix A Piping and Instrumentation Diagram
- References
-

30 0
50 0
154 0
100
0
conveniencestore
dispenser island
compressor
high pressure storagegas panel
H2 chillerH2 cooling block
air compressorwater chiller
20 ft ISO container(electrolyzer or SMR)
Figure 11 Renderings of a conventional station layout with on-site production of hydrogen
28
site prep
72
stat
ion
capit
al
216
station
install 75
eleccapital 197
elec
install
14
elec
el
ectr
icity
177
wate
r02
lab
or
50
maintenance
182
stationelectricity
14
-3000
-2000
-1000
0
1000
2000
3000co
st o
r re
ven
ue (
k$
yr)
taxsite preparationstation capitalstation installelec capitalelec install
elec electricitywater
labormaintenance
station electricity
revenue ($3966kg)net income
100 kgday
site prep
54
stat
ion
capi
tal
186
statio
n
insta
ll65
eleccapital 221
elec
install11
elec
el
ectr
icit
y26
5
water
03
labor
37
maintenance
136
stationelectricity
21
-3000
-2000
-1000
0
1000
2000
3000
cost
or
reve
nu
e (
k$
yr)
taxsite preparationstation capitalstation installelec capitalelec install
elec electricitywater
labormaintenance
station electricity
revenue ($2651kg)net income
200 kgday
site prep44
stat
ion
capi
tal
170
stati
on
inst
all
59
elec
capital 224
elecinstall
09
elec
el
ectr
icit
y32
3
water
04
labor
30
maintenance
111
stationelectricity
26
2020 2025 2030 2035year
-4000
-3000
-2000
-1000
0
1000
2000
3000
4000
cost
or
reve
nu
e (
k$y
r)
taxsite preparationstation capitalstation installelec capitalelec install
elec electricitywater
labormaintenance
station electricity
revenue ($2174kg)net income
300 kgday
conventional electrolysis on-site
Figure 12 Cost and revenue associated with a conventional assemble-on-site station with on-site electrolysis produced hyshydrogen to break even at year 7 (2023) The net income includes the effects from depreciation and taxes Capital replacement costs and intervals are not included in this model Pie charts on the right show the breakdown of cumulative capital and operating costs over the 7-year analysis period to the cost of dispensed hydrogen
29
Table 7 Installed cost (which includes site preparation engishyneering amp design permitting capital and installation costs) and hydrogen cost for conventional stations with electrolysis on-site
capacity (kgday) installed cost ($) H2 cost ($kg)
100 $238M $3966 200 $298M $2651 300 $345M $2174
station designs has a large capital cost due to the electrolysis unit As discussed in Section 23 the electrolysis units cost approximately $800k $12M and $15M for 100 200 and 300 kgday capacities These capital investments will add approximately $8kg $6kg and $5kg to the cost of hydrogen over a conventional station assuming equivalent operating costs During operation there is a large cost associated with electricity to run the electrolysis unit (shown by the yellow bar) This cost scales with the amount of hydrogen produced and is a large factor in the station economics The pie charts on the right show that this electricity accounts for approximately 20-30 of the cost of hydrogen Other additional costs over the conventional delivered hydrogen station are the cost of water to run the electrolysis unit and additional maintenance on the electrolyzer (assumed to be $50k annually as with the SMR)
The electricity required for the electrolyzer costs approximately $300k $600k and $900k (for the 100 200 and 300 kgday stations) in 2036 where utilization has topped out at 80 Centrally produced delivered hydrogen by comparison as shown in Fig 8 costs around $300k $450k and $650k in 2036 with overall operating costs for the delivered hydrogen station (neglecting taxes) topping out at approximately $400k $600k and $800k In addition to the additional capital costs for the electrolyzer (and the other operational costs) it is clear that the economics of a station with an electrolyzer are challenging due to the high electricity consumption even when the electricity is from the current national grid mix with 13 renewable content10 Higher renewable content may further increase this cost component in the near term although fossil-fuel free electricity may become less expensive in the longer term
The cost of hydrogen for the conventional station with an electrolyzer is $3966kg $2651kg and $2174kg for the 100 200 and 300 kgday stations receptively These costs are on-par with the conventional station with SMR within $150kg for all three capacities The cost of hydrogen for a station with on-site production is significantly higher than for a station with delivered hydroshygen Besides improvements in electrical efficiency one strategy for minimizing operating costs is to only operate the electrolyzer at off-peak hours enabling the purchase of lower priced electricity However this might require oversizing the electrolyzer to produce enough hydrogen at off-peak hours to meet demand increasing the capital costs associated with the unit Another method is inshytentionally oversizing the electrolyzer to enable operation at a higher efficiency thereby reducing operating expenses
102015 estimate from httpwwweiagovtoolsfaqsfaqcfmid=92ampt=4
30
To estimate the impact of these methods of operation and aslo gain insight into less expensive renewable electricity costs in the future the model was run with the cost of electricity zeroed-out to calculate the lowest possible cost of hydrogen with cheap electricity In this scenario the cost of hydrogen is $3264kg $1949kg and $1472kg (for the 100 200 and 300 kgday stations) These costs are only slightly higher (by 3-7) than the conventional delivered hydrogen cost due to the capital investment in the electrolyzer and the remaining electrolyzer maintenance and water costs
A station with on-site electrolysis can also be represented by the layout shown in Fig 11 Housing the components necessary for alkaline electrolysis of 100-300 kgday hydrogen might be challenging in a 20 ft ISO container and the layout might need to be increased (to a 30 or 40 ft ISO container) For PEM electrolysis however the components should fit in the 20 ft ISO container and potentially smaller containers for the 100 or 200 kgday stations Similar to the reforming layout the hydrogen components fit in a much more compact space than for the conventional station with delivered hydrogen (shown in Fig 9) and the lot size is reduced
34 Modular Station with Delivered Centrally Produced Hydrogen
Figure 13 shows the cost revenue and income model for a modular station with delivered centrally produced hydrogen and an uninstalled modular unit cost of $15M The installed capital costs and hydrogen costs at each of the three capacity stations are tabulated in Table 8 Recall from Section 25 that the capital costs for modular stations do not follow the same trend as for build-on-site stations because modular stations come in discrete sizes Table 8 shows the installed capital and hydrogen costs for two cases of uninstalled modular station costs of $15M and $1M The only difference in costs between this scenario and the conventional station with delivered centrally produced hydrogen (see Table 5 and Fig 8) are in the capital costs While the installed capital costs including site preparation station capital and installation were $15M and $17M for the 100 and 200 kgday conventional stations it is $186M for all three capacities of the modular
Table 8 Installed cost (which includes site preparation engishyneering amp design permitting capital and installation costs) and hydrogen cost for modular stations with delivered hydrogen for two cases of uninstalled modular cost $15M and $10M
capacity uninstalled installed H2 cost (kgday) modular cost ($) cost ($) ($kg)
100 $15M $186M $3390 200 $15M $186M $1916 300 $15M $186M $1425 100 $1M $136M $2912 200 $1M $136M $1677 300 $1M $136M $1265
31
site
pre
p
85
stationcapital 423
statio
n
install
17d
elive
red
H2
294
labor
58
maintenance107
electricity
17
-2000
-1500
-1000
-500
0
500
1000
1500
2000co
st o
r re
ven
ue (
k$
yr)
tax
site preparationstation capitalstation install
delivered H2labor
maintenanceelectricity
revenue ($3390kg)net income
100 kgday
site
prep
75
station
capital 374
station
install15
delive
red
H2
360
labor
52
maintenance94
electricity
30
-2000
-1500
-1000
-500
0
500
1000
1500
2000
cost
or
reve
nu
e (
k$
yr)
tax
site preparationstation capitalstation install
delivered H2labor
maintenanceelectricity
revenue ($1916kg)net income
200 kgday
site
prep
67
station
capital336
stationinstall 13
del
iver
ed H2
413
labor
46
maintenance85
electricity
40
2020 2025 2030 2035year
-2000
-1500
-1000
-500
0
500
1000
1500
2000
cost
or
reve
nu
e (
k$y
r)
tax
site preparationstation capitalstation install
delivered H2labor
maintenanceelectricity
revenue ($1425kg)net income
300 kgday
modular station delivered hydrogen
Figure 13 Cost and revenue associated with a modular station with centrally produced delivered hydrogen to break even at year 7 (2023) assuming a $15M uninstalled capital cost of the modular station The net income includes the effects from depreciation and taxes Capital replacement costs and intervals are not included in this model Pie charts on the right show the breakdown of cumulashytive capital and operating costs over the 7-year analysis period to the cost of dispensed hydrogen
32
stations This capital investment for a 300 kgday modular station (including site preparation station capital and installation) is coincidentally the same as for a 300 kgday conventional station
If an estimate of $1M (as compared to the conservative estimate of $15M) for the uninstalled capital cost of the modular fueling station unit is used (note that this is still within the range of costs vendors estimated as described in Section 25) the cost of hydrogen will be $2912 $1677 and $1265 for the 100 200 and 300 kgday capacities respectively These costs are all lower than the cost of hydrogen at the equivalent capacity conventional stations As this technology matures and the installed capital cost of the modular units continues to decrease below the installed capital cost of the conventional stations it will make economic sense to site modular stations rather than assembling components on-site Parts standardization and the increased quality control that can be achieved by having modular station components may also lead to reduced maintenance requirements but that potential benefit is not included in this analysis
Figure 14 shows that a modular unit requires a slightly smaller installation area than the conshyventional station components shown in Fig 9 However the tube trailers acting as the hydrogen source and on-site storage still require significant space Similar to the conventional station with delivered hydrogen delivery routes must also be considered when siting a modular station with deshylivered hydrogen The hydrogen components are shown as being housed in a 20 ft ISO container although some 300 kgday modular stations are smaller than this While a slightly overall reduced footprint (relative to as drawn in Fig 14) could be realized we show this layout on the same lot as before Removing the need to store two 40-foot tube trailers by adding on-site low pressure storage could also drastically reduce the footprint by reducing the need to have an open wall for delivery A discussion of how the separation distances can be impacted and the footprints might be reduced due to fire-rated walls is included at the end of the Section 35
33
140
0
168 0
50 0
30 0
dispenser island
tube trailer
modular station(20 ft ISO)
conveniencestore
Figure 14 Renderings of a modular station layout with delivered hydrogen
34
35 Modular Station with Hydrogen Produced On-site via Electrolysis
The final configuration considered in this analysis is a modular station with an electrolysis unit attached to produce hydrogen The economics of this station design are shown in Fig 15 The installed capital costs and hydrogen costs at each of the three capacity stations with two different uninstalled modular unit costs are tabulated in Table 9 Similar to the results in the previous section the cost of hydrogen at the low volume modular electrolysis stations with an assumed $15M uninstalled modular station cost are higher than at the conventional electrolysis station counterpart We find that the cost of hydrogen at these modular stations with electrolysis produced hydrogen will be $4303kg $2730kg and $2173kg (for the 100 200 and 300 kgday stations) These costs are once again $337kg higher $079kg higher and the same (respectively) as the costs at the conventional stations with electrolysis produced hydrogen discussed in Section 33 This cost difference between the analogous conventional station is once again solely due to the differing capital cost of the installed modular station If the capital cost of the modular unit is $1M the hydrogen costs reduce to $3825 $2491 or $2013kg (for the 100 200 and 300 kgday stations) which are all lower than the cost at the similarly sized conventional stations with on-site electrolysis due to the lower installed station cost
Having on-site production using an electrolyzer and modular fueling station components only requires a small footprint for installation as shown in Fig 16 The ISO containers can house apshypropriate fire-rated barrier walls reducing separation distance for Group 1 and 2 exposures (except for air intakes) by half and eliminating separation distances for Group 3 exposures as described in Section 732312 of NFPA 2 The Hydrogen Technologies Code (2016) [10] Group 1 exshyposures are lot lines air intakes (HVAC compressors other) operable openings in buildings and structures and ignition sources such as open flames and welding Group 2 exposures are exshyposed persons (other than those servicing the system) and parked cars Group 3 exposures include buildings flammable gas storage hazardous materials storage ordinary combustibles horizontal distance to overhead electrical wire and piping containing other hazardous material This means
Table 9 Installed cost (which includes site preparation engishyneering amp design permitting capital and installation costs) and hydrogen cost for modular stations with on-site electrolysis proshyduced hydrogen for two cases of uninstalled modular cost $15M and $10M
capacity uninstalled installed H2 cost (kgday) modular cost ($) cost ($) ($kg)
100 $15M $274M $4303 200 $15M $314M $2730 300 $15M $345M $2173 100 $1M $224M $3825 200 $1M $264M $2491 300 $1M $295M $2013
35
site prep67
stat
ion
capit
al
333
stationinstall 13
eleccapital 181
elec
install
13
elec
el
ectr
icity
163
wate
r0
2
labor
46
maintenance
168
stationelectricity
13
-3000
-2000
-1000
0
1000
2000
3000co
st o
r re
ven
ue (
k$
yr)
taxsite preparationstation capitalstation installelec capitalelec install
elec electricitywater
labormaintenance
station electricity
revenue ($4303kg)net income
100 kgday
site prep53
stat
ion
capi
tal
263
station
install
11
eleccapital 214
elec
install11
elec
elec
tric
ity
257
water
03
lab
or
36
maintenance
132
stationelectricity
21
-4000
-3000
-2000
-1000
0
1000
2000
3000
4000
cost
or
reve
nu
e (
k$
yr)
taxsite preparationstation capitalstation installelec capitalelec install
elec electricitywater
labormaintenance
station electricity
revenue ($2730kg)net income
200 kgday
site prep44
stat
ion
capi
tal
220
stati
on
inst
all
09
elec
capital 224
elecinstall 09
elec
elec
tric
ity32
3
water
04
labor
30 maintenance
111
stationelectricity
26
2020 2025 2030 2035year
-4000
-3000
-2000
-1000
0
1000
2000
3000
4000
cost
or
reve
nu
e (
k$y
r)
taxsite preparationstation capitalstation installelec capitalelec install
elec electricitywater
labormaintenance
station electricity
revenue ($2173kg)net income
300 kgday
modular station electrolysis on-site
Figure 15 Cost and revenue associated with a modular station with on-site electrolysis produced hydrogen to break even at year 7 (2023) assuming a $15M uninstalled capital cost of the modular station The net income includes the effects from depreciation and taxes Capital replacement costs and intervals are not included in this model Pie charts on the right show the breakdown of cumulashytive capital and operating costs over the 7-year analysis period to the cost of dispensed hydrogen
36
electrolyzer(20 ft ISO)
modular station(20 ft ISO)
convenience store
dispenser island
100
0
100 0
17 0
Figure 16 Renderings of a modular station layout with an elecshytrolyzer for on-site production with a small reduced footprint
37
for a typical pipe diameter of 028rdquo and up to 15000 psi pressure (within the operating range of the cascade storage at a refueling station) air intakes must remain 34 ft from the containers while lot lines other building openings or ignition sources only need 17 ft of separation Exposed persons and parked cars must be 8 ft or more away from the containers and other exposures (including other combustibles like gasoline) do not need any separation from the containers This will allow a compact layout an example of which is shown in Fig 16
38
4 Conclusions
Five station designs were considered in this analysis with three capacities of each station deshysign With the current technology the lowest cost hydrogen source assessed here11 is tube-trailers delivering centrally produced gaseous hydrogen Shown in Table 10 or graphically in Fig 17 for either a conventional or modular station with a 300 kgday capacity and delivered hydrogen gas (using our conservative $15M cost estimate for the modular unit) it would cost approximately $186M to prepare the site and build the station and at a dispensed hydrogen cost of $1425kg a station operator would break even on their capital investments and operational costs in 7 years If the capital cost of the modular station unit is only $1M which is still in the range of cost estimates by manufacturers a modular station with delivered hydrogen would cost $136M to build and for a 300 kgday capacity hydrogen would cost $1265kg Embedded in all of these analyses is the utilization profile shown in Fig 2 which is the reason that the hydrogen cost increases as the cashypacity (and utilization) decreases for the modular stations with delivered hydrogen although they have the same installed cost
The specified 7-year return on investment results in higher cost hydrogen for smaller stations than for larger ones due to less throughput and higher capital cost per kg of capacity (see the lower left frame of Fig 17) If the SDO charges customers a price lower than this cost the result will be a longer return on investment Setting the same price regardless of station capacity will result in the 100 kgday station having the longest return on investment and the 300 kgday having the shortest
The addition of a steam methane reformer or an electrolyzer to a hydrogen refueling station increases the capital cost significantly with the steam methane reformer estimated to have the
11The cost of liquid delivery was not included in this analysis
Table 10 Installed cost (which includes site preparation engishyneering amp design permitting component capital and installation costs) and resulting hydrogen cost to break even at year 7 for the stations analyzed in this work
station capacity rarr 100 kgday 200 kgday 300 kgday
station type darr installed cost ($)
H2 cost ($kg)
installed cost ($)
H2 cost ($kg)
installed cost ($)
H2 cost ($kg)
conventional delivered H2 conventional SMR H2 conventional electrolysis H2 modular ($15M) delivered H2 modular ($1M) delivered H2 modular ($15M) electrolysis H2 modular ($1M) electrolysis H2
$151M $274M $238M $186M $136M $274M $224M
$3053 $3847 $3966 $3390 $2912 $4303 $3825
$169M $383M $298M $186M $136M $314M $264M
$1837 $2596 $2651 $1916 $1677 $2730 $2491
$186M $443M $345M $186M $136M $345M $295M
$1426 $2023 $2174 $1425 $1265 $2173 $2013
39
$00M$05M$10M$15M$20M$25M$30M$35M$40M$45M
inst
all
ed
cost
($)
capacity (kgday)
100 200 300
conv
ention
al d
eliv
ered
gas
conv
ention
al S
MR
conv
ention
al e
lect
roly
sis
mod
ular
($1
5M
) d
eliv
ered
gas
mod
ular
($1
M) d
eliv
ered
gas
mod
ular
($1
5M
) e
lect
roly
sis
mod
ular
($1
M) e
lect
roly
sis
$0k
$5k
$10k
$15k
$20k
$25k
$30k
inst
all
ed
cost
($[
kg
day]
)
conv
ention
al d
eliv
ered
gas
conv
ention
al S
MR
conv
ention
al e
lect
roly
sis
mod
ular
($1
5M
) d
eliv
ered
gas
mod
ular
($1
M) d
eliv
ered
gas
mod
ular
($1
5M
) e
lect
roly
sis
mod
ular
($1
M) e
lect
roly
sis
$0$5
$10$15$20$25$30$35$40$45
H2 c
ost
($k
g)
capacity (kgday)
100 200 300
Figure 17 Installed cost (which includes site preparation engishyneering amp design permitting component capital and installation costs) are shown in the left frames The top frame is the total inshyvestment in 2016$ while the bottom left frame is the installed cost per mass of hydrogen dispensed (kgday) The hydrogen cost to break even at year 7 is shown in the right frame for the stations analyzed in this work
40
highest capital cost On-site production does allow for a more compact station footprint and does not require consideration for tube-trailer delivery routes With current technology and projected utility prices operating a steam methane reformer costs slightly less than operating an electrolyzer These offsetting differences in capital vs operational costs causes the price of hydrogen to be very similar for a station with SMR produced hydrogen and electrolysis produced hydrogen In both cases the cost of hydrogen is $6-$10kg more for the stations that produce hydrogen on-site than the stations that have hydrogen delivered This analysis does not include the startup and shutdown inefficiencies (and associated costs) for either the SMR or electrolyzer The penalty for cycling a SMR is likely greater than for cycling an electrolyzer potentially giving an electrolyzer an economic advantage for on-site production
Electrolyzers also have the potential to produce less carbon dioxide than SMRrsquos By definishytion SMRrsquos require methane which contains carbon to produce hydrogen releasing the carbon molecules as carbon dioxide and contributing to climate change A reduced carbon footprint could be achieved by using bio-gas or implementing carbon capture and storage (although this would incur an efficiency penalty) Electrolyzers on the other hand require only electricity and water giving this technology the potential to be completely carbon free given the right source of elecshytricity such as solar wind hydroelectric or nuclear The key to making on-site production more cost competitive with delivered hydrogen is reducing the utility costs For electrolysis this can be achieved through efficiency improvements (although around 50-70 efficiencies are achieved with current technology) through the purchase of low cost off-peak electricity or by using elecshytricity generated behind the meter Of course reducing capital cost and maintenance requirements of on-site production units will also improve the economics of this technology
According to our research current modular fueling stations where components are assembled and tested at a central production facility have installed costs no higher than conventional stations Using our high estimate of $15M for the modular unit the installed cost of the 300 kgday modular station is nearly the same as for a 300 kgday conventional station Using a lower cost estimate of $1M for the modular unit the installed cost of a 100 kgday conventional station is 11 higher than the modular station With greater industry experience and higher volume production we would anticipate the cost of modular stations to reduce in the near-future Developing stations in this manner may lead to better quality control and reduced maintenance requirements for hydrogen fueling stations It is also possible to achieve more compact station footprints by modularizing the station components by building in appropriate fire-rated barrier walls Because of these potential benefits we anticipate modularization and standardization to increase in the future
This report details the economics of current hydrogen refueling stations and includes some sketches of potential layouts We have visually depicted the contributions to capital and operational costs of hydrogen for different station concepts making it easy to find the largest contributors to a high cost of hydrogen to the consumer This information can be used to devote research and development towards these high contributors At the station the dispenser compressors and chillers are expensive pieces where additional development or higher volume production could reduce station costs For electrolysis the purchase of low-priced electricity could serve to make on-site production cost competitive with central production and delivery This report enables the comparison of different station concepts that could be implemented in various market scenarios
41
A Piping amp Instrumentation Diagram
The following pages show the piping and instrumentation diagram for the included reference stations For the conventional stations all components need to be assembled on-site The dashed boxes show the components that are often modularized for the modular stations For reference the utility requirements shown in the PampID are also included here in Table A1
Table A1 Utility requirement estimateslowast for the stations in this report
capacity 100 kgday 200 kgday 300 kgday
compressor power electrolyzer power electrolyzer water SMR power SMR water SMR gas
25 kW 260 kW 110 lhr 16 kW 400 lhr 34 Nm3hr
60 kW 510 kW 220 lhr 33 kW 800 lhr 68 Nm3hr
100 kW 770 kW 330 lhr 49 kW 1200 lhr 101 Nm3hr
lowast These are averages based on manufacturer specifications and literature and are meant to give an estimate of site requirements For exact specifishycations to meet station requirements consult a manufacturer directly
42
ABCDEFGHIJK1
2
3
4
5
6
7
Measured Variable Readout of function Output Function ModifierA Air AlarmB Burner Storage Users Choice Users ChoiceC Compressor ClosedD DispenserE Electrolyzer Sensor (primary Element)F Flow FilterG Chiller Glass viewingH Hand HighI Current IndicatorJ PowerK Time Control StationL Level Light LowM Conductivity MiddleN Users Choice Users Choice Hydrogen Users ChoiceO Water Orifice restriction Air OpenP PressureQ QuantityR Reformer Record ReduceS Speed Frequency SwitchT Temperature TransmitU Multivariate Multifunction Multifunction MultifunctionV Vibration ValveW Weight Well WaterX Unclassified Unclassified Unclassified UnclassifiedY State RelayZ Position Actuator
PROCESS AND SIGNAL LINES
HYDROGEN PROCESS LINE
DEIONIZED WATER PROCESS LINE
PNEUMATIC SIGNAL LINE
NITROGEN SIGNAL LINE
ELECTRICAL SIGNAL LINE
SV
VALVES
BALL VALVE
NEEDLE VALVE
CHECK VALVE
SOLENOID VALVE
AIR ACTUATED VALVE SPRING RETURN CLOSE
PRESSURE REDUCING VALVE
TWO WAY PRESSURE RELIEF
THREE WAY PRESSURE RELIEF
EQUIPMENT
FILTER
PUMP
DRYER
HYDROGEN COMPRESSOR
STORAGE TANK
IR FLAME DETECTOR
Line Service Identification codesCCA-CLEAN COMPRESSED AIRCHW-CHILLED WATERH-HYDROGENN-NITROGEN
Pipe Specification Details3000PSI Min pressure rating of 3000 PSI 316316L austenitic stainless steel tubing UNS S31600 (316) UNS S31603 (316L)6500PSI Min pressure rating of 6500 PSI 316316L austenitic stainless steel tubing UNS S31600 (316) UNS S31603 (316L)15000PSI Min pressure rating of 15000 PSI 316316L austenitic stainless steel tubing UNS S31600 (316) UNS S31603 (316L)POLY Polyamide (Nylon) pneumatic tubing light and heat stabilized0032CU 0032 wall copper alloy 122 seamless tubingSCH40 Schedule 40 iron pipe
Line symbolsXrdquo-XXX-XXXX-XXX-XXX
Line size nominal inches
Service
Line Number (if assigned)
Pipe Spec
Insulation (if applicable)
Insulation codesF1- Soda-lime silicate glass (FOAMGLAS) 1 wall thicknessF2- Buna N Foam 38 thick
ABCDEFGHIJK1
2
3
4
5
6
7
CNH-300
HV-202HV-203
HV-201PT-300PI-300 HV-300
HV-301
Motor460-V 3Oslash SEE NOTE 1
Heater120-V 1Oslash 500 W
PT-202PI-202
34-H-VENT
1-frac14rdquo-CHW-800-SCH40
1-frac14rdquo-CHW-800-SCH40-F2
CW-800
GW-800
HV-202
HV-300
FV-100
ZSO-100
ZSC-100
ZI-100
FSV-100
ZZO-100
FSV-30038-H-3000PSI
38-H-5000PSI
38-H-5000PSI
38-H-15000PSI
34-H-VENT
OF-802TO COMMON frac34rdquo VENT MAST LOCATED ON BACK OF GMP
10 ABOVE GRADE
REFERENCE STATION 100-300 KGDAY
FF-300
GW-801
PI-101 PT-101
H2 Storage PBNH-402MAWP-15000 PSIG
H2 Storage PBNH-403MAWP-15000 PSIG
H2 Storage PBNH-401MAWP-15000 PSIG
FV-401
ZSO-401 ZSC-401
ZZO-401
FV-402
ZSO-402 ZSC-402
ZZO-402
FV-403
ZSO-403 ZSC-403
ZZO-403
FV-400
ZSO-400 ZSC-400
ZZO-400 GN-900
CHILLER 75-kW
DN-900JSS-901(EPO)
To EPO circuit
700-BAR NOZZLE
350-BAR NOZZLE
38-H-15000PSI
H70-T40H70-Warm
H35-T0
3570MPa DISPENSERWUN-900
FVControls Internal120V 1p 15A
GN-901
HEAT EXCHANGER1350 lbs
HV-901
H70-Cold
H2 Delivery Trailer multiple tubes one outlet
COH-100Air Compressor
PBAL-100
HV-100
AF-100
Air DryerAF-101
HV-900
PT-403PI-403
HV-403
PT-402PI-402
HV-402
PT-401PI-401
HV-401
HV-411
HV-412
HV-413
ZI-401
ZI-402
ZI-403
FV-101
ZSO-101 ZSC-101 ZI-101
ZZO-101
ZVO-100
ZVO-101
ZVO-900
ZVO-401
ZVO-400
ZVO-402
ZVO-403
RAH-100IR FLAME DETECTOR
AIMED AT HYDROGEN SOURCEAND ZONE 400
HIGH PRESSURE STORAGE
TO FIRE PANEL
RAH-900
IR FLAME DETECTORAIMED AT DISP HOSES
TO FIRE PANEL
HV-101
38-H-15000PSI
ZI-400
HV-400
FSV-200
EN-100ELECTROLYZER SKID
20 BAR (300 PSI) OUTPUT
RN-100STEAM METHANE REFORMER (SMR)
SKID13 BAR (200 PSI) OUTPUT
ZVO-102
Power460-V 3OslashSEE NOTE 1
Power460-V 3OslashSEE NOTE 1
ONLY ONE HYDROGEN SUPPLY OPTION IS USED PER STATION 1 TUBE TRAILER DELIVERY2 ON-SITE ELECTROLYSIS3 ON-SITE STEAM METHANE REFORMER
MUNICIPAL WATER SUPPLY
SEE NOTE 1
NATURAL GAS BIOGAS METHANE SUPPLY
SEE NOTE 1
NOTE 1 UTILITY REQUIREMENTS DEPEND ON STATION CAPACITY AND CAN BE ESTIMATED BASED ON THE FOLLOWING TABLESTATION CAPACITY 100 KGDAY 200 KGDAY 300 KGDAYELECTROLYZER POWER 260 KW 510 KW 770 KWELECTROLYZER WATER 110 LHR 220 LHR 330 LHRSMR POWER 16 KW 33 KW 49 KWSMR WATER 400 LHR 800 LHR 1200 LHRSMR GAS 34 NM3HR 68 NM3HR 101 NM3HRCOMPRESSOR POWER 25 KW 60 KW 100 KW
NOTE 2 ON-SITE PRODUCTION UNITS MAY INCORPORATE THEIR OWN INSTRUMENT AIR SYSTEM AND INTERCONNECTION WITH CSD SKIDCONTAINER MAY NOT BE NECESSARYNOTE 3 APPLIES TO MODULAR STATION ONLY A BUILD-ON-SITE STATION WILL NOT HAVE A SKID-OR CONTAINER-MOUNTED PRE-ASSEMBLED SYSTEMNOTE 4 IN SOME MODULAR STATIONS THE DISPENSER WILL BE A SEPARATELY-INSTALLED COMPONENTNOTE 5 IN MANY MODULAR STATIONS THE HEAT EXCHANGE EQUIPMENT WILL BE ROOF-MOUNTED
NOTE 2
COMPRESSION STORAGE AND DISPENSER (CSD) SKID OR CONTAINER BOUNDARY SEE NOTE 3
NOTE 4
NOTE 5
NOTE 5
PLCGas Control Cabinet
COMPRESSORMULTIPLE STAGES
References
[1] US Energy Information Administration EIA Open Data - Intro - US Energy Information Administration (EIA) accessed July 2016 httpwwweiagovopendata
[2] US DOE DOE H2A Production Analysis accessed May 2016 httpswwwhydrogen energygovh2a_productionhtml
[3] Joseph Pratt Danny Terlip Chris Ainscough Jennifer Kurtz and Amgad Elgowainy H2FIRST reference station design task Technical Report SAND2015-2660 R Sandia National Laboratories April 2015 Available at httpenergygoveerefuelcells h2first
[4] US DOE DOE H2A Delivery Analysis accessed May 2016 httpswwwhydrogen energygovh2a_deliveryhtml
[5] 2016 Annual Evaluation of Hydrogen Fuel Cell Electric Vehicle Deployment and Hydrogen Fuel Station Network Development Technical report California Environmental Protection Agency Air Resources Board July 2016 Available at httpswwwarbcagovmsprog zevproghydrogenhydrogenhtm
[6] E Sutherland and F Joseck Low volume production and delivery cost Technical Report 15011 Department of Energy Hydrogen and Fuel Cells Program Record 2015
[7] Ricardo Guerrero Lemus and Jose Manuel Martinez Duart Updated hydrogen production costs and parities for conventional and renewable technologies International Journal of Hydrogen Energy 35(9)3929ndash3936 2010
[8] Alfredo Ursua Luis M Gandia and Pablo Sanchis Hydrogen production from water elecshytrolysis current status and future trends Proceedings of the IEEE 100(2)410ndash426 2012
[9] G Parks R Boyd J Cornish and R Remick Hydrogen station compression storage and dispensing technical status and costs Systems integration Technical Report NRELBKshy6A10-58564 National Renewable Energy Laboratory (NREL) Golden CO May 2014
[10] NFPA 2 Hydrogen Technologies Code Technical report National Fire Protection Associashytion 2016
45
- Executive Summary
- Acknowledgment
- Contents
- Figures
- Tables
- 1 Introduction
-
- 11 Background and Contents
- 12 Approach
- 13 Method Overview
-
- 2 Station Cost Components
-
- 21 Centrally Produced Hydrogen and Delivery
- 22 Hydrogen Produced On-Site via Steam Methane Reforming
- 23 Hydrogen Produced On-Site via Electrolysis
- 24 Compression Storage and Ancillary Equipment for a Conventional Station
- 25 Packaged Compression Storage and Ancillary Equpiment for a Modular Station
- 26 Hydrogen Dispensers
-
- 3 Results Station Designs and Costs
-
- 31 Conventional Station with Delivered Centrally Produced Hydrogen
- 32 Conventional Station with Hydrogen Produced On-Site via Steam Methane Reforming
- 33 Conventional Station with Hydrogen Produced On-Site via Electrolysis
- 34 Modular Station with Delivered Centrally Produced Hydrogen
- 35 Modular Station with Hydrogen Produced On-Site via Electrolysis
-
- 4 Conclusions
- Appendix A Piping and Instrumentation Diagram
- References
-

site prep
72
stat
ion
capit
al
216
station
install 75
eleccapital 197
elec
install
14
elec
el
ectr
icity
177
wate
r02
lab
or
50
maintenance
182
stationelectricity
14
-3000
-2000
-1000
0
1000
2000
3000co
st o
r re
ven
ue (
k$
yr)
taxsite preparationstation capitalstation installelec capitalelec install
elec electricitywater
labormaintenance
station electricity
revenue ($3966kg)net income
100 kgday
site prep
54
stat
ion
capi
tal
186
statio
n
insta
ll65
eleccapital 221
elec
install11
elec
el
ectr
icit
y26
5
water
03
labor
37
maintenance
136
stationelectricity
21
-3000
-2000
-1000
0
1000
2000
3000
cost
or
reve
nu
e (
k$
yr)
taxsite preparationstation capitalstation installelec capitalelec install
elec electricitywater
labormaintenance
station electricity
revenue ($2651kg)net income
200 kgday
site prep44
stat
ion
capi
tal
170
stati
on
inst
all
59
elec
capital 224
elecinstall
09
elec
el
ectr
icit
y32
3
water
04
labor
30
maintenance
111
stationelectricity
26
2020 2025 2030 2035year
-4000
-3000
-2000
-1000
0
1000
2000
3000
4000
cost
or
reve
nu
e (
k$y
r)
taxsite preparationstation capitalstation installelec capitalelec install
elec electricitywater
labormaintenance
station electricity
revenue ($2174kg)net income
300 kgday
conventional electrolysis on-site
Figure 12 Cost and revenue associated with a conventional assemble-on-site station with on-site electrolysis produced hyshydrogen to break even at year 7 (2023) The net income includes the effects from depreciation and taxes Capital replacement costs and intervals are not included in this model Pie charts on the right show the breakdown of cumulative capital and operating costs over the 7-year analysis period to the cost of dispensed hydrogen
29
Table 7 Installed cost (which includes site preparation engishyneering amp design permitting capital and installation costs) and hydrogen cost for conventional stations with electrolysis on-site
capacity (kgday) installed cost ($) H2 cost ($kg)
100 $238M $3966 200 $298M $2651 300 $345M $2174
station designs has a large capital cost due to the electrolysis unit As discussed in Section 23 the electrolysis units cost approximately $800k $12M and $15M for 100 200 and 300 kgday capacities These capital investments will add approximately $8kg $6kg and $5kg to the cost of hydrogen over a conventional station assuming equivalent operating costs During operation there is a large cost associated with electricity to run the electrolysis unit (shown by the yellow bar) This cost scales with the amount of hydrogen produced and is a large factor in the station economics The pie charts on the right show that this electricity accounts for approximately 20-30 of the cost of hydrogen Other additional costs over the conventional delivered hydrogen station are the cost of water to run the electrolysis unit and additional maintenance on the electrolyzer (assumed to be $50k annually as with the SMR)
The electricity required for the electrolyzer costs approximately $300k $600k and $900k (for the 100 200 and 300 kgday stations) in 2036 where utilization has topped out at 80 Centrally produced delivered hydrogen by comparison as shown in Fig 8 costs around $300k $450k and $650k in 2036 with overall operating costs for the delivered hydrogen station (neglecting taxes) topping out at approximately $400k $600k and $800k In addition to the additional capital costs for the electrolyzer (and the other operational costs) it is clear that the economics of a station with an electrolyzer are challenging due to the high electricity consumption even when the electricity is from the current national grid mix with 13 renewable content10 Higher renewable content may further increase this cost component in the near term although fossil-fuel free electricity may become less expensive in the longer term
The cost of hydrogen for the conventional station with an electrolyzer is $3966kg $2651kg and $2174kg for the 100 200 and 300 kgday stations receptively These costs are on-par with the conventional station with SMR within $150kg for all three capacities The cost of hydrogen for a station with on-site production is significantly higher than for a station with delivered hydroshygen Besides improvements in electrical efficiency one strategy for minimizing operating costs is to only operate the electrolyzer at off-peak hours enabling the purchase of lower priced electricity However this might require oversizing the electrolyzer to produce enough hydrogen at off-peak hours to meet demand increasing the capital costs associated with the unit Another method is inshytentionally oversizing the electrolyzer to enable operation at a higher efficiency thereby reducing operating expenses
102015 estimate from httpwwweiagovtoolsfaqsfaqcfmid=92ampt=4
30
To estimate the impact of these methods of operation and aslo gain insight into less expensive renewable electricity costs in the future the model was run with the cost of electricity zeroed-out to calculate the lowest possible cost of hydrogen with cheap electricity In this scenario the cost of hydrogen is $3264kg $1949kg and $1472kg (for the 100 200 and 300 kgday stations) These costs are only slightly higher (by 3-7) than the conventional delivered hydrogen cost due to the capital investment in the electrolyzer and the remaining electrolyzer maintenance and water costs
A station with on-site electrolysis can also be represented by the layout shown in Fig 11 Housing the components necessary for alkaline electrolysis of 100-300 kgday hydrogen might be challenging in a 20 ft ISO container and the layout might need to be increased (to a 30 or 40 ft ISO container) For PEM electrolysis however the components should fit in the 20 ft ISO container and potentially smaller containers for the 100 or 200 kgday stations Similar to the reforming layout the hydrogen components fit in a much more compact space than for the conventional station with delivered hydrogen (shown in Fig 9) and the lot size is reduced
34 Modular Station with Delivered Centrally Produced Hydrogen
Figure 13 shows the cost revenue and income model for a modular station with delivered centrally produced hydrogen and an uninstalled modular unit cost of $15M The installed capital costs and hydrogen costs at each of the three capacity stations are tabulated in Table 8 Recall from Section 25 that the capital costs for modular stations do not follow the same trend as for build-on-site stations because modular stations come in discrete sizes Table 8 shows the installed capital and hydrogen costs for two cases of uninstalled modular station costs of $15M and $1M The only difference in costs between this scenario and the conventional station with delivered centrally produced hydrogen (see Table 5 and Fig 8) are in the capital costs While the installed capital costs including site preparation station capital and installation were $15M and $17M for the 100 and 200 kgday conventional stations it is $186M for all three capacities of the modular
Table 8 Installed cost (which includes site preparation engishyneering amp design permitting capital and installation costs) and hydrogen cost for modular stations with delivered hydrogen for two cases of uninstalled modular cost $15M and $10M
capacity uninstalled installed H2 cost (kgday) modular cost ($) cost ($) ($kg)
100 $15M $186M $3390 200 $15M $186M $1916 300 $15M $186M $1425 100 $1M $136M $2912 200 $1M $136M $1677 300 $1M $136M $1265
31
site
pre
p
85
stationcapital 423
statio
n
install
17d
elive
red
H2
294
labor
58
maintenance107
electricity
17
-2000
-1500
-1000
-500
0
500
1000
1500
2000co
st o
r re
ven
ue (
k$
yr)
tax
site preparationstation capitalstation install
delivered H2labor
maintenanceelectricity
revenue ($3390kg)net income
100 kgday
site
prep
75
station
capital 374
station
install15
delive
red
H2
360
labor
52
maintenance94
electricity
30
-2000
-1500
-1000
-500
0
500
1000
1500
2000
cost
or
reve
nu
e (
k$
yr)
tax
site preparationstation capitalstation install
delivered H2labor
maintenanceelectricity
revenue ($1916kg)net income
200 kgday
site
prep
67
station
capital336
stationinstall 13
del
iver
ed H2
413
labor
46
maintenance85
electricity
40
2020 2025 2030 2035year
-2000
-1500
-1000
-500
0
500
1000
1500
2000
cost
or
reve
nu
e (
k$y
r)
tax
site preparationstation capitalstation install
delivered H2labor
maintenanceelectricity
revenue ($1425kg)net income
300 kgday
modular station delivered hydrogen
Figure 13 Cost and revenue associated with a modular station with centrally produced delivered hydrogen to break even at year 7 (2023) assuming a $15M uninstalled capital cost of the modular station The net income includes the effects from depreciation and taxes Capital replacement costs and intervals are not included in this model Pie charts on the right show the breakdown of cumulashytive capital and operating costs over the 7-year analysis period to the cost of dispensed hydrogen
32
stations This capital investment for a 300 kgday modular station (including site preparation station capital and installation) is coincidentally the same as for a 300 kgday conventional station
If an estimate of $1M (as compared to the conservative estimate of $15M) for the uninstalled capital cost of the modular fueling station unit is used (note that this is still within the range of costs vendors estimated as described in Section 25) the cost of hydrogen will be $2912 $1677 and $1265 for the 100 200 and 300 kgday capacities respectively These costs are all lower than the cost of hydrogen at the equivalent capacity conventional stations As this technology matures and the installed capital cost of the modular units continues to decrease below the installed capital cost of the conventional stations it will make economic sense to site modular stations rather than assembling components on-site Parts standardization and the increased quality control that can be achieved by having modular station components may also lead to reduced maintenance requirements but that potential benefit is not included in this analysis
Figure 14 shows that a modular unit requires a slightly smaller installation area than the conshyventional station components shown in Fig 9 However the tube trailers acting as the hydrogen source and on-site storage still require significant space Similar to the conventional station with delivered hydrogen delivery routes must also be considered when siting a modular station with deshylivered hydrogen The hydrogen components are shown as being housed in a 20 ft ISO container although some 300 kgday modular stations are smaller than this While a slightly overall reduced footprint (relative to as drawn in Fig 14) could be realized we show this layout on the same lot as before Removing the need to store two 40-foot tube trailers by adding on-site low pressure storage could also drastically reduce the footprint by reducing the need to have an open wall for delivery A discussion of how the separation distances can be impacted and the footprints might be reduced due to fire-rated walls is included at the end of the Section 35
33
140
0
168 0
50 0
30 0
dispenser island
tube trailer
modular station(20 ft ISO)
conveniencestore
Figure 14 Renderings of a modular station layout with delivered hydrogen
34
35 Modular Station with Hydrogen Produced On-site via Electrolysis
The final configuration considered in this analysis is a modular station with an electrolysis unit attached to produce hydrogen The economics of this station design are shown in Fig 15 The installed capital costs and hydrogen costs at each of the three capacity stations with two different uninstalled modular unit costs are tabulated in Table 9 Similar to the results in the previous section the cost of hydrogen at the low volume modular electrolysis stations with an assumed $15M uninstalled modular station cost are higher than at the conventional electrolysis station counterpart We find that the cost of hydrogen at these modular stations with electrolysis produced hydrogen will be $4303kg $2730kg and $2173kg (for the 100 200 and 300 kgday stations) These costs are once again $337kg higher $079kg higher and the same (respectively) as the costs at the conventional stations with electrolysis produced hydrogen discussed in Section 33 This cost difference between the analogous conventional station is once again solely due to the differing capital cost of the installed modular station If the capital cost of the modular unit is $1M the hydrogen costs reduce to $3825 $2491 or $2013kg (for the 100 200 and 300 kgday stations) which are all lower than the cost at the similarly sized conventional stations with on-site electrolysis due to the lower installed station cost
Having on-site production using an electrolyzer and modular fueling station components only requires a small footprint for installation as shown in Fig 16 The ISO containers can house apshypropriate fire-rated barrier walls reducing separation distance for Group 1 and 2 exposures (except for air intakes) by half and eliminating separation distances for Group 3 exposures as described in Section 732312 of NFPA 2 The Hydrogen Technologies Code (2016) [10] Group 1 exshyposures are lot lines air intakes (HVAC compressors other) operable openings in buildings and structures and ignition sources such as open flames and welding Group 2 exposures are exshyposed persons (other than those servicing the system) and parked cars Group 3 exposures include buildings flammable gas storage hazardous materials storage ordinary combustibles horizontal distance to overhead electrical wire and piping containing other hazardous material This means
Table 9 Installed cost (which includes site preparation engishyneering amp design permitting capital and installation costs) and hydrogen cost for modular stations with on-site electrolysis proshyduced hydrogen for two cases of uninstalled modular cost $15M and $10M
capacity uninstalled installed H2 cost (kgday) modular cost ($) cost ($) ($kg)
100 $15M $274M $4303 200 $15M $314M $2730 300 $15M $345M $2173 100 $1M $224M $3825 200 $1M $264M $2491 300 $1M $295M $2013
35
site prep67
stat
ion
capit
al
333
stationinstall 13
eleccapital 181
elec
install
13
elec
el
ectr
icity
163
wate
r0
2
labor
46
maintenance
168
stationelectricity
13
-3000
-2000
-1000
0
1000
2000
3000co
st o
r re
ven
ue (
k$
yr)
taxsite preparationstation capitalstation installelec capitalelec install
elec electricitywater
labormaintenance
station electricity
revenue ($4303kg)net income
100 kgday
site prep53
stat
ion
capi
tal
263
station
install
11
eleccapital 214
elec
install11
elec
elec
tric
ity
257
water
03
lab
or
36
maintenance
132
stationelectricity
21
-4000
-3000
-2000
-1000
0
1000
2000
3000
4000
cost
or
reve
nu
e (
k$
yr)
taxsite preparationstation capitalstation installelec capitalelec install
elec electricitywater
labormaintenance
station electricity
revenue ($2730kg)net income
200 kgday
site prep44
stat
ion
capi
tal
220
stati
on
inst
all
09
elec
capital 224
elecinstall 09
elec
elec
tric
ity32
3
water
04
labor
30 maintenance
111
stationelectricity
26
2020 2025 2030 2035year
-4000
-3000
-2000
-1000
0
1000
2000
3000
4000
cost
or
reve
nu
e (
k$y
r)
taxsite preparationstation capitalstation installelec capitalelec install
elec electricitywater
labormaintenance
station electricity
revenue ($2173kg)net income
300 kgday
modular station electrolysis on-site
Figure 15 Cost and revenue associated with a modular station with on-site electrolysis produced hydrogen to break even at year 7 (2023) assuming a $15M uninstalled capital cost of the modular station The net income includes the effects from depreciation and taxes Capital replacement costs and intervals are not included in this model Pie charts on the right show the breakdown of cumulashytive capital and operating costs over the 7-year analysis period to the cost of dispensed hydrogen
36
electrolyzer(20 ft ISO)
modular station(20 ft ISO)
convenience store
dispenser island
100
0
100 0
17 0
Figure 16 Renderings of a modular station layout with an elecshytrolyzer for on-site production with a small reduced footprint
37
for a typical pipe diameter of 028rdquo and up to 15000 psi pressure (within the operating range of the cascade storage at a refueling station) air intakes must remain 34 ft from the containers while lot lines other building openings or ignition sources only need 17 ft of separation Exposed persons and parked cars must be 8 ft or more away from the containers and other exposures (including other combustibles like gasoline) do not need any separation from the containers This will allow a compact layout an example of which is shown in Fig 16
38
4 Conclusions
Five station designs were considered in this analysis with three capacities of each station deshysign With the current technology the lowest cost hydrogen source assessed here11 is tube-trailers delivering centrally produced gaseous hydrogen Shown in Table 10 or graphically in Fig 17 for either a conventional or modular station with a 300 kgday capacity and delivered hydrogen gas (using our conservative $15M cost estimate for the modular unit) it would cost approximately $186M to prepare the site and build the station and at a dispensed hydrogen cost of $1425kg a station operator would break even on their capital investments and operational costs in 7 years If the capital cost of the modular station unit is only $1M which is still in the range of cost estimates by manufacturers a modular station with delivered hydrogen would cost $136M to build and for a 300 kgday capacity hydrogen would cost $1265kg Embedded in all of these analyses is the utilization profile shown in Fig 2 which is the reason that the hydrogen cost increases as the cashypacity (and utilization) decreases for the modular stations with delivered hydrogen although they have the same installed cost
The specified 7-year return on investment results in higher cost hydrogen for smaller stations than for larger ones due to less throughput and higher capital cost per kg of capacity (see the lower left frame of Fig 17) If the SDO charges customers a price lower than this cost the result will be a longer return on investment Setting the same price regardless of station capacity will result in the 100 kgday station having the longest return on investment and the 300 kgday having the shortest
The addition of a steam methane reformer or an electrolyzer to a hydrogen refueling station increases the capital cost significantly with the steam methane reformer estimated to have the
11The cost of liquid delivery was not included in this analysis
Table 10 Installed cost (which includes site preparation engishyneering amp design permitting component capital and installation costs) and resulting hydrogen cost to break even at year 7 for the stations analyzed in this work
station capacity rarr 100 kgday 200 kgday 300 kgday
station type darr installed cost ($)
H2 cost ($kg)
installed cost ($)
H2 cost ($kg)
installed cost ($)
H2 cost ($kg)
conventional delivered H2 conventional SMR H2 conventional electrolysis H2 modular ($15M) delivered H2 modular ($1M) delivered H2 modular ($15M) electrolysis H2 modular ($1M) electrolysis H2
$151M $274M $238M $186M $136M $274M $224M
$3053 $3847 $3966 $3390 $2912 $4303 $3825
$169M $383M $298M $186M $136M $314M $264M
$1837 $2596 $2651 $1916 $1677 $2730 $2491
$186M $443M $345M $186M $136M $345M $295M
$1426 $2023 $2174 $1425 $1265 $2173 $2013
39
$00M$05M$10M$15M$20M$25M$30M$35M$40M$45M
inst
all
ed
cost
($)
capacity (kgday)
100 200 300
conv
ention
al d
eliv
ered
gas
conv
ention
al S
MR
conv
ention
al e
lect
roly
sis
mod
ular
($1
5M
) d
eliv
ered
gas
mod
ular
($1
M) d
eliv
ered
gas
mod
ular
($1
5M
) e
lect
roly
sis
mod
ular
($1
M) e
lect
roly
sis
$0k
$5k
$10k
$15k
$20k
$25k
$30k
inst
all
ed
cost
($[
kg
day]
)
conv
ention
al d
eliv
ered
gas
conv
ention
al S
MR
conv
ention
al e
lect
roly
sis
mod
ular
($1
5M
) d
eliv
ered
gas
mod
ular
($1
M) d
eliv
ered
gas
mod
ular
($1
5M
) e
lect
roly
sis
mod
ular
($1
M) e
lect
roly
sis
$0$5
$10$15$20$25$30$35$40$45
H2 c
ost
($k
g)
capacity (kgday)
100 200 300
Figure 17 Installed cost (which includes site preparation engishyneering amp design permitting component capital and installation costs) are shown in the left frames The top frame is the total inshyvestment in 2016$ while the bottom left frame is the installed cost per mass of hydrogen dispensed (kgday) The hydrogen cost to break even at year 7 is shown in the right frame for the stations analyzed in this work
40
highest capital cost On-site production does allow for a more compact station footprint and does not require consideration for tube-trailer delivery routes With current technology and projected utility prices operating a steam methane reformer costs slightly less than operating an electrolyzer These offsetting differences in capital vs operational costs causes the price of hydrogen to be very similar for a station with SMR produced hydrogen and electrolysis produced hydrogen In both cases the cost of hydrogen is $6-$10kg more for the stations that produce hydrogen on-site than the stations that have hydrogen delivered This analysis does not include the startup and shutdown inefficiencies (and associated costs) for either the SMR or electrolyzer The penalty for cycling a SMR is likely greater than for cycling an electrolyzer potentially giving an electrolyzer an economic advantage for on-site production
Electrolyzers also have the potential to produce less carbon dioxide than SMRrsquos By definishytion SMRrsquos require methane which contains carbon to produce hydrogen releasing the carbon molecules as carbon dioxide and contributing to climate change A reduced carbon footprint could be achieved by using bio-gas or implementing carbon capture and storage (although this would incur an efficiency penalty) Electrolyzers on the other hand require only electricity and water giving this technology the potential to be completely carbon free given the right source of elecshytricity such as solar wind hydroelectric or nuclear The key to making on-site production more cost competitive with delivered hydrogen is reducing the utility costs For electrolysis this can be achieved through efficiency improvements (although around 50-70 efficiencies are achieved with current technology) through the purchase of low cost off-peak electricity or by using elecshytricity generated behind the meter Of course reducing capital cost and maintenance requirements of on-site production units will also improve the economics of this technology
According to our research current modular fueling stations where components are assembled and tested at a central production facility have installed costs no higher than conventional stations Using our high estimate of $15M for the modular unit the installed cost of the 300 kgday modular station is nearly the same as for a 300 kgday conventional station Using a lower cost estimate of $1M for the modular unit the installed cost of a 100 kgday conventional station is 11 higher than the modular station With greater industry experience and higher volume production we would anticipate the cost of modular stations to reduce in the near-future Developing stations in this manner may lead to better quality control and reduced maintenance requirements for hydrogen fueling stations It is also possible to achieve more compact station footprints by modularizing the station components by building in appropriate fire-rated barrier walls Because of these potential benefits we anticipate modularization and standardization to increase in the future
This report details the economics of current hydrogen refueling stations and includes some sketches of potential layouts We have visually depicted the contributions to capital and operational costs of hydrogen for different station concepts making it easy to find the largest contributors to a high cost of hydrogen to the consumer This information can be used to devote research and development towards these high contributors At the station the dispenser compressors and chillers are expensive pieces where additional development or higher volume production could reduce station costs For electrolysis the purchase of low-priced electricity could serve to make on-site production cost competitive with central production and delivery This report enables the comparison of different station concepts that could be implemented in various market scenarios
41
A Piping amp Instrumentation Diagram
The following pages show the piping and instrumentation diagram for the included reference stations For the conventional stations all components need to be assembled on-site The dashed boxes show the components that are often modularized for the modular stations For reference the utility requirements shown in the PampID are also included here in Table A1
Table A1 Utility requirement estimateslowast for the stations in this report
capacity 100 kgday 200 kgday 300 kgday
compressor power electrolyzer power electrolyzer water SMR power SMR water SMR gas
25 kW 260 kW 110 lhr 16 kW 400 lhr 34 Nm3hr
60 kW 510 kW 220 lhr 33 kW 800 lhr 68 Nm3hr
100 kW 770 kW 330 lhr 49 kW 1200 lhr 101 Nm3hr
lowast These are averages based on manufacturer specifications and literature and are meant to give an estimate of site requirements For exact specifishycations to meet station requirements consult a manufacturer directly
42
ABCDEFGHIJK1
2
3
4
5
6
7
Measured Variable Readout of function Output Function ModifierA Air AlarmB Burner Storage Users Choice Users ChoiceC Compressor ClosedD DispenserE Electrolyzer Sensor (primary Element)F Flow FilterG Chiller Glass viewingH Hand HighI Current IndicatorJ PowerK Time Control StationL Level Light LowM Conductivity MiddleN Users Choice Users Choice Hydrogen Users ChoiceO Water Orifice restriction Air OpenP PressureQ QuantityR Reformer Record ReduceS Speed Frequency SwitchT Temperature TransmitU Multivariate Multifunction Multifunction MultifunctionV Vibration ValveW Weight Well WaterX Unclassified Unclassified Unclassified UnclassifiedY State RelayZ Position Actuator
PROCESS AND SIGNAL LINES
HYDROGEN PROCESS LINE
DEIONIZED WATER PROCESS LINE
PNEUMATIC SIGNAL LINE
NITROGEN SIGNAL LINE
ELECTRICAL SIGNAL LINE
SV
VALVES
BALL VALVE
NEEDLE VALVE
CHECK VALVE
SOLENOID VALVE
AIR ACTUATED VALVE SPRING RETURN CLOSE
PRESSURE REDUCING VALVE
TWO WAY PRESSURE RELIEF
THREE WAY PRESSURE RELIEF
EQUIPMENT
FILTER
PUMP
DRYER
HYDROGEN COMPRESSOR
STORAGE TANK
IR FLAME DETECTOR
Line Service Identification codesCCA-CLEAN COMPRESSED AIRCHW-CHILLED WATERH-HYDROGENN-NITROGEN
Pipe Specification Details3000PSI Min pressure rating of 3000 PSI 316316L austenitic stainless steel tubing UNS S31600 (316) UNS S31603 (316L)6500PSI Min pressure rating of 6500 PSI 316316L austenitic stainless steel tubing UNS S31600 (316) UNS S31603 (316L)15000PSI Min pressure rating of 15000 PSI 316316L austenitic stainless steel tubing UNS S31600 (316) UNS S31603 (316L)POLY Polyamide (Nylon) pneumatic tubing light and heat stabilized0032CU 0032 wall copper alloy 122 seamless tubingSCH40 Schedule 40 iron pipe
Line symbolsXrdquo-XXX-XXXX-XXX-XXX
Line size nominal inches
Service
Line Number (if assigned)
Pipe Spec
Insulation (if applicable)
Insulation codesF1- Soda-lime silicate glass (FOAMGLAS) 1 wall thicknessF2- Buna N Foam 38 thick
ABCDEFGHIJK1
2
3
4
5
6
7
CNH-300
HV-202HV-203
HV-201PT-300PI-300 HV-300
HV-301
Motor460-V 3Oslash SEE NOTE 1
Heater120-V 1Oslash 500 W
PT-202PI-202
34-H-VENT
1-frac14rdquo-CHW-800-SCH40
1-frac14rdquo-CHW-800-SCH40-F2
CW-800
GW-800
HV-202
HV-300
FV-100
ZSO-100
ZSC-100
ZI-100
FSV-100
ZZO-100
FSV-30038-H-3000PSI
38-H-5000PSI
38-H-5000PSI
38-H-15000PSI
34-H-VENT
OF-802TO COMMON frac34rdquo VENT MAST LOCATED ON BACK OF GMP
10 ABOVE GRADE
REFERENCE STATION 100-300 KGDAY
FF-300
GW-801
PI-101 PT-101
H2 Storage PBNH-402MAWP-15000 PSIG
H2 Storage PBNH-403MAWP-15000 PSIG
H2 Storage PBNH-401MAWP-15000 PSIG
FV-401
ZSO-401 ZSC-401
ZZO-401
FV-402
ZSO-402 ZSC-402
ZZO-402
FV-403
ZSO-403 ZSC-403
ZZO-403
FV-400
ZSO-400 ZSC-400
ZZO-400 GN-900
CHILLER 75-kW
DN-900JSS-901(EPO)
To EPO circuit
700-BAR NOZZLE
350-BAR NOZZLE
38-H-15000PSI
H70-T40H70-Warm
H35-T0
3570MPa DISPENSERWUN-900
FVControls Internal120V 1p 15A
GN-901
HEAT EXCHANGER1350 lbs
HV-901
H70-Cold
H2 Delivery Trailer multiple tubes one outlet
COH-100Air Compressor
PBAL-100
HV-100
AF-100
Air DryerAF-101
HV-900
PT-403PI-403
HV-403
PT-402PI-402
HV-402
PT-401PI-401
HV-401
HV-411
HV-412
HV-413
ZI-401
ZI-402
ZI-403
FV-101
ZSO-101 ZSC-101 ZI-101
ZZO-101
ZVO-100
ZVO-101
ZVO-900
ZVO-401
ZVO-400
ZVO-402
ZVO-403
RAH-100IR FLAME DETECTOR
AIMED AT HYDROGEN SOURCEAND ZONE 400
HIGH PRESSURE STORAGE
TO FIRE PANEL
RAH-900
IR FLAME DETECTORAIMED AT DISP HOSES
TO FIRE PANEL
HV-101
38-H-15000PSI
ZI-400
HV-400
FSV-200
EN-100ELECTROLYZER SKID
20 BAR (300 PSI) OUTPUT
RN-100STEAM METHANE REFORMER (SMR)
SKID13 BAR (200 PSI) OUTPUT
ZVO-102
Power460-V 3OslashSEE NOTE 1
Power460-V 3OslashSEE NOTE 1
ONLY ONE HYDROGEN SUPPLY OPTION IS USED PER STATION 1 TUBE TRAILER DELIVERY2 ON-SITE ELECTROLYSIS3 ON-SITE STEAM METHANE REFORMER
MUNICIPAL WATER SUPPLY
SEE NOTE 1
NATURAL GAS BIOGAS METHANE SUPPLY
SEE NOTE 1
NOTE 1 UTILITY REQUIREMENTS DEPEND ON STATION CAPACITY AND CAN BE ESTIMATED BASED ON THE FOLLOWING TABLESTATION CAPACITY 100 KGDAY 200 KGDAY 300 KGDAYELECTROLYZER POWER 260 KW 510 KW 770 KWELECTROLYZER WATER 110 LHR 220 LHR 330 LHRSMR POWER 16 KW 33 KW 49 KWSMR WATER 400 LHR 800 LHR 1200 LHRSMR GAS 34 NM3HR 68 NM3HR 101 NM3HRCOMPRESSOR POWER 25 KW 60 KW 100 KW
NOTE 2 ON-SITE PRODUCTION UNITS MAY INCORPORATE THEIR OWN INSTRUMENT AIR SYSTEM AND INTERCONNECTION WITH CSD SKIDCONTAINER MAY NOT BE NECESSARYNOTE 3 APPLIES TO MODULAR STATION ONLY A BUILD-ON-SITE STATION WILL NOT HAVE A SKID-OR CONTAINER-MOUNTED PRE-ASSEMBLED SYSTEMNOTE 4 IN SOME MODULAR STATIONS THE DISPENSER WILL BE A SEPARATELY-INSTALLED COMPONENTNOTE 5 IN MANY MODULAR STATIONS THE HEAT EXCHANGE EQUIPMENT WILL BE ROOF-MOUNTED
NOTE 2
COMPRESSION STORAGE AND DISPENSER (CSD) SKID OR CONTAINER BOUNDARY SEE NOTE 3
NOTE 4
NOTE 5
NOTE 5
PLCGas Control Cabinet
COMPRESSORMULTIPLE STAGES
References
[1] US Energy Information Administration EIA Open Data - Intro - US Energy Information Administration (EIA) accessed July 2016 httpwwweiagovopendata
[2] US DOE DOE H2A Production Analysis accessed May 2016 httpswwwhydrogen energygovh2a_productionhtml
[3] Joseph Pratt Danny Terlip Chris Ainscough Jennifer Kurtz and Amgad Elgowainy H2FIRST reference station design task Technical Report SAND2015-2660 R Sandia National Laboratories April 2015 Available at httpenergygoveerefuelcells h2first
[4] US DOE DOE H2A Delivery Analysis accessed May 2016 httpswwwhydrogen energygovh2a_deliveryhtml
[5] 2016 Annual Evaluation of Hydrogen Fuel Cell Electric Vehicle Deployment and Hydrogen Fuel Station Network Development Technical report California Environmental Protection Agency Air Resources Board July 2016 Available at httpswwwarbcagovmsprog zevproghydrogenhydrogenhtm
[6] E Sutherland and F Joseck Low volume production and delivery cost Technical Report 15011 Department of Energy Hydrogen and Fuel Cells Program Record 2015
[7] Ricardo Guerrero Lemus and Jose Manuel Martinez Duart Updated hydrogen production costs and parities for conventional and renewable technologies International Journal of Hydrogen Energy 35(9)3929ndash3936 2010
[8] Alfredo Ursua Luis M Gandia and Pablo Sanchis Hydrogen production from water elecshytrolysis current status and future trends Proceedings of the IEEE 100(2)410ndash426 2012
[9] G Parks R Boyd J Cornish and R Remick Hydrogen station compression storage and dispensing technical status and costs Systems integration Technical Report NRELBKshy6A10-58564 National Renewable Energy Laboratory (NREL) Golden CO May 2014
[10] NFPA 2 Hydrogen Technologies Code Technical report National Fire Protection Associashytion 2016
45
- Executive Summary
- Acknowledgment
- Contents
- Figures
- Tables
- 1 Introduction
-
- 11 Background and Contents
- 12 Approach
- 13 Method Overview
-
- 2 Station Cost Components
-
- 21 Centrally Produced Hydrogen and Delivery
- 22 Hydrogen Produced On-Site via Steam Methane Reforming
- 23 Hydrogen Produced On-Site via Electrolysis
- 24 Compression Storage and Ancillary Equipment for a Conventional Station
- 25 Packaged Compression Storage and Ancillary Equpiment for a Modular Station
- 26 Hydrogen Dispensers
-
- 3 Results Station Designs and Costs
-
- 31 Conventional Station with Delivered Centrally Produced Hydrogen
- 32 Conventional Station with Hydrogen Produced On-Site via Steam Methane Reforming
- 33 Conventional Station with Hydrogen Produced On-Site via Electrolysis
- 34 Modular Station with Delivered Centrally Produced Hydrogen
- 35 Modular Station with Hydrogen Produced On-Site via Electrolysis
-
- 4 Conclusions
- Appendix A Piping and Instrumentation Diagram
- References
-
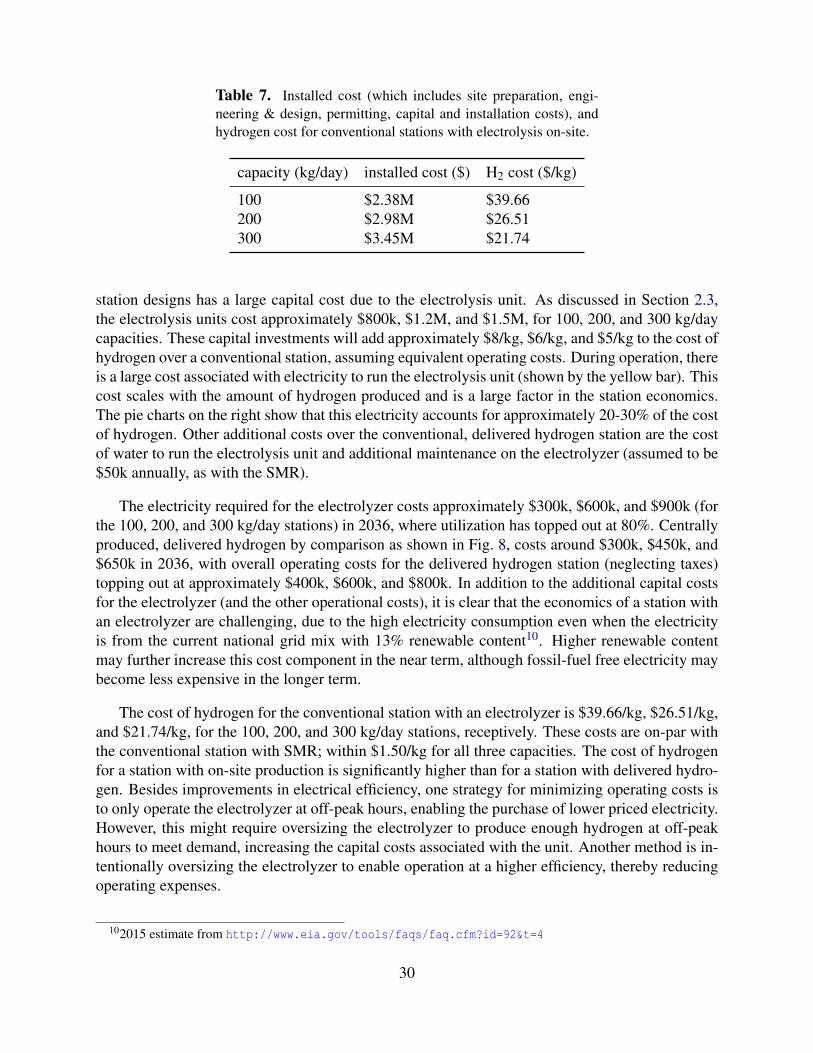

site
pre
p
85
stationcapital 423
statio
n
install
17d
elive
red
H2
294
labor
58
maintenance107
electricity
17
-2000
-1500
-1000
-500
0
500
1000
1500
2000co
st o
r re
ven
ue (
k$
yr)
tax
site preparationstation capitalstation install
delivered H2labor
maintenanceelectricity
revenue ($3390kg)net income
100 kgday
site
prep
75
station
capital 374
station
install15
delive
red
H2
360
labor
52
maintenance94
electricity
30
-2000
-1500
-1000
-500
0
500
1000
1500
2000
cost
or
reve
nu
e (
k$
yr)
tax
site preparationstation capitalstation install
delivered H2labor
maintenanceelectricity
revenue ($1916kg)net income
200 kgday
site
prep
67
station
capital336
stationinstall 13
del
iver
ed H2
413
labor
46
maintenance85
electricity
40
2020 2025 2030 2035year
-2000
-1500
-1000
-500
0
500
1000
1500
2000
cost
or
reve
nu
e (
k$y
r)
tax
site preparationstation capitalstation install
delivered H2labor
maintenanceelectricity
revenue ($1425kg)net income
300 kgday
modular station delivered hydrogen
Figure 13 Cost and revenue associated with a modular station with centrally produced delivered hydrogen to break even at year 7 (2023) assuming a $15M uninstalled capital cost of the modular station The net income includes the effects from depreciation and taxes Capital replacement costs and intervals are not included in this model Pie charts on the right show the breakdown of cumulashytive capital and operating costs over the 7-year analysis period to the cost of dispensed hydrogen
32
stations This capital investment for a 300 kgday modular station (including site preparation station capital and installation) is coincidentally the same as for a 300 kgday conventional station
If an estimate of $1M (as compared to the conservative estimate of $15M) for the uninstalled capital cost of the modular fueling station unit is used (note that this is still within the range of costs vendors estimated as described in Section 25) the cost of hydrogen will be $2912 $1677 and $1265 for the 100 200 and 300 kgday capacities respectively These costs are all lower than the cost of hydrogen at the equivalent capacity conventional stations As this technology matures and the installed capital cost of the modular units continues to decrease below the installed capital cost of the conventional stations it will make economic sense to site modular stations rather than assembling components on-site Parts standardization and the increased quality control that can be achieved by having modular station components may also lead to reduced maintenance requirements but that potential benefit is not included in this analysis
Figure 14 shows that a modular unit requires a slightly smaller installation area than the conshyventional station components shown in Fig 9 However the tube trailers acting as the hydrogen source and on-site storage still require significant space Similar to the conventional station with delivered hydrogen delivery routes must also be considered when siting a modular station with deshylivered hydrogen The hydrogen components are shown as being housed in a 20 ft ISO container although some 300 kgday modular stations are smaller than this While a slightly overall reduced footprint (relative to as drawn in Fig 14) could be realized we show this layout on the same lot as before Removing the need to store two 40-foot tube trailers by adding on-site low pressure storage could also drastically reduce the footprint by reducing the need to have an open wall for delivery A discussion of how the separation distances can be impacted and the footprints might be reduced due to fire-rated walls is included at the end of the Section 35
33
140
0
168 0
50 0
30 0
dispenser island
tube trailer
modular station(20 ft ISO)
conveniencestore
Figure 14 Renderings of a modular station layout with delivered hydrogen
34
35 Modular Station with Hydrogen Produced On-site via Electrolysis
The final configuration considered in this analysis is a modular station with an electrolysis unit attached to produce hydrogen The economics of this station design are shown in Fig 15 The installed capital costs and hydrogen costs at each of the three capacity stations with two different uninstalled modular unit costs are tabulated in Table 9 Similar to the results in the previous section the cost of hydrogen at the low volume modular electrolysis stations with an assumed $15M uninstalled modular station cost are higher than at the conventional electrolysis station counterpart We find that the cost of hydrogen at these modular stations with electrolysis produced hydrogen will be $4303kg $2730kg and $2173kg (for the 100 200 and 300 kgday stations) These costs are once again $337kg higher $079kg higher and the same (respectively) as the costs at the conventional stations with electrolysis produced hydrogen discussed in Section 33 This cost difference between the analogous conventional station is once again solely due to the differing capital cost of the installed modular station If the capital cost of the modular unit is $1M the hydrogen costs reduce to $3825 $2491 or $2013kg (for the 100 200 and 300 kgday stations) which are all lower than the cost at the similarly sized conventional stations with on-site electrolysis due to the lower installed station cost
Having on-site production using an electrolyzer and modular fueling station components only requires a small footprint for installation as shown in Fig 16 The ISO containers can house apshypropriate fire-rated barrier walls reducing separation distance for Group 1 and 2 exposures (except for air intakes) by half and eliminating separation distances for Group 3 exposures as described in Section 732312 of NFPA 2 The Hydrogen Technologies Code (2016) [10] Group 1 exshyposures are lot lines air intakes (HVAC compressors other) operable openings in buildings and structures and ignition sources such as open flames and welding Group 2 exposures are exshyposed persons (other than those servicing the system) and parked cars Group 3 exposures include buildings flammable gas storage hazardous materials storage ordinary combustibles horizontal distance to overhead electrical wire and piping containing other hazardous material This means
Table 9 Installed cost (which includes site preparation engishyneering amp design permitting capital and installation costs) and hydrogen cost for modular stations with on-site electrolysis proshyduced hydrogen for two cases of uninstalled modular cost $15M and $10M
capacity uninstalled installed H2 cost (kgday) modular cost ($) cost ($) ($kg)
100 $15M $274M $4303 200 $15M $314M $2730 300 $15M $345M $2173 100 $1M $224M $3825 200 $1M $264M $2491 300 $1M $295M $2013
35
site prep67
stat
ion
capit
al
333
stationinstall 13
eleccapital 181
elec
install
13
elec
el
ectr
icity
163
wate
r0
2
labor
46
maintenance
168
stationelectricity
13
-3000
-2000
-1000
0
1000
2000
3000co
st o
r re
ven
ue (
k$
yr)
taxsite preparationstation capitalstation installelec capitalelec install
elec electricitywater
labormaintenance
station electricity
revenue ($4303kg)net income
100 kgday
site prep53
stat
ion
capi
tal
263
station
install
11
eleccapital 214
elec
install11
elec
elec
tric
ity
257
water
03
lab
or
36
maintenance
132
stationelectricity
21
-4000
-3000
-2000
-1000
0
1000
2000
3000
4000
cost
or
reve
nu
e (
k$
yr)
taxsite preparationstation capitalstation installelec capitalelec install
elec electricitywater
labormaintenance
station electricity
revenue ($2730kg)net income
200 kgday
site prep44
stat
ion
capi
tal
220
stati
on
inst
all
09
elec
capital 224
elecinstall 09
elec
elec
tric
ity32
3
water
04
labor
30 maintenance
111
stationelectricity
26
2020 2025 2030 2035year
-4000
-3000
-2000
-1000
0
1000
2000
3000
4000
cost
or
reve
nu
e (
k$y
r)
taxsite preparationstation capitalstation installelec capitalelec install
elec electricitywater
labormaintenance
station electricity
revenue ($2173kg)net income
300 kgday
modular station electrolysis on-site
Figure 15 Cost and revenue associated with a modular station with on-site electrolysis produced hydrogen to break even at year 7 (2023) assuming a $15M uninstalled capital cost of the modular station The net income includes the effects from depreciation and taxes Capital replacement costs and intervals are not included in this model Pie charts on the right show the breakdown of cumulashytive capital and operating costs over the 7-year analysis period to the cost of dispensed hydrogen
36
electrolyzer(20 ft ISO)
modular station(20 ft ISO)
convenience store
dispenser island
100
0
100 0
17 0
Figure 16 Renderings of a modular station layout with an elecshytrolyzer for on-site production with a small reduced footprint
37
for a typical pipe diameter of 028rdquo and up to 15000 psi pressure (within the operating range of the cascade storage at a refueling station) air intakes must remain 34 ft from the containers while lot lines other building openings or ignition sources only need 17 ft of separation Exposed persons and parked cars must be 8 ft or more away from the containers and other exposures (including other combustibles like gasoline) do not need any separation from the containers This will allow a compact layout an example of which is shown in Fig 16
38
4 Conclusions
Five station designs were considered in this analysis with three capacities of each station deshysign With the current technology the lowest cost hydrogen source assessed here11 is tube-trailers delivering centrally produced gaseous hydrogen Shown in Table 10 or graphically in Fig 17 for either a conventional or modular station with a 300 kgday capacity and delivered hydrogen gas (using our conservative $15M cost estimate for the modular unit) it would cost approximately $186M to prepare the site and build the station and at a dispensed hydrogen cost of $1425kg a station operator would break even on their capital investments and operational costs in 7 years If the capital cost of the modular station unit is only $1M which is still in the range of cost estimates by manufacturers a modular station with delivered hydrogen would cost $136M to build and for a 300 kgday capacity hydrogen would cost $1265kg Embedded in all of these analyses is the utilization profile shown in Fig 2 which is the reason that the hydrogen cost increases as the cashypacity (and utilization) decreases for the modular stations with delivered hydrogen although they have the same installed cost
The specified 7-year return on investment results in higher cost hydrogen for smaller stations than for larger ones due to less throughput and higher capital cost per kg of capacity (see the lower left frame of Fig 17) If the SDO charges customers a price lower than this cost the result will be a longer return on investment Setting the same price regardless of station capacity will result in the 100 kgday station having the longest return on investment and the 300 kgday having the shortest
The addition of a steam methane reformer or an electrolyzer to a hydrogen refueling station increases the capital cost significantly with the steam methane reformer estimated to have the
11The cost of liquid delivery was not included in this analysis
Table 10 Installed cost (which includes site preparation engishyneering amp design permitting component capital and installation costs) and resulting hydrogen cost to break even at year 7 for the stations analyzed in this work
station capacity rarr 100 kgday 200 kgday 300 kgday
station type darr installed cost ($)
H2 cost ($kg)
installed cost ($)
H2 cost ($kg)
installed cost ($)
H2 cost ($kg)
conventional delivered H2 conventional SMR H2 conventional electrolysis H2 modular ($15M) delivered H2 modular ($1M) delivered H2 modular ($15M) electrolysis H2 modular ($1M) electrolysis H2
$151M $274M $238M $186M $136M $274M $224M
$3053 $3847 $3966 $3390 $2912 $4303 $3825
$169M $383M $298M $186M $136M $314M $264M
$1837 $2596 $2651 $1916 $1677 $2730 $2491
$186M $443M $345M $186M $136M $345M $295M
$1426 $2023 $2174 $1425 $1265 $2173 $2013
39
$00M$05M$10M$15M$20M$25M$30M$35M$40M$45M
inst
all
ed
cost
($)
capacity (kgday)
100 200 300
conv
ention
al d
eliv
ered
gas
conv
ention
al S
MR
conv
ention
al e
lect
roly
sis
mod
ular
($1
5M
) d
eliv
ered
gas
mod
ular
($1
M) d
eliv
ered
gas
mod
ular
($1
5M
) e
lect
roly
sis
mod
ular
($1
M) e
lect
roly
sis
$0k
$5k
$10k
$15k
$20k
$25k
$30k
inst
all
ed
cost
($[
kg
day]
)
conv
ention
al d
eliv
ered
gas
conv
ention
al S
MR
conv
ention
al e
lect
roly
sis
mod
ular
($1
5M
) d
eliv
ered
gas
mod
ular
($1
M) d
eliv
ered
gas
mod
ular
($1
5M
) e
lect
roly
sis
mod
ular
($1
M) e
lect
roly
sis
$0$5
$10$15$20$25$30$35$40$45
H2 c
ost
($k
g)
capacity (kgday)
100 200 300
Figure 17 Installed cost (which includes site preparation engishyneering amp design permitting component capital and installation costs) are shown in the left frames The top frame is the total inshyvestment in 2016$ while the bottom left frame is the installed cost per mass of hydrogen dispensed (kgday) The hydrogen cost to break even at year 7 is shown in the right frame for the stations analyzed in this work
40
highest capital cost On-site production does allow for a more compact station footprint and does not require consideration for tube-trailer delivery routes With current technology and projected utility prices operating a steam methane reformer costs slightly less than operating an electrolyzer These offsetting differences in capital vs operational costs causes the price of hydrogen to be very similar for a station with SMR produced hydrogen and electrolysis produced hydrogen In both cases the cost of hydrogen is $6-$10kg more for the stations that produce hydrogen on-site than the stations that have hydrogen delivered This analysis does not include the startup and shutdown inefficiencies (and associated costs) for either the SMR or electrolyzer The penalty for cycling a SMR is likely greater than for cycling an electrolyzer potentially giving an electrolyzer an economic advantage for on-site production
Electrolyzers also have the potential to produce less carbon dioxide than SMRrsquos By definishytion SMRrsquos require methane which contains carbon to produce hydrogen releasing the carbon molecules as carbon dioxide and contributing to climate change A reduced carbon footprint could be achieved by using bio-gas or implementing carbon capture and storage (although this would incur an efficiency penalty) Electrolyzers on the other hand require only electricity and water giving this technology the potential to be completely carbon free given the right source of elecshytricity such as solar wind hydroelectric or nuclear The key to making on-site production more cost competitive with delivered hydrogen is reducing the utility costs For electrolysis this can be achieved through efficiency improvements (although around 50-70 efficiencies are achieved with current technology) through the purchase of low cost off-peak electricity or by using elecshytricity generated behind the meter Of course reducing capital cost and maintenance requirements of on-site production units will also improve the economics of this technology
According to our research current modular fueling stations where components are assembled and tested at a central production facility have installed costs no higher than conventional stations Using our high estimate of $15M for the modular unit the installed cost of the 300 kgday modular station is nearly the same as for a 300 kgday conventional station Using a lower cost estimate of $1M for the modular unit the installed cost of a 100 kgday conventional station is 11 higher than the modular station With greater industry experience and higher volume production we would anticipate the cost of modular stations to reduce in the near-future Developing stations in this manner may lead to better quality control and reduced maintenance requirements for hydrogen fueling stations It is also possible to achieve more compact station footprints by modularizing the station components by building in appropriate fire-rated barrier walls Because of these potential benefits we anticipate modularization and standardization to increase in the future
This report details the economics of current hydrogen refueling stations and includes some sketches of potential layouts We have visually depicted the contributions to capital and operational costs of hydrogen for different station concepts making it easy to find the largest contributors to a high cost of hydrogen to the consumer This information can be used to devote research and development towards these high contributors At the station the dispenser compressors and chillers are expensive pieces where additional development or higher volume production could reduce station costs For electrolysis the purchase of low-priced electricity could serve to make on-site production cost competitive with central production and delivery This report enables the comparison of different station concepts that could be implemented in various market scenarios
41
A Piping amp Instrumentation Diagram
The following pages show the piping and instrumentation diagram for the included reference stations For the conventional stations all components need to be assembled on-site The dashed boxes show the components that are often modularized for the modular stations For reference the utility requirements shown in the PampID are also included here in Table A1
Table A1 Utility requirement estimateslowast for the stations in this report
capacity 100 kgday 200 kgday 300 kgday
compressor power electrolyzer power electrolyzer water SMR power SMR water SMR gas
25 kW 260 kW 110 lhr 16 kW 400 lhr 34 Nm3hr
60 kW 510 kW 220 lhr 33 kW 800 lhr 68 Nm3hr
100 kW 770 kW 330 lhr 49 kW 1200 lhr 101 Nm3hr
lowast These are averages based on manufacturer specifications and literature and are meant to give an estimate of site requirements For exact specifishycations to meet station requirements consult a manufacturer directly
42
ABCDEFGHIJK1
2
3
4
5
6
7
Measured Variable Readout of function Output Function ModifierA Air AlarmB Burner Storage Users Choice Users ChoiceC Compressor ClosedD DispenserE Electrolyzer Sensor (primary Element)F Flow FilterG Chiller Glass viewingH Hand HighI Current IndicatorJ PowerK Time Control StationL Level Light LowM Conductivity MiddleN Users Choice Users Choice Hydrogen Users ChoiceO Water Orifice restriction Air OpenP PressureQ QuantityR Reformer Record ReduceS Speed Frequency SwitchT Temperature TransmitU Multivariate Multifunction Multifunction MultifunctionV Vibration ValveW Weight Well WaterX Unclassified Unclassified Unclassified UnclassifiedY State RelayZ Position Actuator
PROCESS AND SIGNAL LINES
HYDROGEN PROCESS LINE
DEIONIZED WATER PROCESS LINE
PNEUMATIC SIGNAL LINE
NITROGEN SIGNAL LINE
ELECTRICAL SIGNAL LINE
SV
VALVES
BALL VALVE
NEEDLE VALVE
CHECK VALVE
SOLENOID VALVE
AIR ACTUATED VALVE SPRING RETURN CLOSE
PRESSURE REDUCING VALVE
TWO WAY PRESSURE RELIEF
THREE WAY PRESSURE RELIEF
EQUIPMENT
FILTER
PUMP
DRYER
HYDROGEN COMPRESSOR
STORAGE TANK
IR FLAME DETECTOR
Line Service Identification codesCCA-CLEAN COMPRESSED AIRCHW-CHILLED WATERH-HYDROGENN-NITROGEN
Pipe Specification Details3000PSI Min pressure rating of 3000 PSI 316316L austenitic stainless steel tubing UNS S31600 (316) UNS S31603 (316L)6500PSI Min pressure rating of 6500 PSI 316316L austenitic stainless steel tubing UNS S31600 (316) UNS S31603 (316L)15000PSI Min pressure rating of 15000 PSI 316316L austenitic stainless steel tubing UNS S31600 (316) UNS S31603 (316L)POLY Polyamide (Nylon) pneumatic tubing light and heat stabilized0032CU 0032 wall copper alloy 122 seamless tubingSCH40 Schedule 40 iron pipe
Line symbolsXrdquo-XXX-XXXX-XXX-XXX
Line size nominal inches
Service
Line Number (if assigned)
Pipe Spec
Insulation (if applicable)
Insulation codesF1- Soda-lime silicate glass (FOAMGLAS) 1 wall thicknessF2- Buna N Foam 38 thick
ABCDEFGHIJK1
2
3
4
5
6
7
CNH-300
HV-202HV-203
HV-201PT-300PI-300 HV-300
HV-301
Motor460-V 3Oslash SEE NOTE 1
Heater120-V 1Oslash 500 W
PT-202PI-202
34-H-VENT
1-frac14rdquo-CHW-800-SCH40
1-frac14rdquo-CHW-800-SCH40-F2
CW-800
GW-800
HV-202
HV-300
FV-100
ZSO-100
ZSC-100
ZI-100
FSV-100
ZZO-100
FSV-30038-H-3000PSI
38-H-5000PSI
38-H-5000PSI
38-H-15000PSI
34-H-VENT
OF-802TO COMMON frac34rdquo VENT MAST LOCATED ON BACK OF GMP
10 ABOVE GRADE
REFERENCE STATION 100-300 KGDAY
FF-300
GW-801
PI-101 PT-101
H2 Storage PBNH-402MAWP-15000 PSIG
H2 Storage PBNH-403MAWP-15000 PSIG
H2 Storage PBNH-401MAWP-15000 PSIG
FV-401
ZSO-401 ZSC-401
ZZO-401
FV-402
ZSO-402 ZSC-402
ZZO-402
FV-403
ZSO-403 ZSC-403
ZZO-403
FV-400
ZSO-400 ZSC-400
ZZO-400 GN-900
CHILLER 75-kW
DN-900JSS-901(EPO)
To EPO circuit
700-BAR NOZZLE
350-BAR NOZZLE
38-H-15000PSI
H70-T40H70-Warm
H35-T0
3570MPa DISPENSERWUN-900
FVControls Internal120V 1p 15A
GN-901
HEAT EXCHANGER1350 lbs
HV-901
H70-Cold
H2 Delivery Trailer multiple tubes one outlet
COH-100Air Compressor
PBAL-100
HV-100
AF-100
Air DryerAF-101
HV-900
PT-403PI-403
HV-403
PT-402PI-402
HV-402
PT-401PI-401
HV-401
HV-411
HV-412
HV-413
ZI-401
ZI-402
ZI-403
FV-101
ZSO-101 ZSC-101 ZI-101
ZZO-101
ZVO-100
ZVO-101
ZVO-900
ZVO-401
ZVO-400
ZVO-402
ZVO-403
RAH-100IR FLAME DETECTOR
AIMED AT HYDROGEN SOURCEAND ZONE 400
HIGH PRESSURE STORAGE
TO FIRE PANEL
RAH-900
IR FLAME DETECTORAIMED AT DISP HOSES
TO FIRE PANEL
HV-101
38-H-15000PSI
ZI-400
HV-400
FSV-200
EN-100ELECTROLYZER SKID
20 BAR (300 PSI) OUTPUT
RN-100STEAM METHANE REFORMER (SMR)
SKID13 BAR (200 PSI) OUTPUT
ZVO-102
Power460-V 3OslashSEE NOTE 1
Power460-V 3OslashSEE NOTE 1
ONLY ONE HYDROGEN SUPPLY OPTION IS USED PER STATION 1 TUBE TRAILER DELIVERY2 ON-SITE ELECTROLYSIS3 ON-SITE STEAM METHANE REFORMER
MUNICIPAL WATER SUPPLY
SEE NOTE 1
NATURAL GAS BIOGAS METHANE SUPPLY
SEE NOTE 1
NOTE 1 UTILITY REQUIREMENTS DEPEND ON STATION CAPACITY AND CAN BE ESTIMATED BASED ON THE FOLLOWING TABLESTATION CAPACITY 100 KGDAY 200 KGDAY 300 KGDAYELECTROLYZER POWER 260 KW 510 KW 770 KWELECTROLYZER WATER 110 LHR 220 LHR 330 LHRSMR POWER 16 KW 33 KW 49 KWSMR WATER 400 LHR 800 LHR 1200 LHRSMR GAS 34 NM3HR 68 NM3HR 101 NM3HRCOMPRESSOR POWER 25 KW 60 KW 100 KW
NOTE 2 ON-SITE PRODUCTION UNITS MAY INCORPORATE THEIR OWN INSTRUMENT AIR SYSTEM AND INTERCONNECTION WITH CSD SKIDCONTAINER MAY NOT BE NECESSARYNOTE 3 APPLIES TO MODULAR STATION ONLY A BUILD-ON-SITE STATION WILL NOT HAVE A SKID-OR CONTAINER-MOUNTED PRE-ASSEMBLED SYSTEMNOTE 4 IN SOME MODULAR STATIONS THE DISPENSER WILL BE A SEPARATELY-INSTALLED COMPONENTNOTE 5 IN MANY MODULAR STATIONS THE HEAT EXCHANGE EQUIPMENT WILL BE ROOF-MOUNTED
NOTE 2
COMPRESSION STORAGE AND DISPENSER (CSD) SKID OR CONTAINER BOUNDARY SEE NOTE 3
NOTE 4
NOTE 5
NOTE 5
PLCGas Control Cabinet
COMPRESSORMULTIPLE STAGES
References
[1] US Energy Information Administration EIA Open Data - Intro - US Energy Information Administration (EIA) accessed July 2016 httpwwweiagovopendata
[2] US DOE DOE H2A Production Analysis accessed May 2016 httpswwwhydrogen energygovh2a_productionhtml
[3] Joseph Pratt Danny Terlip Chris Ainscough Jennifer Kurtz and Amgad Elgowainy H2FIRST reference station design task Technical Report SAND2015-2660 R Sandia National Laboratories April 2015 Available at httpenergygoveerefuelcells h2first
[4] US DOE DOE H2A Delivery Analysis accessed May 2016 httpswwwhydrogen energygovh2a_deliveryhtml
[5] 2016 Annual Evaluation of Hydrogen Fuel Cell Electric Vehicle Deployment and Hydrogen Fuel Station Network Development Technical report California Environmental Protection Agency Air Resources Board July 2016 Available at httpswwwarbcagovmsprog zevproghydrogenhydrogenhtm
[6] E Sutherland and F Joseck Low volume production and delivery cost Technical Report 15011 Department of Energy Hydrogen and Fuel Cells Program Record 2015
[7] Ricardo Guerrero Lemus and Jose Manuel Martinez Duart Updated hydrogen production costs and parities for conventional and renewable technologies International Journal of Hydrogen Energy 35(9)3929ndash3936 2010
[8] Alfredo Ursua Luis M Gandia and Pablo Sanchis Hydrogen production from water elecshytrolysis current status and future trends Proceedings of the IEEE 100(2)410ndash426 2012
[9] G Parks R Boyd J Cornish and R Remick Hydrogen station compression storage and dispensing technical status and costs Systems integration Technical Report NRELBKshy6A10-58564 National Renewable Energy Laboratory (NREL) Golden CO May 2014
[10] NFPA 2 Hydrogen Technologies Code Technical report National Fire Protection Associashytion 2016
45
- Executive Summary
- Acknowledgment
- Contents
- Figures
- Tables
- 1 Introduction
-
- 11 Background and Contents
- 12 Approach
- 13 Method Overview
-
- 2 Station Cost Components
-
- 21 Centrally Produced Hydrogen and Delivery
- 22 Hydrogen Produced On-Site via Steam Methane Reforming
- 23 Hydrogen Produced On-Site via Electrolysis
- 24 Compression Storage and Ancillary Equipment for a Conventional Station
- 25 Packaged Compression Storage and Ancillary Equpiment for a Modular Station
- 26 Hydrogen Dispensers
-
- 3 Results Station Designs and Costs
-
- 31 Conventional Station with Delivered Centrally Produced Hydrogen
- 32 Conventional Station with Hydrogen Produced On-Site via Steam Methane Reforming
- 33 Conventional Station with Hydrogen Produced On-Site via Electrolysis
- 34 Modular Station with Delivered Centrally Produced Hydrogen
- 35 Modular Station with Hydrogen Produced On-Site via Electrolysis
-
- 4 Conclusions
- Appendix A Piping and Instrumentation Diagram
- References
-
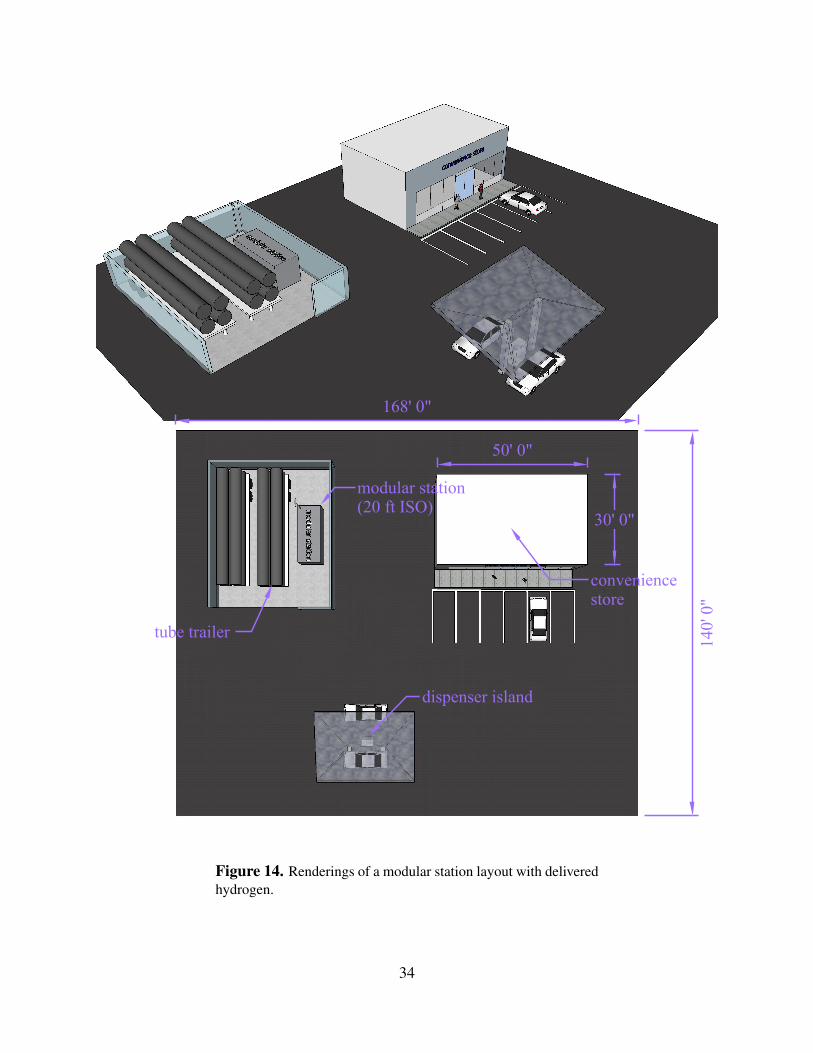
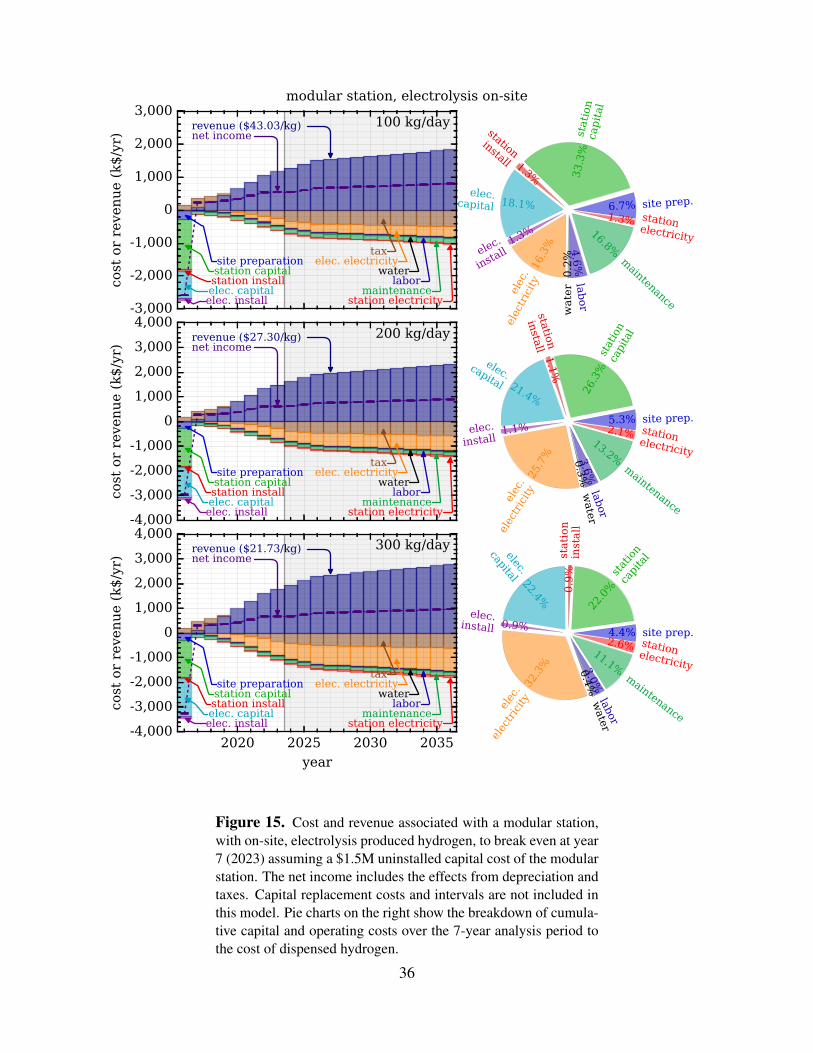
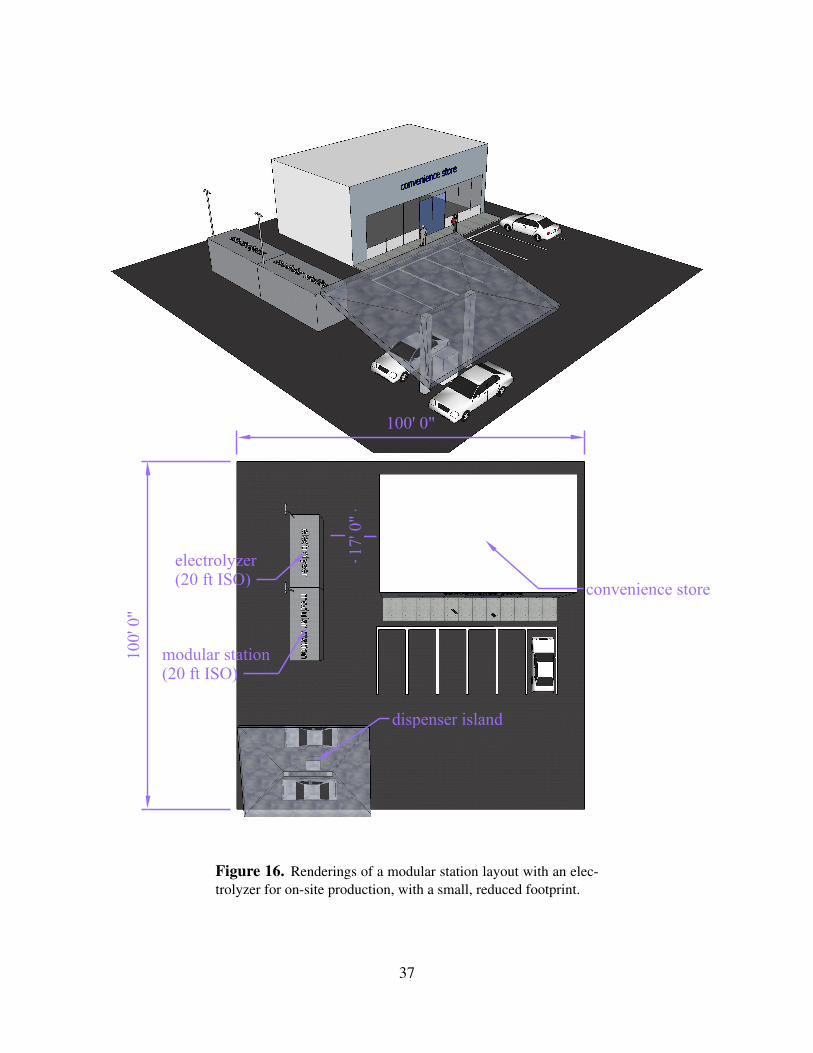
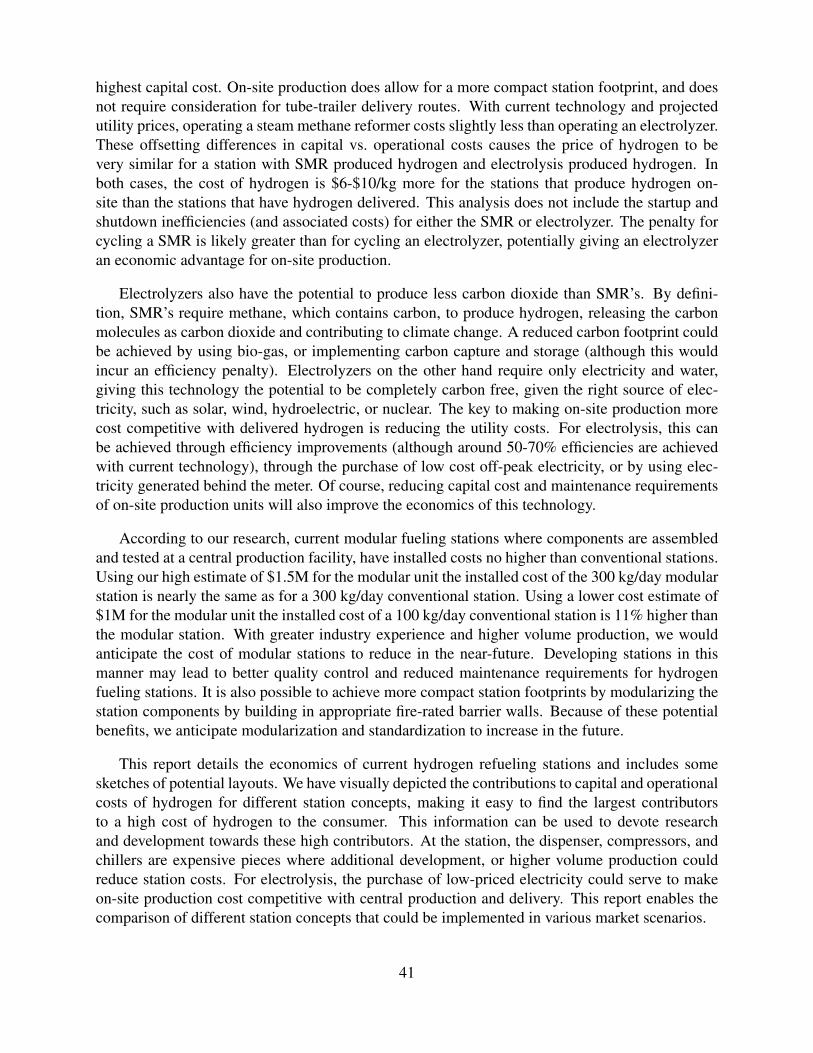
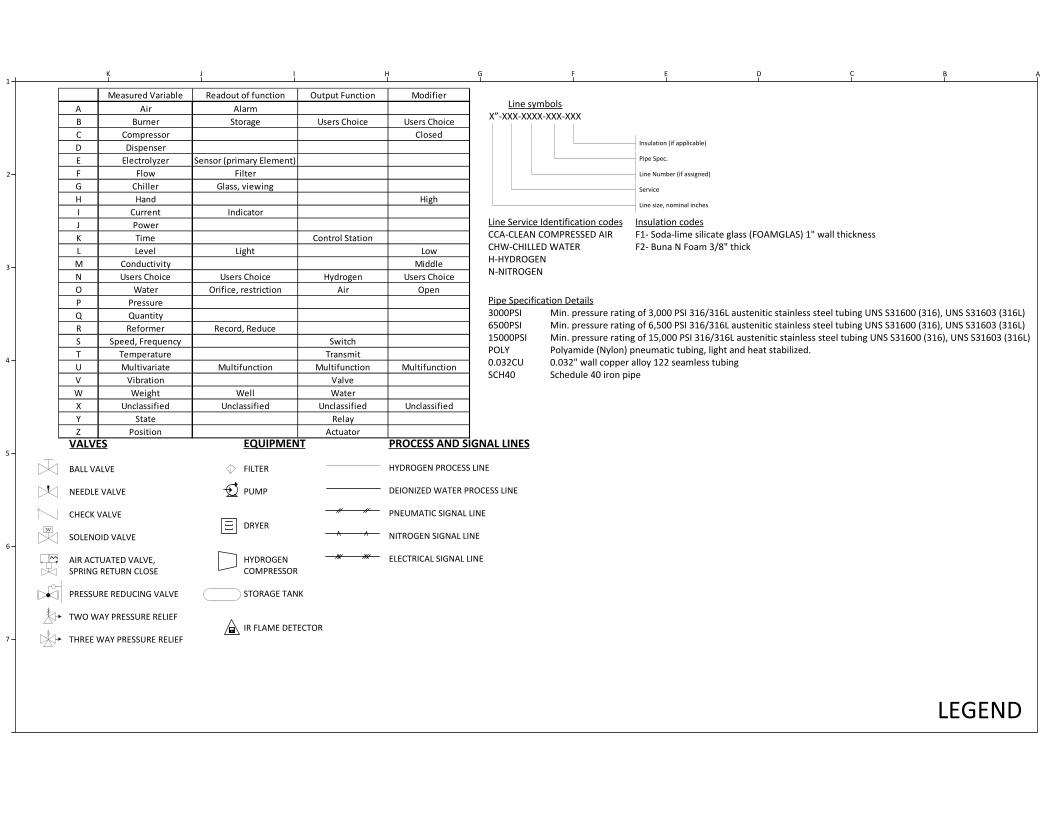
ABCDEFGHIJK1
2
3
4
5
6
7
CNH-300
HV-202HV-203
HV-201PT-300PI-300 HV-300
HV-301
Motor460-V 3Oslash SEE NOTE 1
Heater120-V 1Oslash 500 W
PT-202PI-202
34-H-VENT
1-frac14rdquo-CHW-800-SCH40
1-frac14rdquo-CHW-800-SCH40-F2
CW-800
GW-800
HV-202
HV-300
FV-100
ZSO-100
ZSC-100
ZI-100
FSV-100
ZZO-100
FSV-30038-H-3000PSI
38-H-5000PSI
38-H-5000PSI
38-H-15000PSI
34-H-VENT
OF-802TO COMMON frac34rdquo VENT MAST LOCATED ON BACK OF GMP
10 ABOVE GRADE
REFERENCE STATION 100-300 KGDAY
FF-300
GW-801
PI-101 PT-101
H2 Storage PBNH-402MAWP-15000 PSIG
H2 Storage PBNH-403MAWP-15000 PSIG
H2 Storage PBNH-401MAWP-15000 PSIG
FV-401
ZSO-401 ZSC-401
ZZO-401
FV-402
ZSO-402 ZSC-402
ZZO-402
FV-403
ZSO-403 ZSC-403
ZZO-403
FV-400
ZSO-400 ZSC-400
ZZO-400 GN-900
CHILLER 75-kW
DN-900JSS-901(EPO)
To EPO circuit
700-BAR NOZZLE
350-BAR NOZZLE
38-H-15000PSI
H70-T40H70-Warm
H35-T0
3570MPa DISPENSERWUN-900
FVControls Internal120V 1p 15A
GN-901
HEAT EXCHANGER1350 lbs
HV-901
H70-Cold
H2 Delivery Trailer multiple tubes one outlet
COH-100Air Compressor
PBAL-100
HV-100
AF-100
Air DryerAF-101
HV-900
PT-403PI-403
HV-403
PT-402PI-402
HV-402
PT-401PI-401
HV-401
HV-411
HV-412
HV-413
ZI-401
ZI-402
ZI-403
FV-101
ZSO-101 ZSC-101 ZI-101
ZZO-101
ZVO-100
ZVO-101
ZVO-900
ZVO-401
ZVO-400
ZVO-402
ZVO-403
RAH-100IR FLAME DETECTOR
AIMED AT HYDROGEN SOURCEAND ZONE 400
HIGH PRESSURE STORAGE
TO FIRE PANEL
RAH-900
IR FLAME DETECTORAIMED AT DISP HOSES
TO FIRE PANEL
HV-101
38-H-15000PSI
ZI-400
HV-400
FSV-200
EN-100ELECTROLYZER SKID
20 BAR (300 PSI) OUTPUT
RN-100STEAM METHANE REFORMER (SMR)
SKID13 BAR (200 PSI) OUTPUT
ZVO-102
Power460-V 3OslashSEE NOTE 1
Power460-V 3OslashSEE NOTE 1
ONLY ONE HYDROGEN SUPPLY OPTION IS USED PER STATION 1 TUBE TRAILER DELIVERY2 ON-SITE ELECTROLYSIS3 ON-SITE STEAM METHANE REFORMER
MUNICIPAL WATER SUPPLY
SEE NOTE 1
NATURAL GAS BIOGAS METHANE SUPPLY
SEE NOTE 1
NOTE 1 UTILITY REQUIREMENTS DEPEND ON STATION CAPACITY AND CAN BE ESTIMATED BASED ON THE FOLLOWING TABLESTATION CAPACITY 100 KGDAY 200 KGDAY 300 KGDAYELECTROLYZER POWER 260 KW 510 KW 770 KWELECTROLYZER WATER 110 LHR 220 LHR 330 LHRSMR POWER 16 KW 33 KW 49 KWSMR WATER 400 LHR 800 LHR 1200 LHRSMR GAS 34 NM3HR 68 NM3HR 101 NM3HRCOMPRESSOR POWER 25 KW 60 KW 100 KW
NOTE 2 ON-SITE PRODUCTION UNITS MAY INCORPORATE THEIR OWN INSTRUMENT AIR SYSTEM AND INTERCONNECTION WITH CSD SKIDCONTAINER MAY NOT BE NECESSARYNOTE 3 APPLIES TO MODULAR STATION ONLY A BUILD-ON-SITE STATION WILL NOT HAVE A SKID-OR CONTAINER-MOUNTED PRE-ASSEMBLED SYSTEMNOTE 4 IN SOME MODULAR STATIONS THE DISPENSER WILL BE A SEPARATELY-INSTALLED COMPONENTNOTE 5 IN MANY MODULAR STATIONS THE HEAT EXCHANGE EQUIPMENT WILL BE ROOF-MOUNTED
NOTE 2
COMPRESSION STORAGE AND DISPENSER (CSD) SKID OR CONTAINER BOUNDARY SEE NOTE 3
NOTE 4
NOTE 5
NOTE 5
PLCGas Control Cabinet
COMPRESSORMULTIPLE STAGES
References
[1] US Energy Information Administration EIA Open Data - Intro - US Energy Information Administration (EIA) accessed July 2016 httpwwweiagovopendata
[2] US DOE DOE H2A Production Analysis accessed May 2016 httpswwwhydrogen energygovh2a_productionhtml
[3] Joseph Pratt Danny Terlip Chris Ainscough Jennifer Kurtz and Amgad Elgowainy H2FIRST reference station design task Technical Report SAND2015-2660 R Sandia National Laboratories April 2015 Available at httpenergygoveerefuelcells h2first
[4] US DOE DOE H2A Delivery Analysis accessed May 2016 httpswwwhydrogen energygovh2a_deliveryhtml
[5] 2016 Annual Evaluation of Hydrogen Fuel Cell Electric Vehicle Deployment and Hydrogen Fuel Station Network Development Technical report California Environmental Protection Agency Air Resources Board July 2016 Available at httpswwwarbcagovmsprog zevproghydrogenhydrogenhtm
[6] E Sutherland and F Joseck Low volume production and delivery cost Technical Report 15011 Department of Energy Hydrogen and Fuel Cells Program Record 2015
[7] Ricardo Guerrero Lemus and Jose Manuel Martinez Duart Updated hydrogen production costs and parities for conventional and renewable technologies International Journal of Hydrogen Energy 35(9)3929ndash3936 2010
[8] Alfredo Ursua Luis M Gandia and Pablo Sanchis Hydrogen production from water elecshytrolysis current status and future trends Proceedings of the IEEE 100(2)410ndash426 2012
[9] G Parks R Boyd J Cornish and R Remick Hydrogen station compression storage and dispensing technical status and costs Systems integration Technical Report NRELBKshy6A10-58564 National Renewable Energy Laboratory (NREL) Golden CO May 2014
[10] NFPA 2 Hydrogen Technologies Code Technical report National Fire Protection Associashytion 2016
45
- Executive Summary
- Acknowledgment
- Contents
- Figures
- Tables
- 1 Introduction
-
- 11 Background and Contents
- 12 Approach
- 13 Method Overview
-
- 2 Station Cost Components
-
- 21 Centrally Produced Hydrogen and Delivery
- 22 Hydrogen Produced On-Site via Steam Methane Reforming
- 23 Hydrogen Produced On-Site via Electrolysis
- 24 Compression Storage and Ancillary Equipment for a Conventional Station
- 25 Packaged Compression Storage and Ancillary Equpiment for a Modular Station
- 26 Hydrogen Dispensers
-
- 3 Results Station Designs and Costs
-
- 31 Conventional Station with Delivered Centrally Produced Hydrogen
- 32 Conventional Station with Hydrogen Produced On-Site via Steam Methane Reforming
- 33 Conventional Station with Hydrogen Produced On-Site via Electrolysis
- 34 Modular Station with Delivered Centrally Produced Hydrogen
- 35 Modular Station with Hydrogen Produced On-Site via Electrolysis
-
- 4 Conclusions
- Appendix A Piping and Instrumentation Diagram
- References
-