comparison of computer testing versus traditional paper .../67531/metadc2621/m2/1/high... ·...
TRANSCRIPT

COMPARISON OF COMPUTER TESTING
VERSUS TRADITIONAL
PAPER AND PENCIL TESTING
Claudette M. Millsap, B.S., M.B.A.
Dissertation Prepared for the Degree of
DOCTOR OF PHILOSOPHY
UNIVERSITY OF NORTH TEXAS
August 2000
APPROVED: Jerry Wircenski, Major Professor, Chair and Program
Coordinator Jon Young, Minor Professor and Chair of the Department of
Technology and Cognition Roger Ditzenberger, Committee Member Michelle Wircenski, Committee Member
M. Jean Keller, Dean of the College of Education C. Neal Tate, Dean of the Robert B. Toulouse School of
Graduate Studies

Millsap, Claudette M., Comparison of Computer Testing versus Traditional Paper
and Pencil Testing. Doctor of Philosophy (Applied Technology, Training and
Development), August 2000, 85 pp., 9 tables, 2 figures, references, 118 titles.
This study evaluated 227 students attending 12 classes of the Apprentice Medical
Services Specialist Resident Course. Six classes containing a total of 109 students took
the Block One Tests in the traditional paper and pencil form. Another six classes
containing a total of 118 students took the same Block One Tests on computers. A
confidence level of .99 and level of significance of .01 was established.
An independent samples t-test was conducted on the sample. Additionally, a one-
way analysis of variance was performed between the classes administered the Block One
Tests on computers. Several other frequencies and comparisons of Block One Test
scores and other variables were accomplished. The variables examined included test
versions, shifts, student age, student source, and education levels.
The study found no significant difference between test administration modes.
This study concluded that computer-administering tests identical to those typically
administered in the traditional paper and pencil manner had no significant effect on
achievement. It is important to note, however, that the conclusion may only be valid if
the computer-administered test contains exactly the same test items, in the same order
and format, with the same layout, structure, and choices as the traditional paper and
pencil test. In other words, unless the tests are identical in every possible way except the
actual test administration mode this conclusion may not be applicable.

ii
TABLE OF CONTENTS
TABLE OF CONTENTS..................................................................................................................ii
LIST OF TABLES ............................................................................................................................iv
TABLE OF FIGURES......................................................................................................................iv
CHAPTER 1......................................................................................................................................1
INTRODUCTION.............................................................................................................................1 Introduction...........................................................................................................................1 Rationale for the Study .........................................................................................................7 Statement of the Problem......................................................................................................7 Purpose of the Study.............................................................................................................8 Hypothesis Tested.................................................................................................................9 Limitations ............................................................................................................................9 Definition of Terms ..............................................................................................................9 Summary ...............................................................................................................................11
CHAPTER 2......................................................................................................................................12
REVIEW OF RELATED LITERATURE........................................................................................12 Introduction...........................................................................................................................12 Research on Computer Testing versus Traditional Paper and Pencil Testing ....................13 Attitudes ................................................................................................................................13 New Testing Technology......................................................................................................14 Test Effectiveness and Efficiency ........................................................................................16 Anxiety and Motivation........................................................................................................17 Test Item Review and Feedback...........................................................................................19 Testing Time .........................................................................................................................21 Test Reliability and Validity.................................................................................................24 Achievement .........................................................................................................................26 Summary ...............................................................................................................................33
CHAPTER 3......................................................................................................................................35

iii
METHODOLOGY............................................................................................................................35 Research Population .............................................................................................................35 Definition of Variables .........................................................................................................36 Instrumentation .....................................................................................................................36 Design and Procedures .........................................................................................................38 Analysis and Treatment of Data ...........................................................................................39 Summary ...............................................................................................................................40
CHAPTER 4......................................................................................................................................42
RESULTS OF DATA ANALYSIS..................................................................................................42 Introduction...........................................................................................................................42 Hypothesis Tested.................................................................................................................50 Statistical Procedures............................................................................................................50 Comparison of Computer Testing versus Traditional Paper and Pencil Testing:
Findings ....................................................................................................................51
CHAPTER 5......................................................................................................................................55
FINDINGS, CONCLUSIONS, AND RECOMMENDATIONS ....................................................55 Findings.................................................................................................................................55 Conclusions...........................................................................................................................58 Recommendations.................................................................................................................59
APPENDICES...................................................................................................................................61 A. Freedom of Information Act Request Letter ...................................................................62 B. Freedom of Information Act Approval Letter .................................................................63 C. Human Subject Approval Letter from IRB .....................................................................64
REFERENCES..................................................................................................................................65

iv
LIST OF TABLES
Table 1 Block I Descriptive Statistics by Class................................................................................40
Table 2 Descriptive Statistics by Test Version.................................................................................44
Table 3 Descriptive Statistics by Shift..............................................................................................45
Table 4 Student Age and Block One Test Scores Descriptive Statistics ........................................46
Table 5 Legend of Education Codes in Figure 2.............................................................................49
Table 6 Independent Samples T-test Group Statistics......................................................................51
Table 7 Independent Samples Test on Block One Scores................................................................51
Table 8 One-way ANOVA of Block One Scores within Computer-Administered Group.............52
Table 9 Tukey HSD Multiple Comparisons.....................................................................................54
TABLE OF FIGURES
Figure 1. Student Source by percent of sample. ...............................................................................47
Figure 2. Education codes by percent of sample. ............................................................................48

1
CHAPTER 1
INTRODUCTION
Introduction
Computers revolutionized the world of training and development. As early as 1973 and even
earlier, Fuhrer (1973) and many others began conducting many studies detailing the enhanced
training available through computers. Many studies focused on the effects of using computers in
the classroom for testing on various aspects of the learning environment such as student
achievement, teacher attitudes, student anxiety, and more. A study by Seebo (1991) investigated
how many people can be assigned to a computer during training without adversely affecting
student achievement, but did not investigate instructor attitudes about the possibility of greater
numbers of students per class. Casey (1994) examined the effects of computer performance
assessment on student scores in a computer applications course. Vockell and Hall (1989) detailed
the benefits of computer-administered tests or on-line testing to the teacher or trainer without as
much concern for the student or achievement. Many studies and articles examined various aspects
of computerization of the traditionally manual classroom, which did not include computers, manual
testing procedures, and the move from proven instructional methods to more modern applications
of technology in a learning environment.
Over the years, many studies have been conducted on methods of test administration.
Barncord and Wanlass (1999) studied how administering tests using a reusable score sheet affected
student achievement. Unfortunately, the results of these studies were mixed. Some found
significant differences and attributed them to mode of administration, but did not hold other factors
constant. These studies are covered in Chapter 2. Until the question of whether the mode of test

2
administration affects achievement is resolved, more study should be conducted. There were not
enough studies examining the effect of the mode of administration where identical tests were given
in both test administration modes.
The studies scrutinized many different aspects of achievement and implications for the learner
that researchers attributed to various differences in the testing instrument or in the parameters set
for testing. Bergstrom and Lunz (1992) found a significant difference in the level of confidence in
pass/fail decisions for 645 medical technology students when the computer-adaptive test
implemented a 90 percent confidence stopping rule than for traditional paper and pencil tests of
comparable length. Another study by Lynch (1997) found significant achievement differences on
questions in which the computerized version of the test item was accompanied by a graphic while
the traditional paper and pencil version was not. Data analysis also revealed a tendency for
computer scores to be higher initially than traditional paper and pencil test scores. The difference
then tended to diminish with each successive test.
Other studies attributed differences in test performance to individual characteristics of the
testers themselves. Ward (1994) found achievement differences between computerized-adaptive
tests and traditional paper and pencil test versions but attributed the differences to gender and math
achievement. Johnson and Mihal (1973) considered both the race and Intelligence Quotient (IQ) of
male high school students tested on both traditional paper and pencil tests and on computer-
administered tests. They tested 10 white and 10 black male students. Test results for the white
students showed no mode effect. The black male students’ scores were significantly lower on the
traditional manual tests, but scores improved when the students were administered the
computerized tests. These scores were indistinguishable from the scores of the other students.
3
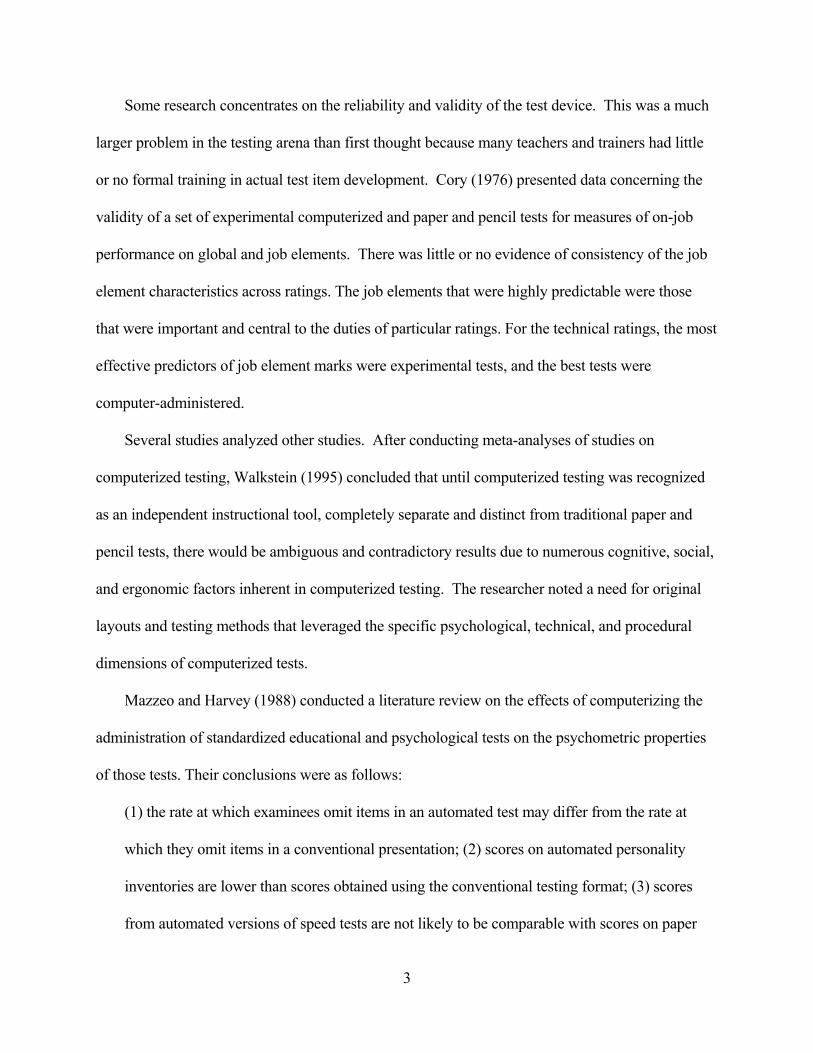
Some research concentrates on the reliability and validity of the test device. This was a much
larger problem in the testing arena than first thought because many teachers and trainers had little
or no formal training in actual test item development. Cory (1976) presented data concerning the
validity of a set of experimental computerized and paper and pencil tests for measures of on-job
performance on global and job elements. There was little or no evidence of consistency of the job
element characteristics across ratings. The job elements that were highly predictable were those
that were important and central to the duties of particular ratings. For the technical ratings, the most
effective predictors of job element marks were experimental tests, and the best tests were
computer-administered.
Several studies analyzed other studies. After conducting meta-analyses of studies on
computerized testing, Walkstein (1995) concluded that until computerized testing was recognized
as an independent instructional tool, completely separate and distinct from traditional paper and
pencil tests, there would be ambiguous and contradictory results due to numerous cognitive, social,
and ergonomic factors inherent in computerized testing. The researcher noted a need for original
layouts and testing methods that leveraged the specific psychological, technical, and procedural
dimensions of computerized tests.
Mazzeo and Harvey (1988) conducted a literature review on the effects of computerizing the
administration of standardized educational and psychological tests on the psychometric properties
of those tests. Their conclusions were as follows:
(1) the rate at which examinees omit items in an automated test may differ from the rate at
which they omit items in a conventional presentation; (2) scores on automated personality
inventories are lower than scores obtained using the conventional testing format; (3) scores
from automated versions of speed tests are not likely to be comparable with scores on paper

4
and pencil versions; (4) presentation of graphics in an automated test may affect score
equivalence; (5) tests containing items based on reading passages can become more difficult
when presented via computer; and (6) the possibility of asymmetric practice effects may make
it wise to avoid equating studies based on single-group counterbalanced designs.
Bergstrom (1992) also performed a meta-analysis and reviewed the results of 20 studies from
eight research reports that compared the adequacy of computer-adaptive tests and comparable
traditional paper and pencil tests in measuring the ability of the test taker. The author estimated a
scale-free index of effect magnitude for each study and compared the results on a common scale.
The comparison revealed that most studies showed computerized-adaptive tests and comparable
pencil and paper test versions were roughly equivalent in measuring the ability of the test taker.
When statistically significant differences were found, pre-existing traditional pencil and paper tests
usually had a higher mean.
Researchers even disagreed about the honesty of test takers. A study conducted by Davis and
Cowles (1989) examined the test-retest reliabilities of computerized test administration versus
traditional paper and pencil testing on psychological tests. The authors found that subjects
responded more honestly on computer-administered tests than on paper and that the test-retest
reliability was comparable for both groups. They did question the efficacy of computer-
administered testing. However, depending upon how the tests were administered by computer and
whether the student was allowed to use a personal laptop for test taking, the student could have a
greater opportunity for cheating, according to an article by Bulkeley (1998) in the Wall Street
Journal. The article also suggested that the transition from a traditional paper and pencil testing
format to a computerized testing format carried the risk of interfering with examinees' test-taking
strategies, thereby reducing the validity and reliability of test results.

5
Computer experience, or the lack thereof, could also affect test scores (Llabre et al., 1987). A
study by Russell and Haney (1997) compared traditional paper and pencil testing to computer-
administered testing to measure the performance of 120 middle school students on multiple-choice
and written test questions. They found that students with prior computer experience, who were
familiar with writing on computers, were more successful in writing computer responses. Miles
and King (1998) found statistically significant main effects when studying computer-administered
tests versus traditional paper and pencil tests. They evaluated the performance of 874
undergraduates on four non-cognitive psychological instruments.
Traditional paper and pencil testing was being challenged and pushed toward computerization
nationwide and even worldwide. Marcus (1999) reported in The Wall Street Journal that the
Educational Testing Service was getting pressure from the College Board, which sponsors the
Scholastic Aptitude Test and Advanced Placement exams, to modernize, computerize, and cut
costs. Unfortunately, these goals do not easily go hand-in-hand. The College Board was even
considering using contractors other than the Educational Testing Service for some aspects of the
preparation for testing and the actual testing itself for the first time since it helped create the
Educational Testing Service in 1947.
There is much more to creating a computerized test than just entering a traditional paper and
pencil version of a test into a computerized testing program (Swain, 1997). Wainer (1993)
cautioned that traditionally constructed, linearly administered tests could have adverse effects if
converted into a computerized-adaptive test format. Douglas (1990) concluded that while the
majority of aptitude tests incurred only minor changes as a result of the conversion process, not all
traditional tests were candidates for conversion to computerized form.

6
Bunderson, Inouye, and Olsen (1989) defined four types of computer-based assessment: (1)
computer testing; (2) computer-adaptive testing; (3) continuous measuring; and (4) intelligent
measurement. Sandals (1992) verified that many research and commercial projects use these four
types of assessment. Vispoel (1998) added self-adaptive testing to the list, focusing on the effects
of item-by-item answer feedback, or the absence thereof, and test anxiety on results obtained from
computerized vocabulary tests.
Computer-administered testing benefits include rapid up-dates, random item selection, test
item banks, and automatic data collection and scoring. One of the most attractive features of
computerized test construction was the ability to automatically generate equivalent, alternate test
forms from the test item bank. This push to computerize traditional paper and pencil tests was
reviewed by Williamson (1996). An historical overview of computerized behavioral testing of
humans in neurotoxicology stated that one of the drives to develop computerized tests was the
emphasis on computerizing traditional paper and pencil versions of existing tests. Once final
determination is made whether computer-administered testing affects student achievement, all
these other factors should be explored.
It would seem that the first step in the effort to automate testing should have been devoted to
the effects of testing on student achievement. If computer-administered testing had no adverse
effects on the achievement of the student, then this should be taken into account with the other
benefits of automating testing. It is entirely possible that taking a test on a computer versus taking
the same test in the conventional way with traditional paper and pencil could, in and of itself,
change the nature of the task, thereby altering the students' achievement.

7
Rationale for the Study
The explosion of computers in the work place, educational settings, and in the home led to the
testing of students via computerized tests versus traditional paper and pencil tests. Despite many
studies, there was no clear published evidence whether computerized testing adversely affected
student achievement. Much of the available research was inconclusive and contradictory
(Federico & Liggett, 1989). Many studies compared similar tests, but not exact test forms with test
items in the same order and with the same time limitations for each testing method (Eignor, 1993;
Straetmans & Eggen, 1998). The issue of whether computer testing affected achievement scores
needed to be researched to determine the effects on students.
In this study, it was necessary to ensure the computerized version of the test did not rely on
typing ability for a good score. Faster typists did not have any advantage over students with poor
typing skills. In this study, using multiple-choice tests to preclude the influence of typing ability on
the test results ensured that typing ability was not a factor in the achievement scores. The
students’ level of familiarity with computer technology was not assessed in this study.
Statement of the Problem
In the area of testing in courses routinely administering traditional paper and pencil tests at
specific junctures, a study was conducted to examine whether knowledge-based tests should be
routinely administered to students on the computer. This study evaluated student achievement
when tested using computer-administered tests versus traditional paper and pencil tests within the
3790 Medical Service Training Group at Sheppard Air Force Base, Texas, as measured by their
achievement on Block One Tests which assessed student knowledge of medical practices.

8
Purpose of the Study
The purpose of this study was to determine whether computerized testing affected student
achievement by comparing the test scores of students who took computer-administered Block One
Tests to the test scores of students who took the same Block One Tests in the traditional paper and
pencil manner using score sheets to record answers. The results of the study could be used in
multiple settings by anyone administering multiple-choice tests in a similar environment.
There were mixed findings in the literature about whether or not there is a significant
difference in the achievement scores of students tested in the traditional paper and pencil manner
when compared to achievement scores of students tested on computers (Legg & Buhr, 1990).
Many of the studies compared similar tests, not exact test duplications administered in different test
modes. The studies did not hold other factors constant such as time allotted for test taking (Sarvela
& Noonan, 1987), review of answers before finalizing the test, demographics of the test takers, and
environmental factors. Additionally, in many of the studies and articles, the students knew they
were part of an experiment (Vispoel & Coffman, 1992), which could affect student preparation
and/or anxiety and ultimately affect the outcome of the study. In an attempt to reduce the
possibility of outside influences affecting the outcome of this study, as many factors as possible
were held constant between the two groups in this study.
There were three versions of the Block One Test in the Apprentice Medical Services Specialist
Resident course. Each version of the traditional paper and pencil test was exactly duplicated in a
computer-administered test with items in the same order on the computer-administered test as the
items on the traditional paper and pencil versions. The students were all tested in the same room,
although at different times, as dictated by their normal course of instruction. Each test had a one-
hour time limit. This study attempted to determine whether there was any difference in student

9
achievement scores when comparing computer-administered tests to identical traditional paper and
pencil tests.
Hypothesis Tested
H0: There will be no significant difference between the achievement scores of students taking
the Block One Tests in the traditional paper and pencil form versus the achievement scores of
students taking the computer-administered versions of the same tests in Block One of the
Apprentice Medical Services Specialist Resident course.
Limitations
This study was limited to the personnel who met the minimum entrance requirements for
admission to the U.S. Air Force and to the Apprentice Medical Services Specialist Resident
Course. The prerequisite requirements were somewhat higher for this course than for some other
Air Force specialty areas. The study was limited to personnel attending this course at Sheppard Air
Force Base, Texas, during the period of this study. It was impossible to assign the students to the
classes randomly because their class assignment depended upon their date of arrival on station.
The sample of students was representative of the students assigned to this course throughout the
year by the Air Force Manpower and Personnel Center based on their qualifications upon entering
active duty with the U.S. Air Force.
Definition of Terms
The following definitions were provided to ensure complete understanding of the terminology
used in this study.
Achievement: The act of accomplishing a task successfully as measured by Block Test scores.

10
Air Education and Training Command: The major command within the U. S. Air Force
responsible for recruiting and training officers and airmen for the regular Air Force.
Apprentice Medical Services Specialist Resident Course: Course taught at Sheppard Air Force
Base, Texas, to train Medical Services Specialists. Graduates were qualified as Licensed
Vocational Nurses, certified in the Red Cross Cardiopulmonary Resuscitation course and registered
in the National Registry of Emergency Medical Technicians.
Block: One or more related units or modules grouped to cover major subject or task areas of a
course. The overall course consisted of six blocks.
Block One Test: A 50-item multiple-choice test administered at the completion of the first
block of instruction. Each item had four possible choices with one being the most correct answer.
There were three versions of the test.
Block Test: A written test that measured accomplishment of knowledge-oriented objectives
and knowledge components of performance-oriented objectives covered during a block of
instruction. Block tests were sampling tests and were not comprehensive in nature.
Computer-administered testing: Computerized administration of the Block One Test via a
computer and network software.
Content area: In this study, content area was specific related subject matter addressed in the
individual blocks.
Traditional paper and pencil test: Test taken with a test booklet, #2 pencil, and optical mark
score sheet.
Trained personnel requirement (TPR): Number of people determined to be required each
fiscal year (1 October to 30 September) in each Air Force Specialty course by Air Force Manpower
and Personnel.

11
Summary
In spite of the research on computerized testing, there seemed to be no definitive answer to the
question of whether the test medium, in and of itself, affected student achievement. This study
examined the data gathered from 12 classes of 227 students attending the Apprentice Medical
Services Specialist Resident Course over a period of nine months. There were three versions of the
Block One Test. Six of the classes took Block One Tests in the traditional paper and pencil manner
and the other six classes took identical Block One Tests on computers. Each test had a time limit
of one hour and the students were all tested in the same room. To ensure that typing ability was not
a factor, multiple-choice tests were used. There were four possible answers to each of the 50
questions. Students took the Block One Tests at the end of the Block One course of instruction as
they completed it. All the students taking the Block One Tests were in consecutive classes. The
students were not told they were part of a study. By holding as many factors constant as possible,
this study attempted to examine the effects of the test medium without the potential interference of
other factors.

12
CHAPTER 2
REVIEW OF RELATED LITERATURE
Introduction
There were many significant studies on the effect of computer-administered testing on the
learner. Many others, however, focused on the differences between computerized tests and
traditional paper and pencil tests without considering the effects on the learner adequately, if at all.
One study by Fletcher and Collins (1987) listed the advantages and disadvantages of
computer-administered versus written tests but did not address the effects of the testing on the
learner.
Some studies were inconclusive. Legg and Buhr (1990) investigated the causes of a 16-point
mean score increase for the computer-adaptive form of the College Level Academic Skills Test in
reading over the same test in traditional paper and pencil test form. The 1988 statewide field test
compared reading, writing, and computation scores for approximately 1,000 students. The
researchers were unable to replicate the difference in a follow up study or to adequately explain the
causes for the increased performance.
Federico (1989) tested 83 male student pilots and radar intercept officers on aircraft
recognition with line drawings of front, side, and top silhouettes of aircraft using both paper-based
and computer-based tests. Prior to testing, the students practiced aircraft recognition of the
silhouettes either using a paper-based study guide or a computer-based form of a study guide. The
paper-based measure of average degree of confidence in recognition judgments was more reliable
than the computer-based measure. Federico and Liggett (1989) found research on the differences

13
between computer-administered and traditional paper and pencil tests to be contradictory and
inconclusive.
This chapter is arranged by categories according to the focus of the studies. The categories are
Research on Computer Testing versus Traditional Paper and Pencil Testing,
Attitudes, New Testing Technology, Test Effectiveness and Efficiency, Anxiety and Motivation,
Test Item Review and Feedback, Testing Time, Test Reliability and Validity, and Achievement. A
heading precedes each section.
Research on Computer Testing versus Traditional Paper and Pencil Testing
Many studies found significant differences between computer-administered testing and
traditional paper and pencil testing. These studies and articles attributed achievement differences
to several factors. Russell and Haney (1996) found significant differences in the performance of
students on the National Assessment of Educational Progress computerized tests when compared to
traditional paper and pencil tests. They compared 42 students tested on a computer-administered
test with scores of 47 students tested on a traditional paper and pencil test. In addition to answering
multiple-choice items, there were open-ended items requiring original responses. For scoring,
raters only saw the computer products because all hand-written responses were entered into the
computer verbatim after the test concluded. Larger mode effects were found on open-ended
writing tasks than on multiple-choice tests. Additionally, analysis showed that students who wrote
on the computer tended to organize their work into paragraphs and wrote responses nearly twice as
long as the students who hand wrote their responses.
Attitudes
Even when computerized testing was shown to be better than traditional paper and pencil
testing, decision-makers were often not willing to make a change (Engdahl, 1991). Plake (1993)

14
presented a hypothetical educational testing program designed for optimum assessment. The author
discussed the measurement of student achievement using computer-adaptive testing and
performance assessment with emphasis on the financial and operational demands of each. Due to
cost and operational demands, most of the 145 participants assessed were not willing to endorse the
program as optimal. An early study by Butler (1982) revealed very little faculty support for
computerizing testing and a perception by students that changing test modes and increasing test
feedback information beyond total score was irrelevant.
New Testing Technology
New technology and techniques beyond just automating traditional paper and pencil tests have
been developed. Luecht and Nungester (1998) wrote that an integrated approach to test
development and administration called computer-adaptive sequential testing was the new way to
administer tests. Computer-adaptive sequential testing incorporated both adaptive testing methods
with automated test assembly in a structured approach to test construction. Using this test
development methodology enabled educators to maintain a greater degree of control over the
production quality assurance and over the administration of different types of computerized tests.
Computer-adaptive sequential testing retained much of the efficiency of traditional computer-
adaptive testing and could be modified for computer mastery testing applications. Wise (1999)
introduced an alternative adaptive testing method called a stratum computerized-adaptive test. It
did not require item response theory methods for either item selection or proficiency estimation. In
two simulation studies comparing stratum computerized-adaptive tests to conventional tests and
traditional computerized-adaptive tests, stratum computerized-adaptive tests were found to be
substantially more efficient than conventional tests.

15
Wise, Plake, Johnson, and Roos (1992) compared the relative effects of computerized-adaptive
testing and self-adapted testing on 204 college students randomly assigned to the two testing
conditions on tests involving algebra skills. Their results showed that examinees taking the self-
adapted test obtained significantly higher ability scores and reported significantly lower posttest
state anxiety than students taking the computerized-adaptive test. Results suggested that self-
adapted testing was a desirable format for computer-based testing.
Gershon and Bergstrom (1991) administered a computer-adaptive test and two fixed-length
traditional paper and pencil tests to 765 exam takers. In a paper presented at the annual meeting of
the National Council on Measurement in Education, the authors reported that some variables found
to affect performance on written tests were not significant in computer-adaptive testing.
Internet testing has also been investigated as an alternative means of test administration. A
study by Bicanich, Slivinski, Kapes, and Hardwicke (1997) found the Internet to be a viable cost-
effective alternative to traditional paper and pencil testing. It could have far-reaching implications
in testing that may not otherwise have been convenient or even possible.
New technology has made possible testing that was not possible, or at least not economical, a
few years ago. Just such technology enabled Miller and Vernon (1997) to test reaction times in 4-
and 6-year old children and in adults. New technology allowed Moffat, Hampson, and
Hatzipantelis (1998) to measure the ability to navigate virtual routes to determine spatial abilities.
Tirre and Raouf (1998) focused on multi-limb coordination ability when investigating the overlap
between cognitive and perceptual-motor abilities. These new technologies could have future
implications in testing areas where reaction times may be critical such as driver licensing testing
and pilot training (Burke, Hobson, & Linksy, 1997).

16
There were some examples of how new technologies were being used in clinical settings.
Thompson and Berry (1998) discussed treating cerebrovascular disease and the ability to evaluate
and manage cognitive problems resulting from head injuries. Pascualvaca, Fantie, Papageorgiou,
and Mirsky (1998) investigated the possibilities for computerized testing in the treatment of autism.
Sleep deprivation studies performed by Caldwell and Ramspott (1998) also used computerized
testing techniques. Computerized testing and monitoring techniques and electronic prompts
enabled data gathering previously unavailable. New breakthroughs are constantly being made in
treatment areas.
Technology has also been explored for new ways to teach simple skills. Mastropieri, Scruggs,
and Shiah (1997) found that mildly retarded children could learn problem-solving skills using
computerized tutorial programs. There may be many possibilities for the future of computerized
instruction and testing. Some warn educators must go slowly and be aware of the dangers that
could be associated with computerized testing (McBride, 1998). Educators should also consider
teaching techniques in addition to testing techniques according to Mayer (1998). Researchers
could also use new technology to analyze their data according to Wilkinson (1999).
Test Effectiveness and Efficiency
Some studies concentrated on the effectiveness of the test medium. Dillon and Pellegrino
(1989) described the development of computerized tests that administered and scored memory
items, dynamic or moving tasks, and timed items as being much more effective than traditional
paper and pencil tests. Krug (1989) reported that in an estimated ten percent of hand-scored
objective tests, errors of one point or more in the final score were made. Computerized test
administration ensures accurate test scores. The author hypothesized that accurate scoring could
impact score reliability more than other aspects of test and measurement. Test scores interpreted

17
by computer offered research data relevant to each particular test item as well as to overall tests that
were previously unavailable through manually scored tests. Additionally, computerized testing
yielded consistent, predictable reports for analysis.
Garrison and Baumgarten (1986) measured the mathematical skills of 60 entry-level deaf
college students. Six to 8 weeks after testing in the traditional paper and pencil mode, computer-
administered tests measured ability in the same subject matter. The testing procedures were
compared for stability. Findings indicated substantial increases in measurement efficiency through
the computerized testing procedure. Additionally, attitudes toward computerized testing were
favorable.
The Educational Testing Service is computerizing college admissions and occupational
licensure/certification tests. Bennett (1994) wrote that aside from the obvious advantages
computerized tests offered, such as immediate scoring and testing at the convenience of the test
taker versus testing en masse at the convenience of the test administrators, there was much more
that could be accomplished using modern testing technology. The author described an electronic
multi-organizational infrastructure for integrating traditional testing methods with new technology
using performance tasks, to better measure skills currently not examined, to sample behavior
frequently during the instructional process, and to give instructionally useful feedback. There may
be, however, an issue of test security present in the continuous testing environment that was not an
issue in a periodic testing environment according to Stocking and Lewis (1998). This could be an
area where further research may be required.
Anxiety and Motivation
Other studies examined the anxiety level of the test taker and the time required to complete the
examination. Students displayed a higher degree of test anxiety when taking computerized tests

18
than they did when taking traditional paper and pencil tests and most preferred the traditional paper
and pencil versions according to a report by Sieppert and Krysik (1996). Wise (1997)
contemplated test administration from the perspective of the examinee during a computerized-
adaptive test and focused on issues surrounding the development of computerized-adaptive tests.
The author examined how the ability to review answers affected examinee anxiety and
performance levels. Another issue interwoven with that of item review was the time limits on the
test takers. He felt that because a computerized-adaptive test was usually shorter than a traditional
paper and pencil test, computerized-adaptive test developers should be either be extremely liberal
when establishing time limits or impose no time limits at all. Increased test anxiety, higher or
lower examinee motivation, and equity in computer experience, he wrote, all have implications
when considering inferences made from computerized-adaptive test scores and should be carefully
weighed when developing computerized-adaptive tests.
Lee, Moreno, and Sympson (1986) recommended more computer training to minimize
computer anxiety. Their results, contrary to some studies, indicated lower scores on computer-
administered tests than on traditional paper and pencil tests. The authors administered the
Arithmetic Reasoning subtest of the Armed Services Vocational Aptitude Battery to 585 military
recruits; 300 recruits tested in the traditional paper and pencil manner and 285 recruits were given a
computer-administered version of the same test with no time limit in either testing mode. There
could be a higher degree of test anxiety when taking computerized tests than when taking
traditional paper and pencil tests (Sieppert & Krysik, 1996). Additionally, a study by Shermis and
Lombard (1998) suggested that what was previously thought to be computer anxiety might be
manifestations of test anxiety.

19
Llabre et al. (1987) tested 26 male and 14 female college students on a revised version of
the Test Anxiety Scale and some sample test items from the California Short-Form Test of Mental
Maturity on either a computer-administered or a traditional paper and pencil administered test.
They found significant differences in both test performance and anxiety level between the two
groups. Their results indicated that test administration mode could affect test performance as well
as raise anxiety levels.
Test anxiety was not the only emotion reported to affect test takers. Motivation levels also
affected achievement. Feedback and knowledge of results were indicated as significant in several
studies. Betz and Weiss (1976) tested 350 college students divided into high- and low-ability
groups. Their reported motivation levels were found to be related to their ability level.
Motivational differences were attributed to having immediate knowledge of test results, which
resulted in greater standardization of the test-taking environment in a computer-adaptive test mode
than in traditional paper and pencil testing environments.
Test Item Review and Feedback
Jones and Sorlie (1976) designed a computer-administered test that provided periodic,
meaningful feedback during the test. In their study, a freshman class of 31 university students was
divided into two groups with 20 students tested in the computer-assisted method with immediate
review of missed test items and the rest of the students tested in the traditional paper and pencil
mode. The students tested on computers scored significantly higher on tests occurring later in the
year as a result of this item review throughout the year. In all but two of the 16 sub-scores of the
year-end Freshman Comprehensive and National Boards Part I examinations, the scores were
higher for the students administered the tests throughout the year via computer than for the students
tested in the traditional paper and pencil manner. Conversely, Helgeson and Kumar (1993) were

20
concerned that the linear nature of computer testing did not allow the student to go back and reflect
upon particular items.
Kent, McClain, and Wessels (1974) investigated a computer managed evaluation system as
compared to traditional paper and pencil testing in a self-paced course environment. Problems in
operating the course were mainly associated with the administration, grading and providing
feedback on 2,000 individual tests. Major advantages of the computer-administered tests over
traditional paper and pencil tests included immediate feedback to students, production of
summaries of student performance and attitudes without manual manipulation of paper or figures,
and less worry about test security. By the end of the course, students preferred the computer to
traditional paper and pencil tests.
Vispoel, Wang, de la Torre, Bleiler, and Dings (1992) studied 97 college students, each of
whom completed a vocabulary test and several measures of attitudes about review, item difficulty,
and test anxiety. The authors were evaluating the effects of the opportunity for examinees to
review and change answers on the magnitude, reliability, efficiency, and concurrent validity of
scores obtained from three types of computerized vocabulary tests (fixed item, adaptive, and self-
adapted). They concluded that being allowed to review test answers resulted in enhanced test
performance, decreased measurement precision, increased total testing time, affected concurrent
validity, and was strongly favored by examinees. They further deduced that computerized tests do
not always yield equivalent test results and that results for administration mode were inconclusive.
The fixed-item test yielded the lowest scores, was the least reliable, and was the most affected by
test anxiety.
Clark, Fox, and Schneider (1998) considered three types of test item feedback in their review.
They administered seven test units to 73 undergraduates. The students were randomly assigned to

21
either item-by-item knowledge of responses, answer-until-correct, or delayed feedback for the first
two test units. They were allowed to choose which type of feedback they wanted for the remainder
of the test units. When allowed to choose, students preferred answer-until-correct feedback.
Testing Time
There were many studies on testing, response times, the time it took either to administer
the test or to review items, and more. Neubauer and Knorr (1998) examined the speed at which
subjects processed information on traditional paper and pencil tests. Gruszka (1999) found a
relationship between the speed of responses and the ability of the subjects by administering
computerized tests to 57 college students. Various aspects of time as related to testing were
discussed in this section.
Wise, Plake, Pozehl, Boettcher-Barnes, and Lukin (1989), in testing 113 university students on
six versions of a computer-administered algebra test, found that computer-based testing in higher
education was faster to administer. Therefore, there was time to test more information than
allowed by traditional paper and pencil testing. The authors did not find computer experience or
computer anxiety to affect scores. Their study concentrated more on the effects of item feedback
than on overall student achievement. Feedback did improve test performance in some cases. Betz
(1977) discovered that immediate item-by-item feedback improved test performance when
investigated on several samples of undergraduate students administered either adaptive or
conventional tests.
Achievement differences on time-limited tests may be attributed to differential response-time
rates between subgroups, rather than to actual differences in individual ability, according to a study
by Schnipke and Pashley (1997). Computer-administered tests provided additional data about
response accuracy and response speed which were separate performance measures that, according

22
to a study by Scrams and Schnipke (1997), gave the examiner more information about the test
takers and their abilities.
Evans and Surkan (1977) studied students enrolled in the same undergraduate educational
psychology course for two consecutive years. During the first year they were tested using
traditional paper and pencil tests. In the second year they were tested using computer-administered
tests. When students were able to take more replicates of each examination in the second year via
the computer-administered tests, they improved their scores and shortened the time required for
taking the computer-administered tests prior to the final examination. These researchers drew the
conclusion that it should be feasible to develop training programs in which portable, stand-alone,
computer systems were available for use by each student.
Reardon and Loughead (1988) studied traditional paper and pencil and computerized versions
of the Self-Directed Search, a career assessment instrument, evaluating administration procedures
and student scores for 62 undergraduates. Their results showed strong differences in student
preferences and administration time. Students preferred the faster computer version.
Waring, Farthing, and Kidder-Ashley (1999) studied test-taking styles to determine whether
performance on computer-administered multiple-choice tests was affected by an impulsive
response style and whether or not that test-taking behavior could be modified. They used the
Matching Familiar Figures Test for adults as a tool to classify college students as either impulsive
or reflective responders. Students were administered two multiple-choice tests while either working
at the pace they set or being forced to delay their responses. The researchers measured response
time and accuracy. The responses of students who reflected upon their choices were made a bit
slower but were more accurate than their impulsive counterparts. However, with enforced delays

23
in response time, the accuracy of the impulsive students improved to approximately the level of the
students taking more time with their responses.
Alderton (1990) developed a computerized perceptual speed test containing random number
strings, random letter strings, and nonsense figure strings which was then administered to 435 Navy
recruits. Then with some minor changes to the test instrument, the final test version was
administered to 722 subjects, each of whom took the three computer-administered perceptual speed
subtests and three traditional paper and pencil tests. The findings suggested that the computer-
administered perceptual speed test was a better psychometric instrument than the traditional paper
and pencil administered tests. The computer version controlled speed to accuracy tradeoffs,
produced greater individual differences, was more reliable with greater construct validity, and,
according to the author, was probably a purer measure of perceptual speed.
Olsen, Maynes, Slawson, and Ho (1989) compared student achievement test scores of 575
students on tests developed from the third- and sixth-grade mathematics item banks of the
California Assessment Program using paper-administered, computer-administered, and
computerized-adaptive testing. The paper-administered and the computer-administered tests were
identical in item content, format, and sequence. The computerized-adaptive test consisted of an
adaptive subset of the computer-administered test. The students were administered two of the three
types of tests in varying sequence. Results supported the comparability of paper-administered and
computer-administered tests although the computer-administered test required only half to three-
quarters as much testing time as the traditional paper and pencil test. The adaptive test required
about one-fourth as much time as the traditional paper and pencil test. Scores tended to be lower on
the second test administered.

24
Sarvela and Noonan (1987) documented several difficulties associated with computer-
based testing. Psychometric analyses of test results could be difficult in some cases. The time
allowed for changing test answers was also significant. In computerized-adaptive testing, item
responses determined the next item presented, making it difficult to change the selection once an
answer was entered. Constructed response or short answer items were difficult to score in
computerized tests. Since students previewed items, received feedback while items were still being
presented, or retook some items, item contamination was troublesome. Finally, groups tested were
not equivalent. Item and test statistics were difficult to compute because the same set of test items
was rarely administered.
McDonald, Beal, and Ayers (1992) found significant differences in their study of 100 grade
school students. These students, grades 3-6, were given computer-administered tests and
traditional paper and pencil tests to assess their computational performance while on a computer.
The study found significant differences in test completion time, number of mental computation
strategies utilized, and errors in transferring information.
Test Reliability and Validity
Test reliability and validity has been an ever-recurring issue in test development and
administration, regardless of the test medium. Weiss and Betz (1973) concluded that adaptive
testing could considerably reduce testing time and at the same time yield scores of higher reliability
and validity than traditional paper and pencil tests. Vansickle, Kimmel, and Kapes (1989)
compared computer-based and traditional paper and pencil forms of the Strong-Campbell Interest
Inventory for equivalence. They administered the inventory to 52 university students using a two-
week test-retest design. Their results indicated that although the forms were equivalent, the
computer-based form might have been more reliable and faster to administer. In a study of
25
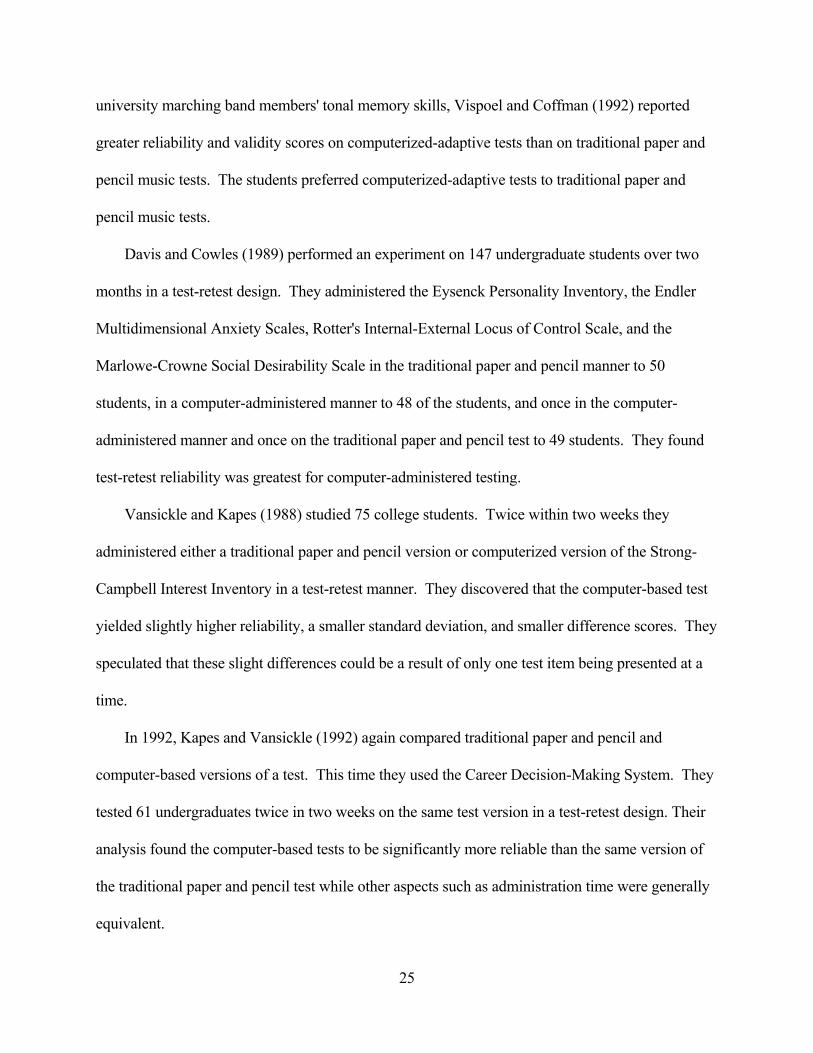
university marching band members' tonal memory skills, Vispoel and Coffman (1992) reported
greater reliability and validity scores on computerized-adaptive tests than on traditional paper and
pencil music tests. The students preferred computerized-adaptive tests to traditional paper and
pencil music tests.
Davis and Cowles (1989) performed an experiment on 147 undergraduate students over two
months in a test-retest design. They administered the Eysenck Personality Inventory, the Endler
Multidimensional Anxiety Scales, Rotter's Internal-External Locus of Control Scale, and the
Marlowe-Crowne Social Desirability Scale in the traditional paper and pencil manner to 50
students, in a computer-administered manner to 48 of the students, and once in the computer-
administered manner and once on the traditional paper and pencil test to 49 students. They found
test-retest reliability was greatest for computer-administered testing.
Vansickle and Kapes (1988) studied 75 college students. Twice within two weeks they
administered either a traditional paper and pencil version or computerized version of the Strong-
Campbell Interest Inventory in a test-retest manner. They discovered that the computer-based test
yielded slightly higher reliability, a smaller standard deviation, and smaller difference scores. They
speculated that these slight differences could be a result of only one test item being presented at a
time.
In 1992, Kapes and Vansickle (1992) again compared traditional paper and pencil and
computer-based versions of a test. This time they used the Career Decision-Making System. They
tested 61 undergraduates twice in two weeks on the same test version in a test-retest design. Their
analysis found the computer-based tests to be significantly more reliable than the same version of
the traditional paper and pencil test while other aspects such as administration time were generally
equivalent.

26
A group of 60 Persian Gulf War veterans were the subjects of another study. Campbell et al.
(1999) gave each subject 19 computerized versions of conventional test measures twice in a test-
retest format one week apart. They found test-retest reliabilities were comparable to conventional
administration formats. According to their findings, when part of a test battery, individual test
reliability was not affected.
Prieto and Delgado (1999) studied the effects of guessing on reliability. Their study used
multiple-choice tests to learn the effects on testing reliability of using specific instructions
regarding guessing and applying specific scoring conditions. They tested 240 students, each
randomly assigned to four conditions varying by how much they discouraged guessing. The
computerized tests were otherwise similar. They did not find significant differences in reliability.
Achievement
The mean test score on the traditional paper and pencil test was found to be higher than the
mean computerized test score in an investigation by Lee and Hopkins (1985). In a study of 92
undergraduates taking a computerized aptitude test the researchers measured achievement by the
correct number of answers on an arithmetic reasoning test. They attributed achievement
differences between traditional paper and pencil tests and computerized tests to human error and
deficiencies of the computer software. Their study results also indicated that neither computer
experience nor computer training immediately before testing appeared to significantly affect
computerized test performance or anxiety level. Ronau and Battista (1988) concluded that
computerized test versions were significantly more difficult in an analysis of diagnostic testing of
eighth grade students' performance. They indicated the mediums used for testing might affect the
way students perform mathematics.

27
Lord (1977) concluded from domain-referenced test theory that, under certain conditions,
traditional paper and pencil testing and computer-generated repeatable testing were equally
effective for estimating examinee ability. They did comment that computer-generated repeatable
testing was more effective for estimating group mean ability level than for estimating individual
ability differences. Other studies, like Neuman and Baydoun (1998) found no differences across
modes between traditional paper and pencil tests and computer-based tests (CBTs) in clerical tests.
Schnipke and Reese (1997) conducted a study which incorporated testlets (bundles of items)
into two-stage and multistage designs, and compared the precision of the ability estimates derived
from these designs with those derived from a standard computerized-adaptive test design and from
traditional paper and pencil test designs. They randomly created 50,000 simulated test takers to
establish the cutoffs for the two-stage and multistage testlet designs. They used 25,000 simulated
test takers to simulate all test designs. Their findings indicated all testlet-based designs improved
precision over the same-length traditional paper and pencil test, and resulted in almost as much
precision as the traditional paper and pencil test of double length. Ponsoda, Wise, Olea, and
Revuelta (1997) found statistically significant differences in the number of correct responses and
testing time in their study of 209 Spanish high school students. Using versions of English
vocabulary tests, they compared a self-adapted test, a computerized-adaptive test, a conventional
test of randomly selected items, and a test that combined a self-adapted test and a computerized-
adaptive test. These researchers also advised using caution when making assumptions of the effects
of self-adapted tests on examinees.
After studying the use of computer-administered testing by the American College extensively
over a six-year period from 1982-1988, Bugbee and Bernt (1990) found student achievement on

28
computer-administered tests was, in some cases, better than traditional paper and pencil tests. They
examined student performance on and student attitudes regarding computer-administered versus
traditional paper and pencil tests. They also considered the effects of time limits on computerized
testing.
Eignor (1993) studied 500 examinees who took the College Board Admissions Testing
Program computer-adaptive Scholastic Aptitude Test prototype and the traditional paper and pencil
Scholastic Aptitude Test. Although two of the computer-adaptive test conversions were quite
similar to the traditional paper and pencil tests, the Verbal and Mathematical conversion scores
differed by up to 20 points. Statistically significant differences in performance scores were found
in a study by Sukigara (1996). Of the 200 Japanese female college students who were twice
administered the New Japanese version of the Minnesota Multiphasic Personality Inventory, the
scores from the computer-administered test were higher than those from the traditional paper and
pencil (booklet) administration.
Eswine (1998) noted significant differences between traditional paper and pencil test
administration and computerized test administration in a study of school age and preschool
children. Although there was significant difference in preschool performance across the two types
of test administration, no significant difference was noted in the school-age children's performance
across the two types of test administration. Similarly, Robson (1997) investigated the
administration of a computerized version of the Peabody Picture Vocabulary Test-Revised to 53
preschoolers as compared with the traditional administration of the same instrument. Results of t-
tests revealed no significant difference in scores on the two versions of the test among four-year-
olds, but three-year-olds performed at a significantly higher level on the conventional version.
29
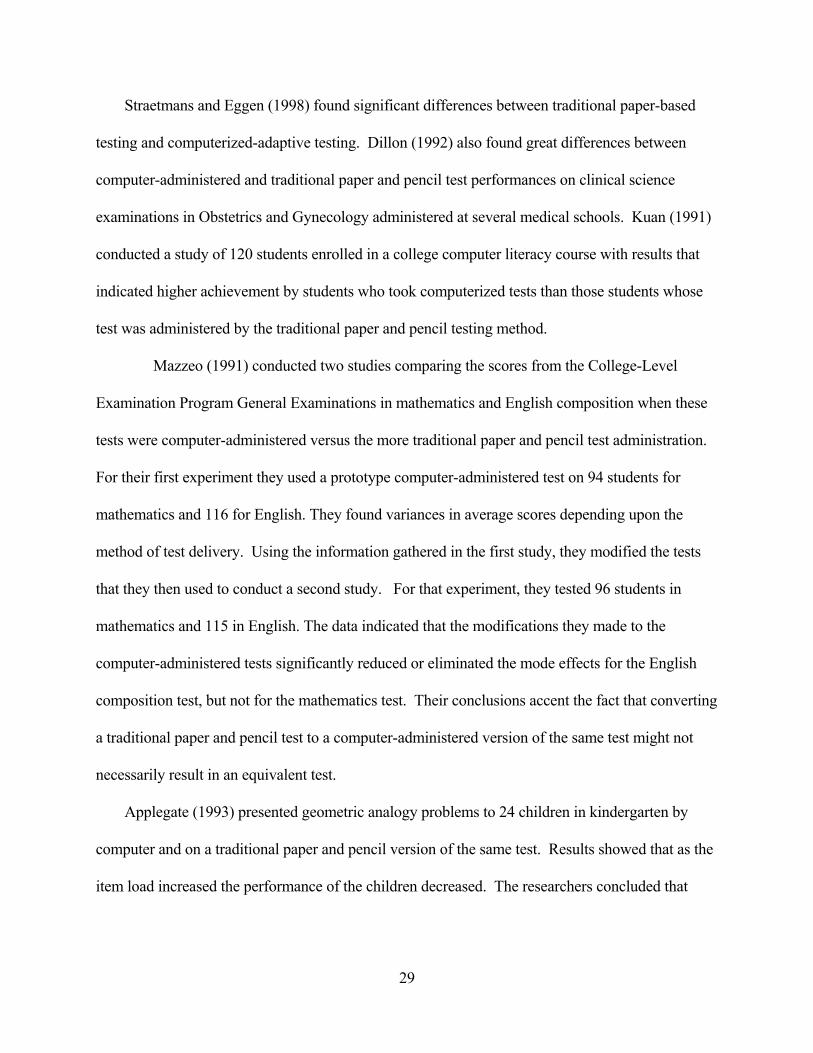
Straetmans and Eggen (1998) found significant differences between traditional paper-based
testing and computerized-adaptive testing. Dillon (1992) also found great differences between
computer-administered and traditional paper and pencil test performances on clinical science
examinations in Obstetrics and Gynecology administered at several medical schools. Kuan (1991)
conducted a study of 120 students enrolled in a college computer literacy course with results that
indicated higher achievement by students who took computerized tests than those students whose
test was administered by the traditional paper and pencil testing method.
Mazzeo (1991) conducted two studies comparing the scores from the College-Level
Examination Program General Examinations in mathematics and English composition when these
tests were computer-administered versus the more traditional paper and pencil test administration.
For their first experiment they used a prototype computer-administered test on 94 students for
mathematics and 116 for English. They found variances in average scores depending upon the
method of test delivery. Using the information gathered in the first study, they modified the tests
that they then used to conduct a second study. For that experiment, they tested 96 students in
mathematics and 115 in English. The data indicated that the modifications they made to the
computer-administered tests significantly reduced or eliminated the mode effects for the English
composition test, but not for the mathematics test. Their conclusions accent the fact that converting
a traditional paper and pencil test to a computer-administered version of the same test might not
necessarily result in an equivalent test.
Applegate (1993) presented geometric analogy problems to 24 children in kindergarten by
computer and on a traditional paper and pencil version of the same test. Results showed that as the
item load increased the performance of the children decreased. The researchers concluded that

30
computer-administered testing yielded more data that was more easily interpreted than data from
traditional paper and pencil tests.
Swain (1997) administered mathematics tests of similar content to 114 third grade students.
Their achievement scores revealed a statistical significance in the method of assessment.
Participants scored higher on all subtests of the traditional paper and pencil format of the
mathematics test than on the computer-administered format of the test. The researcher further
concluded that there is more to test development than changing the medium of presentation.
Casey (1994), in a study of 72 undergraduate students enrolled in Computer Applications in
Education courses, found significant differences between traditional paper and pencil test scores
and computer test scores. The data indicated higher achievement on the computer-administered
tests. Conversely, another study resulted in lower scores on a computer-administered test. The
Peabody Picture Vocabulary Test-Revised was administered to 98 children enrolled in Grades 2
through 6 by Lichtenwald (1987). The students performed significantly better on the manual
version of the test than they did on the computer-administered version. Students given the
computerized version first scored significantly lower than those students who received the manual
test before the computerized version.
Engdahl (1991) tested 250 adults with cognitive disabilities on language usage and space
relations in one of the following three test administration modes: traditional paper and pencil, fixed
length computer-adaptive, and variable length computer-adaptive. The researcher found that these
adults performed better on the computerized versions than on the traditional paper and pencil tests
and that clinicians were less accepting of the computerized assessment than their patients.
A study by Dimock and Cormier (1991) discovered lower performance on a computer-
administered version of the Verbal Reasoning test of the Differential Aptitude Tests than on the

31
traditional paper and pencil version of the same test. They administered the tests to college students
in two studies of 24 and over 400 students respectively. Osin and Nesher (1989) analyzed the
difference in mathematics performance of 1,845 elementary school pupils measured either with
traditional paper and pencil tests or by computerized testing. Pupils in each of eight schools, two
classes each from Grades 2 through 6, were tested. The researchers found significantly higher
scores on traditional paper and pencil tests than on computerized tests.
Some studies attributed testing differences to individual characteristics. Schwartz, Mullis, and
Dunham (1998) administered traditional paper and pencil versions of the Ego Identity Process and
the Identity Style Inventory to 113 university undergraduates. Another 100 undergraduates from
the same university and with the same general demographic characteristics completed the same
measures in an individually administered, computerized form. The results showed significant
differences between the two methodologies. Individual differences in identity status and style may
have produced differential response tendencies between computer-managed and traditional paper
and pencil modes of administration of identity formation measures. Researchers should be careful
when attributing achievement differences to individual characteristics according to Prieto and
Delgado (1999). The authors warned that the mediums used in gathering the information might be
contributing to the differences.
Cueto, Jacoby, and Pollitt (1998) researched the effect of having breakfast versus not having
breakfast on achievement, using both traditional paper and pencil test instruments and computer-
administered tests. The authors assessed 54 fourth and fifth grade boys in Peru. The boys were
categorized based upon their nutritional status of either at-risk or not-at-risk. The boys each spent
two nights at a research facility, one week apart. They received breakfast on one morning and no
breakfast on the other morning. Each morning the boys took three traditional paper and pencil tests

32
and three computer tests to evaluate cognition. Fasting appeared to have no negative effects on the
not-at-risk group, but did affect nutritionally at-risk children.
In 1982, German Federal Armed Forces initiated their first empirical pilot project in the area of
computerized-adaptive testing. Wildgrube (1982) studied the test results from 208 examinees who
took the Armed Forces Aptitude Classification Battery by traditional paper and pencil and then by
computer. The comparison using the t-test for dependent samples showed significant mean
differences except for Arithmetic. The verbal aptitude tested on traditional paper and pencil tests
showed higher scores, while the computerized testing method yielded higher scores in tests using
figures.
Reckase (1986) examined the feasibility of a computerized testing system in the Radar
Technician Training Course at the Naval Training Center, Great Lakes, Illinois. The computerized
tests were administered in a sequential, fixed length format and compared with comparable
traditional paper and pencil tests. The results indicated that some test items operated differently
when administered on a computer screen as compared to a traditional paper and pencil test
administration.
Parshall (1992) found demonstrated mode effect in a subset of 1,114 examinees tested in the
Educational Testing Service's Graduate Record Examination Program Computer-Based Testing
Pilot study in the fall of 1991. The difference was not obvious when all subjects were considered
together. The researcher was unable to identify examinee characteristics to explain the occurrence
of mode effect, however, and the attempt to do so yielded inconsistent results. Still determined to
learn the reasons for the inconsistencies, Parshall and Kromrey (1993) again looked for attributes,
using the same data, to explain mode effect between traditional paper and pencil and computer-
administered versions of this test instrument. They found:

33
Considering (1) demographic variables (gender, racial/ethnic background, and age); (2)
computer experience (variety and frequency of computer experience, frequency of mouse use,
and test mode preference); and (3) individual test-taking strategies (strategy preference, and
tendency to omit or review items), they learned that the performance scores of a small subset
of examinees were more affected than the whole, but could be masked.
They then isolated and examined those individual test takers most affected by the method of
test administration, but found only weak relationships between individual characteristics of test
takers and the method of test administration. Although they were successful in identifying those
individuals most affected by mode of test administration, they were still not able to explain the
reasons they were so affected.
Schaeffer, Reese, Manfred, McKinley, and Mills (1993) also reviewed the relationship
between a Graduate Records Examination linear computer-based test and a more traditional paper
and pencil test with the same items. Either the computer-administered examination or the
traditional paper and pencil version was given to recent Graduate Records Examination examinees.
Although no test-level performance differences were found for the verbal and analytical tests, a
small test-level effect was found for the quantitative measure.
Summary
The literature reviewed did not clearly establish whether computer-administered versions of
traditional paper and pencil tests affected student achievement. The body of literature was
inconclusive, ambiguous, and contradictory. Despite much research on the similarities and
differences between computerized testing and more traditional paper and pencil testing and many
other closely related topics, there was no final answer to the question of whether, and how, the
method of test administration affected student achievement singly and in groups. By closely

34
examining student achievement on computer-administered versions of traditional paper and pencil
tests with identical test questions in exactly the same sequence while holding as many other factors
as possible constant, a clear comparison of the test administration modes was conducted. Only
then did the research address the question of whether knowledge-based tests should be routinely
administered to students on the computer.

35
CHAPTER 3
METHODOLOGY
Research Population
The research population consisted of the 227 students who attended the 12 classes of the
Apprentice Medical Services Specialist Resident Course, J3AQR90230 003, at Sheppard Air Force
Base, Texas, during the nine months covered by the study from January through September 1994.
Tests were administered at the end of the first block of instruction for each class. The students were
tested at different times as dictated by the completion of the Block One lesson plan. The lesson
plan required a minimum of 71 ½ hours of instruction from the time the class commenced until the
Block One Test was administered. The classes were on one of two shifts, either A or B. A-Shift
hours were from 6:00 a.m. until 3:00 p.m. B-shift hours were from 9:00 a.m. until 6:00 p.m.
During the first six hours of the shift there were usually five hours of classroom instruction and one
hour was used as a lunch period. The last three hours of each shift were usually reserved for either
individual study or tutoring for students who needed assistance from the instructor staff. This
special tutoring was called Special Individualized Assistance and was either requested by the
student or required due to low scores on daily quizzes.
This course was taught only at Sheppard Air Force Base. Graduates were sent to training
hospitals in the United States for eight weeks of clinical training and then on to locations around
the world to perform their duties in Air Force aid stations, clinics, and hospitals. Successful
completion of the course qualified the students to begin careers as medical technicians in the U.S.
Air Force and to advance in their field through professional military education, career development
courses, and continuation courses. Graduates’ qualifications were equivalent to Licensed

36
Vocational Nurses. They were certified in the Red Cross Cardiopulmonary Resuscitation course
and registered in the National Registry of Emergency Medical Technicians.
Motivation for these students to succeed was exceptionally high. Failure to successfully
complete the course not only resulted in not being certified, but also in losing their jobs and being
processed out of the Air Force. This added incentive not only increased the stress on the students,
but also likely contributed to the high passing rate.
Definition of Variables
The independent variable in this study was the methodology of testing. Achievement was
measured by assessing the students' knowledge of medical practices as demonstrated by their
performance on the Block One Test. Classes in the study were assigned to take the Block One Test
either on the computer or the traditional paper and pencil method upon completion of Block One
instruction. Both tests were identical with questions in the same order. Time limits, one hour for
all tests, were the same for all of the Block One Tests regardless of the method of administration or
test version. Computerized versions of the test were referred to as "computer-administered" tests
throughout the study. To the extent possible, every factor that could be controlled was held
constant except the method of administering the tests. The dependent variable was the Block One
Test score (all versions).
Instrumentation
Block Tests were developed in accordance with, and validated according to, procedures
outlined in the Instructional Systems Development process as documented in the U.S. Air Force
Air Training Command Regulation 52-15 (ATCR 52-15), Planning, Development, and Validation
of Training. Content validity was established by course development in accordance with
guidelines set forth in the same regulation. All course material was also in accordance with current

37
medical practices in the civilian medical community. Criterion validity for the tests was
established by administering each version of the test to at least three classes, ensuring the average
scores were within five percentage points for the alternate versions. Tests were validated
repeatedly through mass administration and constant item analyses. Additional analyses were
conducted by instructors quarterly to confirm validity and reliability according to regulations. This
analysis information is not available to the researcher. The item responses on the Block One Tests
are not part of this study. The passing score for students taking these tests was 70% accuracy.
Students failing to score at least 70% were given Special Individualized Assistance and allowed to
re-test. For the purposes of this study, only the original score was used. The classes were restricted
to no more than 26 students. The Block One Test was administered on the ninth academic day of
the course. The day of the week the Block One Test was administered varied according to the day
the course began.
There were 50 multiple-choice questions on each version of the Block One Test, each with
four possible answers. The actual tests were not included in this dissertation, as that would have
compromised the tests. Because all the test items were multiple-choice, typing ability was not a
factor in taking the test. The students’ comfort level with technology was not assessed. Each of
the instructors had essentially the same medical and military background when selected for
Instructor duty. Each attended and passed the Technical Training Instructor Course, a five-week
course of instruction on the Air Force method of technical instruction. Once certified as an Air
Force Instructor, each was required to continue developing skills as an instructor through a series of
courses and experiences, the culmination of which resulted in a certification as an Air Force Master
Instructor. Instructors in the course were proficiency-tested annually on the same tests

38
administered to the students. In order to maintain instructor status, they were required to score at
least 95%.
Tests were administered on computers using interactive courseware that allowed the test taker
to skip questions and return to them later, and to review answers prior to exiting the program. The
instructor graded the tests. All computers in the room were alike. To avoid the possibility of
ergonomic or environmental differences in testing conditions, the same room was used to
administer the computerized Block One Tests to all classes in the study. Each computer was
equipped with a color monitor, a keyboard, and a mouse. Instructors prepared the computers for
test administration prior to the students’ arrival in the testing room to further ensure familiarity with
computers (or lack thereof) was not a factor influencing student achievement. Scores in the study
were derived from data collected by the U. S. Air Force and ordered through the Freedom of
Information Act.
Design and Procedures
The subject population consisted of all students attending the Apprentice Medical Services
Specialist Resident Course during the period of the study from January through September 1994.
Students were assigned to specific classes based upon their date of arrival on station. The
treatment, taking the computer-administered Block One Test, was administered to one group and
compared to the group that took the same Block One Tests in the traditional paper and pencil
format. Approximately 227 students in twelve classes were divided into the two groups. The
course was 14 weeks, or 68 academic days, in length. The Block One Test was administered on the
ninth academic day of the course. All versions of the Block One Test contained 50 multiple-choice
questions, each with four possible answers. There were six blocks of instruction. Overall course
grades for each student were obtained by taking a numerical average of their individual Block Test

39
scores (excluding Block Two). Attrition was low, probably due to the nature of the screening
process. The course's normal attrition rate over the course of a year was approximately four
percent. The attrition rate at the end of Block One for the classes in the study sample was one
percent. The large number of subjects minimized any differences among the students as they were
assigned to the classes. The course had an annual Trained Personnel Requirement of
approximately 2000 students. There were approximately 20 classes in session at any one time. To
minimize the Hawthorne effect, instructors never mentioned that students taking the computer-
administered Block One Tests were part of an experiment. Although the students certainly talked
among themselves, all the students who took the computer-administered versions of the test
attended the course during the same time frame. Data were compared within this group to
determine the difference in achievement levels.
Each of the instructors had essentially the same medical and military background when
selected for Instructor duty. Each attended and passed the Technical Training Instructor Course, a
five-week course of instruction on the Air Force method of technical instruction. Once certified as
an Air Force Instructor, each instructor was required to take the Block Test for the Blocks of
instruction they taught annually in order to maintain proficiency. Passing score for the instructors
was 95%. Instructors took the identical tests administered to the students. The instructors’ tests
were computer-administered.
Analysis and Treatment of Data
One comparison was performed for analysis. A comparison was made between the students
who took the Block One Test in the traditional paper and pencil format and the students who took
the computer-administered version. Data were stored and sorted on Microsoft Office (1997) Excel
spreadsheet software. Manipulation of the data was accomplished using SPSS for Windows 8.0

40
(1997) processor software. A confidence level of .99 and a level of significance of .01 were
established. A frequency distribution and a t-test were performed on each of the groups.
Comparisons used the 227 individual students as the sample as opposed to using the 12 classes in
which the students attended instruction. Classes of students were divided into two treatment
groups by mode of test administration.
Block One mean test scores, number of students, test versions, and standard deviation by class
in each test administration mode are displayed in Table 1. Students removed from training prior to
taking the Block One Test were excluded from the study.
Table 1
Block I Descriptive Statistics by Class
Test Mode
Class Number
Test Version
Mean Score
Number of Students
Standard Deviation
Paper 1 A 89.77 13 5.42 Paper 2 C 85.60 15 8.85 Paper 3 A 86.80 20 4.92 Paper 4 B 87.94 18 6.64 Paper 5 C 87.65 23 5.71 Paper 6 C 89.15 20 5.73 Totals 87.79 109 6.22 Computer 7 B 90.93 15 4.91 Computer 8 C 85.27 15 7.65 Computer 9 A 85.12 26 6.04 Computer 10 A 87.56 18 5.93 Computer 11 C 86.95 20 5.92 Computer 12 A 83.75 24 6.06 Totals 86.28 118 6.37
Summary
This study, using a set of 227 military trainees as research subjects, was robust enough to
address the issue of whether knowledge-based tests should be routinely administered to students on

41
the computer by comparing achievement scores on the Block One Tests for the students in the
study sample. The tests were performed on the 227 individual students that attended the course
rather than on the 12 classes. All other variables in the study were controlled to the extent possible
to reduce the possibility of outside influences affecting the outcome of the study. Establishing a
confidence level of .99 and level of significance of .01 ensured the credibility of the study results.

42
CHAPTER 4
RESULTS OF DATA ANALYSIS
Introduction
The purpose of this study was to determine whether computerized testing affected student
achievement by comparing the test scores of students in the Apprentice Medical Services Specialist
Resident course who took the computer-administered Block One Tests to the test scores of students
who took the same Block One Tests in the traditional paper and pencil manner using score sheets to
record answers. The research population consisted of the 227 students who attended the 12 classes
of the Apprentice Medical Services Specialist Resident Course, J3AQR90230 003, at Sheppard Air
Force Base, Texas, during the nine months covered by the study from January through September
1994. Block One Tests were administered at the end of the first block of instruction for each class.
The classes were tested at different times as dictated by the completion of the Block One lesson
plan. The lesson plan required a minimum of 71 ½ hours of instruction from the time the class
commenced until the Block One Test was administered.
Each student had one hour to complete the Block One Test regardless of the test administration
mode. There were three versions of the Block One Test. There were 50 questions on each version
of the Block One Test, each with four possible answers. Individual test item responses were not
part of this study. The actual tests were not included in this dissertation, as that would have
compromised the tests. Faster typists did not have any advantage over other students. In this
study, using multiple-choice tests to preclude the influence of typing ability on the test results
ensured that typing ability was not a factor in the achievement scores. The students’ level of
familiarity with computer technology was not assessed in this study.

43
The instructors never mentioned that students taking the computer-administered Block One
Tests were part of an experiment. All the students that took the computer-administered versions of
the Block One Tests in this study attended the course during the same time frame.
Interactive courseware used to administer the tests on computers allowed the test takers to skip
questions and return to them later. It also let them review answers prior to exiting the program.
The instructor graded the tests. All computers in the room were alike. To avoid the possibility of
ergonomic or environmental differences in testing conditions, the same room was used to
administer the computerized Block One Tests to all classes in the study. Each computer was
equipped with a color monitor, a keyboard, and a mouse. Instructors prepared the computers for
test administration prior to the students’ arrival in the testing room to further ensure familiarity (or
lack thereof) with computers was not a factor influencing student achievement.
Sheppard Air Force Base trained all Medical Services Specialists for the U.S. Air Force.
Graduates received eight weeks of clinical training in hospitals in the United States and then were
assigned to locations around the world to perform their duties in Air Force aid stations, clinics, and
hospitals. Successful completion of the course qualified the students to begin careers as medical
technicians in the U.S. Air Force and to advance in their field through professional military
education, career development courses, and continuation courses. Graduates’ qualifications were
equivalent to Licensed Vocational Nurses. They were certified in the Red Cross Cardiopulmonary
Resuscitation course, and registered in the National Registry of Emergency Medical Technicians.
Motivation for these students to succeed was exceptionally high. Students who did not
successfully complete the course were not certified and were processed out of the Air Force. This
added incentive not only increased the stress on the students, but also likely contributed to the low
attrition rate. The attrition rate in this study was one percent.

44
For the purpose of this research, the students were considered individually rather than by class
to ensure a large enough sample for a robust test. This chapter presents the analysis of the data. An
independent samples t-test was conducted on the sample. Further analysis of the computer-
administered group was also conducted.
There were three versions of the Block One Test in each of the test administration modes.
Table 2 depicts the test versions in each test administration mode along with mean Block One Test
scores by test version, number of students who took each test version, and standard deviations.
Table 2
Descriptive Statistics by Test Version
Administration Mode
Test Versions
M
n
SD
Computer A 85.13 61 6.11
B 89.62 21 6.14
C 86.28 36 6.40
Total 86.28 118 6.37
Paper A 86.25 40 6.66
B 87.18 22 6.68
C 89.38 47 5.30
Total 87.79 109 6.22
The classes in the study were assigned to one of two shifts, either A or B. A-shift was from
6:00 a.m. to 3:00 p.m. with classes usually held from 6:00 a.m. to noon. B-shift was from 9:00 a.m.
to 6:00 p.m. with classes usually held from 9:00 a.m. to 3:00 p.m. Classroom instruction was
delivered five hours per day, usually in the morning. Students were given one hour for lunch each
day. The last three hours of each shift were usually reserved for either individual study or special
individualized instruction between instructors and students wanting or needing special attention.

45
Classes were assigned to shifts based on instructor and classroom availability. Table 3 shows the
shifts by test administration mode with related mean Block One Test scores, number of students,
and standard deviation.
Table 3
Descriptive Statistics by Shift
Administration Mode
Shift
M
n
SD
Computer A 85.35 57 6.56
B 87.15 61 6.10
Total 86.28 118 6.37
Paper A 87.26 43 5.31
B 88.14 66 6.77
Total 87.79 109 6.22
Students entering military technical training were typically fairly young and in many cases
were receiving the initial technical training of their military careers. The average age of the
students in the study was 24.87 for the group tested on traditional paper and pencil tests and 23.84
for the group tested on computers. Table 4 shows the age ranges and mean ages of the students (as
available) as well as the range of Block One Test scores, mean Block One Test scores, and standard
deviation by mode of test administration. Although the average student was about 24 years of age,
the maximum age in each group, 45 for the traditional paper and pencil group and 56 for the
computer-administered group, was unusually high. This could be explained by the large
percentage of Air Force Reserve and Air National Guard students in the sample as portrayed in
Figure 1. Age restrictions were quite different for active duty Air Force personnel than for the
guard and reserve forces. The retirement age was significantly younger for active duty forces and

46
the maximum number of years one was allowed to serve on active duty was considerably less than
the maximum number of years members were allowed to serve in the reserve and guard forces.
Possible reasons for a member to enter an initial training course such as the Apprentice Medical
Services Specialist Resident course so late in his or her career could include mandatory cross
training due to changing a weapons system, closing an Air Force Reserve or Air National Guard
base, or the merging of career fields.
Table 4
Student Age and Block One Test Scores Descriptive Statistics
Administration Mode
Variables
n
Minimum Maximum M SD
Paper Block 1 Scores 109 70 99 87.79 6.22
Age 103 18 45 24.87 5.92
Computer Block 1 Scores 118 72 99 86.28 6.37
Age 115 18 56 23.84 6.14 Figure 1 shows the students who were U. S. Air Force active duty (42%), U. S. Air Force
Reserve (42%), and U. S. Air National Guard (16%). One student was classified as other than U.
S. Air Force. This participant could have been a civilian working for the U. S. Government or a
student from a foreign nation. Other U. S. services such as the U. S. Army or Navy were
specifically coded and were not represented in this sample.

47
Figure 1. Student Source by percent of sample.
Education levels of students in military training courses were usually recorded on their grade
cards according to a set of codes. The education codes are explained in Table 5. Figure 2 shows
the distribution of educational level codes by percentage of sample. Over half of the students held
at least a high school diploma. The majority of the rest of the students had completed at least some
college. It was rare for a recruit without at least a high school diploma to be admitted into the Air
Force. It is possible that the students coded B and C either were in the Air Force before the new
restrictions were applied or were directed by a court to join the military in lieu of punishment. In
either case, it was unusual to encounter students without at least a high school diploma, especially
since prerequisite requirements for acceptance to this course were higher than for many other Air
Force Specialties.
Other U. S Air Force Reserve
U. S. Air National Guard
U. S. Air Force
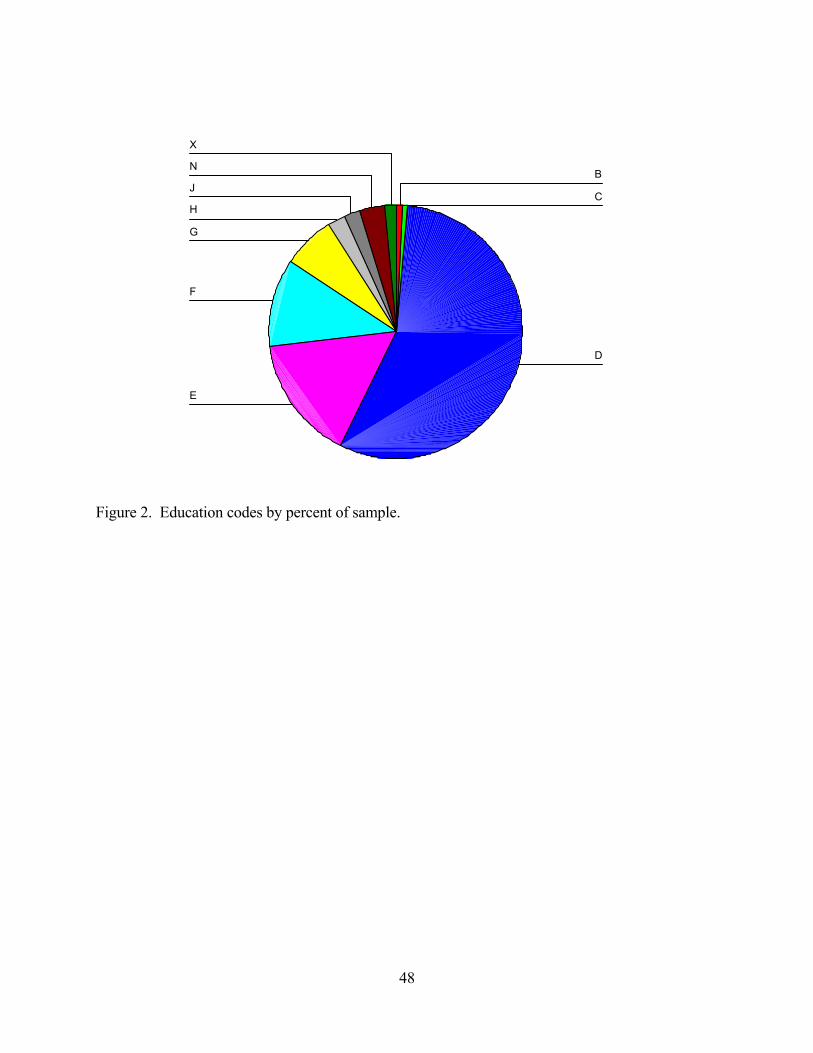
48
Figure 2. Education codes by percent of sample.
X
N
J
H
G
F
E
D
C
B

49
Table 5
Legend of Education Codes in Figure 2
Code Explanation of Educational Level Codes
B Completed high school level GED battery – no high school diploma or certificate of equivalency.
C High school completion – state certificate of equivalency.
D High school completion – diploma.
E Completed between 12 and 29 semester hours or 22 and 44 quarter hours of post-secondary education.
F Completed between 30 and 59 semester hours or 45 and 89 quarter hours of post-secondary education.
G Completed between 60 and 89 semester hours or 90 and 134 quarter hours of post-secondary education.
H Awarded an associate degree.
J Completed 90 or more semester hours or 135 or more quarter hours but has not been awarded a baccalaureate degree. At least 20 semester hours or 30 quarter hours must be upper division credit or must have letter from university or college that individual is within 30 semester hours or 45 quarter hours of baccalaureate degree completion.
N Awarded a baccalaureate degree.
X Educational data not available.
Fifty-six percent of the students held a high school diploma as shown by code D. Two
students were coded with a B meaning they completed a GED battery, but had not been awarded a
certificate of equivalency. One student held a certificate of equivalency as noted by code C.
Eighty-one of the students (36%) had completed some college as denoted by codes E, F, G, and J.
Of the six percent of students who had degrees, five students held an associate degree (code H)
while eight had been awarded baccalaureate degrees (code N). No educational data was available
on three of the students in the sample (code X). Only the codes represented in the sample were
explained.

50
Hypothesis Tested
H0: There will be no significant difference between the achievement scores of students taking
the Block One Tests in the traditional paper and pencil form versus the achievement scores of
students taking the computer-administered versions of the same tests in Block One of the
Apprentice Medical Services Specialist Resident course.
Statistical Procedures
There were 227 students attending 12 classes of the Apprentice Medical Services Specialist
Resident Course evaluated in this study. Six classes containing a total of 109 students took the
Block One Tests in the traditional paper and pencil form. Another six classes containing a total of
118 students took the same Block One Tests on computers. The raw scores and other data were
entered into a Microsoft Office (1997) Excel spreadsheet and then converted into SPSS for
Windows 8.0 (1997) for analysis. A confidence level of .99 and level of significance of .01 was
established.
An independent samples t-test was conducted on the sample. The number of students taking
the Block One Tests in each test administration mode with related mean Block One Test scores,
standard deviation, and standard error of the mean are depicted in Table 6. Additionally, a one-
way analysis of variance was performed between the classes administered the Block One Tests on
computers. Several other frequencies and comparisons of Block One Test scores and other
variables were accomplished. The variables examined included test versions, shifts, student age,
student source, and education levels.

51
Comparison of Computer Testing versus Traditional Paper and Pencil Testing: Findings
An independent samples t-test was conducted on the sample of 227 students. The analysis
found no significant difference between the two test administration modes at the .01 level. Table 6
depicts the group statistics. As shown in Table 7, the independent samples t-test resulted in a t-
score of 1.80 with 225 degrees of freedom, t (225) = 1.80, p > 0.01. The mean difference of the
scores was 1.51. At a 99% confidence interval, the difference ranged from -.66 to 3.68. The mean
Block One Test score for traditional paper and pencil tests was 87.79 with a standard deviation of
6.22. The mean Block One Test score for computer-administered tests was 86.28 with a standard
deviation of 6.37.
Table 6
Independent Samples T-test Group Statistics
Administration Mode N M SD SE
Paper 109 87.79 6.22 .60
Computer 118 86.28 6.37 .59
Table 7
Independent Samples Test on Block One Scores
99% Confidence Interval
t df p
Mean Difference
Lower
Upper
Equal Variances Assumed 1.80 225 0.73 1.51 -.66 3.68
A review of the Block One Test scores by class revealed that class number 12 had a low score
relative to the other classes. Additional analysis of the data was performed. A one-way analysis of

52
variance was performed on the classes administered the Block One Tests on computers. Table 8
depicts the results of the one-way ANOVA of Block One Test scores within the computer-
administered group. There was a significant difference in Block One Test scores at the .05 level
between class number 7 (M = 90.93) and class number 9 (M = 85.12) and between class number 7
and class number 12 (M = 83.75).
Table 8
One-way ANOVA of Block One Scores within Computer-Administered Group
Groups Sum of Squares df Mean Square F p
Between 567.356 5 113.471 3.044 .013 Within 4174.415 112 37.272 Totals 4741.771 117
Further analysis of the data by performing a Tukey HSD on the classes administered Block
One Tests on computers revealed that only the difference in Block One Test scores between class
numbers 7 and 12 was significant at the .01 level. The mean Block One Test scores by class (Table
1) showed a much higher mean Block One Test score for class number 7 than for the other classes.
The mean Block One Test score for class number 12, the last class in the study tested on
computers, was 7.18 points lower than the mean Block One Test score for class number 7, the first
class in the study tested on computers.
Table 9 depicts the results of the Tukey HSD performed at the 99% confidence level on the
classes administered the Block One Tests on computers. The table displays the mean differences
between class numbers, the standard error between class numbers, the significance of each
comparison, and the upper and lower bounds of the confidence interval. An asterisk denotes the

53
significant mean difference at the .01 level. Mean Block One Test Scores for class number 7 and
class number 12 were significantly different at the .01 level with a mean difference of 7.18.

54
Table 9
Tukey HSD Multiple Comparisons
99% Confidence
Interval
Class Number
Class Number
Mean Difference
SE
p
Lower Bound
Upper Bound
7 8 5.67 2.23 .121 -2.03 13.36 9 5.82 1.98 .045 -1.01 12.65 10 3.38 2.13 .612 -3.99 10.74 11 3.98 2.09 .401 -3.21 11.18 12 7.18 * 2.01 .007 .25 14.12 8 7 -5.67 2.23 .121 -13.36 2.03 9 .15 1.98 1.000 -6.68 6.98 10 -2.29 2.13 .891 -9.95 5.08 11 -1.68 2.09 .966 -8.88 5.51 12 1.52 2.01 .974 -5.42 8.45 9 7 -5.82 1.98 .045 -12.65 1.01 8 -.15 1.98 1.000 -6.98 6.68 10 -2.44 1.87 .783 -8.90 4.02 11 -1.83 1.82 .914 -8.10 4.43 12 1.37 1.73 .969 -4.60 7.33
10 7 -3.38 2.13 .612 -10.74 3.99 8 2.29 2.13 .891 -5.08 9.65 9 2.44 1.87 .783 -4.02 8.90 11 .61 1.98 1.000 -6.24 7.45 12 3.81 1.90 .349 -2.76 10.38
11 7 -3.98 2.09 .401 -11.18 3.21 8 1.68 2.09 .966 -5.51 8.88 9 1.83 1.82 .914 -4.43 8.10 10 -.61 1.98 1.000 -7.45 6.24 12 3.20 1.85 .514 -3.18 9.58
12 7 7.18 * 2.01 .007 -14.12 -.25 8 1.52 2.01 .974 -8.45 5.42 9 -1.37 1.73 .969 -7.33 4.60 10 -3.81 1.90 .349 -10.38 2.76 11 -3.20 1.85 .514 -9.58 3.18
*The mean difference is significant at the .01 level.

55
CHAPTER 5
FINDINGS, CONCLUSIONS, AND RECOMMENDATIONS
Findings
The purpose of this study was to determine whether computerized testing affected student
achievement. The study compared the test scores of students in the Apprentice Medical Services
Specialist Resident course who took the computer-administered Block One Tests to the test scores
of students who took the same Block One Tests in the traditional paper and pencil manner using
score sheets to record answers. By taking identical tests and holding as many factors as possible
constant, the results were conclusive. Some research was inconclusive and contradictory
(Federico & Liggett, 1989) because studies compared similar tests, but not exact test forms with
test items in the same order with the same time limitations for each testing method (Eignor, 1993;
Straetmans & Eggen, 1998).
The research population consisted of the 227 students who attended the 12 classes of the
Apprentice Medical Services Specialist Resident Course, J3AQR90230 003, at Sheppard Air Force
Base, Texas, during the nine months covered by the study from January through September 1994.
Block One Tests were administered at the end of the first block of instruction for each class. The
classes were tested at different times as dictated by the completion of the hours of instruction in the
Block One lesson plan. The lesson plan required a minimum of 71 ½ hours of instruction from the
time the class commenced until the Block One Test was administered. For the purpose of this
research, the students were considered individually rather than by class to ensure a large enough
sample for a robust test.

56
An independent samples t-test resulted in no significant difference between test administration
modes at the .01 level of significance. This addressed the research hypothesis of this study and
showed that there was no significant difference in achievement between tests administered in the
traditional paper and pencil mode and identical tests administered on computers. This refutes the
results of a study by Casey (1994) which found significant differences between test administration
modes. It also shows that Russell and Haney (1996) may have found significant differences in
students measured on computerized tests because they did not compare identical test forms.
A one-way analysis of variance on the classes tested on computers showed a significant
difference in Block One Test scores at the .05 level between class numbers 7 (M = 90.93) and 9 (M
= 85.12) and between class numbers 7 and 12 (M = 83.75). Further analysis of the data using the
Tukey HSD then resulted in a significant difference in Block One Test scores only between class
numbers 7 and 12 at the .01 level. The mean Block One Test scores by class (Table 2) showed a
much higher mean Block One Test score for class number 7 than for the other classes administered
the tests by computer. The mean Block One Test score for class number 12 was 7.18 points lower
than the mean Block One Test score for class number 7. Perhaps this difference in Block One Test
scores could be attributed to the fact that class number 7 was the first class in this study tested on
computers. The novelty of the computers may have contributed to this difference since the students
had not been exposed to computers in the class environment up to that point in the course. Perhaps
the sheer novelty of having the computers in the classroom prompted the students to pay closer
attention and perform better on the tests. The students also may have experienced a higher degree
of test anxiety when they realized they would be taking computer-administered tests as in the study
by Sieppert and Krysik (1996), introducing another factor that could have influenced test
performance.

57
Instructors never mentioned to the students taking the computer-administered Block One Tests
that they were part of an experiment. All the students who took the computer-administered
versions of the test attended the course during the same time frame. Although attendance dates for
class number 7 and class number 12 overlapped by about two months, it was unlikely that the
students in these classes had much interaction. By the time students in class number 12 arrived at
Sheppard Air Force Base, class number 7 had reached a point in their training where they probably
had more privileges and more freedom than the newly arrived class number 12. Additionally, the
two classes were on different shifts, which likely resulted in different lunch times. Generally,
fraternization between classes in different stages of training was discouraged to the point that they
were housed separately.
The scores for class number 12 were significantly lower than the scores for the other classes.
It is possible that some other demographic factor or individual characteristic such as age, race,
gender, student source, or education level influenced the test results in class number 12 resulting in
a lower class mean for Block One Test scores. Schwartz, Mullis, and Dunham (1998) attributed
testing differences to individual characteristics in their study. However, before attributing
achievement differences to individual characteristics, researchers should remember the warning of
Prieto and Delgado (1999) that the mediums used in gathering the information might be
contributing to the differences in test scores.
Betz and Weiss (1976) reported that motivation levels affected achievement. That could
explain the low attrition rate of one percent in the classes in this study. The higher mean age than
expected could have contributed to a greater maturity level of the students as well. The students in
this course were highly motivated to succeed since failure to successfully complete the course
resulted in not being certified and also in discharge from the military. The large percentage (58%)

58
of guard and reserve forces represented in the sample could have been a contributing factor to the
achievement level and to the low rate of attrition (1%) in the study. Typically, guard and reserve
personnel must take time off from their civilian jobs to attend military training. They may have
been motivated to succeed to prove to their civilian employer that their time away from work was
justified. Also, if they were civil service employees of the U. S. Air Force Reserve or the U. S. Air
National Guard, a condition of employment to keep their civilian position may have been to be a
member of that military unit. Failure to complete this course for those students would result in
discharge from the military and loss of their civilian position.
Conclusions
The study found no significant difference between test administration modes. This study
concluded that computer-administering tests identical to those typically administered in the
traditional paper and pencil manner had no significant effect on achievement. It is important to
note, however, that the conclusion may only be valid if the computer-administered test contains
exactly the same test items, in the same order and format, with the same layout, structure, and
choices as the traditional paper and pencil test. In other words, unless the tests are identical in
every possible way except the actual test administration mode this conclusion may not be
applicable. Although Bugbee and Bernt (1990) found student achievement on computer-
administered tests was sometimes better than traditional paper and pencil tests, this study could
refute their conclusion.
Although there was no significant difference in achievement found between test administration
modes in this study, test developers must still practice due diligence in developing valid and
reliable measures. Developing a meaningful computerized test requires more than entering a
traditional paper and pencil test into a computer (Swain, 1997). More emphasis might be placed on
59
emerging technologies to develop and test skills (Mastropieri, Scruggs, and Shiah, 1997) in
addition to knowledge (Burke, Hobson, & Linksy, 1997; Moffat, Hampson, and Hatzipantelis,
1998; Tirre and Raouf, 1998).
Recommendations
Computer-administered testing seems to be here to stay. There should be additional research
in the testing area as follows:
1. Explore technology to test the psychomotor domain as well as the cognitive domain.
2. Discretely gather data during testing that were previously unavailable to researchers, and
analyze them. This area of technology could be ready for further exploration and may
reveal useful information.
3. Test the ability of the students to perform tasks through simulation in addition to testing
subject matter knowledge. This could give a more accurate estimation of the success of
instruction than a simple test of knowledge and comprehension regardless of the quality of
the test.
4. Investigate the issue of test security. As reported by Stocking and Lewis (1998), this may
be an issue in a continuous testing environment.
5. Although there was no significant difference found between test administration modes in
this study, there is more to developing a computerized test than entering test items from a
traditional paper and pencil test into a computer. The test developer should still perform
due diligence in ensuring the reliability and validity of tests.
6. Some test items may perform differently on computer than they do on traditional paper and
pencil tests. For this reason, test developers should consider developing tests specifically

60
for computer administration and exploit the available technology to develop tests to
measure the actual skills of the students beyond knowledge and comprehension.

61
APPENDICES


65
REFERENCES
Air Training Command. (1991). Planning, development, and validation of training. (Air
Training Command Regulation 52-15). Randolph Air Force Base, Texas: U. S. Air Force.
Alderton, D. L. (1990, April). Revisiting a cognitive framework for test design: Applications
for a computerized perceptual speed test. Paper presented at the annual meeting of the American
Educational Research Association, Boston, MA.
Applegate, B. (1993). Construction of geometric analogy problems by young children in a
computer-based test. Journal of Educational Computing Research, 9 (1), 61-77.
Barncord, S.W., & Wanlass, R. L. (1999). Paper or plastic: Another ecological consideration
in neuropsychological assessment. Applied Neuropsychology, 6 (2), 121-122.
Bennett, R. E. (1994, October). An electronic infrastructure for a future generation of tests.
Paper presented at the annual meeting of the International Association for Educational Assessment,
Wellington, New Zealand.
Bergstrom, B. A. (1992, April). Ability measure equivalence of computer adaptive and pencil
and paper tests: A research synthesis. Paper presented at the annual meeting of the American
Educational Research Association, San Francisco, CA.
Bergstrom, B. A., & Lunz, M. E. (1992). Confidence in pass/fail decisions for computer
adaptive and paper and pencil examinations. Evaluation and the Health Professions. 15 (4), 453-
464.
Betz, N. E. (1977). Effects of immediate knowledge of results and adaptive testing on ability
test performance. Applied Psychological Measurement, 1 (2), 259-66.

66
Betz, N. E., & Weiss, D. J. (1976). Psychological effects of immediate knowledge of results
and adaptive ability testing: Research Report 76-4. (Office of Naval Research, Publication Number
ED129863). Arlington, VA. : Office of Naval Research.
Bicanich, E., Slivinski, T., Kapes, J. T., & Hardwicke, S. B. (1997). Internet-based testing: A
vision or reality? T.H.E. Journal, 25 (2), 61-64.
Bugbee, A. C., & Bernt F. M. (1990). Testing by computer: Findings in six years of use
1982-1988. Journal of Research on Computing in Education, 23, 87-100.
Bulkeley, W. M. (1998, December 24). Technology journal – Under the radar: ExamSoft lets
students take tests via laptops. The Wall Street Journal, p. B4.
Bunderson, C., Inouye, D., & Olsen, J. (1989). The four generations of computerized
education measurement. In Educational Measurement (3rd ed.), 367-407. NY: American Council
of Education: MacMillan.
Burke, E., Hobson, C., & Linksy, C. (1997). Large sample validations of three general
predictors of pilot training success. International Journal of Aviation Psychology, 7 (3), 225-234.
Butler, L. A. (1982). An investigation of the development, operation and evaluation of a
computer-assisted testing system: An application in the basic medical sciences (Doctoral
dissertation, University of Iowa, 1982). Dissertation Abstracts International, 43 (8), 2503.
Caldwell, J. A., & Ramspott, S. (1998). Effects of task duration on sensitivity to sleep
deprivation using the multi-attribute task battery. Behavior Research Methods, Instruments and
Computers, 30 (4), 651-660.
Campbell, K. A., Rohlman, D. S., Storzbach, D., Binder, L. M., Anger, W. K., Kovera, C. A.,
Davis, K. L., & Grossmann, S. J. (1999). Test-retest reliability of psychological and
neurobehavioral tests self-administered by computer. Assessment 6 (1), 21-32.

67
Casey, S. H. (1994). The effects of computer performance assessment on student scores in a
computer applications course (Doctoral dissertation, University of North Texas, 1994).
Dissertation Abstracts International, 56 (1), 166.
Clark, J. W., II, Fox, P. A., & Schneider, H. G. (1998). Feedback, test anxiety and performance
in a college course. Psychological-Reports, 82 (1), 203-208.
Cory, C. H. (1976). An evaluation of computerized tests as predictors of job performance: II.
Differential validity for global and job element criteria. Final Report. (Navy Personnel Research
and Development Center, Publication Number ED123248). San Diego, CA.
Cueto, S., Jacoby, E., & Pollitt, E. (1998). Breakfast prevents delays of attention and memory
functions among nutritionally at-risk boys. Journal of Applied Developmental Psychology, 19 (2),
219-234.
Davis, C., & Cowles M. (1989). Automated psychological testing: Method of administration,
need for approval, and measures of anxiety. Educational and Psychological Measurement, 49,
311-320.
Dillon, G. F. (1992). A comparison of traditional and computerized test modes and the effect
of computerization on achievement test performance (Paper and pencil test) (Doctoral dissertation,
Temple University, 1992). Dissertation Abstracts International, 53 (8), 4417.
Dillon, R. F., & Pellegrino, J. W. (1989). Testing: Theoretical and applied perspectives. New
York: Praeger.
Dimock, P.H., & Cormier, P. (1991). The effects of format differences and computer
experience on performance and anxiety on a computer-administered test. Measurement and
Evaluation in Counseling and Development 24, 119-126.

68
Douglas, K. M. (1990). A comparison of conventional and computerized adaptive
administration of the differential aptitude tests (Doctoral dissertation, University of Florida, 1990).
Dissertation Abstracts International, 51 (10), 3363.
Eignor, D. R. (1993, April). Deriving comparable scores for computer adaptive and
conventional tests: An example using the SAT. Paper presented at the annual meeting of the
National Council on Measurement in Education, Atlanta, GA.
Engdahl, B. (1991, August). Computerized adaptive assessment of cognitive abilities among
disabled adults. Paper presented at the annual meeting of the American Psychological Association,
San Francisco, CA.
Eswine, T. L. (1998). The effect of computer-administered standardized test administration on
the assessment of receptive language skills in preschool and school-age children. (Master’s thesis,
University of South Alabama, 1998). Dissertation Abstracts International, 36 (5), 1348.
Evans, R. M., & Surkan, A. J. (1977, June). Effect of computer-delivered testing on
achievement in a mastery learning course of study with partial scoring and variable pacing. Paper
presented at the Conference on Computers in the Undergraduate Curricula, East Lansing, MI.
Federico, P. A. (1989). Computer-based and paper-based measurement of recognition
performance. (Navy Personnel Research and Development Center, Publication Number
ED306308). San Diego, CA.
Federico, P. A., & Liggett, N. L. (1989). Computer-based and paper-based measurement of
semantic knowledge. (Navy Personnel Research and Development Center, Publication Number
ED303518). San Diego, CA.

69
Fletcher, P., & Collins, M. A. J. (1986-87). Computer-administered versus written
tests--advantages and disadvantages. Journal of Computers in Mathematics and Science Teaching,
6, 38-43.
Fuhrer, S. (1973). A comparison of a computer-assisted testing procedure and standardized
testing as predictors of success in community college technical mathematics (Doctoral dissertation,
New York University, 1973). Dissertation Abstracts International, 34 (6), 3086.
Garrison, W. M., & Baumgarten, B. S. (1986). An application of computer adaptive testing
with communication handicapped examinees. Educational and Psychological Measurement, 46
(1), 23-35.
Gershon, R. C., & Bergstrom, B. (1991, April). Individual differences in computer adaptive
testing: Anxiety, computer literacy and satisfaction. Paper presented at the annual meeting of the
National Council on Measurement in Education, San Francisco, CA.
Gruszka, A. (1999). Relationships between basic personality dimensions and the attentional
mechanism of cognitive inhibition. Polish Psychological Bulletin, 30 (2), 129-142.
Helgeson, S. L., & Kumar, D. D. (1993, April). Technological applications in science
assessment. Paper presented at the annual meeting of the National Science Teachers Association,
Kansas City, KS.
Johnson, D. F., & Mihal, W. L. (1973). Performance of blacks and whites in computerized
versus manual testing environments. American Psychologist, 28 (8), 694-699.
Jones, L. A., & Sorlie, W. E. (1976). Increasing medical student performance with an
interactive, computer-assisted appraisal system. Journal of Computer Based Instruction, 2 (3), 57-
62.

70
Kapes, J. T., & Vansickle, T. R. (1992). Comparing paper-pencil and computer-based
versions of the Harrington-O’Shea Career Decision-Making System. Measurement and Evaluation
in Counseling and Development, 25, 5-13.
Kent, T. H., McClain, D. H., & Wessels, S. W. (1974). Development of a student-paced
course in general pathology utilizing a computer managed evaluation system (Report No.
RIE031974). (ERIC Document Reproduction Service No. ED 084 279).
Krug, S. E. (1989, August). Solid state psychology: The impact of computerized assessment
on the science and practice of psychology. Paper presented at the annual meeting of the American
Psychological Association, New Orleans, LA.
Kuan, T. H. (1991). A comparison of paper-and pencil, computer-administered, computerized
feedback, and computerized adaptive testing methods for classroom achievement testing
(Computerized testing) (Doctoral dissertation, Mississippi State University, 1991). Dissertation
Abstracts International, 52 (5), 1719.
Lee, J. A., & Hopkins, L. (1985, March). The effects of training on computerized aptitude test
performance and anxiety. Paper presented at the annual meeting of the Eastern Psychological
Association, Boston, MA.
Lee, J. A., Moreno, K. E., & Sympson, J. B. (1986). The effects of mode of test administration
on test performance. Educational and Psychological Measurement, 46, 467-474.
Legg, S. M., & Buhr, D. C. (1990, April). Investigating differences in mean score on adaptive
and paper and pencil versions of the college level academic skills reading test. Paper presented at
the annual meeting of the National Council on Measurement in Education, Boston, MA.
Lichtenwald, T. G. (1987). An investigation of the validity, reliability, and acceptance by
children of a microcomputer administration of the ‘Peabody Picture Vocabulary Test – Revised’

71
(Doctoral dissertation, California School of Professional Psychology - Fresno, 1987). Dissertation
Abstracts International, 48 (7), 2137.
Llabre, M. M., Clements, N. E., Fitzhugh, K. B., Lancelotta, G., Mazzagatti, R. D., &
Quinones, N. (1987). The effect of computer-administered testing on test anxiety and
performance. Journal of Educational Computing Research, 3, 429-433.
Lord, F. M. (1977). Some item analysis and test theory for a system of computer-assisted test
construction for individualized instruction. Applied Psychological Measurement, 1 (3), 447-55.
Luecht, R. M., & Nungester, R. J. (1998). Some practical examples of computer-adaptive
sequential testing. Journal of Educational Measurement, 35 (3), 229-249.
Lynch, E. J. (1997). Equivalence of computer versus paper and pencil academic testing in an
introductory psychology course (Doctoral dissertation, Arizona State University, 1997).
Dissertation Abstracts International, 58 (3), 833.
Marcus, A. D. (1999, August 27). Exam Time: SAT stress isn’t just for students; The ETS is
under pressure, too; Educational Testing Service faces tough new world filled with competition;
Leaned on by College Board. The Wall Street Journal, p. A1.
Mastropieri, M. A., Scruggs, T. E., Shiah, R. L. (1997). Can computers teach problem-solving
strategies to students with mild mental retardation? A case study. Remedial and Special Education,
18 (3), 157-165.
Mayer, D. P. (1998). Do new teaching standards undermine performance on old tests?
Educational Evaluation and Policy Analysis, 20 (2), 53-73.
Mazzeo, J. (1991). Comparability of computer and paper and pencil scores for two CLEP
general examinations. College Board Report No. 91-5. [On-line.] Abstract from: Computer file:
ERIC-Current: ED344902

72
Mazzeo, J., & Harvey, A. L. (1988). The equivalence of scores from automated and
conventional educational and psychological tests: A review of the literature (College Board Report
No. 88-8). Princeton, NJ: Educational Testing Service.
McBride, J. R. (1998). Innovations in computer-based ability testing: Promise, problems, and
perils. In Beyond multiple choice: Evaluating alternatives to traditional testing for selection, 23-39.
NJ: Lawrence Erlbaum Associates, Inc.
McDonald, J., Beal, J., & Ayers, F. (1992). Details of performance on computer and paper
administered versions of a test of whole number computation skills. Focus on Learning Problems
in Mathematics, 14 (3), 15-27.
Microsoft Office 97 [Computer software]. (1997). Redmond, WA: Microsoft Corporation.
Miles, E. W., & King, W. C., Jr. (1998). Gender and administration mode effects when pencil-
and-paper personality tests are computerized. Educational and Psychological Measurement, 58 (1),
68-76.
Miller, L. T., & Vernon, P. A. (1997). Developmental changes in speed of information
processing in young children. Developmental Psychology, 33 (3), 549-554.
Moffat, S. D., Hampson, E., & Hatzipantelis, M. (1998). Navigation in a "virtual" maze: Sex
differences and correlation with psychometric measures of spatial ability in humans. Evolution and
Human Behavior, 19 (2), 73-87.
Neubauer, A. C., & Knorr, E. (1998). Three paper-and-pencil tests for speed of information
processing: Psychometric properties and correlations with intelligence. Intelligence, 26 (2), 123-
151.
Neuman, G., & Baydoun, R. (1998). Computerization of paper and pencil test: When are they
equivalent? Applied Psychological Measurement, 22 (1), 71-83.

73
Olsen, J. B., Maynes, D. D., Slawson, D., & Ho, K. (1989). Comparisons of paper-
administered, computer-administerd and computerized adaptive achievement tests. Journal of
Educational Computing Research, 5, 311-326.
Osin, L., & Nesher, P. (1989). Comparison of student performance in arithmetic exercises:
TOAM vs. paper and pencil testing. International Journal of Man Machine Studies, 31 (3), 293-
313.
Parshall, C. G. (1993). Computer testing vs. paper and pencil testing: An analysis of examinee
characteristics associated with mode effects on the GRE General Test (Doctoral dissertation,
University of South Florida, 1992). Dissertation Abstracts International, 54 (1), 155.
Parshall, C. G., & Kromrey, J. D. (1993, April). Computer testing versus paper and pencil
testing: An analysis of examinee characteristics associated with mode effect. Abstract from: ERIC
Abstract No. ED363272. Paper presented at the annual meeting of the American Educational
Research Association, Atlanta, GA.
Pascualvaca, D. M., Fantie, B. D., Papageorgiou, M., & Mirsky, A. F. (1998). Attentional
capacities in children with autism: Is there a general deficit in shifting focus? Journal of Autism
and Developmental Disorders, 28 (6), 467-478.
Plake, B. S. (1993). Applications of educational measurement: Is optimum optimal?
Educational Measurement: Issues and Practice, 12 (1), 5-10.
Ponsoda, V., Wise, S. L., Olea, J., & Revuelta, J. (1997). An investigation of self-adapted
testing in a Spanish high school population. Educational and Psychological Measurement 57 (2),
210-221.
Prieto, G., & Delgado, A. R. (1999). The effect of instructions on multiple-choice test scores.
European Journal of Psychological Assessment, 15 (2), 143-150.

74
Prieto, G., & Delgado, A. R. (1999). The role of instructions in the variability of sex-related
differences in multiple-choice tests. Personality and Individual Differences, 27 (6), 1067-1077.
Reardon, R., & Loughead, T. (1988). A comparison of paper and pencil and computer
versions of the Self-Directed Search. Journal of Counseling and Development, 67, 249-252.
Reckase, M. D. (1986). The use of tailored testing with instructional Programs. Final Report.
(Office of Naval Research, Publication Number ONR-86-1). Arlington, VA.
Robson, A. T. (1997). A comparison of preschoolers’ performance on conventional and
computerized versions of the PPVT-R (Peabody Test) (Master’s Thesis, University of Manitoba,
1998). Dissertation Abstracts International, 36 (2), 639.
Ronau, R. N., & Battista, M. T. (1988). Microcomputer versus paper and pencil testing of
student errors in ratio and proportion. Journal of Computers in Mathematics and Science Teaching,
7 (3), 33-38.
Russell, M., & Haney, W. (1996). Testing writing on computers: Results of a pilot study to
compare student writing test performance via computer or via paper and pencil. Paper presented at
the Mid-Atlantic Alliance for Computers and Writing Conference, Chestnut Hill, MA.
Russell, M., & Haney, W. (1997). Testing writing on computers: An experiment comparing
student performance on tests conducted via computer and via paper and pencil. Education Policy
Analysis Archives, 5 (3).
SPSS for Windows 8.0 [Computer software]. (1997). Chicago, IL: SPSS, Inc.
Sandals, L. (1992). An overview of the uses of computer-based assessment and diagnosis.
Canadian Journal of Educational Communication, 21, 67-78.

75
Sarvela, P. D., & Noonan, J. V. (1987, April). Testing and computer-based instruction:
Psychometric considerations. Paper presented at the annual meeting of the American Educational
Research Association, Washington, DC.
Schaeffer, G. A., Reese, C. M., Manfred, S., McKinley, R. L., & Mills, C.N. (1993). Field test
of a computer-based GRE general test. (GRE Board Professional Report No. 88-08P). Princeton,
NJ: Educational Testing Service.
Schnipke, D. L., & Pashley, P. J. (1997, March). Assessing subgroup differences in item
response times. Paper presented at the annual meeting of the American Educational Research
Association, Chicago, IL.
Schnipke, D. L., & Reese, L. M. (1997, March). A comparison of testlet-based test designs for
computerized adaptive testing. Paper presented at the annual meeting of the American Educational
Research Association, Chicago, IL.
Schwartz, S. J., Mullis, R. L., & Dunham, R. M. (1998). Effects of authoritative structure in
the measurement of identity formation: Individual computer-managed versus group paper and
pencil testing. Computers in Human Behavior, 14 (2), 239-248.
Scrams, D. J. & Schnipke, D. L. (1997, March). Making use of response times in standardized
tests: Are accuracy and speed measuring the same thing? Paper presented at the annual meeting of
the American Educational Research Association, Chicago, IL.
Seebo, E. K. (1991). Comparative effectiveness of paired versus individual learning of
cognitive skills using computer-based instruction (Doctoral dissertation, University of North Texas,
1991). Dissertation Abstracts International, 52 (12), 4303.
Shermis, M. D., & Lombard, D. (1998). Effects of computer-based test administrations on test
anxiety and performance. Computers in Human Behavior, 14 (1), 111-23.

76
Sieppert, J. D., & Krysik, J. (1996). Computer-based testing in social work education: A
preliminary exploration. Computers in Human Services, 13 (1), 43-61.
Stocking, M. L., & Lewis, C. (1998). Controlling item exposure conditional on ability in
computerized adaptive testing. Journal of Educational and Behavioral Statistics, 23 (1), 57-75.
Straetmans, G. J. J. M., & Eggen, T. J. H. M. (1998). Computerized adaptive testing: What it
is and how it works. Educational Technology, 38 (1), 45-52.
Sukigara, M. (1996). Equivalence between computer and booklet administrations of the new
Japanese version of the MMPI. Educational and Psychological Measurement, 56 (4), 570-584.
Swain, C. R. (1997). A comparison of a computer-administered test and a paper and pencil
test using normally achieving and mathematically disabled young children (Doctoral dissertation,
University of North Texas, 1997). Dissertation Abstracts International, 58 (3), 835.
Thompson, S. B. N., & Berry, A. (1998). Neuroimaging and neuropsychology in the cognitive
rehabilitation of stroke and head injury. Journal of Cognitive Rehabilitation, 16 (6), 4-10.
Tirre, W. C., & Raouf, K. K. (1998). Structural models of cognitive and perceptual-motor
abilities. Personality and Individual Differences, 24 (5), 603-614.
U. S. Air Force. (1986). Instructional System Development. (Air Force Regulation 50-2).
Washington, DC: Author.
U. S. Air Force. (1991). USAF Formal Schools. (Air Force Regulation 50-5). Washington,
DC: Author.
Vansickle, T. R., & Kapes, J. T. (1988, April). Equivalence of computer-based and paper-
pencil administrations of the Strong-Campbell Interest Inventory. Paper presented at the annual
meeting of the American Educational Research Association, New Orleans, LA.

77
Vansickle, T. R., Kimmel, C., & Kapes, J. T. (1989). Test-retest equivalency of the computer-
based and paper-pencil version of the Strong-Campbell Interest Inventory. Measurement and
Evaluation in Counseling and Development, 22 (2), 88-93.
Vispoel, W. P. (1998). Psychometric characteristics of computer-adaptive and self-adaptive
vocabulary tests: The role of answer feedback and test anxiety. Journal of Educational
Measurement, 35 (2), 155-167.
Vispoel, W. P., & Coffman, D. D. (1992). Computerized adaptive testing of music-related
skills. Bulletin of the Council for Research in Music Education, 112, 29-49.
Vispoel, W. P., Wang, T., de la Torre, R., Bleiler, T., & Dings, J. (1992, April). How review
options and administration modes influence scores on computerized vocabulary tests. Paper
presented at the annual meeting of the American Educational Research Association, San Francisco,
CA.
Vockell, E. L., & Hall, J. (1989). Computerized test construction. The Social Studies, 80,
114-121.
Wainer, H. (1993). Some practical considerations when converting a linearly administered test
to an adaptive format. Educational Measurement: Issues and Practice, 12 (1), 15-20.
Walkstein, C. M. (1995). Computer-based psychological testing: Format differences and
methodological reflections. Travail Humain, 58 (1), 47-69.
Ward, B. C. (1994). Student and teacher attitudes concerning computer adaptive testing
methods in a middle school setting (Doctoral dissertation, University of Maryland-College Park,
1994). Dissertation Abstracts International, 55 (10), 3062.

78
Waring, D. A., Farthing, C. B., & Kidder-Ashley, P. (1999). Impulsive response style affects
computer-administered multiple-choice test performance. Journal of Instructional Psychology, 26
(2), 121-128.
Weiss, D. J., & Betz, N. E. (1973). Ability measurement: Conventional or adaptive? (Office
of Naval Research, Publication Number RR-73-1). Arlington, VA.
Wildgrube, W. (1982, July). Computerized testing in the German Federal Armed Forces
(FAF): Empirical approaches. Paper presented at the meeting of the Item Response Theory and
Computerized Adaptive Testing Conference, Wayzata, MN.
Wilkinson, L. (1999). Graphs for research in counseling psychology. Counseling
Psychologist, 27 (3), 384-407.
Williamson, A. M. (1996). Historical overview of computerized behavioral testing of humans
in neurotoxicology. Neurotoxicology and Teratology, 18 (4), 351-357.
Windows 98 [Computer software]. (1997). Redmond, WA: Microsoft Corporation.
Wise, S. L. (1997, March). Examinee issues in CAT. Paper presented at the annual meeting
of the National Council on Measurement in Education, Chicago, IL.
Wise, S. L. (1999, April). Comparison of stratum scored and maximum-likelihood scored
CATs. Paper presented at the annual meeting of the National Council on Measurement in
Education, Montreal, Quebec, Canada.
Wise, S. L., Plake, B. S., Johnson, P. L., & Roos, L. L. (1992). A comparison of self-adapted
and computerized adaptive tests. Journal of Educational Measurement, 29 (4), 329-339.
Wise, S. L., Plake, B. S., Pozehl, B. J., Boettcher-Barnes, L., & Lukin, L. E. (1989).
Providing item feedback in computer-based tests: effects of initial success and failure. Educational
and Psychological Measurement, 49, 479-486.