comparison of compressive strength test …etd.lib.metu.edu.tr/upload/12612506/index.pdf · for...
TRANSCRIPT

COMPARISON OF COMPRESSIVE STRENGTH TEST PROCEDURES FOR BLENDED CEMENTS
A THESIS SUBMITTED TO THE GRADUATE SCHOOL OF NATURAL AND APPLIED SCIENCES
OF
MIDDLE EAST TECHNICAL UNIVERSITY
BY
ELÇİN ÜLKER
IN PARTIAL FULLFILLMENT OF THE REQUIREMENTS
FOR THE DEGREE OF MASTER OF SCIENCE
IN
CEMENT ENGINEERING
SEPTEMBER 2010

Approval of the thesis:
COMPARISON OF COMPRESSIVE STRENGTH TEST PROCEDURES FOR BLENDED
CEMENT
submitted by ELÇİN ÜLKER in partial fulfillment of the requirements for the degree of Master of Science in Cement Engineering Department, Middle East Technical University by,
Prof. Dr. Canan Özgen
Dean, Graduate School of Natural and Applied Sciences Prof. Dr. Asuman Türkmenoğlu
Head of Department, Cement Engineering Dept., METU Assoc. Prof. Dr. İsmail Özgür Yaman
Supervisor, Civil Engineering Dept., METU
Prof. Dr. Abdullah Öztürk
Co-Supervisor, Metallurgical and Materials Engineering Dept., METU
Examining Committee Members:
Prof. Dr. Mustafa Tokyay Civil Engineering Dept., METU
Prof. Dr. Çetin Hoşten Mining Engineering Dept., METU
Prof. Dr. Abdullah Öztürk
Metallurgical and Materials Engineering Dept., METU
Assoc. Prof. Dr. İsmail Özgür Yaman
Civil Engineering Dept., METU
Assoc. Prof. Dr. Ömer Kuleli
Cement Engineering Dept., METU
Date: 15.09.2010
iii
I hereby declare that all information in this document has been obtained and presented in accordance with academic rules and ethical conduct. I also declare that, as required by these rules and conduct, I have fully cited and referenced all material and results that are not original to this work.
Name, Last name : Elçin Ülker
Signature :

iv
ABSTRACT
COMPARISON OF COMPRESSIVE STRENGTH TEST PROCEDURES
FOR BLENDED CEMENT
Ülker, Elçin
M.Sc., Department of Cement Engineering
Supervisor: Assoc. Prof. Dr. İsmail Özgür Yaman
Co-Supervisor: Prof. Dr. Abdullah Öztürk
September 2010, 87 pages
The aim of this thesis is to twofold, in order to demonstrate the variabilities that can
be faced within the compressive strength of blended cements, one blended cement
namely CEM IV / B (P-V) 32.5N is selected and the 28-day compressive strength is
obtained by 16 different laboratories following TS EN 196-1 standard. Later, to show
the variabilities that could be faced by different standards, three different cement
types were selected and their compressive strengths are determined following two
procedures first with TS EN 196-1, later with similar procedure described in ASTM.
The strength of cement is determined by TS EN 196-1 in Turkey that is the same for
all types of cements. However, American cement producers use different standards
for testing the strength of Portland cement and blended cements. The main
difference is the amount of water utilized in producing the cement mortar.

v
It was observed that for Portland and Portland composite cements; there is not any
significant difference in between the compressive strength results of cement
mortars prepared by both methods. However, for pozzolanic cements, there is
much deviance in the compressive strength results of cement mortars prepared by
TS EN 196-1.
Keywords: Compressive Strength, Inter-laboratory test comparison, Reproducibility
and Repeatability, Mortar

vi
ÖZ
KATKILI ÇİMENTO İÇİN BASINÇ DAYANIM DENEY
YÖNTEMLERİNİN KARŞILAŞTIRILMASI
Ülker, Elçin
Yüksek Lisans, Çimento Mühendisliği Bölümü
Tez Yöneticisi: Doç. Dr. İsmail Özgür Yaman
Ortak Tez Yöneticisi: Prof. Dr. Abdullah Öztürk
Eylül 2010, 87 sayfa
Bu tezin amacı, katkılı çimentoların basınç dayanımında karşılaşılan değişkenliği
göstermek için CEM IV / B (P-V) 32.5N tip bir katkılı çimento seçilerek 28 günlük
basınç dayanımı TS EN 196-1 standardına uygun olarak 16 laboratuvarda
gerçekleştirilmesiyle ikiye ayrılmaktadır. Sonra, farklı standardlarla karşılaşılabilecek
değişiklikleri göstermek amacıyla 3 farklı çimento seçilmiş ve bunların basınç
dayanımları 2 yönteme göre, ilki TS EN 196-1, ikincisi ATSM’de belirtilen yönteme
benzer şekilde belirlenmiştir.
Türkiye’de çimentonun dayanımı tüm çimento tipleri için aynı olan TS EN 196-1 ile
belirlenmektedir. Ancak, Amerikan çimento üreticileri portland ve katkılı
çimentoların dayanım tayini için farklı Standardlar kullanmaktadırlar. Temel farklılık
çimento harcı oluşturulurken kullanılan su miktarındadır.

vii
Bu çalışma sonucunda, Portland ve Portland kompoze çimentolarda iki yöntemi
kullanılarak elde edilen harçların basınç dayanım sonuçları arasında hiçbir farklılık
olmadığı görülmüştür. Ancak, Puzolanik çimentolarda TS EN 196-1 yöntemiyle elde
edilen harçların basınç dayanım sonuçlarında çok fazla sapmalar olduğu
gözlenmiştir.
Anahtar Sözcükler: Basınç Dayanımı, Laboratuvarlar Arası Karşılaştırma, Tekrar
Edilebilirlik ve Tekrar Üretilebilirlik, Harç

viii
To my father,
ix
ACKNOWLEDGMENTS
I would like to express my sincere gratitude to my Supervisor
Assoc. Prof. Dr. İsmail Özgür Yaman, for all motivation, encouragement, guidance
and patience he provided during the study period and my entire graduate
education.
I would also like to express my deepest regards to my Co-Supervisor Prof. Dr.
Abdullah Öztürk for his valuable discussion and support, contributions, guidance
and patience.
Sincere thanks are extended to OYAK Bolu Cement Factory for supplying all the
cements that I used throughout my thesis study.
I appreciate the help provided by Burhan Aleessa Alam and Selim Topbaş especially
for their assistance in the analysis of cements.
I would also like to thank the members of the thesis committee Prof. Dr. Mustafa
Tokyay, Prof. Dr. Çetin Hoşten and Assoc. Prof. Dr. Ömer Kuleli for their precious
discussion, guidance, suggestions, contributions and support to this study.
I would express my endless thank to my family for their understanding and
encouragement during the thesis study.
Finally, I would like to thank my love Can Bayseferoğulları for his endless love and
inimitable moral help in the hard times of this study.

x
TABLE OF CONTENTS
ABSTRACT ................................................................................................................. iv
ÖZ............................................................................................................................. vi
ACKNOWLEDGMENTS............................................................................................... ix
TABLE OF CONTENTS .................................................................................................x
LIST OF TABLES ....................................................................................................... xiv
LIST OF FIGURES....................................................................................................... xv
ABBREVIATIONS...................................................................................................... xvi
CHAPTERS
1. INTRODUCTION......................................................................................................1
1.1. General...........................................................................................................1
1.2. Objective and Scope of the Thesis ..................................................................3
2. THEORETICAL CONSIDERATIONS ............................................................................5
2.1. Portland Cement ............................................................................................5
2.2 Quality Control Applications in Cement ...........................................................6
2.2.1 Conformity Evaluation of Cement..........................................................8
2.2.1.2 Statistical Analysis According to TS EN 197-2 Annex A................15
2.3 Main Constituents of Cement........................................................................18
2.3.1 Pozzolanic Materials ............................................................................19
2.3.1.1 Natural Pozzolan (P, Q) ..............................................................19
2.3.1.2 Artificial Pozzolan.......................................................................21
2.3.1.2.1 Silica fume (D)................................................................... 21
2.3.1.2.2 Granulated Blast Furnace Slag (S) ..................................... 21
2.3.1.2.3 Fly Ash (V, W) ................................................................... 22
2.3.2 Limestone (L, LL) ..................................................................................23
2.3.3 Effects of the Mineral Additives on Mortar and Concrete Properties ...23

xi
2.3.3.1 Water Requirement ...................................................................23
2.3.3.2 Workability ................................................................................24
2.3.3.3 Strength .....................................................................................25
2.4 Factors Affecting Concrete Strength ..............................................................25
2.4.1 Materials and Their Mixing Proportions...............................................27
2.4.2 Test Method ........................................................................................27
2.5 Importance of Flow .......................................................................................28
2.6 Inter-Laboratory Test Comparison.................................................................29
3. INTER-LABORATORY EVALUATION OF STRENGTH TEST RESULTS..........................32
3.1 Inter-Laboratory Test Evaluation Procedure ..................................................32
3.1.1 Acceptance of Test Results ..................................................................32
3.1.2 Omission of Outliers ............................................................................32
3.1.3 Evaluation of the Test Results ..............................................................35
3.1.4 Calculation of the Repeatability and Reproducibility............................36
3.2 Comparison of the Test Results by Using Mann-Whitney Test Method..........37
3.3 Results of CEM IV / B (P-V) 32.5N ..................................................................38
3.3.1 Acceptance of the Test Results ............................................................42
3.3.2 Omission of Outliers ............................................................................43
3.3.3 Confidence Interval of the Test Results................................................46
3.3.4 Calculation of the Repeatability and Reproducibility............................47
3.3.5 Comparison According to Mann-Whitney Test.....................................48
4. EXPERIMENTAL PROGRAM...................................................................................50
4.1 General .........................................................................................................50
4.2 Materials .......................................................................................................50
4.3 Mixture preparation ......................................................................................51
4.4 Chemical composition of cements .................................................................51
4.5 Fineness of cements ......................................................................................52
4.5.1 Specific Surface – Blaine Fineness .................................................52
4.5.2 Particle Size Distribution (PSD) ......................................................52

xii
4.5.3 Sieve Analysis................................................................................52
4.6 Tests on Mortars ...........................................................................................53
4.6.1 Slump Flow Diameter ..........................................................................53
4.6.2 Compressive Strength Test ..................................................................53
5. EXPERIMENTAL RESULTS......................................................................................54
5.1 General .........................................................................................................54
5.2 CEM I 42.5R...................................................................................................54
s ...................................................................................................................55
5.2.1 Acceptance of the Results....................................................................56
5.2.2 Omission of Outliers ............................................................................57
5.2.3 Confidence Interval of the Test Results................................................57
5.2.4 Calculation of the Repeatability and Reproducibility............................59
5.2.5 Comparison According to Mann-Whitney Test.....................................60
5.3 CEM II / A-M (P-S) 42.5R................................................................................61
5.3.1 Acceptance of the Results....................................................................63
5.3.2 Omission of Outliers ............................................................................64
5.3.3 Confidence Interval of the Test Results................................................64
5.3.4 Calculation of the Repeatability and Reproducibility............................65
5.3.5 Comparison According to Mann-Whitney Test.....................................67
5.4 CEM IV / B (P) 32.5R ......................................................................................67
5.4.1 Acceptance of the Results....................................................................70
5.4.2 Omission of Outliers ............................................................................71
5.4.3 Confidence Interval of the Test Results................................................71
5.4.4 Calculation of the Repeatability and Reproducibility............................73
5.4.5 Comparison According to Mann-Whitney Test.....................................74
6. SUMMARY AND CONCLUSIONS............................................................................75
6.1 General .........................................................................................................75
6.2 Recommendations for further studies ...........................................................76
REFERENCES ............................................................................................................77

xiii
APPENDIX A .............................................................................................................81
KOLMOGOROV-SMIRNOV TEST RESULTS .................................................................81
APPENDIX B .............................................................................................................85
CHEMICAL AND PHYSICAL ANALYSIS OF CEMENTS...................................................85

xiv
LIST OF TABLES
TABLES
Table 2.1 Attestation of Conformity Systems Requirements [7] .................................7
Table 2.2 Mechanical and Physical Requirements of Cement [6]................................9
Table 2.3 Chemical Requirements of Cement [6]......................................................10
Table 2.4 Minimum Testing Frequency for the Autocontrol Tests and Statistical
Analysis Procedure [6] .............................................................................11
Table 2.5 Allowable Number of Test Results Outside ...............................................14
Table 2.6 Percentage of Cement Composition According to TS EN 197-1 [6]. ...........20
Table 3.1 Critical Values for Grubb’s Test .................................................................34
Table 3.2 t-Table ......................................................................................................35
Table 3.3 The Mix Proportions of CEM IV / B (P-V) 32.5N.........................................38
Table 3.5 The List of the Rejected and Accepted Results of CEM IV / B (P-V) 32.5N..43
Table 3.7 The Repeatability and the Reproducibility of CEM IV / B (P-V) 32.5N .......48
Table 3.8 The Comparison of CEM IV / B (P-V) 32.5N Results ...................................49
Table 4.1 Mix Proportions of CEM I 42.5R, CEM II / A-M (P-S) 42.5R ........................51
Table 5.2 Standard Deviation and COV of the Repeatability and the Reproducibility.59
Table 5.3 The Comparison of CEM I 42.5R Results....................................................60
Table 5.5 The Repeatability and the Reproducibility of CEM II / A-M (P-S) 42.5R.....66
Table 5.6 The Comparison of CEM II / A-M (P-S) 42.5R Results.................................67
Table 5.8 The Repeatability and the Reproducibility of CEM IV / B (P) 32.5R ...........73
Table 5.9 The Comparison of CEM IV / B (P) 32.5R Results .......................................74

xv
LIST OF FIGURES
FIGURES
Figure 1.1 Yearly Cement Production in Turkey [1].....................................................1
Figure 2.2 Progress of the Coefficient of Variance for 1, 2 and 28-day Compressive
Strength [21] ...........................................................................................31
Figure 3.1 The Minimum and Maximum Single Compressive Strength Test Results of
Cement Mortar Prepared by CEM IV / B (P-V) 32.5N................................41
Figure 3.2 Average Compressive Strength of CEM IV / B (P-V) 32.5N as Obtained by
Different Laboratories .............................................................................42
Figure 3.3 The Means of the Standard Compressive Strength of the Laboratories
Included in the Analysis ...........................................................................47
Figure 5.1 The Average Compressive Strength of CEM I 42.5R .................................56
Figure 5.2 95% Confidence Interval for CEM I 42.5R.................................................58
Figure 5.3 The Average Compressive Strength of CEM II / A-M (P-S) 42.5R..............63
Figure 5.4 95% Confidence Interval for CEM II / A-M (P-S) 42.5R..............................65
Figure 5.5 The Average Compressive Strength of CEM IV / B (P) 32.5R.....................70
Figure 5.6 95% Confidence Interval for CEM IV / B (P) 32.5R ....................................72

xvi
ABBREVIATIONS
AoC : Attestation of Conformity
ASTM : American Society for Testing Materials
COV : Coefficient of Variance
CPD : Construction Products Directive
EN : European Norm
FPC : Factory Production Control
ITT : Initial Type Test
METU : Middle East Technical University
PSD : Particle Size Distribution
TCMA : Turkish Cement Manufacturers’ Association
TCMA – CQE : Turkish Cemet Manufacturers’ Association – Council for Quality and
Environment Economic Enterprise
TOC : Total Organic Carbon
TS : Turkish Standard
XRF : X-Ray fluorescence

1
CHAPTER 1
INTRODUCTION
1.1. General
The cement industry is one of the important components of Turkish economy.
According to yearly statistics obtained from Turkish Cement Manufacturers’
Association (TCMA) as shown in Figure 1.1, cement production reached 54 Mt in
2009, it increases day by day as the demand for civil infrastructures and buildings
such as houses, offices increases.
0
10
20
30
40
50
60
Pro
du
ctio
n (
Mt)
1996 1998 2000 2002 2004 2006 2008
Time (Year)
Figure 1.1 Yearly Cement Production in Turkey [1]

2
Cement sector has been one of the most energy intensive industries in the world. In
order to produce one tone of cement, 60 to 130 kg of fuel oil or its equivalent and
about 105 kWh of electricity are required depending on the cement type and its
production process [2]. Thus, the trend is to use environmental friendly products.
Since the cement sector consumes natural resources, the key objective for cement
manufacturers is to achieve the environmental sustainability. To achieve this goal, a
range of regulations and policies, foster resource efficient and eco-friendly products
and raise consumer awareness in Europe is put in force [3]. Due to the regulations,
policies and environmental sustainability, cement producers have made several
changes on their processes and product ranges. Nowadays, cement manufacturers
are utilizing additives, mostly pozzolanic in nature, to decrease the clinker content
of the cement. In general, cements produced with additives are called blended
cements.
Utilizing additives in cement production may have influences on the cement
properties and thus, its quality. In the past, Turkey was frequently subjected to
earthquakes and thousands of people were killed or injured during the earthquakes.
Poor quality construction materials are one of the reasons for these incidents. Since
the cement is an important constituent of concrete, quality of cement also plays an
important role in preventing these looses. Therefore, there is a necessity to check
and enhance the properties of the blended cements.
The strength of cement is determined by TS EN 196-1 in Turkey that is the same for
all types of cements. However, American cement producers use different standards
for testing the strength of Portland cement and blended cements. The main
difference is the amount of water utilized in producing the cement mortar.

3
1.2. Objective and Scope of the Thesis
This study consists of two parts. The main objective is to show the discrepancies in
cement compressive strength testing standards used for various types of cements.
In the first part, blended cement called CEM IV / B (P-V) 32.5N was tested in 16
laboratories according to TS EN 196-1. Water to cement ratio was set to 0.5. The
aim of this part is to determine whether the test method used to determine the
compressive strength of blended cement is appropriate.
In the second part, two different compressive strength test methods were applied
to three different types of cements; namely CEM I 42.5R, CEM II / A-M (P-S) 42.5R
and CEM IV / B (P) 32.5R. The first method is the same as described in TS EN 196-1.
Whereas in the second method the ASTM standards, in which the slump flow was
set at a constant value, for blended cements was followed. Therefore, mortars
having different water to cement ratio were tested. The objective of this part is to
compare the test methods and to determine the best test method for blended
cements.
Within the scope of this study, this thesis consists of six chapters:
In Chapter 2, the history of cement is explained briefly. Then, since the quality of
cement is important, the quality control application for cement is outlined. In
addition, main constituents used in the cement production and their effects on the
properties of cement are briefly mentioned. Moreover, the factors affecting
compressive strength of concrete and finally, the importance of flow on cement
mortar and concrete are described.
In Chapter 3, the inter-laboratory test evaluation and the statistical analysis
program used in this study are described. In addition, an inter laboratory test

4
evaluation organized by Turkish Cement Manufacturers’ Association Council for
Quality and Environment Economic Enterprise is given.
In Chapter 4, the properties of materials used in the study and the details of the
tests performed on the samples are given. Moreover, the experimental program
along with the mixture ratio is provided.
In Chapter 5, compressive strength test results of cement types CEM I 42.5R, CEM II
/ A-M (P-S) 42.5R and CEM IV / B (P) 32.5R and their inter-laboratory test
evaluations are presented. Data are discussed. Also, statistical analysis performed
on the compressive strength of the cements is given.
Chapter 6 presents the conclusions of the study resulting from the findings of the
tests, observations, and the recommendations to future researchers.

5
CHAPTER 2
THEORETICAL CONSIDERATIONS
2.1. Portland Cement
Cement is a binder which mainly consists of compounds of calcium, silicium,
aluminum, iron and small amounts of other materials. The cements used in
concrete production are called hydraulic cements which set and harden after
being combined with water.
In the earliest of the 19th century, Joseph Aspdin, a bricklayer, first made a
hydraulic cement called Portland cement whose name was given since the
hardened cement resembles the color and quality of Portland stone [4]. Since
then, Portland cement is produced by intimately mixing together calcareous and
argillaceous, or other silica-, alumina-, and iron oxide bearing materials, burning
them in a kiln at a temperature of about 1450°C, and grinding the resulting
clinker with a small amount (3-5%) of gypsum [5].
There are many types of cements defined in different standards. In the
harmonized Turkish standard TS EN 197-1, there are 27 different main types of
cement and 6 different strength classes for cement which totally makes 162
possible cement types. This standard covers both for Portland and blended
cements. Whereas in American standards three types of standards exist; one is
for various types of Portland cement ASTM C 150, second is for blended cements
ASTM C 595 and third is for a broad performance based specs ASTM C 1157.
6
2.2 Quality Control Applications in Cement
Cement is one of the construction products mentioned in Council Directive
89/106/EEC, i.e. Construction Products Directive (CPD). In order to provide free
movement of cement throughout the whole European countries, a mark called
CE Mark, the notation of French word phrase “Conformité Européenné”
demonstrating the product satisfies the requirements set by harmonized
national laws and regulations, must be affixed also in Turkey where this
European Directive is also put into force in the scope of EU harmonization
process [6]. However, several conformity applications are performed whether it
is suitable to affix CE Mark to these products or not.
In general, for the attestation of conformity (AoC) of construction products,
there are four different conformity control systems namely 1, 1+, 2, 2+, 3 and 4
as presented in Table 2.1. According to these AoC systems, responsibilities are
defined for manufacturers or both for manufacturers and notified bodies. The
responsibilities are defined regarding to the risks of the products. For example,
products within the AoC system 1+ have the highest risk, whereas the products
within the AoC system 4 have the lowest risk [7].
Cement, being a transportable construction product, is evaluated in the AoC
system 1+. Thus, there is an independent and impartial body notified by
European Commission, which is called notified body, takes place in the
attestation of conformity [7]. In this type of AoC system, by notified bodies, not
only the factory and factory production control are checked, but also quality of
the final product is checked by taking samples from the factory.

7
Table 2.1 Attestation of Conformity Systems Requirements [7]
Attestation of Conformity Systems
1+ 1 2+ 2 3 4
Factory Production
Control (FPC) ✓ ✓ ✓ ✓ ✓ ✓
Initial Type Test (ITT)
of Product ✓ ✓ ✓
Tas
ks f
or
Man
ufa
ctu
rers
Testing of Spot Samples
According to Test Plan ✓ ✓ ✓
Initial Inspection of
Factory and FPC ✓ ✓ ✓ ✓
ITT of Product ✓ ✓ ✓
Continuous Surveillance of
Factory and FPC ✓ ✓ ✓
Tas
ks f
or
No
tifi
ed
Bo
die
s
Taking Audit Samples
from the Factory ✓
The initial type test sample as the name implies is the first sample according to
which free movement of the cement is determined. Until the results conforming
TS EN 197-1 of this sample is obtained, it is forbidden to affix CE Mark to the
product and also sell it in the European market [7]. After permission to affix CE
Mark to the product, there is a 3 month period defined for cement in TS EN 197-
2 as initial period for a new type of cement. During the initial period, the
frequencies of the samples taken by both the manufacturer and the notified
body are higher when compared with the routine period.
Initial period of cement ends up according to results of the conformity evaluation
of the initial period. If the results of the evaluation confirm the requirements of
TS EN 197-1, then initial period ends up and as routine period of 12 months
starts.

8
2.2.1 Conformity Evaluation of Cement
As seen in Table 2.1, both the manufacturer and the notified body take samples
from the factory. The samples taken by the manufacturer according to its test
plan are called as autocontrol samples. The samples taken by the notified body
are called as audit samples. Autocontrol samples are tested only by
manufacturer, whereas audit samples are tested by both the manufacturer and
the notified body [6].
The quality control of these cement samples are performed in accordance with
the standards TS EN 197-1 and TS EN 197-2. The former defines the required
parameters for cement and describes statistical analysis performed for these
parameters. Whereas, the latter defines the factory production control and
describes statistical analysis performed to check the reliability of the standard
compressive strength, i.e. 28 day compressive strength, results [6].
In TS EN 197-1, the required mechanical and physical properties of cement
regardless of its type are given in Table 2.2. The determinant parameters for
these requirements are the early and standard strength classes of the cement.
As seen in Table 2.2, there are two different early compressive strength classes;
namely, ordinary early compressive strength denoted by “N” and higher early
compressive strength denoted by “R”. For standard compressive strength, there
are three different compressive strength classes, namely 32.5, 42.5 and 52.5 [6].
For all of the standard compressive strength classes, the early compressive
strength equals to the 2 day compressive strength, except for cement having the
standard compressive strength as 32.5. For this class of cement, the early
compressive strength equals to 7 day compressive strength.

9
For early compressive strength and initial setting time, there is only lower limit
defined for each class in TS EN 197-1. For compressive strength both lower and
upper limits exist. However, for soundness, there is only one upper limit defined
for all strength classes.
Table 2.2 Mechanical and Physical Requirements of Cement [6]
Compressive Strength MPa
Early Strength Standard Strength Strength
Class
2 day 7 day 28 day
Initial Setting Time
min
Soundness (Expansion)
mm
32.5 N - ≥ 16.0
32.5 R ≥ 10.0 - ≥ 32.5 ≥ 52.5 ≥ 75
42.5 N ≥ 10.0 -
42.5 R ≥ 20.0 - ≥ 42.5 ≥ 62.5 ≥ 60
52.5 N ≥ 20.0 -
52.5 R ≥ 30.0 - ≥ 52.5 - ≥ 45
≤ 10
Moreover, the chemical requirements of cement, except for sulfate content, are
defined according to its type as seen in Table 2.3. For sulfate content both
cement type and strength class determine the required values.

10
Table 2.3 Chemical Requirements of Cement [6]
Property Test Reference Cement Type Strength Class Requirements a)
Loss on Ignition EN 196-2 CEM I
CEM III all ≤ 5.0 %
Insoluble
Residue EN 196-2
b)
CEM I
CEM III all ≤ 5.0 %
32.5 N
35.2 R
42.5 N
≤ 3.5 % CEM I
CEM II c)
CEM IV CEM V
42.5 R
52.5 N
52.5 R
Sulfate Content
(as SO3) EN 196-2
CEM III d)
all
≤ 4.0 %
Chloride
Content EN 196-21 all
e) all ≤ 0.10 %
f)
Pozzolanicity EN 196-5 CEM IV all Satisfies the Test
a) Requirements are given as percentage by mass of the final cement.
b) Determination of residue insoluble in hydrochloric acid and sodium carbonate.
c) Cement type CEM II/B-T may contain up to 4.5 % sulfate for all strength
classes. d)
Cement type CEM III/C may contain up to 4.5 % sulfate. e)
Cement type CEM III may contain more than 0.10 % chloride but in that case
the maximum chloride content shall be stated on the packaging and/or the
delivery note. f) For pre-stressing applications cements may be produced according to a lower
requirement. If so, the value of 0.10 % shall be replaced by this lower value
which shall be stated in the delivery note.
Manufacturers should take samples in accordance with their test plan. The
minimum testing frequency of this test plan is also defined in TS EN 197-1 and
given in Table 2.4. The required tests that shall be applied to the sample
according to its type, the corresponding test method and the statistical analysis
procedure are given in Table 2.4 both for cement in routine and initial period.
The minimum testing frequency for initial period is approximately two times the
minimum testing frequency for routine period. Moreover, the highest number of
samples are obtained for compressive strength, initial setting and sulfate content

11
both for initial and routine period [6]. In initial period, the highest number of
samples is obtained also for expansion test.
Table 2.4 Minimum Testing Frequency for the Autocontrol Tests and Statistical Analysis Procedure [6]
Autocontrol Testing
Minimum Testing Frequency
Statistical Assessment Procedure
Inspection by Property Cements
to be tested
Test method
a)
b) Routine
Situation
Initial Period
for a new type of cement
Variables e)
Attributtes
Early Strength
Standard Strength All EN 196-1 2/week 4/week x -
Initial Setting Time All EN 196-3 2/week 4/week - x f)
Soundness
(Expansion) All EN 196-3 1/week 4/week - x
Loss on Ignition CEM I,
CEM III EN 196-2 2/month
c) 1/week - x
f)
Insoluble Residue CEM I,
CEM III EN 196-2 2/month
c) 1/week - x
f)
Sulfate Content All EN 196-2 2/week 4/week - x f)
Chloride Content All EN 196-21 2/month c)
1/week - x f)
Pozzolanicity CEM IV EN 196-5 2/month 1/week -
Composition All - d)
1/month 1/week - x a)
Where allowed in the relevant part of EN 196, other methods than those indicated may be
used provided they give results correlated and equivalent to those obtained with the
reference method. b)
The methods used to take and prepare samples shall in accordance 50 % EN 196-7. c)
When none of the test results within a period of 12 months exceeds 50 % of the
characteristics value the frequency may be reduced to one per month. d)
Appropriate test method chosen by the manufacturer. e)
If the data are not normally distributed then the method of assessment may be decided on
a case by case basis. f) If the number of samples is at least one per week during the control period, the
assessment may be made by variables.

12
For cement, besides the difference in between testing frequency of
manufacturer in initial and routine period, there is also a difference in between
testing frequency of notified body in the initial and routine periods. In TS EN 197-
2, the minimum testing frequency for audit samples are defined as one sample
per every month for 3 months during the initial period. Thus, for the conformity
evaluation of cement in the initial period, there must be at least 3 audit samples
and 52 autocontrol samples. However, the minimum testing frequency for audit
samples in a routine period is defined as at least six samples per year [7]. Thus,
for the conformity evaluation of cement in routine period, a total of at least 6
audit samples and 104 autocontrol samples are required [6].
In the statistical analysis of cement according to TS EN 197-1 and TS EN 197-2,
the more emphasis is given to the compressive strength since the compressive
strength is one of the most important properties of cements. Most of the
nonconformities are resulting from the compressive strength test results.
2.2.1.1. Statistical Analysis According to TS EN 197-1
Statistical conformity analysis is performed according to two different methods,
namely inspection by variables and inspection by attributes, as defined in TS EN
197-1 both for initial and routine period. As mentioned earlier, the period of the
conformity analysis is 3 months for initial period and 12 months for routine
period. As stated in TS EN 197-2, for routine period, conformity analysis is
performed 2 times in a year.
In general, evaluation of compressive strength results is performed in
accordance with the “inspection by variables”. Although there is a chance for the
manufacturers to choose the inspection method of cement properties other than

13
compressive strength, they prefer the inspection method of these properties to
be “inspection by attributes”.
2.2.1.1.2 Inspection by Variables
It is assumed that the test results are normally distributed. According to
inspection by variables, conformity is achieved when the test results satisfy the
following equations [6]:
( (2.1)
and;
( (2.2)
where −x is the arithmetic mean of the autocontrol test results in the control
period; SD is the standard deviation of the autocontrol test results in the control
period; kA is a statistical constant depends on the number of samples. Lower and
upper limits are specified in Table 2.2. Since there is only a lower limit for early
compressive strength and standard compressive strength class of 52.5, the
conformity evaluations of these two classes with respect to inspection by
variables are performed only by Equation 2.2.
2.2.1.1.2 Inspection by Attributes
Inspection by attributes is performed for the properties of cement other than
compressive strength.
Limit Lower SD k - x A
-
≥×
Limit Upper SDkx A
-
≤×+

14
ADcc ≤
In inspection by attributes, test results are compared with the characteristic
values given in Tables 2.2 and 2.3. The values outside its corresponding
characteristic values, denoted by cD, are counted. According to number of
autocontrol samples, allowable number of errors cA is determined from Table
2.5. Pk in the table represent the percentile on which the specified characteristic
value is based.
Table 2.5 Allowable Number of Test Results Outside
The Characteristic Value, cA [6]
Conformity is demonstrated, when the test results satisfy the Equation 2.3.
( (2.3)
where cD is the number of test results outside the characteristic value given in
Tables 2.2 and 2.3, cA is the allowable number of test results outside the
characteristic value which depends on the number of samples.

15
2.2.1.2 Statistical Analysis According to TS EN 197-2 Annex A
Statistical analysis of autocontrol test results is defined in TS EN 197-1.
Meanwhile, statistical analysis of three data sets composed of autocontrol
samples, audit samples of manufacturer and notified body results is defined in TS
EN 197-2 Annex A. In this analysis, only 28 day compressive strength results are
examined and representativeness and the accuracy of these data sets are
evaluated.
Three data sets included in this analysis are [6, 8];
• A Series- Autocontrol test results of the manufacturer
• B Series- Audit samples test results of the manufacturer
• C Series- Audit samples test results of the notified body
The analysis consists of:
• Comparison of A and B series ( Control of sampling error)
• Comparison of B and C series ( Control of experimental error)
Note that these two comparison analyses can only be performed provided that
there are at least six audit samples. Therefore, since there are three audit
samples in the initial period, performing this analysis is not appropriate.
In A and B series comparison, series are checked whether they belong to the
same population or not. In order to say that A and B series belong to the same
population; Equation 2.4 must be satisfied [8]:

16
(2.4)
where MA is the arithmetic mean of the autocontrol test results, and MB is the
arithmetic mean of the manufacturers audit test results. If the difference
between arithmetic mean of A and B satisfies Equation 2.4, then these two data
series belong to the same population.
Although, in some situations, absolute value of the difference between
arithmetic mean of A and B might not satisfy Equation 2.4, it is not appropriate
to conclude that these data series do not belong to the same population.
Therefore, for such situations, there is another equation to calculate and
compare A and B series given in TS EN 197-2 Annex A as;
( ( (2.5)
where SA is the standard deviation of the autocontrol test results, NB is the
number of audit samples.
If the difference between arithmetic mean of A and B do not satisfy Equation 2.5,
within a 99% confidence level, A and B data series belong to different
populations.
There are several reasons that may lead to non-conformity in A and B
comparison. They are given as follows:
MPa 2.0 MB-MA ≤
BA N/S2.58MB-MA ×≤

17
• If samplers do not apply the test method as described, for example
mixing times and/or amount of ingredients are not the same as in the test
method,
• If different samplers performing the tests of autocontrol and audit
samples, there might be personnel errors leading the unconformity,
• If the test method applied is not appropriate, consequently the materials
are not properly mixed,
• If there is a fluctuation in the production so that the target margins of the
product always change,
• If the autocontrol and audit samples do not belong to the same type of
cement, then deviations in between A and B series will occur.
In B and C series comparison, series are examined to control the accuracy of the
autocontrol sample results. In order to ensure the accuracy, both of the
following two equations must be satisfied [8].
3.4SD ≤ ( (2.6)
( (2.7)
where SD is the standard deviation of the difference between the corresponding
results of the audit samples as defined by di=Bi-Ci, MB is the arithmetic mean of
the manufacturer’s audit sample, MC is the arithmetic mean of the notified
body’s audit samples. If either or both of the Equations 2.6 and 2.7 are not
satisfied, then according to TS EN 197-2 Annex A, both the manufacturer and
notified body must investigate the reasons.
MPa 4.0MC- MB ≤

18
There are several reasons that may lead to non-conformity in B and C
comparison. They are given as follows:
• Although the test method applied by the samplers of manufacturer and
notified body is the same, since the samplers are not the same, there
might be some personnel errors,
• If the test method is not properly applied, for example mixing times
and/or amount of ingredients are not the same as in the test method,
• If the test method applied is not appropriate, consequently the materials
are not properly mixed, then deviations in between B and C series will
occur.
• Although the same parameters are set for the testing machine in TS EN
196-1, according to the usage frequency of the testing machine, there
might be some deviations resulting from the testing machine.
2.3 Main Constituents of Cement
The main cementitious material in concrete is cement. However, to decrease the
cost, to improve the concrete performance and to produce more environmental
friendly products several supplementary cementitious materials, which are
generally natural minerals or by-products of some other industrial processes, are
used in cement to produce what is generally called as blended cements [6]. Thus,
cement consists of different materials, which are homogenous in composition.
The main constituents of cement other than clinker listed in TS EN 197-1 are as
follows:
� Pozollanic materials
• Natural Pozzolana (P)
• Artificial Pozzolana

19
• Silica fume (D)
• Granulated Blast Furnace Slag (S)
• Fly Ash (V, W)
� Siliceous fly ash (V)
� Calcareous fly ash (W)
• Burnt shale (T)
� Limestone (L, LL)
The percentage of these materials in cements varies according to cement type
and the application and the properties of concrete desired. However, TS EN 197-
1 states that the composition of the cements confirming this standard shall be in
the limits given in Table 2.6.
2.3.1 Pozzolanic Materials
Pozzolanic materials do not harden in themselves when mixed with water. They
exhibit cementitious properties when combined with calcium hydroxide at
ambient temperatures [9].
2.3.1.1 Natural Pozzolan (P, Q)
Materials originated from volcanic eruption are usually called as natural
pozzolanas [10]. According to TS EN 197-1, there are two types of natural
pozzolana; namely, natural and natural calcined pozzolanas abbreviated by P and
Q, respectively.

20
Table 2.6 Percentage of Cement Composition According to TS EN 197-1 [6].

21
2.3.1.2 Artificial Pozzolan
Artificial pozzolans are the by-products of various thermal treatments, such as
burnt shale, silica fume, fly ash, slag, etc.
2.3.1.2.1 Silica fume (D)
Silica fume, also called condensed silica fume and micro silica, is a finely divided
residue resulting from the production of elemental silicium or ferrosilicon alloys
that is carried from the furnace by exhaust gases [11].
2.3.1.2.2 Granulated Blast Furnace Slag (S)
In the production of iron, iron ore is smelted in a blast furnace. During this
process, molten iron that is collected in the bottom of the furnace and liquid iron
blast furnace slag floating on the pool of iron, are periodically tapped from the
furnace at a temperature of 1400-1500⁰C [12]. Granulated blast furnace slag is
made by rapid cooling of a slag melt which contains at least two-thirds by mass
of glassy slag and has hydraulic properties.
It is stated in TS EN 197-1 that granulated blast furnace slag composition shall
have at least two-thirds by mass of the sum of calcium oxide (CaO), magnesium
oxide (MgO) and silicon dioxide (SiO2). The rest of the composition is aluminium
oxide (Al2O3) together with small amounts of other compounds. Also, (CaO +
MgO)/(SiO2) ratio by mass shall exceed 1.0 [6]
22
2.3.1.2.3 Fly Ash (V, W)
Fly ash is a finely divided residue that results from the combustion of pulverized
coal and is carried from the combustion chamber of the furnace by exhaust
gases. Commercially available fly ash is a by-product of thermal power plants
[11].
TS EN 197-1 divides fly ashes into two groups; namely, siliceous and calcareous
fly ashes.
2.3.1.2.3.1 Siliceous fly ash (V)
Siliceous fly ash, a fine powder of mostly spherical particles having pozzolanic
properties, consists mainly of reactive SiO2 and Al2O3 [6].
2.3.1.2.3.2 Calcareous fly ash (W)
Calcareous fly ash, a fine powder having both hydraulic and/or pozzolanic
properties, consists mainly of reactive CaO, SiO2 and Al2O3 [6].
2.3.1.2.4 Burnt Shale (T)
Burnt shale is another cementitious constituent used in cement production.
Burnt shale is produced by burning of oil shale in fluidized bed furnace at
temperatures between 600 and 800⁰C and composed of clinker phases, mainly
dicalcium silicate and monocalcium aluminate.
23
2.3.2 Limestone (L, LL)
Limestone, a sedimentary rock, consists mainly of calcium carbonate; the most
stable form is calcite. Limestone often contains Mg, Al and Fe combined as
carbonates and silicates.
It is stated in TS EN 197-1 that in order to use limestone as a constituent in
cement, calcium oxide content should be at least 75% by mass. Moreover,
limestone is divided into two groups in TS EN 197-1 according to its Total Organic
Carbon (TOC) content. If TOC value does not exceed 0.20 % by mass, the
limestone is demonstrated with LL. If TOC value does not exceed 0.50 % by mass,
then the limestone is demonstrated with L [6].
2.3.3 Effects of the Mineral Additives on Mortar and Concrete Properties
Mineral additives influence the properties of cements and concretes. The
following subsections present the effects of main constituent of cement on
water requirement, workability and strength.
2.3.3.1 Water Requirement
The amount of mixing water required for a specified consistency of a mortar or
concrete is called as water requirement, determined by mortars, of cement
mortar or concrete. Adding excess or less amount of water can lead to adverse
results on the strength of cement mortar or concrete. Therefore, it is required to
determine how much water is sufficient for the cement mortar or concrete.
Cementitious materials have different impacts on the water requirement of
cement mortar or concrete since they have different particle size, shape, particle

24
size distributions etc. For example, natural pozzolans have significant effect on
water demand of concrete. Since the natural pozzolans increase the specific
surface area, cements containing natural pozzolans have higher water
requirement as compared to ordinary portland cement [14]. The same effect is
also observed when clinker is replaced with silica fume in cement. Therefore,
there is a limit in water requirement in TS EN 197-1, because of the high fineness
of silica fume.
However, for a given slump, water requirement of a cement containing fly ash
may be less than the water requirement of portland cement. Although the
dosage of fly ash increases the water reduction, not all fly ash does the same
effect on mortar. Brink and Halstead reported that the water demand increases
as the carbon content of the fly ash increases [13].
2.3.3.2 Workability
Workability is defined as the easiness of the concrete mixing, handling,
compacting, placing and finishing. Water content of concrete has an important
effect on workability. There are several factors affecting workability such as
quantity and characteristics of cementing materials, and amount of water etc.
The lubricant effect and morphology improvement on cement mortar or
concrete of natural pozzolans increase with an increase in fineness of the
cementitious materials [14]. As a result, natural pozzolans improve the
consistency and the workability of the concrete. Yijin et al (2004) studied the
usage of fly ashes having different fineness as a cementitious material replacing
the clinker in cement and replacing cement in concrete [15]. They found out that
fly ash improves the workability of cement mortar or concrete due to their
spherical shape causing “ball bearing” effect. Also, the water requirement of

25
concrete containing ground granulated blast furnace slag decreases with the
increase in the amount of ground granulated blast furnace slag [16].
2.3.3.3 Strength
Supplementary cementitious materials such as fly ash, ground granulated blast
furnace slag, burnt shale and silica fume contribute to the strength gain of
concrete. However, the characteristics of the supplementary materials and
replacement level limit them for the strength gain of concrete [17]. For example,
pozzolanic reactivity of the fly ash is one of the limiting parameter.
In addition to cementitious materials used, test type is another factor affecting
the strength. As the size of the specimen, moisture content of the specimen, the
rate of loading and type of test machine change, the strength results change.
2.4 Factors Affecting Concrete Strength
Concrete is a composite material consisting of mainly cement, water, coarse and
fine aggregates and chemical admixtures. Several complex reactions providing
the strength gain of concrete take place when these materials are mixed.
There are several factors affecting the strength of concrete such as constituents
and their mixing proportions, test method applied for the determination of
strength, production method of concrete etc. Some of these factors are given in
Figure 2.1.
As the strength of cement is determined on cement mortars prepared by
cement, water and sand, the factors affecting concrete strength will also affect
the strength of cements.

26
Figu
re 2
.1 F
acto
rs A
ffe
ctin
g th
e S
tre
ngt
h o
f C
on
cre
te

27
In the quality control testing of cement, strength is the parameter that causes
differences between the audit laboratory and factory laboratory. This may have
several reasons such as materials and their mixing proportions and test method.
2.4.1 Materials and Their Mixing Proportions
Since the concrete is a mixture of cement, water, coarse and fine aggregate and
chemical admixtures, properties of each of these materials have an influence on
the strength of concrete. Cement type, particle size distribution of cement and
aggregates are some of the factors related to constituents.
In addition to the properties of the constituents, mixing proportions of these
materials influence the strength of concrete. There is an optimum mixing
proportions for these materials to produce an economical concrete having the
desired properties. For example, amount of water or water to cement ratio are
important parameters. Because excessive water results higher bleeding and
segregation of concrete and thus, decreases the strength of concrete. Whereas,
less amounts of water prevent production of sufficiently homogenous mixes.
2.4.2 Test Method
Different test methods are applied to determine the compressive strength of
cement and concrete. For example, size of the specimen, in ASTM C109, 50 mm
cubic mold is used for the determination of compressive strength of cement,
whereas in TS EN196-1 a 40 × 40 × 160 mm prism is used. Moreover, before the
determination of compressive strength of cement, flexural strength is applied to
the specimen and thus, the specimen is divided into two. Although, the broken
part is not placed directly into the application of the compressive force, there
may be impact on the compressive strength of the specimen, because specimen
28
might not be divided into two equally. Therefore, the application point of the
force may not be at the center of the specimen which may result in faulty results
in the compressive strength.
Yi et al. (2006) observed that for cube and prism specimens the impact of the
size is bigger when compared with the cylinder specimens [18]. In addition to
that, they have also investigated the correlation between shape and size of the
specimen for concretes having normal and high strengths. According to their
findings, for high strength concretes, the shape effect of the specimen is
approximately negligible when compared to normal strength ones. Moreover,
they found out that the strength level impact on the size effect of the specimen
increases as the shape effect of the specimen decreases.
Viso et al. (2008) also examined the size effect on the compressive strength of
concrete [19]. According to their study, the smaller specimen’s resistance to
stress is bigger than the larger specimens. Moreover, size of the cubic specimen
influences the strength result more when compared with the cylinders.
In addition to size and shape of the specimen, curing conditions of the specimen
plays an important role on the compressive strength of concrete. Chemical
reactions take place during the hardening of concrete. Therefore, the
temperature at which the reactions take place affects the concrete properties.
2.5 Importance of Flow
Flow test, which depends on especially the water to cement ratio and on various
aspects of the cement such as fineness, flocculation, and rate of hydration

29
reactions, gives an idea about the consistency of a cement mortar or a fresh
concrete [20].
Consistency is an important parameter for the concrete workability. In addition,
by using a standard consistency, i.e. using a standard flow, errors because of
consolidation or bleeding in samples are avoided [20].
2.6 Inter-Laboratory Test Comparison
An inter-laboratory test is carried out by a representative number of
participating laboratories repeatedly within each participating laboratory on
identical samples under agreed conditions.
There are three main objectives for inter-laboratory testing:
� Proficiency Testing
� Certification of Materials
� Test Method Validation
The precision, which is a fundamental characteristic of a test method, is the
degree to which the repeated tests under the same conditions show the same
results. Since an inter-laboratory test is an appropriate procedure to measure the
precision of a test method, an inter-laboratory test is applied to test the
precision of the test method prescribed in TS EN 196-1.
In addition to determination of confidence interval, calculation of repeatability
and the reproducibility of the test results play an important role upon an inter-
laboratory test comparison. Guslicov et al. (2009) reported that, the progress of
the standard deviation of repeatability and reproducibility and coefficient of

30
variance have given an idea on the progress of the inter-laboratory tests [21].
They noticed that during these 20 years period, as the development of standards
and the interpretation and applicability of the standards increase, the coefficient
of variance decreases as shown in Figure 2.2. Moreover, since the repeatability
and reproducibility values decreased, they concluded that there is an
improvement in the applicability of the participants studied on the test method.
However, it should be mentioned that these tests were performed on CEM I type
of cements.
For compressive strength, which is performed by experienced laboratories under
the conditions defined in TS EN 196-1, the reproducibility in terms of coefficient
of variance is expected to be less than 6%. The reproducibility in terms of
coefficient of variance has reached less than 6% as shown in Figure 2.2.
In addition, in TS EN 196-1, it is stated that the repeatability in terms of
coefficient of variance is expected to be in between 1 and 3 %.
Different organizations, i.e. ATILH, CEPROCIM, etc., performed lots of inter-
laboratory test comparisons. However, in these inter-laboratory test
comparisons, especially for compressive strength comparison, CEM I type
cements were usually used. Therefore, there is a need to determine the
repeatability of blended cements.

31
Figure 2.2 Progress of the Coefficient of Variance for 1, 2 and 28-day
Compressive Strength [21]

32
CHAPTER 3
INTER-LABORATORY EVALUATION OF STRENGTH TEST
RESULTS
3.1 Inter-Laboratory Test Evaluation Procedure
The assessment of the inter-laboratory test results is carried out in accordance
with TS EN 196-1 and Normal Gauss Distribution.
3.1.1 Acceptance of Test Results
Acceptance of test results was determined according to TS EN 196-1. For each
mold, if there is any result showing 10% deviance from the mean of the six
results, it is discarded. Then, the remaining five results are averaged. If again,
there is any result showing 10% deviance from the mean of the five results, all of
the results are discarded.
3.1.2 Omission of Outliers
Since the unjustified minimization of the extreme values result in an impression
of the performance of the test method, the extreme values, called outliers for
each data set, were omitted. In order to determine the outliers of the rest of the
data sets, Grubb’s Test was applied. In Grubb’s Test, by ranking the data set, the
smallest and the largest values are determined. Then, the mean and the

33
standard deviation are calculated. Depending on the suspicion of a possible
outlier of a value, one of the following equations is used [24]:
(3.1)
(3.2)
where x is the mean of the data set, xSmallest is the smallest number in the data
set, xLargest is the largest number in the data set, and σ is the standard deviation
of the data set.
The calculated T values are compared with the critical values given in Table 3.1. If
both the calculated TMin and TMax are less than TCritical, then it is concluded that
there is no outlier in the data set. However, if one of those values or both of
them are greater than TCritical, then it is concluded that the result by which a T
value greater than TCritical, is obtained. That result is marked as an outlier and
must be discarded.
σSmallest
Min
x -x T =
σx x
TLargest
Max
−=

34
Table 3.1 Critical Values for Grubb’s Test
n
gCrit
α= 0.05
gCrit
α= 0.01 n
gCrit
α= 0.05
gCrit
α= 0.01
3 1.1531 1.1546 15 2.4090 2.7049
4 1.4625 1.4925 16 2.4433 2.7470
5 1.6714 1.7489 17 2.4748 2.7854
6 1.8221 1.9442 18 2.5040 2.8208
7 1.9381 2.0973 19 2.5312 2.8535
8 2.0317 2.2208 20 2.5566 2.8838
9 2.1096 2.3231 21 2.6629 3.0086
10 2.1761 2.4097 22 2.7451 3.1029
11 2.2339 2.4843 23 2.8675 3.2395
12 2.2850 2.5494 24 2.9570 3.3366
13 2.3305 2.6070 25 3.0269 3.4111
14 2.3717 2.6585 26 3.0839 3.4710
However, since the Grubb’s test is valid for a data set that are normally
distributed, normality of the data set must be checked.
Due to the limited number of samples, a nonparametric test called Kolmogorov-
Smirnov Test by using a computer program called Statistical Package for the
Social Sciences (SPSS) is applied to determine the normality of the data set.
The hypotheses used in this test are:
HO: there is no difference between the distribution of the data set and a
normal one
HA: there is a difference between the distribution of the data set and
normal
The P-value is provided by SPSS. If it is below 0.05, then the data set is
determined not to be normally distributed.

35
3.1.3 Evaluation of the Test Results
After finding out the outliers as described above, the evaluation of the test
results were performed. Since sample size was so small the t-test was used to
determine the confidence interval. According to the number of data sets
included in the assessment, t value corresponding to 95% confidence for two-tail
is chosen from t-table given in Table 3.2. Then, 95% confidence interval is
calculated with the expression given below.
N
σtχIntervalConfidence ×±= (3.3)
where χ is the arithmetic mean, t is the corresponding t value given in Table 3.2,
σ is the standard deviation and N is the number of data sets.
Table 3.2 t-Table
Cumulative Probability
For two-tails
Cumulative Probability
For two-tails
The Degree
of Freedom
0.10 0.05
The Degree
of Freedom
0.10 0.05
1 6.314 12.71 9 1.833 2.262
2 2.920 4.303 10 1.812 2.228
3 2.353 3.182 11 1.796 2.201
4 2.132 2.776 12 1.782 2.179
5 2.015 2.571 13 1.771 2.160
6 1.943 2.447 14 1.761 2.145
7 1.895 2.365 15 1.753 2.131
8 1.860 2.306 16 1.746 2.120

36
∑=
=−−−
−=
p
2
s)yy(
1p
1s
1i
2rj2
jijLj
2Lj
2rjRj sss +=
∑
∑
=
−
==
=p
1iij
ij
p
1i
ij
j
n
yn
y
∑
∑
=
=
−
−=
p
1iij
p
1i
2ijij
rj
1)(n
1)s(n
s
3.1.4 Calculation of the Repeatability and Reproducibility
According to TS 5822-2 ISO 5725-2, accuracy of a test method is determined by
its repeatability and reproducibility values [25]. Therefore, the repeatability and
reproducibility values are calculated to demonstrate the accuracy of a test
method.
As stated in TS 5822-2 ISO 5725-2, when the true value of a standard deviation is
not known in statistical practice, it is replaced by an estimate based upon a
sample, then the symbol σ is replaced by s. Thus, for the obtained results, the
standard deviation of repeatability and reproducibility are calculated using
Equations 3.4 and 3.7, respectively [25].
(3.4)
(3.5)
((3.6)
(3.7)
37
where p denotes the total number of laboratories participating in the inter-
laboratory experiment, i denotes the number of a particular laboratory, j
denotes the mold number, n denotes the number of test results obtained in one
laboratory at one mold, denotes the arithmetic mean of the test results,
denotes the grand mean of the test results.
Note that sr is the estimate of the repeatability variance; sL is the symbol used for
the estimate of the between-laboratory variance; sR is the estimate of the
reproducibility variance.
3.2 Comparison of the Test Results by Using Mann-Whitney Test Method
In addition to inter-laboratory test evaluation, test results are compared with
each other to determine the similarities. For this purpose, test results are
compared among each other by using Mann-Whitney test which is used to
compare two groups of sample data.
In Mann-Whitney Test, two data sets are compared whether the data samples
belong to the identical population or not.
The hypotheses used in this test are:
HO: the samples are from identical populations.
HA the samples are not from identical populations.
The P-value, i.e. the Asymptotic Significance, is provided by SPSS. If it is below
0.05, then the samples are determined not to be from the same population.
=y
−y

38
3.3 Results of CEM IV / B (P-V) 32.5N
In this part, an inter-laboratory test evaluation performed by TCMA Council for
Quality and Environment on compressive strength of a blended cement named
as CEM IV / B (P-V) 32.5N is presented.
In this inter-laboratory test evaluation, compressive strength of CEM IV / B (P-V)
32.5N was determined according to TS EN 196-1 in 16 different laboratories. The
mix proportion of the mortar is given in Table 3.3.
Table 3.3 The Mix Proportions of CEM IV / B (P-V) 32.5N
Ingredients (g) Cement Type
Water to Cement Ratio
Cement Water Aggregate
CEM IV B (P-V) 32.5N 0.50 450 225.0 1350
Preparing and casting of all of the mortar specimens were done as follows:
First of all water was poured into the mechanical blender. Then, cement was
added to the water and the mixture was mixed for 30 s at low speed. Next, CEN
Standard Sand was added and mixed for 30 s. After that, the blend was mixed at
high speed for 30 s. Finally, it was left to rest for 90 s and mixed at high speed for
60 s. The prepared mortars were cast into 40 × 40 × 160 mm molds and set in the
molds for 24 h. The hardened mortar was then remolded and kept at 20 ± 1 °C in
water for 28 day [22].
After 28 day, the specimens were broken into two by flexural strength and the
specimens obtained from the flexural strength test were used in compressive

39
strength test. Therefore, the nominal dimensions of the square area subjected to
compressive force are 40 × 40 mm. The maximum applied load P on the
specimen was determined and the compressive strength Rc was calculated
through Equation 3.8.
(3.8)
where A is the area subjected to the compressive force, which is equal, in this
test, to 1600 mm2. The load is in Newton and the compressive strength is in
N/mm2.
The standard compressive strength results obtained from 16 laboratories for the
pozzolanic cement CEM IV / B (P-V) 32.5N are presented in Table 3.3.
Each laboratory prepared minimum 2 molds. However, two laboratories having
the number 10 and 11 were faced with difficulties during the preparation of
molds. The mortars were so stiff that they were not effectively compacted into
molds. Therefore, these two laboratories tested only one mold.
When coefficients of variances of the test results given in Table 3.4 are
examined, it is observed that they vary between 0.78 and 19.78.
A
PRc =

40
* d
en
ote
s th
e r
esu
lts
de
viat
ing
mo
re t
han
10
% o
f th
e m
ean
**
de
no
tes
the
dis
card
ed
re
sult
s
Tab
le 3
.4 S
tan
dar
d C
om
pre
ssiv
e S
tre
ngt
h o
f C
EM
IV /
B (
P-V
) 3
2.5
N

41
The compressive strength of a single test of the 16 laboratories varies from 19.8
to 42.5 MPa as seen in Figure 3.1. The difference between the minimum and
maximum values equal to 22.7 MPa. However, the lower and upper
characteristic values given in TS EN 197-1 are 32.5 and 52.5 MPa, i.e. the
difference between its minimum and maximum equals to 20 MPa. The interval in
which the test results varied is very large when compared with the interval given
in TS EN 197-1. There may be several reasons for this situation, such as
applicability of the test method, non-homogenous mixing of the materials, water
to cement ratio, personel errors, etc.
Figure 3.1 The Minimum and Maximum Single Compressive Strength Test Results
of Cement Mortar Prepared by CEM IV / B (P-V) 32.5N
The averages of the standard compressive strength obtained by 16 laboratories
are given in Figure 3.2. Since the specimen was CEM IV / B (P-V) 32.5N, the

42
minimum and the maximum standard compressive strength must be equal to
32.5 MPa and 52.5 MPa, respectively, according to TS EN 197-1. The results of 8
laboratories did not conform the minimum standard compressive strength
characteristic value given in TS EN 197-1.
Figure 3.2 Average Compressive Strength of CEM IV / B (P-V) 32.5N as Obtained
by Different Laboratories
3.3.1 Acceptance of the Test Results
The test results gathered from 16 laboratories and were examined according to
TS EN 196-1. The means of each mold given in Table 3.3 were calculated. Then,
the results deviating more than %10 of the mean were detected and also listed in
Table 3.3.

43
For each mold results, one of those values deviating more than 10% of its mean
was discarded and the list of these discarded values marked with ** are shown in
Table 3.4. After discarding the values marked with **, the means of the rest of
the values were calculated. Then, again for the rest of the five results of the
molds, the values deviating more than 10% of its recalculated means were
determined.
The molds marked as rejected in Table 3.5 still have values deviating more than
%10 of the recalculated mean. Thus, the results of the laboratories having the
number 2, 10 and 13, the second mold result of the 8th laboratory and the first
mold result of the 14th laboratory did not satisfy the requirements of TS EN 196-
1. Therefore, they were not included in the evaluation. In other words, total of 7
molds out of 30 were not included in the analysis.
Table 3.5 The List of the Rejected and Accepted Results of CEM IV / B (P-V) 32.5N
Laboratory Number Mold Number
1 2 3 4 5 6 7 8 9 10 11 12 13 14 15 16
1 ✓ ✕ ✓ ✓ ✓ ✓ ✓ ✓ ✓ ✕ ✓ ✓ ✕ ✕ ✓ ✓
2 ✓ ✕ ✓ ✓ ✓ ✓ ✓ ✕ ✓ ✓ ✕ ✓ ✓ ✓
✓ denotes the Accepted test results
✕✕✕✕ denotes the Rejected test results
3.3.2 Omission of Outliers
In this part of the study, the outliers of the results were determined. Before
determination of the outliers of the results, it is required to check whether the
results are normally distributed. Thus, Kolmogorov-Smirnov Test was performed
44
by using SPSS. It was proved that the test results are normally distributed (see
Appendix A).
After confirmation of the normality, outliers of the standard compressive
strength results of the 13 laboratories marked as “✓” in Table 3.5 were
determined by using Grubb’s Test method. In this analysis, the minimum and the
maximum values of the test results were determined. The former was 25.2 MPa
and the latter was 39.6 MPa. Then, minimum and maximum T values for both of
them were calculated by using Equations 3.1 and 3.2 as 1.40 and 1.32,
respectively.
These T values were compared with the critical T value of 2.33 given in Table 3.1
for the number of sample 13. Since both of the calculated T values were less than
the critical T, there was no outlier in the test results.
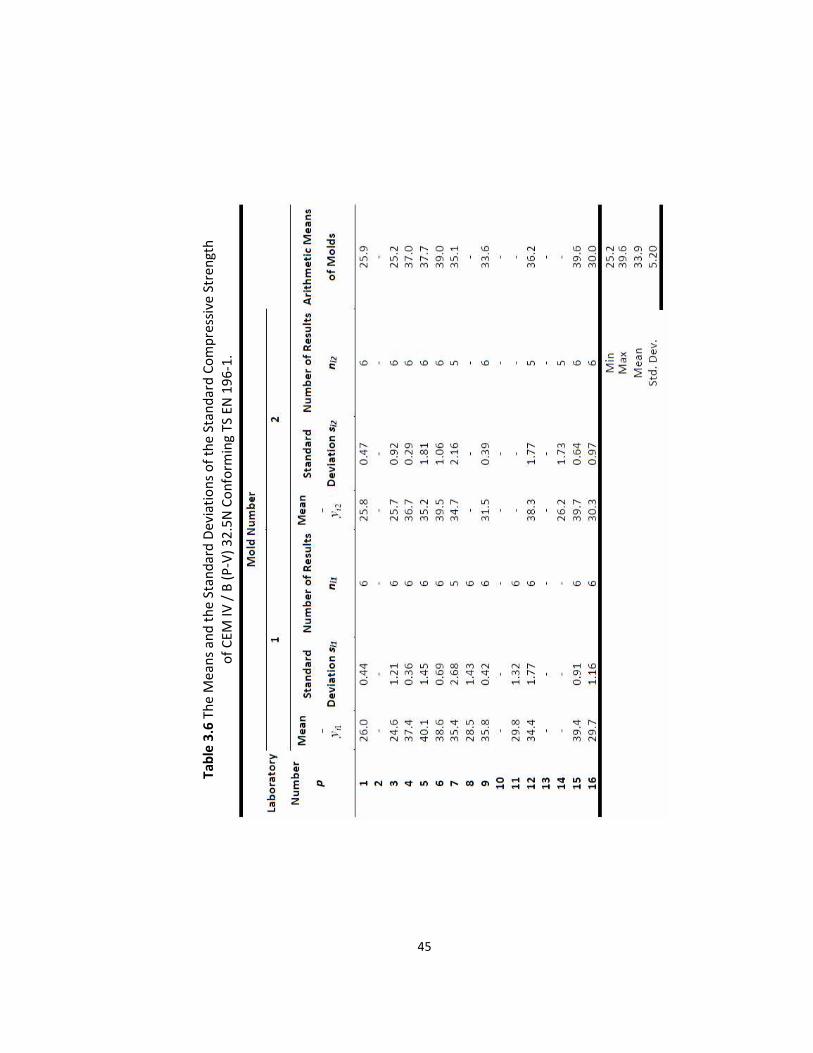
45
Tab
le 3
.6 T
he
Me
ans
an
d t
he
Sta
nd
ard
De
viat
ion
s o
f th
e S
tan
dar
d C
om
pre
ssiv
e S
tre
ngt
h
of
CE
M IV
/ B
(P
-V)
32
.5N
Co
nfo
rmin
g T
S E
N 1
96
-1.

46
3.3.3 Confidence Interval of the Test Results
After estimation of the outliers, for the test results, which were proved to be
normally distributed, the 95% confidence interval was determined. In order to
determine the interval following steps were performed.
According to the sample size denoted by N, the degree of freedom denoted by N-
1 was determined. Then, the t-value corresponding to 2-tailed 95% confidence
and the degree of freedom were found out from the t-Table given in Table 3.2.
The degree of freedom and t-value used in the analysis were 12 and 2.179,
respectively.
By using these values, the 95% confidence interval for the first part of the study
was calculated as shown below.
29.513
5.32.17932.6IntervalConfidence Lower =×−= (3.11)
35.813
5.32.17932.6IntervalConfidence Upper =×+= (3.12)
According to findings of the evaluation, Figure 3.3 was plotted. The standard
compressive strength test results of the 13 laboratories included in the analysis
and the mean of them are given in this figure. In addition, the 95% confidence
interval of the sample is shown.

47
It is observed that only 4 laboratories out of 13, i.e. 31%of the laboratories, fall
into the 95% confidence interval. The results reveal that the bulk of the
laboratories are out of the 95% confidence interval.
Figure 3.3 The Means of the Standard Compressive Strength of the Laboratories
Included in the Analysis
3.3.4 Calculation of the Repeatability and Reproducibility
The standard deviation of the repeatability and the reproducibility of the test
results were calculated by Equations 3.4 and 3.7, respectively, for each mold
numbers separately.
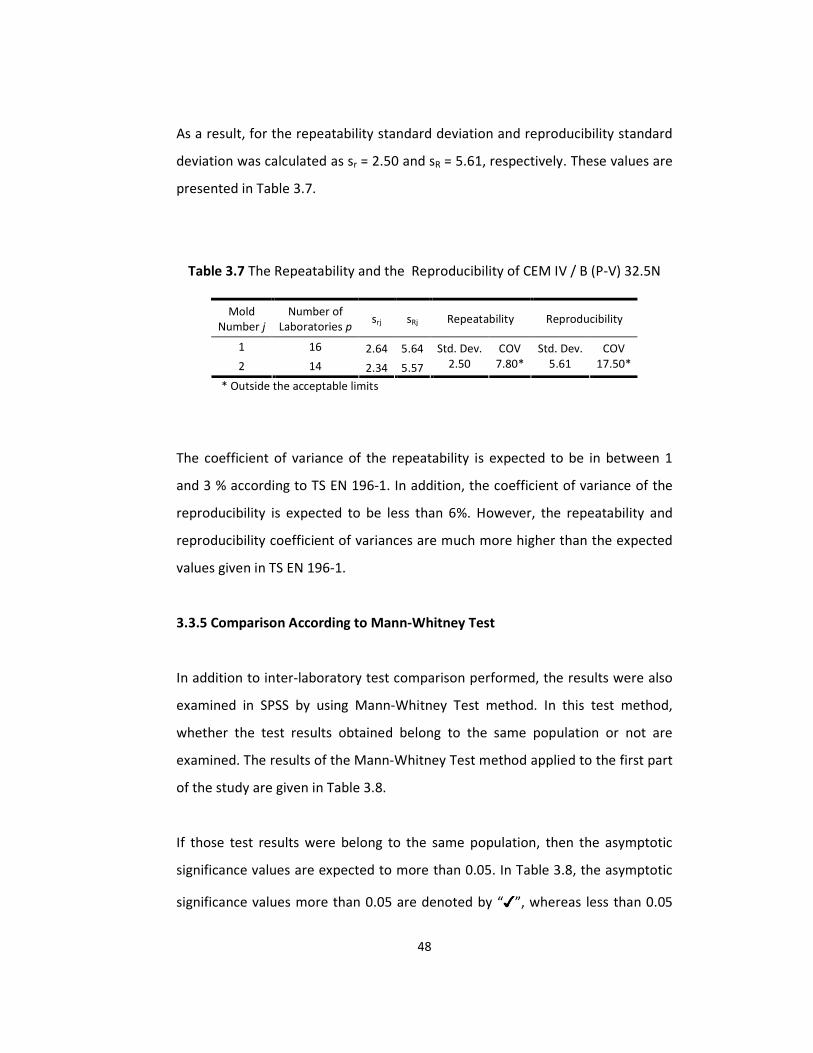
48
As a result, for the repeatability standard deviation and reproducibility standard
deviation was calculated as sr = 2.50 and sR = 5.61, respectively. These values are
presented in Table 3.7.
Table 3.7 The Repeatability and the Reproducibility of CEM IV / B (P-V) 32.5N
Mold
Number j
Number of
Laboratories p srj sRj Repeatability Reproducibility
1 16 2.64 5.64
2 14 2.34 5.57
Std. Dev.
2.50
COV
7.80*
Std. Dev.
5.61
COV
17.50*
* Outside the acceptable limits
The coefficient of variance of the repeatability is expected to be in between 1
and 3 % according to TS EN 196-1. In addition, the coefficient of variance of the
reproducibility is expected to be less than 6%. However, the repeatability and
reproducibility coefficient of variances are much more higher than the expected
values given in TS EN 196-1.
3.3.5 Comparison According to Mann-Whitney Test
In addition to inter-laboratory test comparison performed, the results were also
examined in SPSS by using Mann-Whitney Test method. In this test method,
whether the test results obtained belong to the same population or not are
examined. The results of the Mann-Whitney Test method applied to the first part
of the study are given in Table 3.8.
If those test results were belong to the same population, then the asymptotic
significance values are expected to more than 0.05. In Table 3.8, the asymptotic
significance values more than 0.05 are denoted by “✓✓✓✓”, whereas less than 0.05

49
are denoted by “✕✕✕✕”. It is clear that most of the samples do not belong to the
same population. Although the same test method was applied to the initial
specimens, the results were not similar.
Table 3.8 The Comparison of CEM IV / B (P-V) 32.5N Results
2 ✕✕✕✕
3 ✕✕✕✕ ✕✕✕✕
4 ✕✕✕✕ ✕✕✕✕ ✕✕✕✕
5 ✕✕✕✕ ✕✕✕✕ ✕✕✕✕ ✓✓✓✓
6 ✕✕✕✕ ✕✕✕✕ ✕✕✕✕ ✕✕✕✕ ✓✓✓✓
7 ✕✕✕✕ ✓✓✓✓ ✕✕✕✕ ✓✓✓✓ ✕✕✕✕ ✕✕✕✕
8 ✕✕✕✕ ✓✓✓✓ ✕✕✕✕ ✕✕✕✕ ✕✕✕✕ ✕✕✕✕ ✕✕✕✕
9 ✕✕✕✕ ✓✓✓✓ ✕✕✕✕ ✕✕✕✕ ✕✕✕✕ ✕✕✕✕ ✓✓✓✓ ✕✕✕✕
10 ✕✕✕✕ ✓✓✓✓ ✕✕✕✕ ✓✓✓✓ ✕✕✕✕ ✕✕✕✕ ✓✓✓✓ ✓✓✓✓ ✓✓✓✓
11 ✕✕✕✕ ✓✓✓✓ ✕✕✕✕ ✕✕✕✕ ✕✕✕✕ ✕✕✕✕ ✕✕✕✕ ✓✓✓✓ ✕✕✕✕ ✓✓✓✓
12 ✕✕✕✕ ✕✕✕✕ ✕✕✕✕ ✓✓✓✓ ✕✕✕✕ ✕✕✕✕ ✓✓✓✓ ✕✕✕✕ ✕✕✕✕ ✓✓✓✓ ✕✕✕✕
13 ✓✓✓✓ ✕✕✕✕ ✓✓✓✓ ✕✕✕✕ ✕✕✕✕ ✕✕✕✕ ✕✕✕✕ ✕✕✕✕ ✕✕✕✕ ✕✕✕✕ ✕✕✕✕ ✕✕✕✕
14 ✓✓✓✓ ✕✕✕✕ ✓✓✓✓ ✕✕✕✕ ✕✕✕✕ ✕✕✕✕ ✕✕✕✕ ✓✓✓✓ ✕✕✕✕ ✕✕✕✕ ✕✕✕✕ ✕✕✕✕ ✕✕✕✕
15 ✕✕✕✕ ✕✕✕✕ ✕✕✕✕ ✕✕✕✕ ✓✓✓✓ ✓✓✓✓ ✕✕✕✕ ✕✕✕✕ ✕✕✕✕ ✕✕✕✕ ✕✕✕✕ ✕✕✕✕ ✕✕✕✕ ✕✕✕✕
Lab
ora
tory
Nu
mb
er
16 ✕✕✕✕ ✓✓✓✓ ✕✕✕✕ ✕✕✕✕ ✕✕✕✕ ✕✕✕✕ ✕✕✕✕ ✓✓✓✓ ✕✕✕✕ ✓✓✓✓ ✓✓✓✓ ✕✕✕✕ ✕✕✕✕ ✕✕✕✕ ✕✕✕✕
1 2 3 4 5 6 7 8 9 10 11 12 13 14 15
Laboratory Number
According to the results of Inter-laboratory Test and Mann-Whitney Test, it is
concluded that the test method applied for the blended cement CEM IV / B (P-V)
32.5N was not appropriate.

50
CHAPTER 4
EXPERIMENTAL PROGRAM
4.1 General
According to results gathered from the inter-laboratory test obtained by TCMA –
Council for Quality and Environment, it is decided to perform the compressive
strength test on three cement types; namely, CEM I 42.5R , CEM II / A-M (P-S)
42.5R and CEM IV / B (P) 32.5R. However, the organization of the tests is
performed by Materials of Construction Laboratory at Middle East Technical
University (METU). Thus, the size of the participating laboratories is very limited.
4.2 Materials
The cement types used in all mixtures prepared in the second part of the study
were labeled as CEM I 42.5R, CEM II / A-M (P-S) 42.5R and CEM IV / B (P) 32.5R
according to TS EN 197-1. The cements were obtained from the local market in
tetrabags of 50 kg.
The aggregate used in the study was CEN Standard Sand conforming TS EN 196 –
1 obtained from the local market.

51
4.3 Mixture preparation
Two different cement mortar mixes were prepared for each type of cements. In
the first mix, water to cement ratio of the cement pastes were the same as given
in TS EN 196-1. In the second mix, flow diameter of the cement mixes were fixed
at 16 cm. The compressive strength of the mortar mixes were tested in five
different laboratories. The mix proportions of these cement mortars are given in
Table 4.1.
Table 4.1 Mix Proportions of CEM I 42.5R, CEM II / A-M (P-S) 42.5R
and CEM IV / B (P) 32.5R
Ingredients (g) Cement Type Mortar Mix
Water to Cement
Ratio Cement Water Aggregate
Flow (cm)
Constant Water
Content 0.50 450 225.0 1350 15
CEM I 42.5R
Constant Flow 0.49 500 242.5 1375 16
Constant Water
Content 0.50 450 225.0 1350 14
CEM II / A-M (P-S) 42.5R
Constant Flow 0.50 500 250.0 1375 16
Constant Water
Content 0.50 450 225.0 1350 12
CEM IV B (P) 32.5R
Constant Flow 0.54 500 276.5 1375 16
4.4 Chemical composition of cements
The cement is composed of SiO2, Al2O3, Fe2O3, CaO, MgO as major oxides and
K2O, Na2O, TiO2, P2O5 and SO3 as minor oxides. In the second part of the study,
determination of the oxide composition was done by X-Ray fluorescence (XRF).
52
4.5 Fineness of cements
4.5.1 Specific Surface – Blaine Fineness
The fineness is determined from the air permeability of a bed of cement of
specified porosity using the Blaine air permeability apparatus and expressed as
the surface area in square centimeters per gram (cm2/g) of cement according to
the expression given below.
(4.1)
where S is the Blaine Fineness in cm2/g, A is the coefficient of the apparatus
which is determined by calibration, t is the time elapsed to draw the air through
the cement bed and d is the density of the cement.
4.5.2 Particle Size Distribution (PSD)
Particle size distribution is another method to determine the fineness of the
cement. The laser technique is used for the determination of the particle size
distribution.
4.5.3 Sieve Analysis
Another technique to determine the fineness of the cement is to sieve it through
certain size mash sieves. This analysis is carried out according to TS EN 196-6.
d
tAS =

53
4.6 Tests on Mortars
4.6.1 Slump Flow Diameter
The test method used for the determination of the slump flow for a cement
mortar was ASTM C 1437. For this test, a flow mold was used. The flow mold was
placed at the center of the flow table, then the mold was filled with the mortar
till 25 mm and then mortar was tampered 20 times. After tampering, the rest of
the mold was again filled with the mortar and tampered as described for the
previous layer. Then, the upper surface of the mold was flattened by trowel and
the mold was carefully removed. Immediately the mortar was dropped 25 times
in 15 s to spread. After spreading finished, two perpendicular diameters were
measured and their average diameter was taken as slump flow diameter [23].
4.6.2 Compressive Strength Test
The compressive strength was determined according to TS EN 196 – 1. The
nominal dimensions of the square area subjected to compressive force in the
specimens are 40 × 40 mm. The maximum applied load P on the specimen was
recorded and the compressive strength Rc was calculated using the expression
below.
(4.2)
where A is the area subjected to the compressive force, which is equal, in this
case, to 1600 mm2. The load is in N and the compressive strength is in N/mm2.
A
PRc =
54
CHAPTER 5
EXPERIMENTAL RESULTS
5.1 General
In this part of the study, three different types of cements namely, CEM I 42.5R,
CEM II / A-M (P-S) 42.5R and CEM IV / B (P) 32.5R were used. For each type of
cement, two different cement mortars were prepared and compressive strength
of these mortars were tested at 2 and 28 day.
5.2 CEM I 42.5R
The results of 2 and 28 day compressive strength of cement mortar mixes having
constant water content and constant flow prepared with CEM I 42.5R were given
in Table 5.1.
The results of constant water content mortar for 2 day compressive strength
vary in between 25.1 and 31.9 MPa. The results for 28 day compressive strength
vary in between 49.1 and 60.0 MPa. The results of constant flow mortar for 2 day
compressive strength vary in between 22.3 and 33.8 MPa, while those for 28 day
compressive strength vary in between 50.3 and 63.4 MPa. It is obvious that the
interval of the results obtained by constant water content is narrower than those
obtained by constant flow for 2 and 28 day compressive strength.
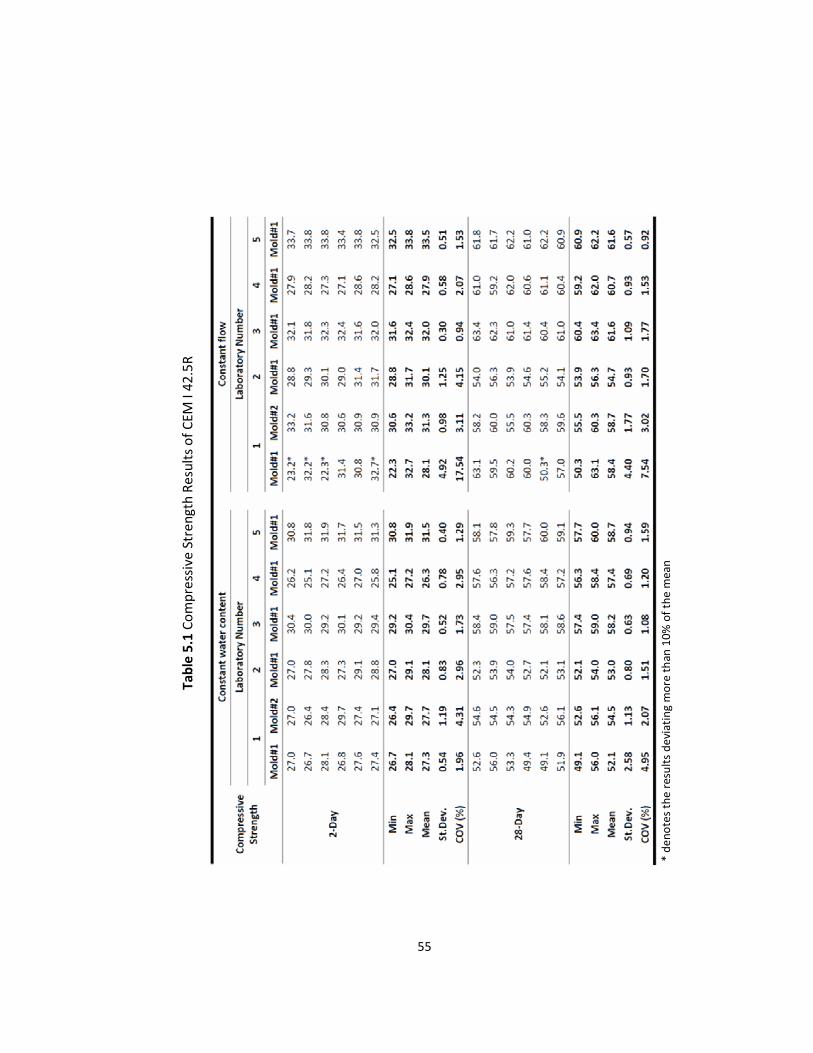
55
* d
en
ote
s th
e r
esu
lts
de
viat
ing
mo
re t
han
10
% o
f th
e m
ean
s
Tab
le 5
.1 C
om
pre
ssiv
e S
tre
ngt
h R
esu
lts
of
CE
M I
42
.5R

56
(a) Constant Water Content (b) Constant Flow
Figure 5.1 The Average Compressive Strength of CEM I 42.5R
The early compressive strength requirement defined in TS EN 197-1 for CEM I
42.5R is 20.0 MPa. The lower and the upper standard compressive strength
requirements defined in TS EN 197-1 are 42.5 and 62.5MPa, respectively. It is
obvious that the averages of the early and standard compressive strengths of the
cement mortar mixes constant water content and constant flow satisfy the
requirements of TS EN 197-1.
5.2.1 Acceptance of the Results
For cement mortar mixes having constant water content and constant flow, 2
and 28 day compressive strength results were compared with their means.
When results of constant water content mortar were compared, it was
recognized that there was no result deviating more than 10% of its mean. Thus,

57
all of the results obtained for cement mortar mix having constant water content
were accepted.
When results of constant flow mortar were compared, it is observed that 2 and
28 day compressive strength results of the laboratory number 1 marked with * in
Table 5.1 deviated more than 10% of its mean. However, in order to observe the
effect of these results, they were not discarded.
5.2.2 Omission of Outliers
First, the test results were examined by Kolmogorov-Smirnov Test to see if they
are normally distributed. The test result revealed that data sets are normally
distributed (see Appendix A).
Then, determination of outliers is performed. It is observed that for 28 day
compressive strength of constant flow mortar, there is an outlier belonging to
the laboratory number 2. However, as the number of participating laboratories is
rather small, it was not omitted.
5.2.3 Confidence Interval of the Test Results
According to the sample size, the degrees of freedoms are four both for constant
water content and constant flow mortars. Then, the corresponding t value
obtained from Table 3.2 is 2.776.
Finally, the 95% confidence interval for constant water content and constant
flow was obtained.

58
There is one 2 day compressive strength result out of the limits for cement
mortar mixes obtained by CEM I 42.5R for both constant water content and
constant flow as seen in Figure 5.2. Thus, these results are out of the confidence
interval. It is observed that there is no big difference between 2 day compressive
strength of constant water content and constant flow. However, for 28 day
compressive strength, the confidence interval of constant water content mortar
is bigger than the confidence interval of constant flow mortar. In addition, there
is an outlier in the results of constant flow.
Moreover, the results obtained for constant flow mortar is approximately three
MPa higher than those obtained for constant water content mortar for both
constant water content and constant flow. The constant water content results
are more reliable than constant flow results.
Figure 5.2 95% Confidence Interval for CEM I 42.5R
26.08
52.70
31.13
59.49
33.60
63.07
28.32
55.79
20
25
30
35
40
45
50
55
60
65
Co
mrp
ess
ive
Str
en
gth
(M
Pa
)
Constant Water Content Constant Flow
Lower Limits for 2 Days Compressive Strength Lower Limits for 28 Days Compressive Strength
Upper Limits for 2 Days Compressive Strength Upper Limits for 28 Days Compressive Strengths

59
5.2.4 Calculation of the Repeatability and Reproducibility
The repeatability and the reproducibility were calculated according to Equations
3.4 and 3.7 and are given in Table 5.2.
When coefficient of variance of the repeatability and reproducibility are
compared with the repeatability and reproducibility limits defined in TS EN 196-
1, it is observed that the repeatabilities belonging to the constant water content
mortars are in the limits for both 2 and 28 day compressive strength. Whereas,
the repeatabilities belonging to the constant flow mortars are outside the limit
for both 2 and 28 day compressive strength.
Table 5.2 Standard Deviation and COV of the Repeatability and the
Reproducibility.
Repeatability Reproducibility
Compressive
Strength
(Days)
Mold
Number
j
Number of
Laboratories
p
srj sRj
Std. Dev. COV Std. Dev. COV
1 5 0.6 1.9
2
2 1 1.2 1.2
0.7 2.5 1.8 6.2*
1 5 1.3 2.9
Co
nst
ant
Wat
er
Co
nte
nt
28
2 1 1.1 1.1
1.3 2.3 2.6 4.7
1 5 2.2 2.6
2
2 1 1.0 1.0
2.0 6.5* 2.3 7.6*
1 5 2.1 3.0
Co
nst
ant
Flo
w
28
2 1 1.8 1.8
2.1 3.5 2.8 4.8
* Outside the acceptable limits
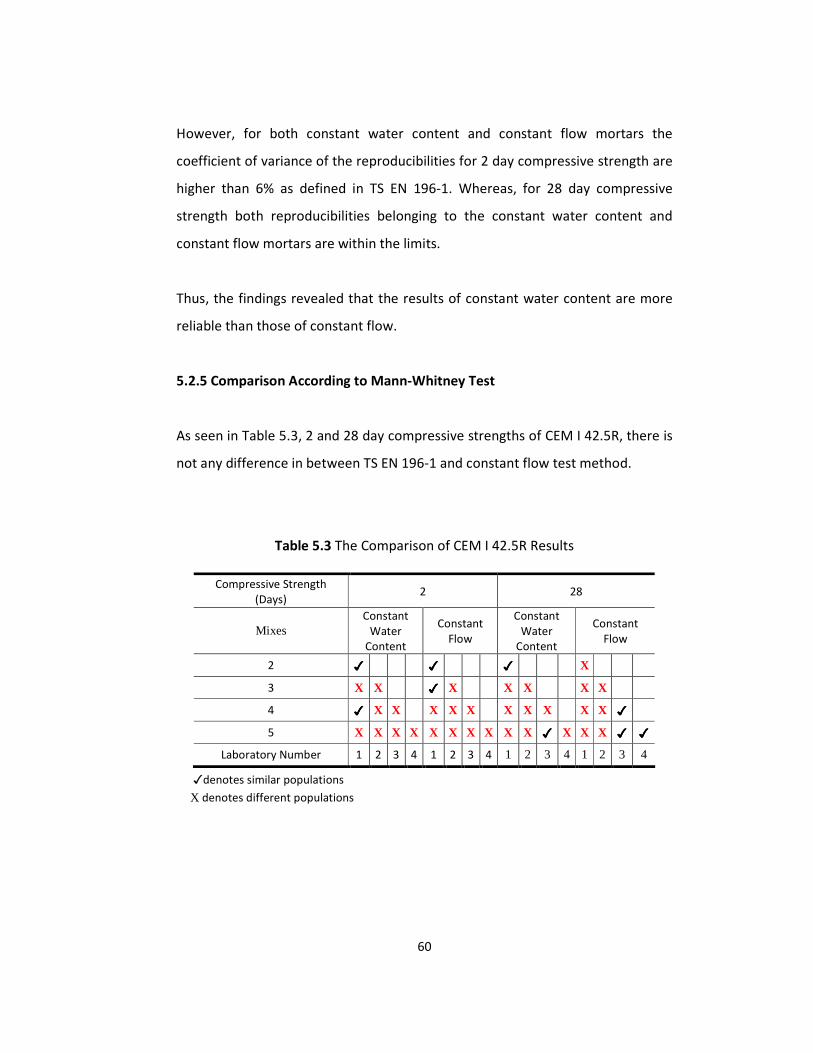
60
However, for both constant water content and constant flow mortars the
coefficient of variance of the reproducibilities for 2 day compressive strength are
higher than 6% as defined in TS EN 196-1. Whereas, for 28 day compressive
strength both reproducibilities belonging to the constant water content and
constant flow mortars are within the limits.
Thus, the findings revealed that the results of constant water content are more
reliable than those of constant flow.
5.2.5 Comparison According to Mann-Whitney Test
As seen in Table 5.3, 2 and 28 day compressive strengths of CEM I 42.5R, there is
not any difference in between TS EN 196-1 and constant flow test method.
Table 5.3 The Comparison of CEM I 42.5R Results
Compressive Strength
(Days) 2 28
Mixes Constant
Water
Content
Constant
Flow
Constant
Water
Content
Constant
Flow
2 ✓✓✓✓ ✓✓✓✓ ✓✓✓✓ X
3 X X ✓✓✓✓ X X X X X
4 ✓✓✓✓ X X X X X X X X X X ✓✓✓✓
5 X X X X X X X X X X ✓✓✓✓ X X X ✓✓✓✓ ✓✓✓✓ Laboratory Number 1 2 3 4 1 2 3 4 1 2 3 4 1 2 3 4
✓denotes similar populations
X denotes different populations

61
5.3 CEM II / A-M (P-S) 42.5R
Compressive strength of cement mortar mixes having constant water content
and constant flow, and prepared with cement CEM II / A-M (P-S) 42.5R are
presented.
The results of 2 and 28 day compressive strength obtained for constant water
content mortar mix that had mix proportions as defined in TS EN 196-1 are given
in Table 5.4. The results of this mortar for 2 day compressive strength varies in
between 23.6 and 28.4 MPa. Whereas, the results of this mortar for 28 day
compressive strength vary in between 51.3 and 60.1 MPa.
The results of 2 and 28 day compressive strength obtained for constant flow
mortar are also given in Table 5.4. The results of this cement mortar mix vary in
between 22.9 and 29.2 MPa for 2 day compressive strength, while those for 28
day compressive strength vary in between 53.1 and 60.5 MPa.
It is obvious that the interval of the results obtained for constant water content
mortar is narrower than those obtained for constant flow mortar for 2 day
compressive strength. While the interval of the test results obtained for constant
flow mortar is narrower than those results obtained for constant water content
for 28 day compressive strength.

62
Tab
le 5
.4 C
om
pre
ssiv
e S
tre
ngt
h R
esu
lts
of
CE
M II
/ A
-M (
P-S
) 4
2.5
R

63
(a) Constant Water Content (b) Constant Flow
Figure 5.3 The Average Compressive Strength of CEM II / A-M (P-S) 42.5R
The early compressive strength requirement defined in TS EN 197-1 for CEM II /
A-M (P-S) 42.5R is 20.0 MPa. The lower and the upper standard compressive
strength requirements are 42.5 MPa and 62.5 MPa, respectively. Then, it is clear
that the averages of the early and standard compressive strength of the cement
mortar mixes obtained by CEM II / A-M (P-S) 42.5R satisfy the requirements of TS
EN 197-1.
5.3.1 Acceptance of the Results
When a comparison is made between the results of 2 and 28 day compressive
strength of cement mortar mixes prepared by CEM II / A-M (P-S) 42.5R and their
means, it was recognized that there was no result deviating more than 10% of its
mean. Thus, all of the data satisfied the requirements defined in TS EN 196-1.

64
5.3.2 Omission of Outliers
The test results examined by Kolmogorov-Smirnov Test revealed that they are
normally distributed. According to this test result data sets are normally
distributed (see Appendix A).
Then, determination of outliers is performed. It is observed that there is an
outlier belonging to laboratory number 2 for 28 day compressive strength of
constant water content mortar. However, again as the number of laboratories is
rather small, the test result of the laboratory number 2 is not omitted.
5.3.3 Confidence Interval of the Test Results
According to the sample size the degrees of freedom are four for constant water
content and constant flow mortars. Then, the corresponding t value obtained
from Table 3.2 is 2.776.
Finally, the 95% confidence interval both for constant water content and
constant flow is obtained and given in Figure 5.4. For 2 day compressive strength
of cement mortar having constant flow, it is observed that there is a result out of
the confidence interval. However, for constant water content, there is not any
result out of the confidence interval.
In addition, there is a result out of the confidence interval for 28 day
compressive strength for both cement mortar having constant water content
and constant flow.

65
When the confidence intervals of the cement mortar mixes obtained for constant
water content and constant flow are compared, it is obvious that the interval of
constant water content mortar is similar to the interval of constant flow mortar.
24.09
53.26
28.10
58.57
29.06
59.11
24.39
54.97
20
25
30
35
40
45
50
55
60
65
Co
mrp
ess
ive
Str
en
gth
(M
Pa
)
Constant Water Content Constant Flow
Lower Limits for 2 Days Compressive Strength Lower Limits for 28 Days Compressive Strength
Upper Limits for 2 Days Compressive Strength Upper Limits for 28 Days Compressive Strengths
Figure 5.4 95% Confidence Interval for CEM II / A-M (P-S) 42.5R
5.3.4 Calculation of the Repeatability and Reproducibility
The repeatability and the reproducibility were calculated by Equations 3.4 and
3.7 and given in Table 5.5.
When coefficient of variance of the repeatability and reproducibility are
compared with the repeatability and reproducibility limits defined in TS EN 196-
1, it is observed that the repeatabilities and reproducibilites belonging to the
constant water content mortars are in the limits for both 2 and 28 day
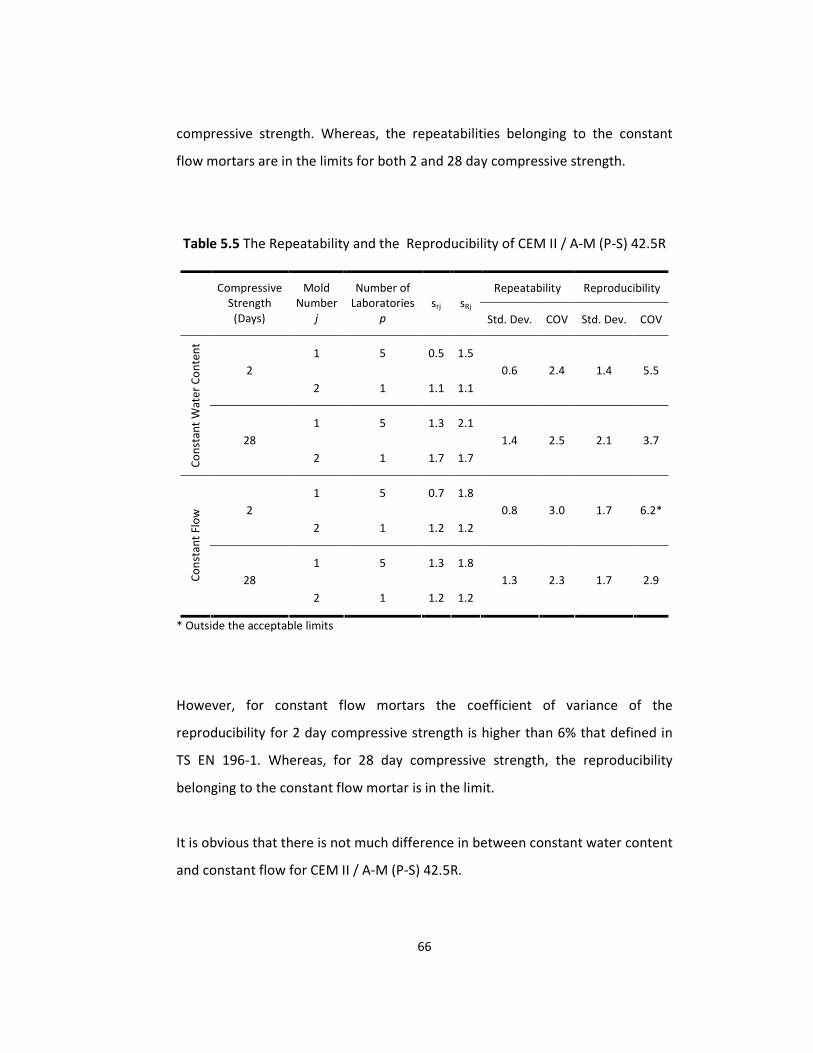
66
compressive strength. Whereas, the repeatabilities belonging to the constant
flow mortars are in the limits for both 2 and 28 day compressive strength.
Table 5.5 The Repeatability and the Reproducibility of CEM II / A-M (P-S) 42.5R
Repeatability Reproducibility
Compressive
Strength
(Days)
Mold
Number
j
Number of
Laboratories
p
srj sRj
Std. Dev. COV Std. Dev. COV
1 5 0.5 1.5
2
2 1 1.1 1.1
0.6 2.4 1.4 5.5
1 5 1.3 2.1
Co
nst
ant
Wat
er
Co
nte
nt
28
2 1 1.7 1.7
1.4 2.5 2.1 3.7
1 5 0.7 1.8
2
2 1 1.2 1.2
0.8 3.0 1.7 6.2*
1 5 1.3 1.8
Co
nst
ant
Flo
w
28
2 1 1.2 1.2
1.3 2.3 1.7 2.9
* Outside the acceptable limits
However, for constant flow mortars the coefficient of variance of the
reproducibility for 2 day compressive strength is higher than 6% that defined in
TS EN 196-1. Whereas, for 28 day compressive strength, the reproducibility
belonging to the constant flow mortar is in the limit.
It is obvious that there is not much difference in between constant water content
and constant flow for CEM II / A-M (P-S) 42.5R.

67
5.3.5 Comparison According to Mann-Whitney Test
The results of the Mann-Whitney Test are summarized in Table 5.6. For 2 and 28
day compressive strengths of CEM II / A-M (P-S) 42.5R, the test results obtained
for constant flow test method has given more identical test results when
compared to TS EN 196-1 test method.
Table 5.6 The Comparison of CEM II / A-M (P-S) 42.5R Results
Compressive Strength (Day)
2 28
Mixes Constant
Water
Content
Constant
Flow
Constant
Water
Content
Constant Flow
2 X ✓✓✓✓ X X
3 X X X X X X ✓✓✓✓ X
4 X X X X X X X X X X X ✓✓✓✓
5 X X X X X X ✓✓✓✓ X X X X X ✓✓✓✓ X ✓✓✓✓ X
Laboratory Number 1 2 3 4 1 2 3 4 1 2 3 4 1 2 3 4
✓denotes similar populations
X denotes different populations
5.4 CEM IV / B (P) 32.5R
The results of 2 and 28 day compressive strength obtained for constant water
content mortar that had the same mix proportions as defined in TS EN 196-1 are
given in Table 5.7. The results of this mortar mix for 2 day compressive strength
vary in between 9.9 and 14.5 MPa while those for 28 day compressive strength
vary in between 34.5 and 41.2 MPa.

68
In addition, the results of 2 and 28 day compressive strength obtained for
constant flow mortar are also given in Table 5.7. The results for 2 day
compressive strength vary in between 9.9 and 12.8 MPa, while those for 28 day
compressive strength vary in between 34.1 and 41.5 MPa.
It is obvious that the interval of the results obtained for constant flow mortar is
narrower than those obtained for constant water content mortar for 2 day
compressive strength. While the interval of the test results obtained for constant
water content is similar to those obtained for constant flow mortar for 28 day
compressive strength.

69
* d
en
ote
s th
e r
esu
lts
de
viat
ing
mo
re t
han
10
% o
f th
e m
ean
Tab
le 5
.7 C
om
pre
ssiv
e S
tre
ngt
h o
f C
EM
IV /
B (
P)
32
.5R

70
(a) Constant Water Content (b) Constant Flow
Figure 5.5 The Average Compressive Strength of CEM IV / B (P) 32.5R
The early compressive strength requirement defined in TS EN 197-1 for CEM IV /
B (P) 32.5R is 10.0 MPa. The lower and the upper standard compressive strength
requirements defined in TS EN 197-1 are 32.5 MPa and 52.5 MPa, respectively.
Then, it is clear that the averages of each laboratory for early and standard
compressive strength of the cement mortar mixes having constant water content
satisfy the requirements of TS EN 197-1. In addition, the average compressive
strength of cement mortar mixes having constant flow satisfy the requirements
defined in TS EN 197-1 in most of the laboratories, except in laboratory 5.
5.4.1 Acceptance of the Results
When a comparison is made between the results of CEM IV / B (P) 32.5R and
their means, it is obvious that there are several 2 day compressive strength
results deviating more than 10% of its mean marked with “*” in Table 5.7. There
are nine compressive strength results outside the limits of TS EN 196-1 for
mortar mix having constant water content, whereas the number of outside
results is 3 for mortar mix having constant flow.

71
Although, TS EN 196-1 states that the result deviating more than 10% of its mean
should be discarded, in order to observe the effects of those results none of
them was discarded.
When a comparison of the results mentioned above is made, it is clear that the
number of results outside the requirements defined in TS EN 196-1 is much more
higher for CEM IV / B (P) 32.5R than the other cements.
5.4.2 Omission of Outliers
The test results examined by Kolmogorov-Smirnov Test revealed that they are
normally distributed. According to this test result, data sets are normally
distributed (see Appendix A).
Then, when the test results are compared with the critical T values obtained
from Table 3.1, it is observed that there is no outlier both for constant water
content and constant flow mortars prepared with CEM IV / B (P) 32.5R.
5.4.3 Confidence Interval of the Test Results
Since there are five results for both constant water content and constant flow,
the degrees of freedom equals to four and the corresponding t value is 2.776.
The 95% confidence interval both for constant water content and constant flow
was obtained and given in Figure 5.6.

72
11.96
36.19
13.77
40.12
11.68
39.41
10.09
34.32
5
10
15
20
25
30
35
40
45
Co
mrp
ess
ive
Str
en
gth
(M
Pa
)
Constant Water Content Constant Flow
Lower Limits for 2 Days Compressive Strength Lower Limits for 28 Days Compressive Strength
Upper Limits for 2 Days Compressive Strength Upper Limits for 28 Days Compressive Strengths
Figure 5.6 95% Confidence Interval for CEM IV / B (P) 32.5R
When the confidence intervals of constant water content and constant flow are
compared, it is obvious that the interval of constant flow is narrower than
constant water content for 2 day compressive strength. However, for 28 day
compressive strength, constant water content confidence interval is narrower
than the interval of constant flow.
Constant water content has results out of the confidence interval both for 2 and
28 day compressive strength, whereas, constant flow has a result out of the
confidence interval only for 28 day compressive strength. If the results outside
the confidence intervals of both constant water content and constant flow were
omitted, the interval of constant flow would be much more narrower than
constant water content.

73
5.4.4 Calculation of the Repeatability and Reproducibility
The repeatability and the reproducibility were calculated by Equations 3.4 and
3.7 and given in Table 5.8.
Table 5.8 The Repeatability and the Reproducibility of CEM IV / B (P) 32.5R
Repeatability Reproducibility
Compressive
Strength
(Days)
Mold
Number
j
Number of
Laboratories
p
srj sRj
Std. Dev. COV Std. Dev. COV
1 5 1.0 1.0
2
2 1 1.9 1.9
1.1 8.9* 1.1 8.9*
1 5 0.8 1.4
Co
nst
ant
Wat
er
Co
nte
nt
28
2 1 0.8 0.8
0.8 2.1 1.3 3.4
1 5 0.5 0.9
2
2 1 0.2 0.2
0.5 4.3* 0.7 6.8*
1 5 0.8 1.9
Co
nst
ant
Flo
w
28
2 1 1.0 1.0
0.8 2.3 1.7 4.7
* Outside the acceptable limits
When the coefficient of variance of repeatability and reproducibility are
compared with the repeatability and reproducibility limits defined in TS EN 196-
1, it is observed that the repeatabilities and reproducibilities belonging to the
constant water content and constant flow mortars are within the limits for 28
day compressive strength. Whereas, the repeatabilities and reproducibilities

74
belonging to the constant water content and constant flow mortars are outside
the limit for 2 day compressive strength.
According to repeatability and reproducibility values, the results of constant flow
are better than those of constant water content for 2 day compressive strength.
5.4.5 Comparison According to Mann-Whitney Test
Again for CEM IV / B (P) 32.5R, the test results are compared by Mann-Whitney
Test. The summary of the test results are given in Table 5.9. Although, it seems
that there is not any difference in between TS EN 196-1 and constant flow test
method for CEM IV / B (P) 32.5R, it must be noted that TS EN 196-1 test results
belonging to laboratories 1 and 2 were discarded for constant water content
mortar. Thus, when this situation is considered, the constant flow test method
has given more similar test results than compared to TS EN 196-1 test method
for pozzolanic cement.
Table 5.9 The Comparison of CEM IV / B (P) 32.5R Results
Compressive Strength (Day)
2 28
Mixes Constant
Water
Content
Constant
Flow
Constant
Water
Content
Constant Flow
2 ✓✓✓✓ ✓✓✓✓ X X
3 X ✓✓✓✓ ✓✓✓✓ ✓✓✓✓ X X X ✓✓✓✓
4 ✓✓✓✓ X ✓✓✓✓ ✓✓✓✓ ✓✓✓✓ X X X X X X X
5 ✓✓✓✓ ✓✓✓✓ ✓✓✓✓ X X X X X ✓✓✓✓ X X ✓✓✓✓ X ✓✓✓✓ ✓✓✓✓ X
Laboratory Number 1 2 3 4 1 2 3 4 1 2 3 4 1 2 3 4
✓denotes similar populations
X denotes different populations

75
CHAPTER 6
SUMMARY AND CONCLUSIONS
6.1 General
Two compressive strength test methods, following TS EN 196-1 (Constant Water
Content) and ASTM (Constant Flow), were compared. For this purpose, two
experimental studies were conducted. In the first part, compressive strength test
of pozzolanic cement was performed in 16 different laboratories, which was
organized by TCMA Council for Quality and Environment. In the second part,
both TS EN 196-1 and constant flow test methods were conducted on portland,
portland composite and pozzolanic cements in 5 different laboratories. The
results obtained from mortar tests were examined by inter-laboratory test
comparison and statistical analysis program SPSS. According to the findings, the
following conclusions can be drawn:
� According to TCMA Council for Quality and Environment inter-laboratory
test evaluation and statistical analysis program demonstrated that TS EN
196-1 is not an appropriate test method to determine the compressive
strength of pozzolanic cement.
� Although there is not much difference in between 2 day compressive
strengths obtained by TS EN 196-1 and constant flow test method, TS EN
196-1 test method is more appropriate for portland cements.
� According to results of CEM II / A-M (P-S) 42.5R type of cement obtained
by both inter-laboratory test comparison and statistical analysis, there is
not much difference in between TS EN 196-1 and constant flow for

76
portland composite cements. Thus, for portland composite cements, both
TS EN 196-1 and constant flow tests are appropriate.
� According to results of CEM IV / B (P) 32.5R type of cement, for
pozzolanic cements unlike for portland cements, constant flow test
method is more appropriate than TS EN 196-1 test method, since the
water to cement ratio is not appropriate to have a homogenous mix.
6.2 Recommendations for further studies
Considering the results obtained from this study, following recommendations for
further studies are suggested:
� In previously performed inter-laboratory test comparisons mostly
portland cements were used. Thus, it is recommended to perform these
inter-laboratory tests by using different cement types.
� It is found that TS EN 196-1 test method is not appropriate for all cement
types defined in TS EN 197-1. Thus, it is necessary to do some
modifications on TS EN 196-1.
� In this study, only limited number of water to cement ratios were applied.
Therefore, it is suggested to perform compressive strength tests on
different types of cements having different water to cement ratio with
more laboratories.
� In addition, in this study limited number of laboratories were performed
the compressive strength test. Therefore, it is suggested to perform the
tests with more laboratories.

77
REFERENCES
1. Turkish Cement Manufacturers’ Association, “İstatistikler”,
http://www.tcma.org.tr/index.php?page=icerikgoster&cntID=33,
last accessed date: 1.08.2010
2. The European Cement Association, “Cement Industry–Main Characteristics”,
http://www.cembureau.be/about-cement/cement-industry-main-
characteristics , last accessed date: 31.3.2010.
3. EUROPA – European Union Official Web Site, “European Sustainable
Consumption and Production Policies”,
http://ec.europa.eu/environment/eussd/escp_en.htm, last accessed date:
1.04.2010.
4. Erdoğan T. S., Erdoğan Y. T., Bağlayıcı Malzemelerin ve Betonun Onbin Yıllık
Tarihi, Middle East Technical University Press, Ankara, 2007.
5. Neville A. M., Properties of Concrete, Fourth Edition, Pearson Education
Limited, England, 2003.
6. TS EN 197-1, “Cement-Part 1: Compositions and conformity criteria for
common cements”, Turkish Standards Institution, March, 2002.
7. Council Directive 89/106/EEC, “Construction Products Directive”, European
Parliament, Officail Journal No L40, August, 1993
78
8. TS EN 197-2, “Cement- Part 2: Conformity evaluation”, Turkish Standards
Institution,2002
9. WIKIPEDIA, “Pozzolan”, http://en.wikipedia.org/wiki/Pozzolan, last accessed
date: 1.04.2010.
10. Ghosh S. N., Advances in Cement Technology: Chemistry, Manufacture and
Testing, Second Edition, Tech Books International, India, 2002.
11. Nawy G. E., Concrete Construction Engineering Handbook, Second Edition,
Rutgers University, New Jersey, USA, 2008.
12. Hewlett P. C., Lea’s Chemistry of Cement and Concrete, Elsevier Ltd., United
Kingdom, 2005.
13. R. H. Brink and W.J. Halstead, “Studies relating to the Testing of Fly Ash for
Use in Concrete”, Proc. Am. Soc. Testing Mats., No 56, pp. 1161-1206, 1956.
14. Pan S. C., Tseng D., Lee C. and Lee C., “Influence of the Fineness of Sewage
Sludge Ash on the Mortar Properties”, Cement and Concrete Research , No
33, pp. 1749-1754, 2003.
15. Yijin L., Shiqiong Z., Jian Y., Yingli G., “The Effect of Flys Ash on the Fluidity of
Cement Paste, Mortar and Concrete”, International Workshop on Sustainable
Development and Concrete Technology, China, May, 2004.
16. Bartos P., Special Concretes – Workability and Mixing, Routledge, United
Kingdom,1993.

79
17. Wesche K., Fly Ash in Concrete: Properties and Performance, RILEM, Great
Britain, 1991.
18. Yi S.-T., Yang E.-Ik, Choi J.-C., ”Effect of Specimen Sizes, Specimen Shapes,
and Placement Directions on Compressive Strength of Concrete”, Nuclear
Engiineering and Design, No 236, pp. 115-127, 2006.
19. Viso J. R., Carmona J. R., Ruiz G., Shape and Size Effects on the Compressive
Strength of High-strength Concrete, Cement and Concrete Research, Vol 38,
pp. 386-395,2008.
20. Lamond J. F., Pielert J. H, Significance of Tests and Properties of Concrete and
Concrete-Making Materials, ASTM International, West Conshohocken, PA,
2006.
21. Guslicov G., Coarna M., Pop A., Vlad C., Vlad N, Consideration Concerning
Inter-laboratory Test for Cement in the last 20 Years, Accred Qual Assur, 2009
22. TS EN 196-1, “Methods of testing cement - Part 1: Determination of
strength”, Tuskish Standards Institutions, 2009.
23. ASTM C 1437, ‟Standard Test Method for Flow of Hydraulic Cement
Mortar1”, Annual Book of ASTM Standards, 2007.
24. Muth De J. E., Basic Statistics and Pharmaceutical Statistical Applications,
Second Edition, Chapman & Hall/CRC Biostatistics Series, Boca Raton, FL
2006.

80
25. TS 5822-2 ISO 5725-2, “Accuracy (trueness and precision) of measurement
methods and results- Part 2: Basic method for the determination of
repeatability and reproducibility of a standard measurement method”,
Tuskish Standards Institutions, 2000.

81
APPENDIX A
KOLMOGOROV-SMIRNOV TEST RESULTS
Table A.1 Kolmogorov-Smirnov Test Result of CEM IV / B (P-V) 32.5N
Number of Sample 13
Mean 32.6 Normal Parameters
a
Std. Deviation 5.3
Absolute 0.15
Positive 0.15 Most Extreme Differences
Negative -0.15
Kolmogorov-Smirnov Z 0.55
Asymp. Sig. (2-tailed) 0.93
a. Test distribution is Normal.
Table A.2 Kolmogorov-Smirnov Test Results of CEM I 42.5R Having Constant
Water Content
Compressive Strength (Days) 2 28
Number of Sample 6 6
Mean 28.6 55.8 Normal Parameters
a
Std. Deviation 2.02 2.59
Absolute 0.20 0.28
Positive 0.20 0.26 Most Extreme Differences
Negative -0.13 -0.28
Kolmogorov-Smirnov Z 0.45 0.62
Asymp. Sig. (2-tailed) 0.99 0.83
a. Test distribution is Normal.

82
Table A.3 Kolmogorov-Smirnov Test Result of CEM I 42.5R Having Constant Flow
Compressive Strength (Days) 2 28
Number of Sample 5 6
Mean 31.0 59.6 Normal Parameters
a
Std. Deviation 2.10 2.89
Absolute 0.16 0.26
Positive 0.13 0.24 Most Extreme Differences
Negative -0.16 -0.26
Kolmogorov-Smirnov Z 0.37 0.58
Asymp. Sig. (2-tailed) 0.99 0.88
a. Test distribution is Normal.
Table A.4 Kolmogorov-Smirnov Test Result of CEM II / A-M (P-S) 42.5R Having
Constant Water Content
Compressive Strength (Days) 2 28
Number of Sample 6 6
Mean 26.1 55.9 Normal Parameters
a
Std. Deviation 1.62 2.13
Absolute 0.15 0.31
Positive 0.15 0.26 Most Extreme Differences
Negative -0.15 -0.31
Kolmogorov-Smirnov Z 0.34 0.70
Asymp. Sig. (2-tailed) 1.00 0.71
a. Test distribution is Normal.
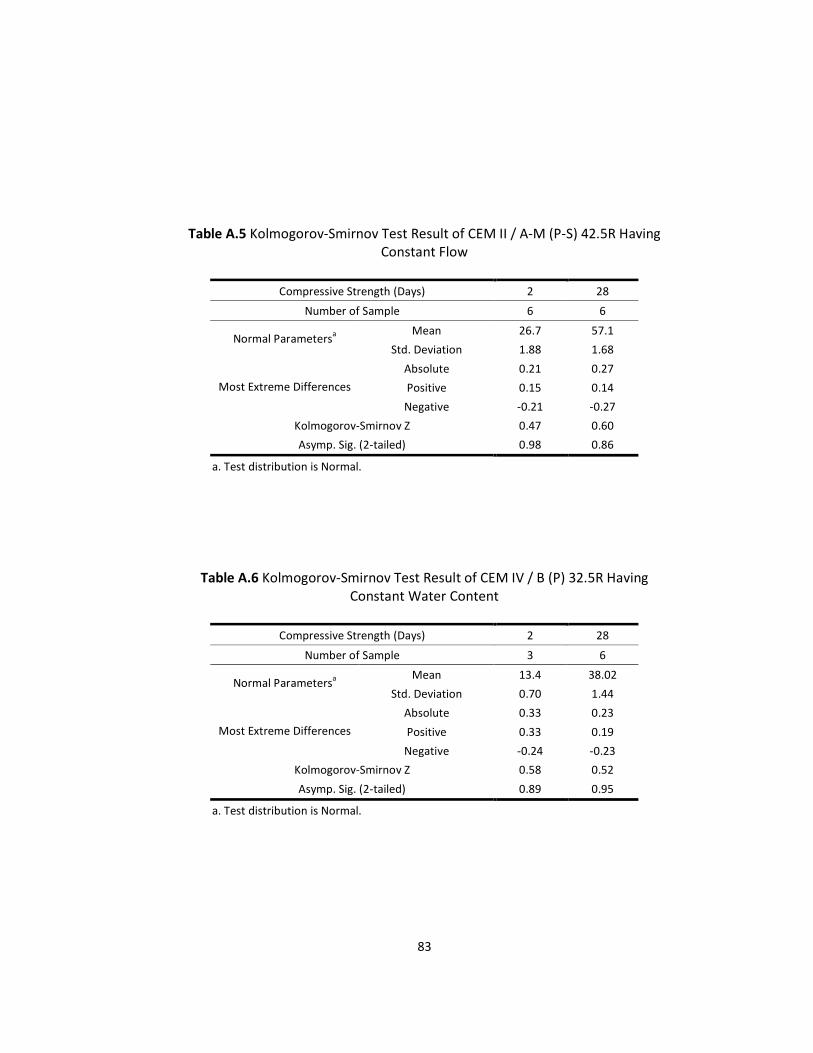
83
Table A.5 Kolmogorov-Smirnov Test Result of CEM II / A-M (P-S) 42.5R Having
Constant Flow
Compressive Strength (Days) 2 28
Number of Sample 6 6
Mean 26.7 57.1 Normal Parameters
a
Std. Deviation 1.88 1.68
Absolute 0.21 0.27
Positive 0.15 0.14 Most Extreme Differences
Negative -0.21 -0.27
Kolmogorov-Smirnov Z 0.47 0.60
Asymp. Sig. (2-tailed) 0.98 0.86
a. Test distribution is Normal.
Table A.6 Kolmogorov-Smirnov Test Result of CEM IV / B (P) 32.5R Having
Constant Water Content
Compressive Strength (Days) 2 28
Number of Sample 3 6
Mean 13.4 38.02 Normal Parameters
a
Std. Deviation 0.70 1.44
Absolute 0.33 0.23
Positive 0.33 0.19 Most Extreme Differences
Negative -0.24 -0.23
Kolmogorov-Smirnov Z 0.58 0.52
Asymp. Sig. (2-tailed) 0.89 0.95
a. Test distribution is Normal.

84
Table A.6 Kolmogorov-Smirnov Test Result of CEM IV / B (P) 32.5R Having
Constant Flow
Compressive Strength (Days) 2 28
Number of Sample 6 6
Mean 10.9 36.9 Normal Parameters
a
Std. Deviation 0.68 2.06
Absolute 0.30 0.27
Positive 0.25 0.27 Most Extreme Differences
Negative -0.30 -0.19
Kolmogorov-Smirnov Z 0.67 0.59
Asymp. Sig. (2-tailed) 0.76 0.87
a. Test distribution is Normal.

85
APPENDIX B
CHEMICAL AND PHYSICAL ANALYSIS OF CEMENTS
Table B.1 Chemical Composition and Physical Properties of the Cement Types
Compound (%) CEM IV / B (P-V)
32.5N CEM I 42,5R
CEM II / A-M (P-L) 42,5R
CEM IV / B (P) 32,5R
SiO2 33.60 19.45 23.46 26.66
Al2O3 8.85 5.41 6.63 7.63
Fe2O3 4.93 3.48 3.36 3.43
CaO 40.84 64.13 58.37 51.,18
MgO 1.96 1.50 1.63 1.81
SO3 2.99 3.05 2.60 1.82
K2O 1.1 0.57 0.67 0.83
Na2O 0.65 0.16 0.13 0.02
Free CaO 0.56 0.74 0.56 0.24
LOI 5.05 1.69 2.72 6.21
Cum. % Retained on 45μ
- 4.7 3.8 3.6
Specific Gravity - 3.14 3.04 2.88
Blaine Fineness (cm2/g)
- 4230 4390 4680
Table B.2 Main Constituents of the Cement Types
Main Constituents (%)
Cement Type Klinker Tras Fly Ash Limestone Slag
CEM IV / B (P-V) 32.5N 56.0 18.0 22.0 4.0 -
CEM I 42.5R 95.0 - - 5.0 -
CEM II / A-M (P-S) 42.5R 86.0 7.0 - 3.0 4.0
CEM IV / B (P) 32.5R 60.0 38.0 - 2.0 -

86
Figure B.1 Particle size distribution of CEM I 42.5R
Figure B.2 Particle size distribution of CEM II / A-M (P-S) 42.5R

87
Figure B.3 Particle size distribution of CEM IV / B (P) 32.5R