comparison between tot and tga/ft-ir carbon measurements … · comparison between tot and...
TRANSCRIPT
Comparison between TOT and TGA/FT-IR carbon measurements
P. Fermo1, A. Piazzalunga1, R. Vecchi2, G. Valli2, A. D’Alessandro2
1Department of Inorganic, Metallorganic and Analytical Chemistry, University of Milan, 20133, Milan, Italy2Institute of Applied General Physics, University of Milan, 20133, Milan, Italy
TGA/FT-IR consists of a simple home-made apparatus obtained by coupling a thermo-gravimetric analyzer with a FT-IR spectrophotometer. More information dealing with system set-up are given in Fermo et al., 2006. By monitoring CO2 infrared absorbance at 2361 cm-1 it is possible to obtain CO2 evolution curves where the two components OC and EC are detectable as well separated peaks. EC and OC determination has been performed by a TGA/FT-IR, assembled using a JASCO-FTIR spectrophotometer Model 360 and a Dupont Thermo-gravimetric analyzer model 951. The technique detection limit is 0.5 µgC/cm2 and the precision is 10%.TGA/FT-IR minimizes the pyrolitic conversion using suitable analysis conditions (Fermo et al., 2006).
The TOT instrument is a carbon analyzer by Sunset Laboratory Inc.. More details on the methodology can be found in Birch and Cary, 1996. The technique detection limit is 0.15 µgC/cm2 and the precision is 5%.Thanks to the monitoring of the optical sample transmittance during the analysis, TOT takes into account possible generation of carbon char produced by the pyrolitic conversion of organics into elemental carbon (charring).
2- INSTRUMENTATION
Aerosol carbon content (OC and EC) has been determined by means of a Thermal-Optical Transmission (TOT) instrument and by a TGA/FT-IR (Thermo-gravimetric Analysis coupled with Fourier Transformed Infrared Spectroscopy) system. These two techniques are based on the analysis of thermal evolved gas analysis carried out on a portion of the filter sample placed into a furnace and heated in the presence of one or more gases (O2 for TGA/FT-IR and He or a mixture of O2/He for TOT).
Birch M. E., R. A. Cary, 1996, Aerosol Sci. Tech. 25, 221Chow J. C., J. G. Watson, L.W. A. Chen, W. P. Arnott, H. Moosmüller, 2004, Environ. Sci. Technol. 38, 4414Countess R. J., 1990, 1990, Aerosol Sci Technol. 12, 114Fermo P., A. Piazzalunga, R. Vecchi, G. Valli, M. Ceriani, 2006, Atmos. Chem. Phys. 6, 255Fermo P., A. Piazzalunga, V. Gianelle, G. Mognaschi, B. Rindone, E. Bolzacchini, L. Ferrero, M. G. Perrone, 2006, Monitoraggio e caratterizzazione del particolato atmosferico nella sala espositiva, La Pietà Rondinini, in pressSchmid H., L. Laskus, H. J Habraham., U.Baltensperger, V.Lavanchy, M.Bizjak, P.Burba, H.Cachier, D. Crow, J. Chow, T. Gnauk, A. Even, H. M. Ten Brink, K. P. Giesen, R.Hitzenberger, C. Hueglin, W.Maenhaut, C. Pio, A. Carvalho, J.P. Putaud, D. Toom-Sauntry, H. Puxbaum, 2001, Atmos. Environ. 35, 2111ten Brink H., W. Maenhaut, R. Hitzenberger, T. Gnauk, G. Spindler, A. Even, X. Chi, H. Bauer, H. Puxbaum, J. P. Putaud, J. Tursic, A. Berner, 2004, Atmos. Environ. 38, 6507Vecchi R., M. Ceriani, M. Chiari, A. D’Alessandro, I. Garcia-Orellana, F.Lucarelli, F. Mazzei, S. Nava, L. Paperetti, P. Prati, F. Silvani, G. Valli, 2005, Abstracts of the European Aerosol Conference, Ghent, BelgiumWatson J. G., J. Chow, 2002, J. Geophys. Res. 107, 8341
Contact authors: [email protected]@unimi.it
total carbon
0.0
10.0
20.0
30.0
40.0
50.0
60.0
70.0
0.0 10.0 20.0 30.0 40.0 50.0 60.0 70.0mean (µg/m³)
TC(µ
g/m
³)
TOT TGA/FT-IR
organic carbon
0.0
10.0
20.0
30.0
40.0
50.0
60.0
0.0 10.0 20.0 30.0 40.0 50.0 60.0
mean (µg/m³)
OC
(µg/
m³)
TOT TGA/FT-IR
elemental carbon
0.0
5.0
10.0
15.0
20.0
0.0 5.0 10.0 15.0 20.0mean (µg/m³)
EC(µ
g/m
³)
TOT TGA/FT-IR
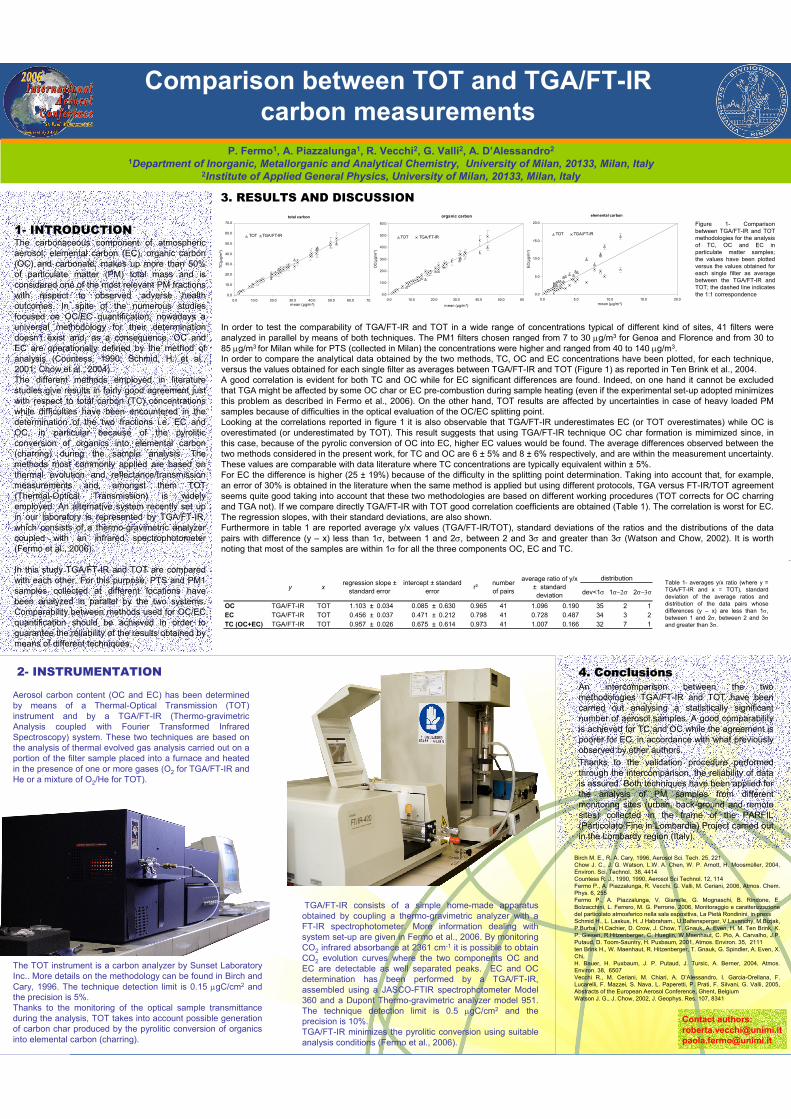
Figure 1- Comparison between TGA/FT-IR and TOT methodologies for the analysis of TC, OC and EC in particulate matter samples; the values have been plotted versus the values obtained for each single filter as average between the TGA/FT-IR and TOT; the dashed line indicates the 1:1 correspondence
Table 1- averages y/x ratio (where y = TGA/FT-IR and x = TOT), standard deviation of the average ratios and distribution of the data pairs whose differences (y – x) are less than 1σ, between 1 and 2σ, between 2 and 3σand greater than 3σ.
4. ConclusionsAn intercomparison between the two methodologies TGA/FT-IR and TOT have been carried out analysing a statistically significant number of aerosol samples. A good comparability is achieved for TC and OC while the agreement is poorer for EC, in accordance with what previously observed by other authors.Thanks to the validation procedure performed through the intercomparison, the reliability of data is assured. Both techniques have been applied for the analysis of PM samples from different monitoring sites (urban, back-ground and remote sites) collected in the frame of the PARFIL (Particolato Fine in Lombardia) Project carried out in the Lombardy region (Italy).
In order to test the comparability of TGA/FT-IR and TOT in a wide range of concentrations typical of different kind of sites, 41 filters were analyzed in parallel by means of both techniques. The PM1 filters chosen ranged from 7 to 30 µg/m3 for Genoa and Florence and from 30 to 85 µg/m3 for Milan while for PTS (collected in Milan) the concentrations were higher and ranged from 40 to 140 µg/m3. In order to compare the analytical data obtained by the two methods, TC, OC and EC concentrations have been plotted, for each technique, versus the values obtained for each single filter as averages between TGA/FT-IR and TOT (Figure 1) as reported in Ten Brink et al., 2004.A good correlation is evident for both TC and OC while for EC significant differences are found. Indeed, on one hand it cannot be excluded that TGA might be affected by some OC char or EC pre-combustion during sample heating (even if the experimental set-up adopted minimizes this problem as described in Fermo et al., 2006). On the other hand, TOT results are affected by uncertainties in case of heavy loaded PM samples because of difficulties in the optical evaluation of the OC/EC splitting point. Looking at the correlations reported in figure 1 it is also observable that TGA/FT-IR underestimates EC (or TOT overestimates) while OC is overestimated (or underestimated by TOT). This result suggests that using TGA/FT-IR technique OC char formation is mimimized since, in this case, because of the pyrolic conversion of OC into EC, higher EC values would be found. The average differences observed between the two methods considered in the present work, for TC and OC are 6 ± 5% and 8 ± 6% respectively, and are within the measurement uncertainty. These values are comparable with data literature where TC concentrations are typically equivalent within ± 5%.For EC the difference is higher (25 ± 19%) because of the difficulty in the splitting point determination. Taking into account that, for example, an error of 30% is obtained in the literature when the same method is applied but using different protocols, TGA versus FT-IR/TOT agreement seems quite good taking into account that these two methodologies are based on different working procedures (TOT corrects for OC charring and TGA not). If we compare directly TGA/FT-IR with TOT good correlation coefficients are obtained (Table 1). The correlation is worst for EC. The regression slopes, with their standard deviations, are also shown.Furthermore in table 1 are reported average y/x values (TGA/FT-IR/TOT), standard deviations of the ratios and the distributions of the data pairs with difference (y – x) less than 1σ, between 1 and 2σ, between 2 and 3σ and greater than 3σ (Watson and Chow, 2002). It is worth noting that most of the samples are within 1σ for all the three components OC, EC and TC.
3. RESULTS AND DISCUSSION
1- INTRODUCTIONThe carbonaceous component of atmospheric aerosol, elemental carbon (EC), organic carbon (OC) and carbonate, makes up more than 50% of particulate matter (PM) total mass and is considered one of the most relevant PM fractions with respect to observed adverse health outcomes. In spite of the numerous studies focused on OC/EC quantification, nowadays a universal methodology for their determination doesn’t exist and, as a consequence, OC and EC are operationally defined by the method of analysis (Countess, 1990; Schmid, H. et al., 2001; Chow et al., 2004).The different methods employed in literature studies give results in fairly good agreement just with respect to total carbon (TC) concentrations while difficulties have been encountered in the determination of the two fractions i.e. EC and OC, in particular because of the pyroliticconversion of organics into elemental carbon (charring) during the sample analysis. The methods most commonly applied are based on thermal evolution and reflectance/transmission measurements and, amongst them TOT (Thermal-Optical Transmission) is widely employed. An alternative system recently set up in our laboratory is represented by TGA/FT-IR, which consists of a thermo-gravimetric analyzer coupled with an infrared spectrophotometer (Fermo et al., 2006).
In this study TGA/FT-IR and TOT are compared with each other. For this purpose, PTS and PM1 samples collected at different locations have been analyzed in parallel by the two systems. Comparability between methods used for OC/EC quantification should be achieved in order to guarantee the reliability of the results obtained by means of different techniques.
dev<1σ 1σ−2σ 2σ−3σ
OC TGA/FT-IR TOT 1.103 ± 0.034 0.085 ± 0.630 0.965 41 1.096 0.190 35 2 1EC TGA/FT-IR TOT 0.456 ± 0.037 0.471 ± 0.212 0.798 41 0.728 0.487 34 3 2TC (OC+EC) TGA/FT-IR TOT 0.957 ± 0.026 0.675 ± 0.614 0.973 41 1.007 0.166 32 7 1
distributionr² number
of pairs
average ratio of y/x ± standard deviation
y x regression slope ± standard error
intercept ± standard error