comparison between prediction models and monitored data …
TRANSCRIPT
Submit Manuscript | http://medcraveonline.com
Abbreviations: BDMEP, teaching and research meteorological database; CTR-SG, são gonçalo waste treatment center; HELP, hydrologic evaluation of landfill performance; INMET, Brazil’s national institute of meteorology
IntroductionSeveral mathematical and computational models were developed
with the purpose of interpreting landfills humidity dynamics. These models can be classified in some categories: water balance; saturated flow; unsaturated flow (uni and bi-dimensional); biochemical and hydrodynamic.1 Generally, leachate quantification is modeled based on the principles of water balance, estimating quantities of water that infiltrate the landfill, and subtracting water amounts lost through evaporation and consumed by the degradation of waste organic fraction. In this sense, several models are been applied and developed. The first attempts to quantify generation and evaluate leachate transport, using water balance approaches, were developed by El-Fadel et al.,2–4 Mathematical methods such as Swiss and Rational are characterized by simpler equations, while more complex mathematical models are generally implemented in computer programs, such as: MARS,5 ANFIS,6 HELP,7 MODUELO,8 SWB,9 LWB,10 and LAST.11 In addition to these, other methods such as CREAMS,12 HSSWDS,13 SOILINER,14 UNSAT-H,15 FULLFILL,16 FIL, PREFLOW,17 and
MOBYDEC,18 can also be applied, but their use is less referenced in the literature.
The development of a leachate prediction model that balances data requirement amount and results accuracy to different landfill contexts is complex. High data requirements can lead to a tortuous calibration process, without a clear improvement in simulation results, when compared to field data. In contrast, simplified approaches can mistakenly represent the main processes, leading to less reliable predictions.11 A bibliographic survey enabled the elaboration of the state of art of mathematical models and simulation programs, capable of predicting monthly leachate generation in a landfill. Based on the developed panorama, this paper aims to verify Swiss method and HELP performances, in order to provide ways to plan, design and manage landfills effectively. Therefore, results obtained by prediction models will be compared with measurement records of leachate generation from São Gonçalo Waste Treatment Center (CTR-SG), in the period of 2014 to 2018. In addition, input parameters that most influence leachate quantification modeling will be pointed out. Swiss method was selected as this is the most used system applied in Brazil’s landfill design. Moreover, it is an empirical model, simple to understand and with low input data requirement, three variables (average annual precipitation, landfill area and compaction coefficient). Among computational models, HELP was preferred
Int J Hydro. 2021;5(2):58‒64. 58©2021 Ley et al. This is an open access article distributed under the terms of the Creative Commons Attribution License, which permits unrestricted use, distribution, and build upon your work non-commercially.
Comparison between prediction models and monitored data on leachate generation from a sanitary landfill in the metropolitan region of rio de janeiro, Brazil
Volume 5 Issue 2 - 2021
Michelle Bellas Romariz Gaudie Ley,1 Ricardo Abranches Felix Cardoso Junior,2 Henrique Vieira de Mendonça,3 Alexandre Lioi Nascentes,4 Leonardo Duarte Batista da Silva5
1M.Sc. Biosystems Engineering, Federal Fluminense University, Brazil2PhD in Energy Planning, Professor at Federal Fluminense University, Brazil3PhD in Biodiversity and Nature Conservation, Professor at Federal Rural University of Rio de Janeiro, Brazil4PhD in Chemical and Biochemical Process Engineering, Professor at Federal Rural University of Rio de Janeiro, Brazil5PhD in Irrigation and Drainage, Professor at Federal Rural University of Rio de Janeiro, Brazil
Correspondence: Michelle Bellas Romariz Gaudie Ley, Federal Fluminense University, Rua Passo da Pátria, 156 - bloco D sala 236 - São Domingos, Niterói/RJ, 24210-240, Brazil, Tel +55 (21) 2629-5362, Email
Received: March 18, 2021 | Published: April 02, 2021
Abstract
Estimating leachate generation during a landfill lifespan is a key issue in reducing its potential risk. Hence, a useful tool is represented by empirical and computational models. In order to ratify the applicability of the Swiss Method, most applied tool in Brazil, and the Hydrologic Evaluation of Landfill Performance (HELP), most utilized in USA, the present article carried out a case study in the São Gonçalo Waste Treatment Center (CTR-SG), located in a humid subtropical climate. Firstly, climate data were collected with Brazil’s National Institute of Meteorology, and landfill structural and operational data were assembled with the company responsible for CTR-SG’ management, Foxx-Haztec, from 2014 to 2018. Subsequently, simulations were conducted on both tools, which indicated that: Swiss Method and HELP do not consider relevant variables for leachate prediction, such as: waste composition and moisture content, organic matter decomposition and dumping methods; thus, these techniques results vary mainly according to annual precipitation, landfill surface area and, for HELP, covering layer thickness. In addition, it was verified that the models forecasted approximately half of the actual volume of generated leachate. In this bias, despite the requirement of few and generally known parameters, these are not reliable tools for assertive prediction. Furthermore, it was found that the Swiss Method employs an imprecise variable, the compaction coefficient, which made pertinent the proposal of a new coefficient, suitable to tropical regions, which should be validated in other landfill scenarios.
Keywords: data science, mathematical models, simulation software, climate data, Swiss method, HELP
International Journal of Hydrology
Research Article Open Access

Comparison between prediction models and monitored data on leachate generation from a sanitary landfill in the metropolitan region of rio de janeiro, Brazil
59Copyright:
©2021 Ley et al.
Citation: Ley MBRG, Ricardo AFCJ, Mendonça HVD, et al. Comparison between prediction models and monitored data on leachate generation from a sanitary landfill in the metropolitan region of rio de janeiro, Brazil. Int J Hydro. 2021;5(2):58‒64. DOI: 10.15406/ijh.2021.05.00266
because it is the most limited in terms of input data requirement, since it already includes factors that are difficult to measure, such as: field capacity, wilting point and hydraulic conductivity. In addition, it is the most used tool in the United States. This study will be limited to humid subtropical climate regions, once this investigation considers the evaluated landfill location, which is São Gonçalo city, in Rio de Janeiro State, Brazil.
Material and methodsBibliographic Survey
The state of the art of mathematical models and simulation programs used to predict leachate generation rates was carried out by searching technical publications, these databases, projects, scientific articles and patent documents, using keywords previously chosen.
Study area
São Gonçalo Waste Treatment Center (CTR-SG), Rio de Janeiro State, Brazil, is situated in Anaia Pequeno neighborhood. IBGE (2002) define São Gonçalo city climate as humid subtropical, with rainy season during summer, from November to April, and dry season during winter, from May to October, July being the driest month. Operated by Foxx-Haztec19 CTR-SG occupies a total area of 106,500 m2, Figure 1, and receives waste from São Gonçalo and Niterói. The estimated population for both municipalities and the amount of waste collected daily are summarized in Table 1. CTR-SG sanitary cells are fragmented into three phases: first operated from 2010 to 2013; second operated from 2014 to 2018 and third is operational since November 2018. This study will analyze the years 2014 to 2018 and, therefore, will consider data collected during second phase activity. This cell has total capacity of 2,973,901 t of waste and was filled as described in Table 2. Annual waste contribution area refers to upper plateau’s areas and, therefore, may decrease from one year to the next. Landfill bottom is lined with a layer of 0.12 cm bentonite geocomposite (GCL) barrier soil; 0.2 cm thick textured HDPE geomembrane; and drainage consisting of: 250 cm in diameter horizontal drain (largest measuring 530 m in length) with 2% inclination, surrounded by 60 cm of gravel. Above liner, waste embankment layers are compacted, each measuring approximately 5 meters high. Received Municipal Solid Waste MSW are spread, levelled and, at the end of each day, covered by 30 cm of clay and compacted by ramp method, assisted by a D6N track-type tractor or similar type. Clay daily cover layers are removed before new waste is disposed. Landfill top is lined with a layer of 0.20 cm of clay soil; 0.08 cm thick textured HDPE geomembrane; and 1 meter of clay soil (compacted in layers of 40 cm maximum).
Figure 1 São Gonçalo Waste Treatment Plant.
Source: Foxx-Haztec19
Table 1 Estimated population served by and daily average Municipal Solid Waste (MSW) collected by CTR-SG
Year Population (habitants) MSW (T)
2014 1,527,373 54,000
2015 1,534,777 53,706
2016 1,541,941 46,462
2017 1,548,854 46,773
2018 1,589,473 46,485
Source: IBGE, 2019; Foxx-Haztec19
Table 2 Annual contribution
Year Waste contribution area (m2)
Waste contribution depth (m)
Landfill total area (m2)
2014 23,129.65 31 71,809.51
2015 12,252.65 45 95,511.82
2016 19,968.65 45 123,990.29
2017 50,237.35 45 151,910.07
2018 51,122.30 45 154,740.39
Source: Foxx-Haztec19
Gravimetric composition of MSW
Trucks that enter CTR-SG undergo a weighing scale, which assess amounts of waste collected. Waste gravimetric composition was defined by the Federal University of Rio de Janeiro (UFRJ - Environmental Engineering Program), which analysed quantity data and samples of received waste. This study was based on samples collected in May 2019. The materials were classified as recyclable, organic and diverse; with total moisture content of 50.36% and specific weight of 174.47 kg.m-3, Table 3.
Table 3 Physical composition of MSW received at CTR SG - partial results after the first day of collection
Composition Total average (%)
Organic 43.7
Paper 12.59
Plastic 22.56
Glass 1.2
Metal 2.19
Diverse 17.76
Moisture content 50.36
Specific weight (Kg.m-3) 174.47
Source: Foxx-Haztec19
Leachate quantification
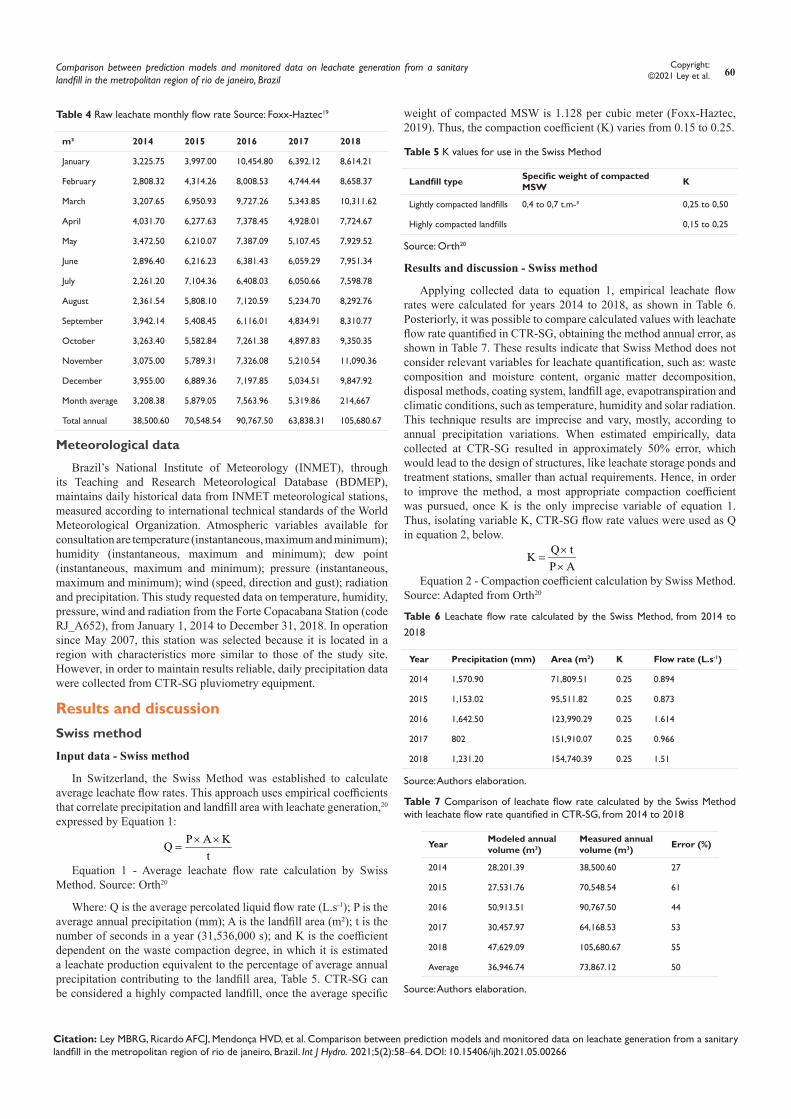
CTR-SG calculates raw leachate flow rate by comparing filled space with fall time. Volume and time data were obtained through manual reading, performed by two landfill employees, in possession of a graduated bucket and a stopwatch. For measurement, one employee positioned the bucket at the raw leachate outlet, while the other handled the stopwatch. This procedure was repeated monthly, from January 2014 to December 2018, Table 4.
Comparison between prediction models and monitored data on leachate generation from a sanitary landfill in the metropolitan region of rio de janeiro, Brazil
60Copyright:
©2021 Ley et al.
Citation: Ley MBRG, Ricardo AFCJ, Mendonça HVD, et al. Comparison between prediction models and monitored data on leachate generation from a sanitary landfill in the metropolitan region of rio de janeiro, Brazil. Int J Hydro. 2021;5(2):58‒64. DOI: 10.15406/ijh.2021.05.00266
Table 4 Raw leachate monthly flow rate Source: Foxx-Haztec19
m³ 2014 2015 2016 2017 2018
January 3,225.75 3,997.00 10,454.80 6,392.12 8,614.21
February 2,808.32 4,314.26 8,008.53 4,744.44 8,658.37
March 3,207.65 6,950.93 9,727.26 5,343.85 10,311.62
April 4,031.70 6,277.63 7,378.45 4,928.01 7,724.67
May 3,472.50 6,210.07 7,387.09 5,107.45 7,929.52
June 2,896.40 6,216.23 6,381.43 6,059.29 7,951.34
July 2,261.20 7,104.36 6,408.03 6,050.66 7,598.78
August 2,361.54 5,808.10 7,120.59 5,234.70 8,292.76
September 3,942.14 5,408.45 6,116.01 4,834.91 8,310.77
October 3,263.40 5,582.84 7,261.38 4,897.83 9,350.35
November 3,075.00 5,789.31 7,326.08 5,210.54 11,090.36
December 3,955.00 6,889.36 7,197.85 5,034.51 9,847.92
Month average 3,208.38 5,879.05 7,563.96 5,319.86 214,667
Total annual 38,500.60 70,548.54 90,767.50 63,838.31 105,680.67
Meteorological data
Brazil’s National Institute of Meteorology (INMET), through its Teaching and Research Meteorological Database (BDMEP), maintains daily historical data from INMET meteorological stations, measured according to international technical standards of the World Meteorological Organization. Atmospheric variables available for consultation are temperature (instantaneous, maximum and minimum); humidity (instantaneous, maximum and minimum); dew point (instantaneous, maximum and minimum); pressure (instantaneous, maximum and minimum); wind (speed, direction and gust); radiation and precipitation. This study requested data on temperature, humidity, pressure, wind and radiation from the Forte Copacabana Station (code RJ_A652), from January 1, 2014 to December 31, 2018. In operation since May 2007, this station was selected because it is located in a region with characteristics more similar to those of the study site. However, in order to maintain results reliable, daily precipitation data were collected from CTR-SG pluviometry equipment.
Results and discussionSwiss method
Input data - Swiss method
In Switzerland, the Swiss Method was established to calculate average leachate flow rates. This approach uses empirical coefficients that correlate precipitation and landfill area with leachate generation,20 expressed by Equation 1:
P A KQ
t× ×
=
Equation 1 - Average leachate flow rate calculation by Swiss Method. Source: Orth20
Where: Q is the average percolated liquid flow rate (L.s-1); P is the average annual precipitation (mm); A is the landfill area (m²); t is the number of seconds in a year (31,536,000 s); and K is the coefficient dependent on the waste compaction degree, in which it is estimated a leachate production equivalent to the percentage of average annual precipitation contributing to the landfill area, Table 5. CTR-SG can be considered a highly compacted landfill, once the average specific
weight of compacted MSW is 1.128 per cubic meter (Foxx-Haztec, 2019). Thus, the compaction coefficient (K) varies from 0.15 to 0.25.
Table 5 K values for use in the Swiss Method
Landfill type Specific weight of compacted MSW K
Lightly compacted landfills 0,4 to 0,7 t.m-³ 0,25 to 0,50
Highly compacted landfills 0,15 to 0,25
Source: Orth20
Results and discussion - Swiss method
Applying collected data to equation 1, empirical leachate flow rates were calculated for years 2014 to 2018, as shown in Table 6. Posteriorly, it was possible to compare calculated values with leachate flow rate quantified in CTR-SG, obtaining the method annual error, as shown in Table 7. These results indicate that Swiss Method does not consider relevant variables for leachate quantification, such as: waste composition and moisture content, organic matter decomposition, disposal methods, coating system, landfill age, evapotranspiration and climatic conditions, such as temperature, humidity and solar radiation. This technique results are imprecise and vary, mostly, according to annual precipitation variations. When estimated empirically, data collected at CTR-SG resulted in approximately 50% error, which would lead to the design of structures, like leachate storage ponds and treatment stations, smaller than actual requirements. Hence, in order to improve the method, a most appropriate compaction coefficient was pursued, once K is the only imprecise variable of equation 1. Thus, isolating variable K, CTR-SG flow rate values were used as Q in equation 2, below.
Q tKP A×
=×
Equation 2 - Compaction coefficient calculation by Swiss Method. Source: Adapted from Orth20
Table 6 Leachate flow rate calculated by the Swiss Method, from 2014 to 2018
Year Precipitation (mm) Area (m2) K Flow rate (L.s-1)
2014 1,570.90 71,809.51 0.25 0.894
2015 1,153.02 95,511.82 0.25 0.873
2016 1,642.50 123,990.29 0.25 1.614
2017 802 151,910.07 0.25 0.966
2018 1,231.20 154,740.39 0.25 1.51
Source: Authors elaboration.
Table 7 Comparison of leachate flow rate calculated by the Swiss Method with leachate flow rate quantified in CTR-SG, from 2014 to 2018
Year Modeled annual volume (m3)
Measured annual volume (m3) Error (%)
2014 28,201.39 38,500.60 27
2015 27,531.76 70,548.54 61
2016 50,913.51 90,767.50 44
2017 30,457.97 64,168.53 53
2018 47,629.09 105,680.67 55
Average 36,946.74 73,867.12 50
Source: Authors elaboration.

Comparison between prediction models and monitored data on leachate generation from a sanitary landfill in the metropolitan region of rio de janeiro, Brazil
61Copyright:
©2021 Ley et al.
Citation: Ley MBRG, Ricardo AFCJ, Mendonça HVD, et al. Comparison between prediction models and monitored data on leachate generation from a sanitary landfill in the metropolitan region of rio de janeiro, Brazil. Int J Hydro. 2021;5(2):58‒64. DOI: 10.15406/ijh.2021.05.00266
In the equation: K is the coefficient dependent on the waste compaction degree; Q is the average percolated liquid flow rate (L.s-1); t is the number of seconds in a year (31,536,000 s); P is the average annual precipitation (mm) and A is the landfill area (m²). Aiming to identify a correlation between compaction coefficient and precipitation, monthly variables were applied to Equation 2 for each month of the five years studied, obtaining average analysis shown in Figure 2, Figure 3 and Table 8. Averages trend lines in the charts above, in general, indicates that higher precipitation induces lower compaction coefficient. Thereby, it was considered pertinent to propose a new K applicable to subtropical regions. Thus, annual data was firstly applied to equation 2, obtaining the results shown in Table 9 below. In order to validate this new proposed coefficient, with approximate value of 0.5, a monthly analysis was carried out, and its annual average results are elucidated in Table 10, below. From results above, it can be concluded that a compaction coefficient of 0.5 is suitable for regions with humid subtropical climate.
Figure 2 Average monthly precipitation, from 2014 to 2018.
Figure 3 Average monthly compaction coefficients, from 2014 to 2018.
Table 8 Average monthly correlation between estimated compaction coefficient and precipitation.
Month Estimated K Precipitation (mm)
January 0.316 205.22
February 0.618 159.92
March 0.397 187.5
April 2.084 132.4
May 1.332 51.34
June 0.86 79.14
July 4.458 35.9
August 1.768 62.5
Month Estimated K Precipitation (mm)
September 3.026 70.38
October 2.106 53.76
November 0.352 153.1
December 0.65 88.76
Average 1.497 106.66
Source: Authors elaboration.
Table 9 Estimated annual compaction coefficient average, from 2014 to 2018.
Year Precipitation (mm) Area (m2) Annual collected
volume (m3) K
2014 1,570.90 71,809.51 38,500.60 0.341
2015 1,153.02 95,511.82 70,548.54 0.641
2016 1,642.50 123,990.29 90,767.50 0.446
2017 802 151,910.07 64,168.53 0.527
2018 1,231.20 154,740.39 105,680.67 0.555
Average 1,279.92 119,592.42 73,867.12 0.502
Source: Authors preparation
Table 10 Comparison between leachate flow rate quantified at CTR-SG and calculated by Swiss Method, with new compaction coefficient, from 2014 to 2018. Source: Authors elaboration.
Year Modeled annual volume (m3)
Annual collected volume (m3) Error (%)
2014 54,755.76 38,500.60 30
2015 53,887.06 70,548.54 -31
2016 99,773.11 90,767.50 9
2017 60,561.72 64,168.53 -6
2018 95,258.18 105,680.67 -11
Average 72,847.17 73,867.12 -1
HELP
Input data - HELP
Hydrologic Evaluation of Landfill Performance (HELP) computer program is a quasi-two-dimensional hydrological program of water movement across, into, through and out of landfills. It models runoff, evapotranspiration, infiltration and other water pathways to estimate how much water builds up above each landfill liner. The program is applicable to open, partially closed and fully closed sites, and was developed as a tool for designers and permit writers.7 The software calculates daily, monthly, annual and annual averages estimates. Thus, it requires data that can be categorized into three groups, as enumerated:
I. Meteorological data, including precipitation, temperature, relative humidity, average wind speed and solar radiation, Tables 11.1 and 11.2.
II. Soil and project data, including landfill area, field capacity, runoff, infiltration, waste layer thickness, texture, hydraulic conductivity, porosity, vegetation, drain spacing and lining placement, Table 12 and Table 13.
III. Waste data, including gravimetry, field capacity, porosity, hydraulic conductivity and humidity.
Table Continues...

Comparison between prediction models and monitored data on leachate generation from a sanitary landfill in the metropolitan region of rio de janeiro, Brazil
62Copyright:
©2021 Ley et al.
Citation: Ley MBRG, Ricardo AFCJ, Mendonça HVD, et al. Comparison between prediction models and monitored data on leachate generation from a sanitary landfill in the metropolitan region of rio de janeiro, Brazil. Int J Hydro. 2021;5(2):58‒64. DOI: 10.15406/ijh.2021.05.00266
In order to verify the variable area impact on simulation results, the program was run five times, analyzing annual waste contribution depth and total area variations separately.
Table 11.1 HELP meteorological input parameters
Parameters Values Authors source
Latitude -22.51o Foxx-Haztec
Evaporative zone depth 86 cm Foxx-Haztec
Maximum leaf area 0 Foxx-Haztec
Growing season 0 to 367 Foxx-Haztec
Precipitation Manual input of daily data Foxx-Haztec
Temperature Manual input of daily data BDMEP - INMET
Solar radiation Manual input of daily data BDMEP - INMET
Curve number Calculated by program (*) HELP
(*) Curve number modeled by HELP based on slope surface: 2%; slope length: 530 m; soil standard texture: 15; amount of vegetation cover: 1 (bare ground). Based on these data, the program will use 96.3.
Source: Authors elaboration.
Table 11.2 HELP meteorological input parameters
Year Annual average wind speed (kph)
Quarterly average relative humidity Authors source
2014 9.386 74.91%; 77.55%; 75.19%; 76.50% BDMEP - INMET
2015 9.421 74.50%; 77.00%; 76.10%; 78.34% BDMEP - INMET
2016 9.669 76.13%; 76.98%; 75.26%; 78.09% BDMEP - INMET
2017 9.611 75.55%; 77.27%; 75.43%; 78.10% BDMEP - INMET
2018 9.614 75.85%; 77.40%; 75.84%; 78.44% BDMEP - INMET
Source: Authors elaboration.
Table 12 HELP project input parameters (*)
Year Landfill area (m2) Waste annual depth (m)
2014 71,809.51 31
2015 95,511.82 45
2016 123,990.29 45
2017 151,910.07 45
2018 154,740.39 45
(*) Percent area where runoff is possible: 100%. Initial moisture storage: initialize by the program to approximately steady state.
Source: Foxx-Haztec19
Table 13 HELP soil input parameters
Laye
r
Laye
r ty
pe (
*)
Laye
r th
ickn
ess
(cm
)
Soil
text
ure
Poro
sity
(v.
v-1)
Fiel
d ca
paci
ty (
v.v-1
)
Wilt
ing
poin
t (v
.v-1)
Satu
rate
d hy
drau
lic
cond
ucti
vity
(cm
.s-1)
Max
imum
dra
in le
ngth
(m
)
Dra
in s
lope
(%
)
1 1 10 12 - silty clayey soil 0.471 0.342 0.21 4.2 x 10⁻⁵ - -
2 1 Table 2 19 - RSU 0.671 0.292 0.077 0.001 - -
3 2 60 21 - gravel 0.397 0.032 0.013 0.3 - -
4 2 250 20 - drain 0.85 0.01 0.005 10 530 2
5 4 0.2 35 - HDPE - - - 2 x 10-13 - -
6 3 0.12 16 - barrier soil 0.427 0.418 0.367 1.0 x 10⁻⁷ - -
Legend: Layer type - (1) vertical percolation; (2) lateral drainage; (3) barrier soil liner; (4) flexible membrane liner.
(*) HDPE liner data: pinhole density: 0 holes.ha-1; installation defects: 0 holes.ha-1; placement quality: perfect (1); hydraulic saturation conductivity (vapor diffusivity): - cm2.s-1.
Results - HELP
HELP predicts the liquid height that accumulates on top of membrane liner, as well as leakage through it. Results are expressed as daily, monthly and yearly average values, segmented into ‘top, drain and leak’ sets. Top expresses leakage calculated for intact sections of geomembrane, drain refers to sections with installation defects and leak to sections with pinholes. For CTR-SG simulations,
total leachate generated is the sum of lateral drainage collected from layer 4, head on top of layer 5, and percolation/leakage through layer 6. However, leachate collected encompasses solely layers 4 and 5, since layer 6 comprises percolation losses to the soil below the landfill. Leachate quantities results are expressed as one-dimension height and, to obtain generated leachate volume, this output must be multiplied by landfill area. Simulation outputs include total annual

Comparison between prediction models and monitored data on leachate generation from a sanitary landfill in the metropolitan region of rio de janeiro, Brazil
63Copyright:
©2021 Ley et al.
Citation: Ley MBRG, Ricardo AFCJ, Mendonça HVD, et al. Comparison between prediction models and monitored data on leachate generation from a sanitary landfill in the metropolitan region of rio de janeiro, Brazil. Int J Hydro. 2021;5(2):58‒64. DOI: 10.15406/ijh.2021.05.00266
averages of water balance components, by modelled year, Table 14, as well as final water storage at end of last analyzed year, per layer,
Table 15. Finally, Table 16 summarizes and compares measured and simulated leachate quantities from 2014 to 2018.
Table 14 HELP simulation results - total annual averages
Variable 2014 (mm) 2015 (mm) 2016 (mm) 2017 (mm) 2018 (mm) Average (mm)
Precipitation 1570.9 1153 1642.5 802 1231.2 1279.92
Surface runoff 630.932 301.957 643.597 155.735 374.001 421.244
Evapotranspiration 509.898 435.845 397.802 431.022 479.531 450.82
Lateral drainage collected from layer 4 430.07199 415.1976 601.19446 215.27205 377.5761 407.8624
Average head on top of layer 5 1.806 1.764 2.537 0.904 1.59 1.72
Percolation/leakage through layer 6 0.00009 0.00009 0.00011 0.00007 0.00008 0.00009
Source: Authors elaboration.
Table 15 HELP simulation results - total liquid storage
Layer 2014 (cm) 2015 (cm) 2016 (cm) 2017 (cm) 2018 (cm)
1 0.9651 1.2149 0.7315 1.1814 0.9426
2 223.7959 327.9015 326.9168 326.8547 328.3586
3 3.5434 3.5135 4.2924 3.3208 3.9941
4 0.3034 0.2994 0.6521 5.1292 0.2895
5 0 0 0 0 0
6 0.0512 0.0512 0.0512 0.0512 0.0512
Source: Authors elaboration.
Table 16 Comparison between leachate flow rate quantified at CTR-SG and calculated by HELP, from 2014 to 2018
Year Modeled annual volume (m3) Collected annual volume (m3) Error (%)
2014 31,012.95 38,500.60 19
2015 39,824.76 70,548.54 44
2016 74,856.84 90,767.50 18
2017 32,839.32 63,838.31 49
2018 58,672.31 105,680.67 44
Average 47,441.24 73,867.12 36
Source: Authors preparation.
Discussion HELP
Input data
HELP is one of the most used landfill design tools in the United States. However, it does not consider waste progressive disposition, water content, aging and other important processes that affect leachate generation. In addition, studies indicate that hydraulic conductivities of landfilled materials are smaller than HELP standard values, probably due to modern compaction practices. Waste organic fraction biodegradation and compression processes (which progressively increases with waste deposition) directly interfere in leachate production, for example, changing hydraulic conductivity, field capacity and waste porosity over time. HELP neglects these phenomena and assumes constant parameters, simulating leachate transport and generation after all waste is placed and stability conditions are reached, leading to lower leachate prediction. USA and Canada cities meteorological data are extracted directly from those countries
weather database. However, cities outside these require manual input of evapotranspiration, precipitation, temperature and solar radiation daily data, resulting in an extremely laborious step. CTR-SG has a single central drainage network 250 cm thick, at landfill bottom. However, on soil and project data tab, drainage networks can only be programmed with 0.5 and 0.6 cm thickness, soil textures numbers 20 and 34, respectively. Thus, model standard texture, number 20, was used, and 250 cm were specified as thickness input data. In addition, as the program calculates annual accumulation, landfill structure was considered during an operational year, that is, before final coverage. Finally, it was found that precipitation, area and coverage data are the parameters that most influence outcomes. Since precipitation and area are collected data, coverage variable was used to calibrate the model. Thus, instead of 30 cm of daily clay coverage, estimated by landfill operators, 10 cm were considered, which resulted in flow rates more adjusted to collected data.

Comparison between prediction models and monitored data on leachate generation from a sanitary landfill in the metropolitan region of rio de janeiro, Brazil
64Copyright:
©2021 Ley et al.
Citation: Ley MBRG, Ricardo AFCJ, Mendonça HVD, et al. Comparison between prediction models and monitored data on leachate generation from a sanitary landfill in the metropolitan region of rio de janeiro, Brazil. Int J Hydro. 2021;5(2):58‒64. DOI: 10.15406/ijh.2021.05.00266
Simulation results
Table 14 exposes that precipitation is composed on average by 32.9% runoff, 35.2% evapotranspiration and 31.9%, remaining fraction, infiltration. This may be due to the model assuming that all landfill water movement occurs in vertical direction, that landfill is in its field capacity, since calculations beginning, and that leachate recirculation does not occur. As shown in table 16, the difference between HELP modeling and CTR-SG measurements resulted on an average error of 36%. This would lead to underestimated leachate collection and treatment stations design. Therefore, the applicability this model, in subtropical regions, is conditioned to a correction factor of approximately 40%.21-25
ConclusionSimulations ran in annual periods promoted a more robust analysis
of meteorological, soil and design data interference on both models results. The variables that most influence on swiss and HELP methods results are precipitation and area, plus covering layer thickness for HELP. It is worth mentioning that, for calculations, landfill total area must be used, not only waste contribution area. Both methods modeled leachate flow rates approximately by half, making it necessary to use a correction factor, in order to even lack of adjustment. Thus, despite requiring few and generally known parameters, these are not reliable tools for assertive prediction. Finally, the Swiss Method adjustment proposes a model suitable for the studied scenario. Therefore, as suggestion for future research, in order to confirm the validity of estimated compaction coefficient, this value should be applied to other landfill contexts.
AcknowledgmentsThe authors are grateful to FAPERJ - Fundação Carlos Chagas
Filho de Amparo à Pesquisa do Estado do Rio de Janeiro (Process E-26/202.750/2019) for financial support.
Conflicts of interestThe author declares there is no conflict of interest.
References1. Catapreta CAA. An experimental landfill behavior: evaluation of influence
from design, building and operation. Ph.D. Thesis, Federal University of Minas Gerais: 2008. p. 361.
2. El-Fadel M, Findikakis AN, Leckie JO. Modeling leachate generation and transport in solid waste landfills. Environmental Technology. 1997;18(7):669–686.
3. Korfiatis GP, Demetracopoulos AC, Bourodimos EL, et al. Moisture transport in a solid waste column. Journal of Environmental Engineering. 1984;110:780–796.
4. Straub WA, Lynch DR. Models of landfill leaching: moisture flow and inorganic strength. Journal of Environmental Engineering. 1982;108:231–250.
5. Friedman JH. Multivariate adaptive regression splines. The Annals of Statistics. 1991;19:1–141.
6. Jang JR. ANFIS: Adaptive-network-based fuzzy inference system. IEEE Transactions on Systems, Man, and Cybernetics. 1993;23:665–685.
7. Schroeder PR, Aziz NM, Lloyd CM, et al. The Hydrologic Evaluation of Landfill Performance (HELP) model: user’s guide for version 3. United States Environmental Protection Agency. 1994.
8. Lobo A, Lantarón JH, Fernández OM. Modelling for environmental assessment of municipal solid waste landfills (Part 1: Hydrology). Waste Management & Research. 2002;20:198–210.
9. Velásquez MTO, Cruz-Rivera R, Rojas-Valencia N, et al. Serial water balance method for predicting leachate generation in landfills. Waste Management & Research. 2003;21:127–136.
10. Pantini S, Verginelli I, Lombardi F. A new screening model for leachate production assessment at landfill sites. International Journal of Environmental Science and Technology. 2014;11:1503–1516.
11. Grugnaletti M, Pantini S, Verginelli I, et al. An easy-to-use tool for the evaluation of leachate production at landfill sites. Waste Management. 2016;55:204–219.
12. Knisel WG, Nicks AD. CREAMS - A field scale model for chemical, runoff, and erosion from agricultural management system. United States Department of Agriculture. 1980. p. 1–690.
13. Perrier ER, Gibson AC. Hydrologic simulation on solid waste disposal sites (HSSWDS). United States Environmental Protection Agency. 1981.
14. Johnson RA. SOILINER Model - Documentation and user’s guide. United States Environmental Protection Agency. 1986.
15. Fayer MJ, Gee GW, Jones TL. UNSAT-H Version 10: unsaturated flow code documentation and applications for the Hanford Site (PNL--5899). Pacific Northwest Laboratory, United States. 1986.
16. Noble JJ, Arnold AE. Experimental and mathematical modeling of moisture transport in landfill. Chemical Engineering Communications. 1991;100(1):95–111.
17. Uguccioni M, Zeiss CH. Improvement of leachate prediction through municipal solid waste layers. Journal of the American Water Resources Association. 1997;33(6):1265–1278.
18. Guyonnet D, Didier-Guelorget B, Provost G, et al. Accounting for water storage effects in landfill leachate modelling. Waste Management & Research. 1998;16(3):285–295.
19. Foxx-Haztec. São Gonçalo Waste Treatment Center - Foxx-Haztec company information’s. 2019.
20. Orth MHA. Landfills. Revista de Limpeza Pública. São Paulo. 1981;20:26–34.
21. IBGE. Brazilian Institute of Geography and Statistics. Population estimates. 2019.
22. IBGE. Brazilian Institute of Geography and Statistics. Brazilian climate map. 2002.
23. INMET. Brazil National Institute of Meteorology. Last accessed. 2019.
24. Khanbilvardi RM, Shabbir A, Gleason PJ. Flow investigation for landfill leachate (FILL). Journal Environmental Engineering. 1995;121:45–57.
25. Kjeldsen P, Barlaz MA, Rooker AP, et al. Present and long-term composition of MSW landfill leachate: a review. Critical Reviews in Environmental Science and Technology. 2002;32:297–336.