comparison between electrochemical capacitors...
TRANSCRIPT

1
Comparison between electrochemical capacitors based
on NaOH and KOH activated carbons
Silvia Roldán, Isabel Villar, Vanesa Ruíz, Clara Blanco, Marcos Granda, Rosa Menéndez, Ricardo
Santamaría*
Instituto Nacional del Carbón (CSIC), P.V. Box 73, 33080-Oviedo (Spain)
* Corresponding author. E-mail : [email protected]
Abstract. This work describes the chemical activation of a coke using two different activating agents in
order to investigate their behaviour as electrodes in supercapacitors. A coke was chemically activated
with two hydroxides (KOH and NaOH) under nitrogen flow, at a constant mass hydroxide/coke ratio of
2 and temperatures of 600, 650 and 700 ºC. All the samples were characterized in terms of porosity by
N2 sorption at 77 K, surface chemistry by temperature programmed desorption (TPD) and electrical
conductivity. Their electrochemical behaviour as electric double layer capacitors was determined using
galvanostatic, voltammetric and impedance spectroscopy techniques, in an aqueous medium with 1M
H2SO4 as electrolyte. Large differences in capacitive behaviour with the increase in current density were
found between the two series of activated samples. The different trends were correlated with the results
obtained from the TPD analysis of the CO-type oxygen groups. It was found that these oxygen groups
make a positive contribution to capacitance finding a good correlation between the specific capacitance
values and the amount of these oxygen groups was found for both series.
Keywords. Coke ; chemical activation ; activation temperature; carbon electrodes ; electrochemical
properties; supercapacitors.

2
1. Introduction
Chemical activation is now considered as an efficient technique for preparing microporous active
carbons. Several advantages make it better than physical activation for this purpose, namely: it is a
single-step process, high burn-offs can be reached in a short time, it gives rise very high specific surface
areas and a well-developed microporosity with a controlled micropore size distribution. However,
chemical activation shows some disadvantages of chemical activation process, such as the corrosiveness
of the process and the washing stage1.
Among the classical reagents which can be used for chemical activation2, alkali hydroxides seem to
be those in which the microporosity of the as-prepared materials is the most developed. For this reason,
the number of studies related to the preparation of activated carbons by chemical activation with KOH3-
7 and, more recently, with NaOH3,5,7,8 is increasing. This last hydroxide, an activating agent scarcely
referred to the literature, has some advantages over KOH. The most important are its low price, simple
handling procedure and less corrosive behaviour, all of which are of interest especially from an
industrial point of view.
It has been shown4 that some experimental variables have a strong influence on the porosity of the
activated carbons prepared by chemical activation with hydroxides: the activating agent/carbon ratio,
the method of mixing the activating agent and carbon, the temperature and flow of gas during
carbonization, etc.
As far as we know, the number of studies that employ NaOH as activating agent is still relatively low.
In particular, no detailed study of the effect of heat treatment on the electrochemical properties of the
resultant activated carbons has yet been reported. Only studies employing activation with KOH have
been published4. Even though NaOH and KOH are related compounds, the direct transfer of results
from KOH to NaOH activation is not a simple matter. This is because the reaction mechanisms of these
two hydroxides are different. KOH intercalates between carbon layers9, while NaOH reacts with the
most energetic sites of the surface, thus displaying a reactivity which strongly depends on the

3
6KOH + 2C 2K + 2K2CO3 + 3H2
6NaOH + 2C 2Na + 2Na2CO3 + 3H2
aromaticity and cristallinity of the carbonaceous precursor10-12. Nevertheless, the overall reactions of
these precursors with carbonaceous materials are similar as can be seen from equations Eq 1 and Eq 210.
Eq 1
Eq 2
In the present paper, a coke was activated with KOH and NaOH following a procedure in which the
only parameter allowed to vary was the temperature of activation. The objective of this work is to study
the effect of temperature on the resultant activated materials in order to compare and optimize their
behaviour as electrodes of supercapacitors.
2. Experimental Section
2.1. Preparation of the activated carbons
A coke obtained from a coal tar pitch at 500°C for 4 h under nitrogen, with 100 % mesophase content,
was used as raw material. It was ground and sieved to a particle size of less than 400 μm. Chemical
activation was performed using KOH and NaOH as activating agents. The activated carbons were
obtained by means of physical mixing. The coke was mixed, by stirring, with the activating agent
(anhydrous NaOH or KOH) at a weight ratio of 1:2. The resulting mixture was then carbonized.
Carbonization was carried out in an electric furnace. The samples were heated (2.3ºC.min-1) from
room temperature, under a nitrogen flow rate of 500 ml.min-1, and then kept at different final
temperatures (600, 650 or 700 ºC), for 1 hour, before being cooling down under nitrogen.
The pyrolyzed samples were washed repeatedly with a 3 M solution of HCl and then with distilled
water until a pH of 6.5 were obtained in order to remove chloride ions. Once the activating agent was
removed, the resultant materials were dried at 110ºC for 24 hours.
The activated carbons produced at the different temperatures were designated as NaOH-600, NaOH-
650, NaOH-700, KOH-600, KOH-650 and KOH-700, where the letters refer to the activating agent and
the numbers to the carbonization temperature.

4
2.2. Characterization of the activated carbons.
2.2.1. Porous texture.
Porous texture characterization was carried out by physical adsorption of nitrogen at 77 K. Isotherms
were obtained on an ASAP 2020 Micromeritics apparatus using around 50 mg of sample in each
experiment. The pores were classified according to IUPAC recommendations13 into micropores (< 2 nm
width), mesopores (2-50 nm width) and macropores (> 50 nm width). The apparent surface area was
determined from the N2-adsorption isotherm using the BET equation. The total micropore volume (VN2)
was calculated by applying the Dubinin-Radushkevich equation14 to the N2 adsorption isotherms, and
the total pore volume was obtained from N2 adsorption when P/Pº = 0.99. The volume of mesopores
was calculated by subtracting the total micropore volume (VN2) from the total pore volume. The
microporous surface area was obtained from the equation: Smic (m2. g-1) = 2000 VN2 (cm3. g-1)/L0 (nm),
where L0 represents the average micropore width15.
2.2.2. Chemical characterization
The activated carbons were characterized by elemental analysis. Carbon, hydrogen, sulphur and
nitrogen contents were determined using a LECO-CHNS-932 microanalyzer. The oxygen content was
obtained directly using a LECO-TF-900 furnace coupled to the same microanalyzer.
To characterize the surface chemistry of all the samples, temperature programmed desorption (TPD)
experiments were performed in a U-shaped quartz cell coupled to a mass spectrometer in order to
determine the amount and type of the oxygenated functionalities. In these experiments about 50 mg of
sample was heated up to 1000 ºC, at a heating rate of 10 ºC.min-1, under a helium flow rate of 50
mL.min-1.

5
2.2.3. Electrical conductivity
The electrical conductivity of the activated samples was determined using a four-point method16.
Measurements were performed at various pressures up to 40 MPa. These were calculated using a loaded
cell for high accuracy.
2.3. Electrode preparation and electrochemical characterization
For the electrochemical characterization, disk type electrodes were prepared using 10 wt.% of
polyvinylidene fluoride (PVDF) as binder and 90 wt.% of active material. The materials were mixed
and pressed up to 450 kg for 15 min. The diameter of each electrode was 12 mm. Hence, each electrode
had a geometric surface area of 1.13 cm2.The total electrode weight used for the measurements was
about 30 mg. The electrodes were dried overnight before the cell was assembled. An aqueous solution
of 1 M sulphuric acid was used as electrolyte, and so gold disks were used as current collectors in order
to eliminate parasitic reactions. Glass fibre disks were employed as separators.
The electrochemical tests were performed in a Swagelok® cell, commonly used for testing electrode
materials in electrochemical capacitors. This consists of two tightly screwed cylinders that act as current
collectors for the two electrodes, to ensure good electrical contacts and a high reproducibility of results.
The electrochemical measurements were conducted in a Biologic multichannel potenciostat.
Voltammetry experiments at a scan rate of 1 to 50 mV.s-1, galvanostatic charge/discharge tests in a
voltage range of 0 to 1 V and impedance spectroscopy tests from 100 KHz to 1 mHz were carried out to
assess the electrochemical behaviour of the activated materials. The capacitance values were expressed
in Farads (F) per mass of active material present in the lightest electrode.
3. Results and discussion
3.1. Chemical characterization
The activation yields for the KOH-activated samples were rather similar for all temperatures studied,
about 75%, whereas the yields for the NaOH-activated samples were in all cases ~ 65%.

6
The elemental composition of the activated carbons obtained in this study is shown in Table 1. It can
be observed that, for both series, the oxygen content is significantly higher at lower activation
temperatures. In order to clarify these results, both the KOH- and the NaOH-activated samples were
characterized by TPD. Figs. 1 and 2 show the TPD profiles corresponding to the studied samples.
The surface oxygen groups on the carbon materials decompose upon heating, producing CO and CO2
at different temperatures. It is known that CO2 evolves at low temperatures as a consequence of the
decomposition of acidic groups such as carboxylic groups, anhydrides or lactones17,18,19,20. The
evolution of CO occurs at higher temperatures and is originated by the decomposition of basic or neutral
groups such as phenols, ethers and carbonyls17,18,19,20.
The results of TPD ( Table 2) indicate that, in both series, the amount of CO evolved was larger than
that of CO2. They also show that the lower the carbonization temperature, the greater the amount of
oxygen groups. The decrease in the amount of CO and CO2 evolved with the carbonization temperature
is due to the increase in the extent of activation with the rise in temperature, according to equations (1)
and (2). This means that, during activation higher intrapore hydrogen concentrations are formed, which
destabilize and react with the oxygen surface groups21.
Moreover, the samples chemically activated with NaOH have a higher CO- and CO2-type group
content than the KOH activated samples. These results are consistent with the data obtained by
elemental analysis.
3.2. Porosity characterization
The N2 adsorption isotherms obtained at 77 K for the KOH and the NaOH activated carbons are
presented in Fig. 3. All the samples exhibit Type I isotherms according to the IUPAC classification13.
This is characteristic of microporous solids, there being a sharp increase in the amount of nitrogen
adsorbed at low relative pressures until a plateau is formed.
The parameters of the porous texture of both series of activated carbons calculated from the isotherms
are presented in Tables 3 and 4.

7
It is interesting to note that the capacity of the samples activated with NaOH to adsorb nitrogen is
hardly affected by the reduction in carbonization temperature. The BET surface area of these samples is
around 920 m2.g-1 for all the temperatures tested. In the case of samples activated with KOH, a slight
decrease in micropore surface is observed with decreasing carbonization temperature, from 1636 m2.g-1
for 700 ºC to 1547 m2.g-1 for 600 ºC). Moreover, KOH activation can give rise to higher microporous
materials under the same experimental conditions than NaOH activation.
It can also be seen from Fig. 3 that the isotherms of the NaOH-samples show a steady increase in
nitrogen adsorption at higher pressures, and some hysteresis in the desorption branch, which is
indicative of the presence of mesopores. This is consistent with the data obtained from the isotherms. In
both series, it can be seen that the samples activated with NaOH have a higher mesopore volume than
the KOH-activated samples, as one might expect from the shape of the isotherms. In general terms, the
higher the carbonization temperature, the higher the mesopore volume in both series of samples.
3.3. Electrical conductivity
The activated carbons obtained at the higher temperatures show the best conductivity as shown in
Figure 4. This increase in electrical conductivity upon activation occurs because activation removes the
most disorganized parts of the precursor23. The porous carbons with the highest conductivity are those
prepared with NaOH as activating agent.
3.4. Electrochemical properties
Table 5 contains the specific capacitance values estimated from the galvanostatic discharge at a
constant current intensity of 2 mA (this corresponds to a current of about 65 mA.g-1).
To calculate the specific capacitance (F.g-1) from the galvanostatic experiments, the values of current
applied (mA) are multiplied by the discharge time (s). The charge (q) obtained is then divided by the
range of voltage (V) in which the capacitor is discharged. Taking into account the two electrode system,
the capacitance of a single electrode is obtained multiplying the above result by two and dividing by the

8
mass of the smaller electrode. Capacitance can be related to the mass of the electrode or to the mass of
the active material. In our case, capacitance is always expressed in Farads per active carbon material. In
order to calculate from the cyclic voltammetry measurements, the capacitive current (A) is divided by
the scan rate (V.s-1). The specific capacitance of a single electrode is C = 2 Ccell/mass in the active
material of the smallest pellet.
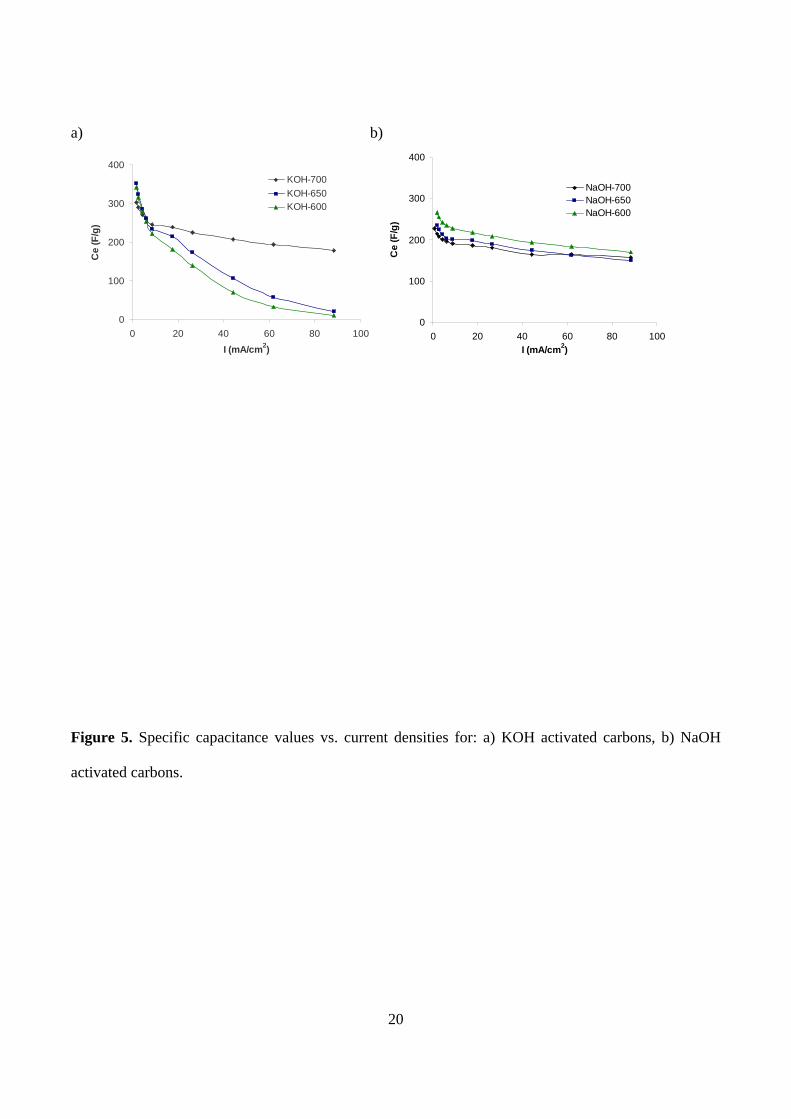
Figure 5 shows the dependence of the specific capacitance values on the current density for both
series of activated samples. The galvanostatic experiments showed that activation with KOH at lower
temperature leads to specific capacitance values that are highly dependent on current density. In fact, for
the sample activated at 700 ºC the capacitance values decrease with the increase in current density (in
the range studied) by only 40%, while this reduction is over 90% for the other two carbons (Table 5).
However, the samples activated with NaOH show a rather different behaviour. Capacitance decreases
with current density to a similar extent for all the samples. Moreover, for both series of activated
carbons, the sample with the highest capacitance at 2 mA is not the sample with the highest BET
surface area. Therefore other factors, apart from the surface area, must be contributing to the
enhancement of capacitance.
Figure 6 shows the voltammogram profiles of all the activated samples. Samples KOH-650 and KOH-
600 show a marked deviation from the ideal rectangular shape typical of cyclic voltammograms.
However, samples activated with NaOH exhibit a quasi-rectangular shape in the voltammograms.
The differences between the two series may be due to the accessibility of porous network to the ions
or to the type of chemical reactions occurring on the carbon surface. For all the samples studied, the
average pore size was higher than 0.7 nm, while the ions used for this study had a Stokes radius lower
than 0.24 nm (radius for the solvated species). Therefore, the problem of accessibility of the ions must
be discarded as the reason for the different behaviours, as demonstrated elsewhere for aqueous
solutions22. Therefore, only differences in faradic contribution can explain the divergent behaviours.
Cyclic voltammetry in a three-electrode configuration is an excellent technique for studying the
presence of pseudocapacitive phenomena. Materials with pseudocapacitance show redox peaks related

9
CxO + H+ + e CxOH
to electron transfer reactions. The voltammograms in Figure 7 show the redox processes corresponding
to samples KOH-650 and KOH-700. It should be noted that these redox reactions occur both in the
cathodic and anodic regions, which means that capacitance is used in the symmetric cell.
For a deeper understanding of the influence of the oxygen functionalities on the capacitance values,
we tried to correlate the specific capacitance (capacitance divided by the BET surface area) with the
amount of surface oxygen groups desorbed as CO (also divided by the BET surface area too)23 (Figure
8). An excellent correlation between specific capacitance and the amount of CO-type groups was found,
indicating that these oxygen groups make a positive contribution to the capacitance of the porous
carbons, as reported.23,24,25,26,27.
The reason for the positive contribution to capacitance is either due to the improved wettability of the
carbon material by the electrolyte, especially in the case of aqueous solutions, as a result of which the
ions have better access to microporosity, or to the faradaic process involving oxygen groups that
contribute to pseudocapacitance23. These oxygen surface groups are mainly hydroxyl, carbonyl or
quinone complexes which can undergo through the well-known mechanism for the
quinone/hydroquinone redox pair (Eq 3).
Eq 3
It has been suggested that oxygen functionalities are detrimental to the behaviour of supercapacitors
as charge and discharge voltages may alter the surface oxygen groups, producing a loss in capacitance28.
All of the capacitors were cycled in a galvanostatic regime of 8.84mA.cm-2 (270 mA.g-1) in order to
assess their durability. A good cycling behaviour was obtained for NaOH-samples and for KOH-700,
with a reduction in the capacitance values of only about 17% after 6000 cycles. On the contrary, the
long-term cycling for KOH-650 and KOH-600 was rather poor, with a reduction of about 60% and
75%, respectively, after 6000 cycles. For these samples, the large contribution of pseudocapacitance
negatively affects the long-term behaviour of the supercapacitor, as expected29

10
The different behaviour of the capacitance of the activated samples on the current density may also be
related to their differences in electrical conductivity. As can be seen from the impedance spectra (Fig.
9), samples activated with KOH at lower temperatures show a large semicircle in the mid-high
frequency zone, which is related to the high intrinsic electrical resistance of the activated carbon30, and
the presence of faradaic reactions. This resistance results in a high kinetic dependence on faradaic
fenommena with current density. However, the NaOH-activated carbons impedance spectra do not show
a semicircle in the mid-high frequency zone, which indicates a better resistive behaviour of the material.
This is consistent with the ohmnic drop obtained in the electrochemical analysis (0.5 V for the ohmic
drop in the charge-discharge test for the NaOH-samples, and ~ 4 V for KOH-650 and KOH-600).
4. Conclusions
The TPD results showed that, at the lower activation temperatures, samples activated with NaOH
have a higher oxygen content than those activated with KOH.
The porosity characterization results showed that all of the activated carbons produced are essentially
microporous. KOH activation produces highly microporous materials, whereas when NaOH is used as
activating agent, a material with a higher mesopore volume is produced. For both the NaOH and KOH
series, it was found that the BET surface area increases with temperature.
The influence of the activation temperature on the electrochemical characteristics of the KOH- and
NaOH-activated carbons is rather different. With NaOH as activating agent, the activated carbons show
a similar electrochemical behaviour at all the activation temperatures. However, the samples activated
with KOH at temperatures lower than 700 ºC displayed a strong resistance due to the high
pseudofaradaic contribution, resulting in an electrochemical behaviour that is highly dependent on the
current density. The results show that CO-type oxygen groups make a positive contribution to
capacitance, a good correlation being found between specific capacitance and this particular type of
oxygen group.

11
The marked deviations in capacitive behaviour with current density for the KOH-650 and KOH-600
samples indicate that electrical conductivity is an important parameter in double layer capacitor
performance. The electrical conductivity tests showed that the higher the activation temperature, the
higher the conductivity obtained.
Acknowledgment
This work was supported by the MICIN (Project MAT2007-61467). Silvia Roldán thanks MICIN for
a FPI predoctoral grant.
REFERENCES
[1] Teng, H.; Lin, H. C. Am. Inst. Chem. Eng. J., 1998; 44 (5), 1170-1177.
[2] Molina-Sabio, M; Rodríguez-Reinoso, F. Colloids and Surfaces 2044, 241, 15-25.
[3] Illán-Gómez, M. J.; García-García, A.; Salinas-Martínez de Lecea, C.; Linares-Solano, A. Energy
Fuels 1996, 10, 1108-1114.
[4] Lozano-Castelló, D; Lillo-Ródenas, M. A.; Cazorla-Amorós, D.; Linares-Solano, A. Carbon 2001,
39, 741-749.
[5] Lillo-Ródenas, M. A.; Lozano-Castelló, D.; Cazorla-Amorós, D.; Linares-Solano, A. Carbon
2001, 39, 751-759.
[6] Teng, H.; Hsu, L. Ind. Eng. Chem. Res. 1999, 38, 2947-2953.
[7] Evans, M. J. B.; Halliop, E.; MacDonald, J. A. F. Carbon 1999, 37, 269-274.
[8] Hayashi, J.; Watkinson, A. P.; Teo K. C.; Takemoto, S.; Muroyama, K. Coal Sci 1995, 1, 1121-
1124.

12
[9] Díaz-Teran, J.; Nevskaia, D. M.; Fierro, J. L. G.; López-Peinado, A. J.; Jerez, A. Micropor.
Mesopor. Mat. 2003, 60, 173-181.
[10] Lillo-Ródenas, M. A.; Cazorla-Amorós, D.; Linares-Solano A. Carbon 2003, 41, 267-275.
[11] Lillo-Ródenas, M. A.; Cazorla-Amorós, D.; Linares-Solano, A.; Béguin, F.; Clinard, C.;
Rouzaud, J. N. Carbon 2004, 42, 1305-1310.
[12] Lillo-Ródenas, M. A.; Juan-Juan, J.; Cazorla-Amorós, D.; Linares-Solano, A. Carbon 2004, 42,
1371-1375.
[13] Sing, K. S. W.; Everett, D.H.; Haul, R.A.W.; Moscou, L.; Pierotti P.A.; Rouquerol, J. Pure Appl.
Chem. 1985, 57,603-619.
[14] Dubinin, M. M. in: Porosity in carbons; J. W. Patrick (Ed.), Edward Arnold, London, 1995;
chapter 3.
[15] Stoeckli, H. F. in: Porosity in carbons; J. W. Patrick (Ed.), Edward Arnold, London, 1995;
chapter 3.
[16] L. J. Van der Pauw, Philips Technical Review 20 (1958) 220.
[17] Kinoshita, K. Carbon: Electrochemical properties and Physicochemical properties; New York,
Wiley, 1998.
[18] Rodriguez-Reinoso, F.; Molina-Sabio, M. Adv. Coll. Inter. Sci. 1998, 76-77 895-902.
[19] Román-Martínez, M. C.; Cazorla-Amorós, D.; Linares-Solano, A.; Salinas-Martínez de Lecea, C.
Carbon 1993, 31, 895-902.
[20] Figueredo J. L.; Pereira, M. F. R.; Freitas, M. M. A.; Órfao, J. J. M. Carbon 1999, 37, 1379-
1389.

13
[21] Calo, J. M.; Cazorla-Amoros, D.; Linares-Solano, A.; Roman-Martínez, M. C.; Salinas-Martínez
de Lecea, C. Carbon, 1997, 35, 543-554.
[22] Ruiz, V.; Blanco, C.; Santamaría, R.; Juárez-Galán, J. M.; Sepúlveda-Escribano, A.; Rodríguez-
Reinoso, F. Microporous Mesoporous Mater. 2008, 110, pp 431-435.
[23] Bleda-Martínez, M. J.; Maciá-Agulló, J. A.; Lozano-Castelló,D.; Morallón,E.; Cazorla-Amorós,
D.; Linares-Solano,A. Carbon 2005, 43, 2677-2684.
[24] Hsieh, C.; Teng, H. Carbon 2002, 40, 667-674.
[25] Okajima, K.; Ohta, K.; Sudoh, M. Electrochim Acta 2005, 50, 2227-2231.
[26] Centeno,T. A.; Hahn, M.; Fernández, J. A; Kötz, R.; Stoeckli, F. Electrochemistry
Communications 2007, 9, 1242-1246.
[27] Centeno, T. A.; Stoeckli, F. Electrochimica Acta 2006, 52 (2), 560-566.
[28] Kierzek, K.; Frackowiak, E.; Lota, G.; Gryglewicz, G.; Machnikowski, J. Electrochimica Acta
2004, 49, 515-523.
[29] Kierzek, K; Frackowiak, E; Lota, G; Gryglewicz, G; Machnikowski, J. Electrochimica Acta
2004, 49, 515-523.
[30] Andrieu, X.; Crépy, G.; Josset, L. Contribution at the 3er international seminar: On Double layer
Capacitors and Similar Energy Storage Devices; Florida Educational Seminar Editors, Deerfield Beach
FL, USA, December 1993, 3-5.

14
FIGURE CAPTIONS
Fig 1. TPD curves corresponding to CO desorption in KOH- and NaOH-activated samples.
Fig 2. TPD curves corresponding to CO2 desorption in KOH- and NaOH-activated samples.
Figure 3. Nitrogen adsorption isotherms of carbons activated with: a) KOH, b) NaOH.
Figure 4. Electrical conductivity values at different pressures.
Figure 5. Specific capacitance values vs. current densities for: a) KOH activated carbons, b) NaOH
activated carbons.
Figure 6. Cyclic voltammograms in a two-electrode cell for: a) KOH and b) NaOH activated carbons.
Figure 7. Cyclic voltammograms in a three-electrode cell for: a) KOH and b) NaOH activated carbons.
Figure 8. Capacitance / BET surface area v.s CO content / BET surface area for: a) KOH-activated
samples and b) NaOH-activated samples.
Figure 9. Impedance spectroscopy plot. Extended high frequency region of: a) KOH-activated carbons,
b) NaOH-activated carbons.
15
TABLE CAPTIONS
Table 1. Elemental composition of activated carbons.
Table 2. TPD analysis for the activated carbons.
Table 3. Textural parameters of carbons activated with KOH.
Table 4. Textural parameters of carbons activated with NaOH.
Table 5. Specific capacitance values of the KOH and NaOH-activated carbons estimated
by galvanostatic discharge at 2 mA and capacitance decrease values with current density.

16
0
0,0004
0,0008
0,0012
0 200 400 600 800 1000
T (ºC)
mm
ol/g
.s
NaOH-700
KOH-700
KOH-600
KOH-650 NaOH-650
NaOH-600
Fig 1. TPD curves corresponding to CO desorption in KOH- and NaOH-activated samples.

17
0
0,0001
0,0002
0,0003
0 200 400 600 800 1000T (ºC)
mm
ol/g
.s
NaOH-600
NaOH-700
NaOH-650KOH-600
KOH-650
KOH-700
Fig 2. TPD curves corresponding to CO2 desorption in KOH- and NaOH-activated samples.

18
0
200
400
600
0 0,2 0,4 0,6 0,8 1P/Pº
Vads
(cm
3 /g)
KOH-700KOH-650KOH-600
0
200
400
600
0 0,2 0,4 0,6 0,8 1P/Pº
Vads
(cm
3 /g)
NaOH-700NaOH-650NaOH-600
a) b)
Figure 3. Nitrogen adsorption isotherms of carbons activated with: a) KOH, b) NaOH.

19
0
2
4
6
0 10 20 30 40 50
P (MPa)
K (S
/cm
)
KOH-600
NaOH-700
NaOH-650
NaOH-600
KOH-700
KOH-650
Figure 4. Electrical conductivity values at different pressures.
20
0
100
200
300
400
0 20 40 60 80 100I (mA/cm2)
Ce
(F/g
)
NaOH-700NaOH-650NaOH-600
a) b)
0
100
200
300
400
0 20 40 60 80 100I (mA/cm2)
Ce
(F/g
)
KOH-700KOH-650KOH-600
Figure 5. Specific capacitance values vs. current densities for: a) KOH activated carbons, b) NaOH
activated carbons.

21
-600
-300
0
300
600
0 0,2 0,4 0,6 0,8 1
E (V)
Ce
(F/g
)
NaOH-600
NaOH-650
NaOH-700
-600
-300
0
300
600
0 0,2 0,4 0,6 0,8 1
E (V)
Ce
(F/g
)
KOH-650 KOH-600 KOH-700
a) b)
Figure 6. Cyclic voltammograms in a two-electrode cell for: a) KOH and b) NaOH activated carbons.

22
-600
-400
-200
0
200
400
600
-0,6 -0,1 0,4
V (V) vs Hg/Hg2SO4
Ce
(F/g
) NaOH-650
NaOH-600
NaOH-700
-600
-400
-200
0
200
400
600
-0,7 -0,2 0,3
V (V) vs Hg/Hg2SO4
Ce
(F/g
)
KOH-600
KOH-700KOH-650
a) b)
Figure 7. Cyclic voltammograms in a three-electrode cell for: a) KOH and b) NaOH activated carbons.

23
0
0,1
0,2
0,3
0 0,5 1 1,5
CO (μmol/g) / BET(m2/g)
Ce(
F/g)
/ B
ET(m
2 /g)
KOH-600
KOH-700
KOH-650
0
0,1
0,2
0,3
0 1 2 3
CO (μmol/g) / BET (m2/g)
Ce(
F/g)
/ B
ET(m
2 /g)
NaOH-700
NaOH-650NaOH-600
a) b)
Figure 8. Capacitance / BET surface area v.s CO content / BET surface area for: a) KOH-activated
samples and b) NaOH-activated samples.

24
a) b)
0
40
80
120
160
200
0 50 100 150 200Z´ (Ω /g)
-Z´´(Ω
/g)
KOH-700KOH-650KOH-600
0
40
80
120
160
200
0 50 100 150 200Z´ (Ω /g)
-Z´´(Ω
/g)
NaOH-700NaOH-650NaOH-600
Figure 9. Impedance spectroscopy plot. Extended high frequency region of: a) KOH-activated carbons,
b) NaOH-activated carbons.

25
Table 1. Elemental composition of activated carbons.
Sample C (wt.%
)
H (wt.%
)
N (wt.%
)
S (wt.%
)
O (wt.%
)
Sample C (wt.%)
H (wt.%)
N (wt.%)
S (wt.%)
O (wt.%)
KOH-700 92.24 0.77 0.89 0.09 6.00 NaOH-700 95.34 0.55 0.52 0.07 3.52
KOH-650 89.71 1.25 1.20 0.15 7.68 NaOH-650 92.91 0.67 0.54 0.07 5.81
KOH-600 89.78 1.52 1.22 0.18 7.30 NaOH-600 88.96 0.99 0.59 0.10 9.35

26
Table 2. TPD analysis for the activated carbons.
Sample CO (mmol.g-1)
CO2 (mmol.g-1)
Sample CO (mmol.g-1)
CO2 (mmol.g-1)
KOH-700 1.14 0.18 NaOH-700 0.96 0.21
KOH-650 1.73 0.3 NaOH-650 1.75 0.44
KOH-600 1.73 0.33 NaOH-600 2.5 0.8

27
Table 3. Textural parameters of carbons activated with KOH.
Sample SBET (m2/g)
Smic (m2/g)
E0 (KJ/mol)
L0 (nm)
Vtotal (cm3/g)
Vmic (cm3/g)
Vmeso (cm3/g)
KOH-700 1480 1636 24.55 0.8 0.75 0.67 0.07
KOH-650 1397 1624 25.35 0.77 0.66 0.63 0.03
KOH-600 1272 1547 26.04 0.74 0.61 0.57 0.04
SBET, BET apparent area Vtotal, total volume of pores
Smic, microporous surface Vmic, micropore volume
E0, characteristic energy Vmes, mesopore volume
L0, average pore width

28
Table 4. Textural parameters of carbons activated with NaOH.
Sample SBET (m2/g)
Smic (m2/g)
E0 (KJ/mol)
L0 (nm)
Vtotal (cm3/g)
Vmic (cm3/g)
Vmeso (cm3/g)
NaOH-700 922 804 23.51 0.9 0.54 0.36 0.18
NaOH-650 936 886 24.05 0.85 0.50 0.38 0.12
NaOH-600 918 868 24.13 0.85 0.49 0.37 0.12
SBET, BET apparent area Vtotal, total volume of pores
Smic, microporous surface Vmic, micropore volume
E0, characteristic energy Vmes, mesopore volume
L0, average pore width

29
Table 5. Specific capacitance values of the KOH and NaOH-activated carbons estimated
by galvanostatic discharge at 2 mA and capacitance decrease values with current density.
Sample Specific capacitance Capacitance decrease with current density (F/g) (%)
KOH-700 302.4 41,0 KOH-650 350.9 96.9 KOH-600 341.9 91.4 NaOH-700 227.3 20.4 NaOH-650 234.8 36.4 NaOH-600 265.3 35.9