comparison and harmonization of building wind loading codes among the asia-pacific economies
TRANSCRIPT
RESEARCH ARTICLE
Comparison and harmonization of building wind loadingcodes among the Asia-Pacific Economies
Yaojun GEa*, Shuyang CAOa, Xinyang JINb
a State Key Laboratory for Disaster Reduction in Civil Engineering, Tongji University, Shanghai 200092, Chinab China Academy of Building Research, Beijing 100013, China*Corresponding author. E-mail: [email protected]
© Higher Education Press and Springer-Verlag Berlin Heidelberg 2013
ABSTRACT This paper reviews wind loading codes and standards in the Asia-Pacific Region, in particular in the 15countries and areas. A general description of wind loading model is given as a famous wind loading chain described byfour variables including velocity pressure, exposure factor, pressure coefficient, and gust response factor. Through theAPEC-WW Workshops and the extensive calculations for three examples of low, medium and high rise buildings, thesefour important variables of wind loads are evaluated and compared with statistical parameters, mean values andcoefficients of variation. The main results of the comparison show some differences among the 15 economies, and thereasons and further incorporation are discussed and suggested.
KEYWORDS wind loading, codification, velocity pressure, exposure factor, pressure coefficient, gust response factor
1 Introduction
After John Smeaton of England originated a formula forwind pressure loads in 1759, wind actions on structuresand structural elements have to be considered in the designas one partial load among various design loads. Todetermine wind actions on structures, each country needsto have appropriate codification to specify wind loadingand to determine wind induced responses in structuraldesign, which results in numerous wind loading codes andstandards in the world, for example, the ASCE Code [1],the Australian and New Zealand Standard [2], the NationalBuilding Code of Canada [3], the Japan Recommendations[4], the European Standard [5], the International Organiza-tion for Standardization [6], and so on. Under theglobalization of construction industry and the developmentof unified international codes and standards, it is necessaryto better understand and compare the underlying differ-ences among international or regional wind loadingstandards in order to further incorporate for futurealignments of wind loading and even wind resistancedesign codes and standards.
The previous studies on the major internationalstandards mentioned above have found that the dominantcontributions to the scatter in wind loading were thevarying definitions of wind field characteristics, includingmean wind velocity profile and some turbulence windparameters [7,8]. Some other published papers and reportsfor the Asia-Pacific Economic Cooperation (APEC)countries and areas have shown the significant importanceon extreme wind speeds of tropical cyclones and the otherextremes of benign monsoons and local thunderstormdowndrafts for design [9,10].With the support of the Centre of Excellence (COE) and
the Global COE inWind Engineering at Tokyo PolytechnicUniversity in Japan, a new practical outcome of compara-tive study on wind loading codes and standards among aregional area composed of a group of bordering countriesor areas have been launched through six Workshops onRegional Harmonization of Wind Loading and WindEnvironmental Specifications in the Asia-Pacific Econo-mies (APEC-WW) since 2004. At the 2nd APEC-WW inHong Kong in 2005, three particular examples werepurposely assigned for each country or area representingthree typical building models, including a low-risebuilding, a medium-rise building and a high-rise building.Article history: Received Jun. 18, 2013; Accepted Sept. 28, 2013
Front. Struct. Civ. Eng. 2013, 7(4): 402–410DOI 10.1007/s11709-013-0230-x
In the subsequent two Workshops, the design wind loadson three building examples have been evaluated andcompared in accordance with the wind loading codes andstandards of 15 Asia-Pacific Economies [11]. The basicresults of three examples and the obvious reasons fordifferences were summarized by Holmes, Tamura andKrishna [12]. A series of papers related to benchmarkanalysis of these three typical buildings were published andpresented in the 7th Asia-Pacific Regional Conference onWind Engineering [13–19], and the further discussion weremade on regional wind velocity map, unified terraincategories and model code for low-rise buildings in the 5thand 6th APEC-WW Workshops at Taipei, China in 2009and at Gangwondo Korea in 2010.With the background of the APEC-WWWorkshops, this
paper is going to make further quantitative and statisticalcomparison and contrast of wind loading componentsbased on various codes and standards in 15 Asia-PacificEconomies, including the Australian and New ZealandStandards (AN) [2], the National Building Code of Canada(CC) [3], the China National Standard (CS) [20], the Codeof Practice on Wind Effects of Hong Kong (HK) [21], theIndian Standard Code (IC) [22], the Standard NationalIndonesia (IS) [23], the Recommendations for Loads onBuildings of Japan (JR) [4], the Korean Building Code(KC) [24], the Malaysian Standard (MS) [25], the NationalStructural Code of Philippines (PC) [26], the SingaporeStandard (SS), the Taiwan Building Code (TC) [27], theWind Load Code of Thailand (TC) [28], the United States’ASCE Code of [1] and the Loads and Actions Norm forDesign of Vietnam (VN) [29].A general description of wind loading model can be
given by a well known process, a wind loading chain,proposed by Davenport [30], and consisted of fourcomponents
W ¼ qCeCpCg, (1)
in which q is a reference wind pressure or velocity pressuremainly depending on wind velocity, Ce is an exposurefactor to adjust for the terrain conditions and the height, Cp
is a pressure coefficient related to structural shape and Cg isa gust response factor (GRF) due to turbulent wind actions(gust loading factor GLF) or structural dynamic response(dynamic response factor DRF). These four componentsare numerically calculated and statistically analyzedthrough three building examples and based on the 15wind loading codes and standards of Asia-Pacific Econo-mies in this paper.
2 Velocity pressure
Reference velocity pressure q can be simply described bythe square of reference wind velocity U as follows:
q ¼ 1
2�U2, (2)
in which ρ is an air density and has the value of 1.16 to 1.25kg/m3 with the average of 1.22 kg/m3 and the coefficient ofvariation of 2% among 15 codes or standards listed inTable 1 [11], and the value of reference wind velocity Ubasically depends upon three conditions, including refer-ence height, averaging time and return period, which arediscussed as follows.Wind velocity varies with height above the ground in the
atmospheric boundary layer, which can be described bywind velocity profiles with either Power Law or Logarith-mic Law in most wind loading codes or standards. Thevalues of design wind velocity are different at differentlevels, and are used to be calculated from the basic level orthe reference height, at which the reference or basic windvelocity is defined. Table 1 shows that the unified referenceheight of 10 m is used in all 15 Economies’ codes orstandards.The values of wind velocity are largely controlled by the
averaging time since natural wind velocity fluctuates withtime. The shorter averaging time is the higher value ofwind velocity will be since the maximum wind velocitysample is always chosen in consideration. There aregenerally three kinds of averaging time adopted in windloading codes and standards, that is, 3 s, 10 min and 1 h.Theoretically, the averaging time should be determined bydominant extreme wind events, for example, 3 s forthunderstorm downdrafts or outflows, 10 min for tropicalcyclones or typhoons and 1 h for extratropical gales. Inpractice, each code or standard provides only one out ofthree kinds of averaging time shown in Table 1. If the ratioof wind velocity values is assumed to be 1.5:1.0:0.92 forthe averaging time of 3 s:10 min:1 h, the mean value andcoefficient of variation of wind velocity values due toaveraging time were computed and listed in Table 1 basedon the 15 economies’ codes or standards.Design wind velocity is also governed by the return
period in the way that its value increases with the increaseof a return period. The return period for the design windvelocity is 50 years, 100 years or 500 years among the 15Economies’ codes or standards in Table 1. Although thereare good reasons for selecting one or another, the mostpopular return period is 50 years. With the assumption ofGumbel Distribution of wind velocity, the wind velocityratio of R-year to L-year return periods can be expressed asfollows:
UR
UL¼ aL – bLln – ln 1 –
1
R
� �� �, (3)
in which UR and UL are the wind velocities for R-year andL-year return periods, respectively, aL and bL are constantsfor L-year return periods, and R is a return period. Takingthe result from the statistical study for wind velocity inShanghai [31], aL and bL are equal to 0.625 and 0.096 for50 year return period, respectively, and accordingly theratio of wind velocity values is 1:1.07:1.22 for the return
Yaojun GE et al. Comparison and harmonization of building wind loading codes among the Asia-Pacific Economies 403
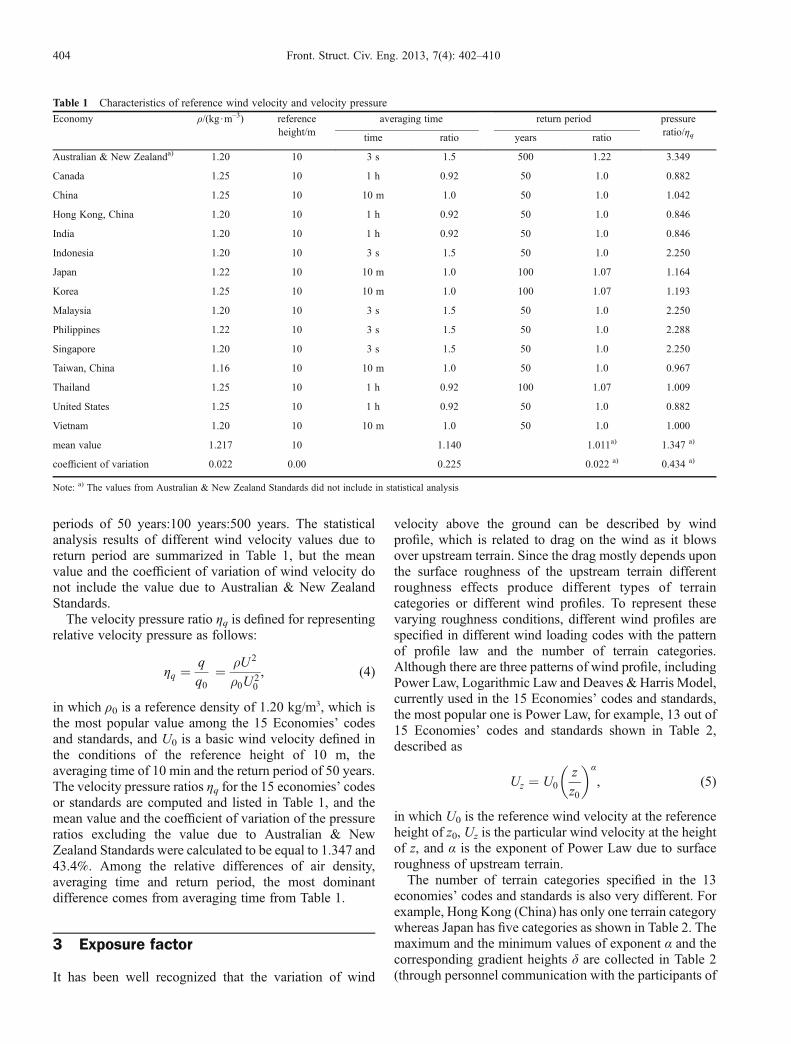
periods of 50 years:100 years:500 years. The statisticalanalysis results of different wind velocity values due toreturn period are summarized in Table 1, but the meanvalue and the coefficient of variation of wind velocity donot include the value due to Australian & New ZealandStandards.The velocity pressure ratio ηq is defined for representing
relative velocity pressure as follows:
ηq ¼q
q0¼ �U 2
�0U20
, (4)
in which ρ0 is a reference density of 1.20 kg/m3, which isthe most popular value among the 15 Economies’ codesand standards, and U0 is a basic wind velocity defined inthe conditions of the reference height of 10 m, theaveraging time of 10 min and the return period of 50 years.The velocity pressure ratios ηq for the 15 economies’ codesor standards are computed and listed in Table 1, and themean value and the coefficient of variation of the pressureratios excluding the value due to Australian & NewZealand Standards were calculated to be equal to 1.347 and43.4%. Among the relative differences of air density,averaging time and return period, the most dominantdifference comes from averaging time from Table 1.
3 Exposure factor
It has been well recognized that the variation of wind
velocity above the ground can be described by windprofile, which is related to drag on the wind as it blowsover upstream terrain. Since the drag mostly depends uponthe surface roughness of the upstream terrain differentroughness effects produce different types of terraincategories or different wind profiles. To represent thesevarying roughness conditions, different wind profiles arespecified in different wind loading codes with the patternof profile law and the number of terrain categories.Although there are three patterns of wind profile, includingPower Law, Logarithmic Law and Deaves & Harris Model,currently used in the 15 Economies’ codes and standards,the most popular one is Power Law, for example, 13 out of15 Economies’ codes and standards shown in Table 2,described as
Uz ¼ U0z
z0
� �α
, (5)
in which U0 is the reference wind velocity at the referenceheight of z0, Uz is the particular wind velocity at the heightof z, and α is the exponent of Power Law due to surfaceroughness of upstream terrain.The number of terrain categories specified in the 13
economies’ codes and standards is also very different. Forexample, Hong Kong (China) has only one terrain categorywhereas Japan has five categories as shown in Table 2. Themaximum and the minimum values of exponent α and thecorresponding gradient heights δ are collected in Table 2(through personnel communication with the participants of
Table 1 Characteristics of reference wind velocity and velocity pressure
Economy ρ/(kg$m–3) referenceheight/m
averaging time return period pressureratio/ηqtime ratio years ratio
Australian & New Zealanda) 1.20 10 3 s 1.5 500 1.22 3.349
Canada 1.25 10 1 h 0.92 50 1.0 0.882
China 1.25 10 10 m 1.0 50 1.0 1.042
Hong Kong, China 1.20 10 1 h 0.92 50 1.0 0.846
India 1.20 10 1 h 0.92 50 1.0 0.846
Indonesia 1.20 10 3 s 1.5 50 1.0 2.250
Japan 1.22 10 10 m 1.0 100 1.07 1.164
Korea 1.25 10 10 m 1.0 100 1.07 1.193
Malaysia 1.20 10 3 s 1.5 50 1.0 2.250
Philippines 1.22 10 3 s 1.5 50 1.0 2.288
Singapore 1.20 10 3 s 1.5 50 1.0 2.250
Taiwan, China 1.16 10 10 m 1.0 50 1.0 0.967
Thailand 1.25 10 1 h 0.92 100 1.07 1.009
United States 1.25 10 1 h 0.92 50 1.0 0.882
Vietnam 1.20 10 10 m 1.0 50 1.0 1.000
mean value 1.217 10 1.140 1.011a) 1.347 a)
coefficient of variation 0.022 0.00 0.225 0.022 a) 0.434 a)
Note: a) The values from Australian & New Zealand Standards did not include in statistical analysis
404 Front. Struct. Civ. Eng. 2013, 7(4): 402–410
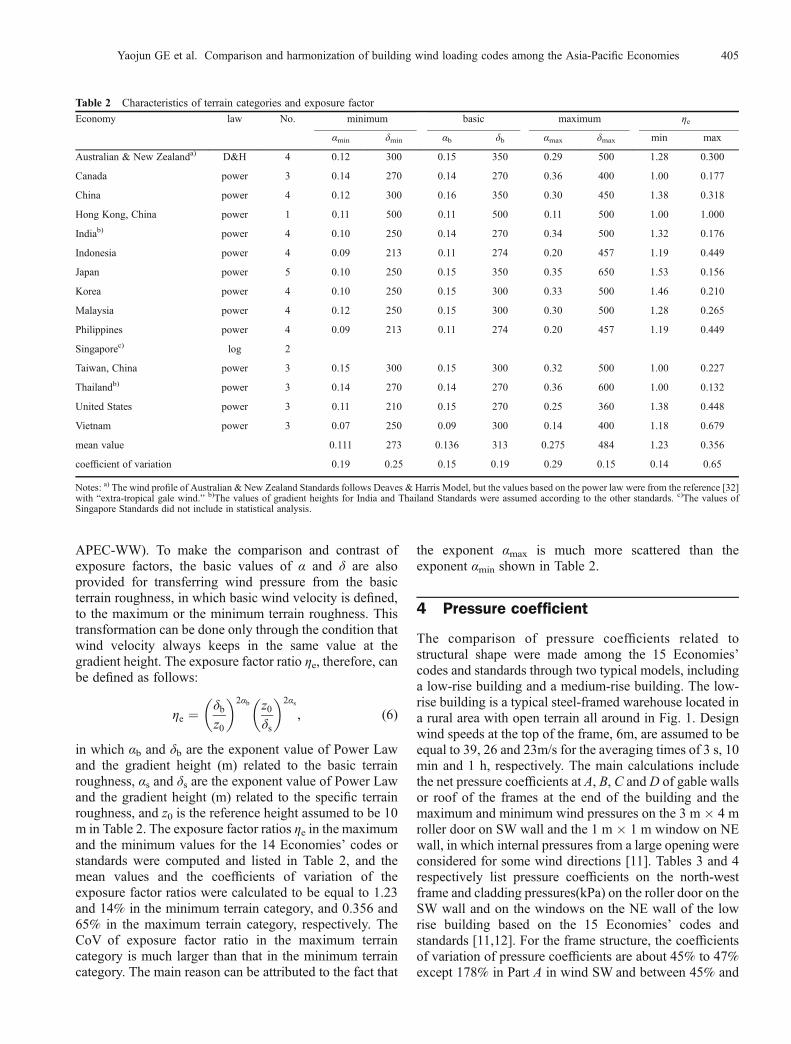
APEC-WW). To make the comparison and contrast ofexposure factors, the basic values of α and δ are alsoprovided for transferring wind pressure from the basicterrain roughness, in which basic wind velocity is defined,to the maximum or the minimum terrain roughness. Thistransformation can be done only through the condition thatwind velocity always keeps in the same value at thegradient height. The exposure factor ratio ηe, therefore, canbe defined as follows:
ηe ¼δbz0
� �2αb z0δs
� �2αs
, (6)
in which αb and δb are the exponent value of Power Lawand the gradient height (m) related to the basic terrainroughness, αs and δs are the exponent value of Power Lawand the gradient height (m) related to the specific terrainroughness, and z0 is the reference height assumed to be 10m in Table 2. The exposure factor ratios ηe in the maximumand the minimum values for the 14 Economies’ codes orstandards were computed and listed in Table 2, and themean values and the coefficients of variation of theexposure factor ratios were calculated to be equal to 1.23and 14% in the minimum terrain category, and 0.356 and65% in the maximum terrain category, respectively. TheCoV of exposure factor ratio in the maximum terraincategory is much larger than that in the minimum terraincategory. The main reason can be attributed to the fact that
the exponent αmax is much more scattered than theexponent αmin shown in Table 2.
4 Pressure coefficient
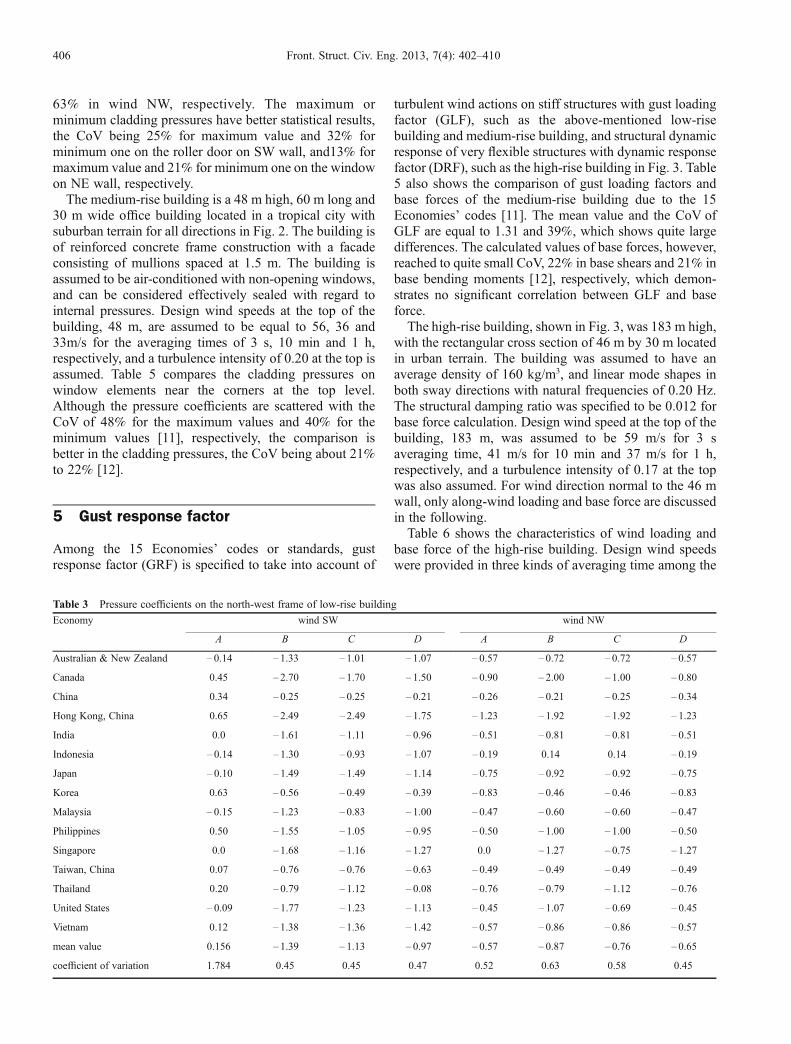
The comparison of pressure coefficients related tostructural shape were made among the 15 Economies’codes and standards through two typical models, includinga low-rise building and a medium-rise building. The low-rise building is a typical steel-framed warehouse located ina rural area with open terrain all around in Fig. 1. Designwind speeds at the top of the frame, 6m, are assumed to beequal to 39, 26 and 23m/s for the averaging times of 3 s, 10min and 1 h, respectively. The main calculations includethe net pressure coefficients at A, B, C and D of gable wallsor roof of the frames at the end of the building and themaximum and minimum wind pressures on the 3 m � 4 mroller door on SW wall and the 1 m � 1 m window on NEwall, in which internal pressures from a large opening wereconsidered for some wind directions [11]. Tables 3 and 4respectively list pressure coefficients on the north-westframe and cladding pressures(kPa) on the roller door on theSW wall and on the windows on the NE wall of the lowrise building based on the 15 Economies’ codes andstandards [11,12]. For the frame structure, the coefficientsof variation of pressure coefficients are about 45% to 47%except 178% in Part A in wind SW and between 45% and
Table 2 Characteristics of terrain categories and exposure factor
Economy law No. minimum basic maximum ηe
αmin δmin αb δb αmax δmax min max
Australian & New Zealanda) D&H 4 0.12 300 0.15 350 0.29 500 1.28 0.300
Canada power 3 0.14 270 0.14 270 0.36 400 1.00 0.177
China power 4 0.12 300 0.16 350 0.30 450 1.38 0.318
Hong Kong, China power 1 0.11 500 0.11 500 0.11 500 1.00 1.000
Indiab) power 4 0.10 250 0.14 270 0.34 500 1.32 0.176
Indonesia power 4 0.09 213 0.11 274 0.20 457 1.19 0.449
Japan power 5 0.10 250 0.15 350 0.35 650 1.53 0.156
Korea power 4 0.10 250 0.15 300 0.33 500 1.46 0.210
Malaysia power 4 0.12 250 0.15 300 0.30 500 1.28 0.265
Philippines power 4 0.09 213 0.11 274 0.20 457 1.19 0.449
Singaporec) log 2
Taiwan, China power 3 0.15 300 0.15 300 0.32 500 1.00 0.227
Thailandb) power 3 0.14 270 0.14 270 0.36 600 1.00 0.132
United States power 3 0.11 210 0.15 270 0.25 360 1.38 0.448
Vietnam power 3 0.07 250 0.09 300 0.14 400 1.18 0.679
mean value 0.111 273 0.136 313 0.275 484 1.23 0.356
coefficient of variation 0.19 0.25 0.15 0.19 0.29 0.15 0.14 0.65
Notes: a) The wind profile of Australian & New Zealand Standards follows Deaves & Harris Model, but the values based on the power law were from the reference [32]with “extra-tropical gale wind.” b)The values of gradient heights for India and Thailand Standards were assumed according to the other standards. c)The values ofSingapore Standards did not include in statistical analysis.
Yaojun GE et al. Comparison and harmonization of building wind loading codes among the Asia-Pacific Economies 405
63% in wind NW, respectively. The maximum orminimum cladding pressures have better statistical results,the CoV being 25% for maximum value and 32% forminimum one on the roller door on SW wall, and13% formaximum value and 21% for minimum one on the windowon NE wall, respectively.The medium-rise building is a 48 m high, 60 m long and
30 m wide office building located in a tropical city withsuburban terrain for all directions in Fig. 2. The building isof reinforced concrete frame construction with a facadeconsisting of mullions spaced at 1.5 m. The building isassumed to be air-conditioned with non-opening windows,and can be considered effectively sealed with regard tointernal pressures. Design wind speeds at the top of thebuilding, 48 m, are assumed to be equal to 56, 36 and33m/s for the averaging times of 3 s, 10 min and 1 h,respectively, and a turbulence intensity of 0.20 at the top isassumed. Table 5 compares the cladding pressures onwindow elements near the corners at the top level.Although the pressure coefficients are scattered with theCoV of 48% for the maximum values and 40% for theminimum values [11], respectively, the comparison isbetter in the cladding pressures, the CoV being about 21%to 22% [12].
5 Gust response factor
Among the 15 Economies’ codes or standards, gustresponse factor (GRF) is specified to take into account of
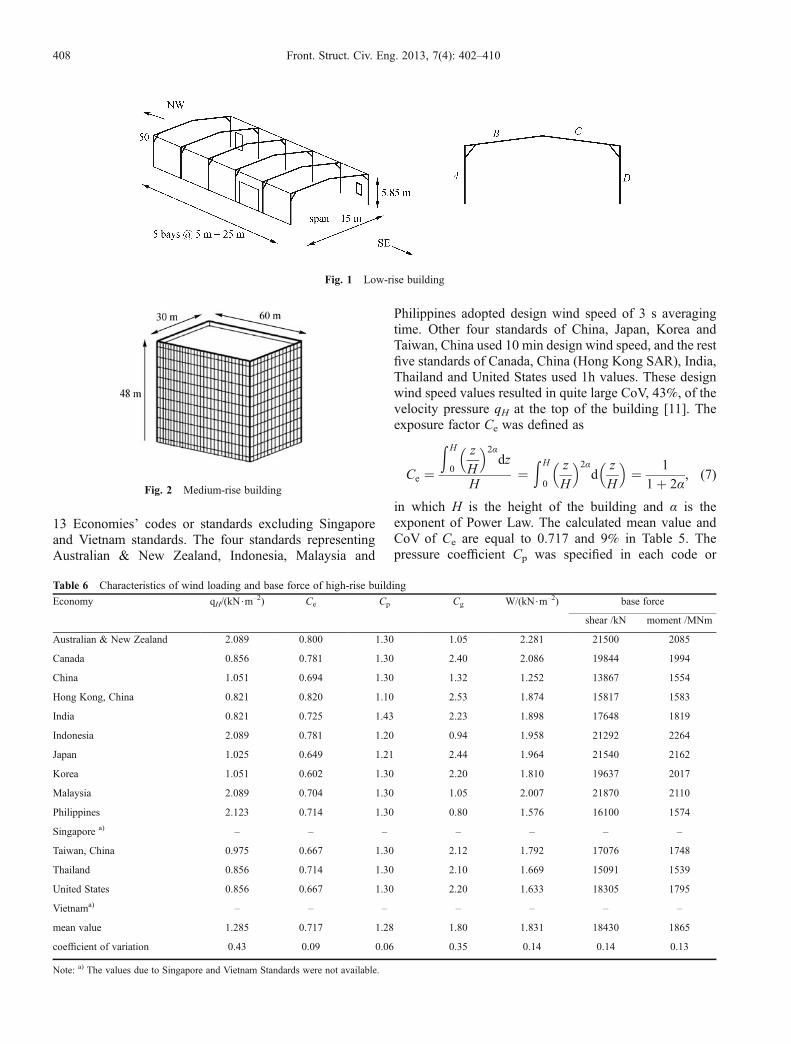
turbulent wind actions on stiff structures with gust loadingfactor (GLF), such as the above-mentioned low-risebuilding and medium-rise building, and structural dynamicresponse of very flexible structures with dynamic responsefactor (DRF), such as the high-rise building in Fig. 3. Table5 also shows the comparison of gust loading factors andbase forces of the medium-rise building due to the 15Economies’ codes [11]. The mean value and the CoV ofGLF are equal to 1.31 and 39%, which shows quite largedifferences. The calculated values of base forces, however,reached to quite small CoV, 22% in base shears and 21% inbase bending moments [12], respectively, which demon-strates no significant correlation between GLF and baseforce.The high-rise building, shown in Fig. 3, was 183 m high,
with the rectangular cross section of 46 m by 30 m locatedin urban terrain. The building was assumed to have anaverage density of 160 kg/m3, and linear mode shapes inboth sway directions with natural frequencies of 0.20 Hz.The structural damping ratio was specified to be 0.012 forbase force calculation. Design wind speed at the top of thebuilding, 183 m, was assumed to be 59 m/s for 3 saveraging time, 41 m/s for 10 min and 37 m/s for 1 h,respectively, and a turbulence intensity of 0.17 at the topwas also assumed. For wind direction normal to the 46 mwall, only along-wind loading and base force are discussedin the following.Table 6 shows the characteristics of wind loading and
base force of the high-rise building. Design wind speedswere provided in three kinds of averaging time among the
Table 3 Pressure coefficients on the north-west frame of low-rise building
Economy wind SW wind NW
A B C D A B C D
Australian & New Zealand – 0.14 – 1.33 – 1.01 – 1.07 – 0.57 – 0.72 – 0.72 – 0.57
Canada 0.45 – 2.70 – 1.70 – 1.50 – 0.90 – 2.00 – 1.00 – 0.80
China 0.34 – 0.25 – 0.25 – 0.21 – 0.26 – 0.21 – 0.25 – 0.34
Hong Kong, China 0.65 – 2.49 – 2.49 – 1.75 – 1.23 – 1.92 – 1.92 – 1.23
India 0.0 – 1.61 – 1.11 – 0.96 – 0.51 – 0.81 – 0.81 – 0.51
Indonesia – 0.14 – 1.30 – 0.93 – 1.07 – 0.19 0.14 0.14 – 0.19
Japan – 0.10 – 1.49 – 1.49 – 1.14 – 0.75 – 0.92 – 0.92 – 0.75
Korea 0.63 – 0.56 – 0.49 – 0.39 – 0.83 – 0.46 – 0.46 – 0.83
Malaysia – 0.15 – 1.23 – 0.83 – 1.00 – 0.47 – 0.60 – 0.60 – 0.47
Philippines 0.50 – 1.55 – 1.05 – 0.95 – 0.50 – 1.00 – 1.00 – 0.50
Singapore 0.0 – 1.68 – 1.16 – 1.27 0.0 – 1.27 – 0.75 – 1.27
Taiwan, China 0.07 – 0.76 – 0.76 – 0.63 – 0.49 – 0.49 – 0.49 – 0.49
Thailand 0.20 – 0.79 – 1.12 – 0.08 – 0.76 – 0.79 – 1.12 – 0.76
United States – 0.09 – 1.77 – 1.23 – 1.13 – 0.45 – 1.07 – 0.69 – 0.45
Vietnam 0.12 – 1.38 – 1.36 – 1.42 – 0.57 – 0.86 – 0.86 – 0.57
mean value 0.156 – 1.39 – 1.13 – 0.97 – 0.57 – 0.87 – 0.76 – 0.65
coefficient of variation 1.784 0.45 0.45 0.47 0.52 0.63 0.58 0.45
406 Front. Struct. Civ. Eng. 2013, 7(4): 402–410
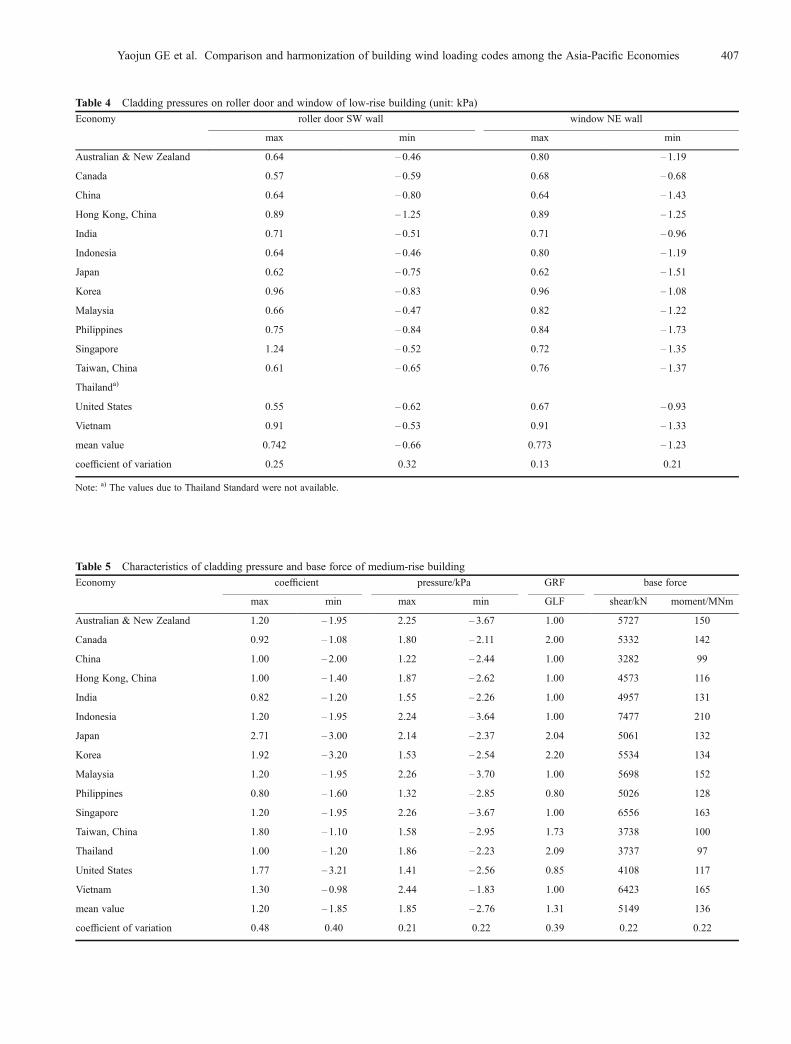
Table 4 Cladding pressures on roller door and window of low-rise building (unit: kPa)
Economy roller door SW wall window NE wall
max min max min
Australian & New Zealand 0.64 – 0.46 0.80 – 1.19
Canada 0.57 – 0.59 0.68 – 0.68
China 0.64 – 0.80 0.64 – 1.43
Hong Kong, China 0.89 – 1.25 0.89 – 1.25
India 0.71 – 0.51 0.71 – 0.96
Indonesia 0.64 – 0.46 0.80 – 1.19
Japan 0.62 – 0.75 0.62 – 1.51
Korea 0.96 – 0.83 0.96 – 1.08
Malaysia 0.66 – 0.47 0.82 – 1.22
Philippines 0.75 – 0.84 0.84 – 1.73
Singapore 1.24 – 0.52 0.72 – 1.35
Taiwan, China 0.61 – 0.65 0.76 – 1.37
Thailanda)
United States 0.55 – 0.62 0.67 – 0.93
Vietnam 0.91 – 0.53 0.91 – 1.33
mean value 0.742 – 0.66 0.773 – 1.23
coefficient of variation 0.25 0.32 0.13 0.21
Note: a) The values due to Thailand Standard were not available.
Table 5 Characteristics of cladding pressure and base force of medium-rise building
Economy coefficient pressure/kPa GRF base force
max min max min GLF shear/kN moment/MNm
Australian & New Zealand 1.20 – 1.95 2.25 – 3.67 1.00 5727 150
Canada 0.92 – 1.08 1.80 – 2.11 2.00 5332 142
China 1.00 – 2.00 1.22 – 2.44 1.00 3282 99
Hong Kong, China 1.00 – 1.40 1.87 – 2.62 1.00 4573 116
India 0.82 – 1.20 1.55 – 2.26 1.00 4957 131
Indonesia 1.20 – 1.95 2.24 – 3.64 1.00 7477 210
Japan 2.71 – 3.00 2.14 – 2.37 2.04 5061 132
Korea 1.92 – 3.20 1.53 – 2.54 2.20 5534 134
Malaysia 1.20 – 1.95 2.26 – 3.70 1.00 5698 152
Philippines 0.80 – 1.60 1.32 – 2.85 0.80 5026 128
Singapore 1.20 – 1.95 2.26 – 3.67 1.00 6556 163
Taiwan, China 1.80 – 1.10 1.58 – 2.95 1.73 3738 100
Thailand 1.00 – 1.20 1.86 – 2.23 2.09 3737 97
United States 1.77 – 3.21 1.41 – 2.56 0.85 4108 117
Vietnam 1.30 – 0.98 2.44 – 1.83 1.00 6423 165
mean value 1.20 – 1.85 1.85 – 2.76 1.31 5149 136
coefficient of variation 0.48 0.40 0.21 0.22 0.39 0.22 0.22
Yaojun GE et al. Comparison and harmonization of building wind loading codes among the Asia-Pacific Economies 407
13 Economies’ codes or standards excluding Singaporeand Vietnam standards. The four standards representingAustralian & New Zealand, Indonesia, Malaysia and
Philippines adopted design wind speed of 3 s averagingtime. Other four standards of China, Japan, Korea andTaiwan, China used 10 min design wind speed, and the restfive standards of Canada, China (Hong Kong SAR), India,Thailand and United States used 1h values. These designwind speed values resulted in quite large CoV, 43%, of thevelocity pressure qH at the top of the building [11]. Theexposure factor Ce was defined as
Ce ¼!
H
0
z
H
� �2αdz
H¼ !
H
0
z
H
� �2αd
z
H
� �¼ 1
1þ 2α, (7)
in which H is the height of the building and α is theexponent of Power Law. The calculated mean value andCoV of Ce are equal to 0.717 and 9% in Table 5. Thepressure coefficient Cp was specified in each code or
Fig. 1 Low-rise building
Fig. 2 Medium-rise building
Table 6 Characteristics of wind loading and base force of high-rise building
Economy qH/(kN$m–2) Ce Cp Cg W/(kN$m–2) base force
shear /kN moment /MNm
Australian & New Zealand 2.089 0.800 1.30 1.05 2.281 21500 2085
Canada 0.856 0.781 1.30 2.40 2.086 19844 1994
China 1.051 0.694 1.30 1.32 1.252 13867 1554
Hong Kong, China 0.821 0.820 1.10 2.53 1.874 15817 1583
India 0.821 0.725 1.43 2.23 1.898 17648 1819
Indonesia 2.089 0.781 1.20 0.94 1.958 21292 2264
Japan 1.025 0.649 1.21 2.44 1.964 21540 2162
Korea 1.051 0.602 1.30 2.20 1.810 19637 2017
Malaysia 2.089 0.704 1.30 1.05 2.007 21870 2110
Philippines 2.123 0.714 1.30 0.80 1.576 16100 1574
Singapore a) – – – – – – –
Taiwan, China 0.975 0.667 1.30 2.12 1.792 17076 1748
Thailand 0.856 0.714 1.30 2.10 1.669 15091 1539
United States 0.856 0.667 1.30 2.20 1.633 18305 1795
Vietnama) – – – – – – –
mean value 1.285 0.717 1.28 1.80 1.831 18430 1865
coefficient of variation 0.43 0.09 0.06 0.35 0.14 0.14 0.13
Note: a) The values due to Singapore and Vietnam Standards were not available.
408 Front. Struct. Civ. Eng. 2013, 7(4): 402–410
standard, and its mean value and CoV are 1.28 and 6%.Both Ce and Cp have very small value of CoV. The GLF orDRF Cg was provided in each standard or code, and themean value and CoV are 1.80 and 35%, respectively. It isinteresting to see that the CoV of the wind loading W isonly about 14%, which is much smaller than that of qH orCg. To find out the reason of this difference, the coefficientof variation of the product of qH$Cg is purposelycalculated, and the CoV of the product is tremendouslyreduced to 14%, which shows significant correlationbetween velocity pressure and GLF or DRF. Furthermore,the calculated values of base forces supported to similarCoVs, 14% in base shears and 13% in base bendingmoments [12].
6 Conclusions and incorporation
This paper examines the differences and similarities ofwind loading codes or standards in 15 Asia-PacificEconomies. Following wind loading chain, four variablesincluding velocity pressure, exposure factor, pressurecoefficient and gust response factor were evaluated andcompared with mean values and coefficients of variation.From the comparison and contrast of wind loadingcalculations of three typical buildings, the conclusionsand further harmonization can be reached as follows:1) Velocity pressure q mainly depends on four
parameters including air density, reference height, aver-aging time and return period. Since both air density andreturn period have very small coefficients of variation of2% and 3%, respectively, and the reference height of 10 mis uniformly adopted in all 15 Economies’ codes orstandards, the only major variation comes from averagingtime, which has the CoVof 23% and contributes over 40%
CoV to velocity pressure. To harmonize the calculation ofvelocity pressures, further incorporation in the Asia-PacificRegion should be considered in developing agreedregional wind velocity maps for 3 s, 10 min and 1 hextremes with 50-year return period.2) The number of terrain categories varies from one in
Hong Kong, China to five in Japan, and the exponentvalues of Power Law are between 0.07 and 0.15 in theminimum category and between 0.11 and 0.36 in themaximum category, respectively. These scattered valuesresulted in the exposure factor CoVs of 15% in theminimum category and 67% in the maximum category.Future harmonization should begin with simplification andunification of terrain categories for surface roughnessexposures, in particular for basic or reference terraincategory.3) Pressure coefficient has rather large coefficients of
variation, for example, 20% to 61% in the low-risebuilding and 40% to 48% in the medium-rise building, andcladding pressure has relatively smaller CoVs, between13% and 26% in the first building and between 21% and22% in the second building. Although the CoV differencesbetween pressure coefficient and cladding pressure need tobe identified, the main cause of quite large CoVs wouldseem to be on the fact that different standards havedifferent wind tunnel testing sources on which thecoefficients have been based. This could be resolved bybenchmark study through both wind tunnel testing ofscaled models and site measurement of prototype struc-tures in the future.4) Gust response factor is generally specified to take into
account of structural dynamic response and turbulent windactions. The former is totally governed by structuralflexibility, and can be called as dynamic response factor(DRF), which has no correlation with velocity pressure.The latter includes the main account for varying averagingtime, and can be defined as gust loading factor GLF, forexample, GLF being 1.92 and 2.06 from 3s wind velocitypressure to 10 min and 1h velocity pressure. Accordingly,GLF has significant correlation with velocity pressurerelated to averaging time, and results in quite large CoVamong the 15 Economies’ codes and standards. The futureincorporation should be conducted on not only gustresponse factor itself but also the combination of gustresponse factor and velocity pressure.Future alignments of wind loading codes or standards in
the Asia-Pacific Region are very much necessary andoptimistic.
Acknowledgements This study was partially supported by the NaturalScience Foundation of China (Grant Nos. 90715039 and 51021140005) andthe grant SLDRCE09-A-01. The authors gratefully acknowledge thecontributions of the participants of the APEC-WW workshops, including J.Cheung and J.D. Holmes from Australia, T. Stathopoulos from Canada,E.C.C. Choi and K.C.S. Kwok from Hong Kong, China, A. Gairola and P.Krishna from India, Fariduzzaman from Indonesia, Y. Tamura from Japan,Y.C. Ha and Y.D. Kim from Korea, N.M. Ali from Malaysia, R.G.J. Flay and
Fig. 3 High-rise building
Yaojun GE et al. Comparison and harmonization of building wind loading codes among the Asia-Pacific Economies 409
A. King from New Zealand, R.E.R. Aquino from Philippines, V.Boonyapinyo from Thailand, C.M. Cheng from Taipei, China, R. Bashorand A. Kareem from United States, and N.D. Bich from Vietnam.
References
1. ASCE. Minimum Design Loads for Buildings and Other Structures.
Reston, VA, ASCE/SEI 7–05, New York, 2006
2. Standards Australia/Standards New Zealand, Structural Design
Actions. Part 2 Wind Actions, AS/NZS1170.2: 2002
3. National Research Council of Canada. National Building Code of
Canada. NRCC, Ottawa, 2005
4. Architectural Institute of Japan. Recommendations for Loads on
Buildings. AIJ-RLB-2004, Tokyo, 2004
5. Eurocode 1. Actions on Structures, Part 1–4: Wind Actions.
London, British Standards Institute, 2004
6. ISO 4354. Wind Actions on Structures. Switzerland, 2009
7. Zhou Y, Kijewski T, Kareem A. Along-wind load effects on tall
buildings: Comparative study of major international codes and
standards. Journal of Structural Engineering, 2002, 128(6): 788–
796
8. Tamura Y, Kareem A, Solari G, Kwok K C S, Holmes J D,
Melbourne W H. Aspects of the Dynamic Wind-Induced Response
of Structures and Codification. Wind and Structures, 2005, 8(4):
251–268
9. Holmes J D, Melbourne W H. Design wind speeds in the West
Pacific. In: Proceedings of the 4th Asia-Pacific Conference on Wind
Engineering. Golden Coast, Australia, July 14–16, 1997
10. Holmes J D, Weller R. Design Wind Speeds for the Asia-Pacific
Region. Standards Australia, Handbook HB 212–2002, Sydney,
NSW, Australia, 2002
11. Gairola A, Mittal A. Part 2: Work Examples. In: Proceedings of the
3rd APEC-WW Workshop. New Delhi, India, November 2–3, 2006
12. Holmes J D, Tamura Y, Krishna P. Wind loads on low, medium and
high-rise buildings by Asia-Pacific codes. In: Proceedings of the 4th
International Conference on Advances in Wind and Structures. Jeju,
Korea, May 29–31, 2008
13. Holmes J D. Developments in codification of wind loads in the Asia
Pacific. In: Proceedings of the 7th Asia-Pacific Conference on Wind
Engineering. Taipei, China, November 8–12, 2009
14. Holmes J D, Ginger J D. Codification of internal pressures for
building design. In: Proceedings of the 7th Asia-Pacific Conference
on Wind Engineering. Taipei, China, November 8–12, 2009
15. Bashor R, Kareem A. Comparative study of major international
standards. In: Proceedings of the 7th Asia-Pacific Conference on
Wind Engineering. Taipei, China, November 8–12, 2009
16. Kasperski M. Incorporation of the LRC-method into codified wind
load distributions. In: Proceedings of the 7th Asia-Pacific Con-
ference on Wind Engineering. Taipei, China, November 8–12,
2009
17. Choi E C C. Proposal for unified terrain categories exposures and
velocity profiles. In: Proceedings of the 7th Asia-Pacific Conference
on Wind Engineering. Taipei, China, November 8–12, 2009
18. Krishna P. Comparisons of building wind loads and proposal for an
A-P model code. In: Proceedings of the 7th Asia-Pacific Conference
on Wind Engineering. Taipei, China, November 8–12, 2009
19. Tamrua Y, Holmes J D, Krishna P, Guo L, Katsumura A.
Comparison of wind loads on medium-rise building according to
Asia Pacific Codes/Standards. In: Proceedings of the 7th Asia-
Pacific Conference on Wind Engineering. Taipei, China, November
8–12, 2009
20. GB 50009–2001 (revised). Load Code for the Design of Building
Structures. Beijing: China Architecture and Building Press, 2006 (in
Chinese)
21. Code of Practice for Wind Effects in Hong Kong. Buildings
Department of Hong Kong, 2004
22. Indian Standard Code of Practice for Design Loads (other than
earthquake) for Buildings and Structures, Part 3: Wind Loads, IS:
875 (Part 3), Bureau of Indian Standards, 1987
23. Standard National Indonesia, SNI 03–1727. Agency for National
Standardization (BSN), Jakarta, 2003
24. KGG-KBCS-05. Korean Government Guidelines of Korean Build-
ing Code–Structures, 2005
25. Code of Practice on Wind Loading for Building Structures.
Malaysian Standard, Ms 1553, 2002
26. National Structural Code of the Philippines. 5th ed. NSCP-2001,
Association of Structural Engineers of the Philippines, 2001
27. Specifications for Building Wind-Resistant Design (Wind Load
Provisions of Taiwan Building Code). Taiwan Architecture and
Building Research Institute, 2006
28. Wind Loading Code for Building Design. EIT Standard 1018–46,
Engineering Institute of Thailand, 2003
29. Loads and Actions Norm for Design, TCVN 2737–1995, Tieu-
Chuan Viet Nam, 1995
30. Davenport A G. The wind loading Chain–2004 update. In:
Proceedings of the International Workshop on Wind Engineering
and Science. New Delhi, India, October 29–30, 2004
31. Ge Y J, Xiang H, F. Statistical study for mean wind velocity in
Shanghai area. Journal of Wind Engineering and Industrial
Aerodynamics, 2002, 90(12–15): 1585–1599
32. Cheung J C K, Holmes J D. APEC-WW Australia 2010 Report:
codes/specifications. In: Proceedings of the 6th APEC-WW Work-
shop. Kwandong, Korea, October 21–23, 2010, 1–8
410 Front. Struct. Civ. Eng. 2013, 7(4): 402–410