comparing the uk eq-5d-3l and english eq-5d-5l …three eq-5d value sets are therefore now available...
TRANSCRIPT


Comparing the UK EQ-5D-3L and English EQ-5D-5L value sets
Working Paper 2017/01
March 2017
A report by the Centre for Health Economics Research and Evaluation
This CHERE Working Paper also has been published as Office of Health Economics Research Paper 17/02

3
About CHERE
CHERE is an independent research unit affiliated with the University of Technology, Sydney. It has been established since 1991, and in that time has developed a strong reputation for excellence in research and teaching in health economics and public health and for providing timely and high quality policy advice and support. Its research program is policy-relevant and concerned with issues at the forefront of the sub-discipline.
CHERE has extensive experience in evaluating health services and programs, and in assessing the effectiveness of policy initiatives. The Centre provides policy support to all levels of the health care system, through both formal and informal involvement in working parties, committees, and by undertaking commissioned projects. For further details on our work, see www.chere.uts.edu.au.
Authors: Brendan Mulhern1, Yan Feng2, Koonal Shah2, Ben van Hout3, Bas Janssen4, Michael Herdman2, and Nancy Devlin2
1 Centre for Health Economics Research and Evaluation, University of Technology Sydney, Australia 2 Office of Health Economics, London, UK 3 School of Health and Related Research, University of Sheffield, UK 4 Department of Medical Psychology and Psychotherapy, Erasmus University, Amsterdam, The Netherlands
Acknowledgements:
We thank the EuroQol Research Foundation for supplying the data for us in this study. We are grateful to John Brazier for his comments on an earlier draft.
Contact details:
Brendan Mulhern Centre for Health Economics Research and Evaluation (CHERE) University of Technology Sydney 1-59 Quay St, Haymarket NSW 2000
Tel: + 61 2 9514 4725 Fax: + 61 2 9514 4730 Email: [email protected]

4
Disclaimers: The EQ-5D-5L value set for England reported by Devlin et al. (2016) and analysed in this paper remains provisional at the time of writing. It should be considered as having interim status as the peer review process may necessitate changes to the analyses and results.
Keywords: health state valuation, quality adjusted life years, EQ-5D-3L, EQ-5D-5L, value set

5
Table of Contents
Abstract 6
1 Introduction 7
2 Methods 9
2.1 The value sets 9
2.2 Analysis 11
2.3 Comparison of predicted values 11
2.4 Analysis on patient data 12
3 Results 13
3.1 Comparison of models 13
3.2 Comparison of value sets overall 14
3.3 Comparison of predicted values for matched states 14
3.4 Comparing difference in adjacent states 15
3.5 Comparisons using patient data 15
4 Discussion 17
References 21
Tables and Figures 23

6
Abstract
Background: Three EQ-5D value sets (the EQ-5D-3L, crosswalk and EQ-5D-5L) are now
available for cost utility analysis in the UK and/or England. The value sets’ characteristics
differ, and it is important to systematically assess the implications of these differences for the
value generated. The aim of this paper is to compare the characteristics of three value sets
Methods: We carried out analysis comparing the predicted values from each of the three
value sets, and also using EQ-5D-3L and EQ-5D-5L data from patients who completed both
measures. We assessed descriptive statistics and distributions for all theoretical values and
comparable states across the EQ-5D-3L and EQ-5D-5L. We assessed values for individual
health states and at the overall level, to highlight where the largest differences occur across
the predictions. We also investigated how differences in health on the descriptive system is
reflected in the utility score by assessing the value of adjacent states. Agreement was
assessed using Bland Altman plots.
Results: There are systematic differences in the distribution of the EQ-5D-3L and EQ-5D-
5L value sets. The EQ-5D-5L values are higher than the EQ-5D-3L values for matched
states, and the overall range, and therefore differences between adjacent states is smaller than
for the EQ-5D-3L. There are similar differences between the EQ-5D-5L and crosswalk value
sets. Regarding the patient data, the EQ-5D-5L value set produces higher values across all of
the conditions included, and the differences are generally significant. There is some evidence
that the value sets rank different health conditions in a similar order of severity, particularly
for the most and least severe conditions.
Discussion: Although there are important differences between the value sets, the impact on
quality-adjusted life years (QALYs) gained is unclear as they will apply to both control and
intervention groups, and will depend on whether the gain is in quality of life, survival, or a
mix of both. The increased sensitivity of the EQ-5D-5L may also favour QALY gains even if
the changes in utility are smaller. Further work should assess the impact of the EQ-5D-5L
value set on cost effectiveness by repeating the analysis on clinical trial data.

7
1 Introduction
In the economic evaluation of health interventions, the quality adjusted life year (QALY) is a
commonly used metric that combines length and quality of life into a single figure. The
quality, or utility, weight used in the estimation of QALYs is anchored on a full health (1) to
dead (0) scale, with negative values assigned to health states considered worse than dead.
Utility values for health states associated with a particular condition or disease can be derived
in several ways, one of which is via the use of preference based measures (PBM) of health.
Of currently available PBMs, the EQ-5D (Brooks, 1996; Devlin & Brooks, 2016) is the most
widely used.
EQ-5D classifies health on five dimensions: mobility, self-care, usual activities,
pain/discomfort and anxiety/depression. The original version of the EQ-5D (described as
EQ-5D-3L) included three severity levels (none, some, extreme/unable), thereby describing
(35 =) 243 health states. In the UK, utility values for EQ-5D-3L health states were derived
using the Time Trade Off (TTO) preference elicitation technique (Dolan, 1997). The resulting
‘value set’ has been widely influential, and is preferred by the National Institute for Health
and Care Excellence (NICE) for use in the cost utility analysis of health interventions (NICE,
2013). A summary of the source of utility values in NICE submissions found that the
majority used values sourced directly from the EQ-5D, or used mapped values (Tosh et al,
2011). EQ-5D-3L values are also accepted by reimbursement agencies worldwide including
the Pharmaceutical Benefits Advisory Committee (PBAC) in Australia (PBAC, 2008) and the
Canadian Agency for Drugs and Technology in Health (CADTH, 2006) in Canada. The
instrument itself is also used in a wide range of settings including population health surveys
and routine clinical practice (Appleby, Devlin & Parkin, 2015).
Notwithstanding their widespread use, research has suggested that both the descriptive
system and the utility scale of the EQ-5D-3L have a number of limitations. Regarding the
descriptive system, it has been shown that the EQ-5D-3L is not sensitive to the health-related
quality of life impacts of all conditions (Longworth et al, 2014; Brazier et al, 2014). It may
also not be sensitive to smaller changes in health as it only has three response levels in each
dimension and, in general public samples and some patient populations, a substantial
proportion of respondents report themselves as being in the best health state, i.e. no problems

8
on any dimension (11111). This is known as a ceiling effect (Brazier et al, 2004). Regarding
the value set, the procedure and modelling used to elicit values for worse than dead health
states has been criticised (Lamers et al 2007).
In an effort to improve the instrument’s sensitivity and reduce the ceiling effect, a five-level
descriptive system, the EQ-5D-5L (Herdman et al, 2011) was developed which included five
response levels (none, slight, moderate, severe, extreme/unable to) and standardised the
wording across dimensions. The major change in wording was in the mobility dimension
where ‘confined to bed’ was replaced with ‘unable to walk about’ as the most severe level.
The EQ-5D-5L increases the number of states described to (55=) 3,125. Research has shown
increased sensitivity for the EQ-5D-5L compared to the EQ-5D-3L across a number of
patient samples (Janssen et al, 2012).
One consequence of this initiative was the need to develop value sets for the new descriptive
system, and this resulted in two separate developments. Firstly, an interim ‘crosswalk’ value
set was developed by van Hout et al (2012), whereby EQ-5D-3L values were used to predict
EQ-5D-5L values. Secondly, in order to elicit values for health states generated by the EQ-
5D-5L descriptive system, the EuroQol Research Foundation developed a new valuation
protocol which combined TTO and Discrete Choice Experiment (DCE) methods (Oppe et al,
2014). This protocol used a ‘composite’ TTO approach combining standard and ‘lead time’
TTO (Janssen et al 2013). In England, health states generated by the EQ-5D-5L were valued
using this protocol and subsequently modelled using newly developed techniques which
combined TTO and DCE data in a hybrid model to produce an EQ-5D-5L value set (Devlin
et al, 2016; Feng et al, 2016).
Three EQ-5D value sets are therefore now available for use in cost utility analysis in the UK
and/or England, those being the EQ-5D-3L value set, the crosswalk value set mapping the
EQ-5D-5L descriptive system onto the EQ-5D-3L value set, and the new EQ-5D-5L value set
developed using the new EuroQol valuation protocol. The first two of these were developed
based on valuations from respondents in the UK while the latter was based on valuations
from respondents in England only. However, this is only one way in which they differ. As
noted, they are also based on different descriptive systems, valuation protocols, and
modelling methods. Given widespread and increasing use of the EQ-5D-5L, it is important to
9
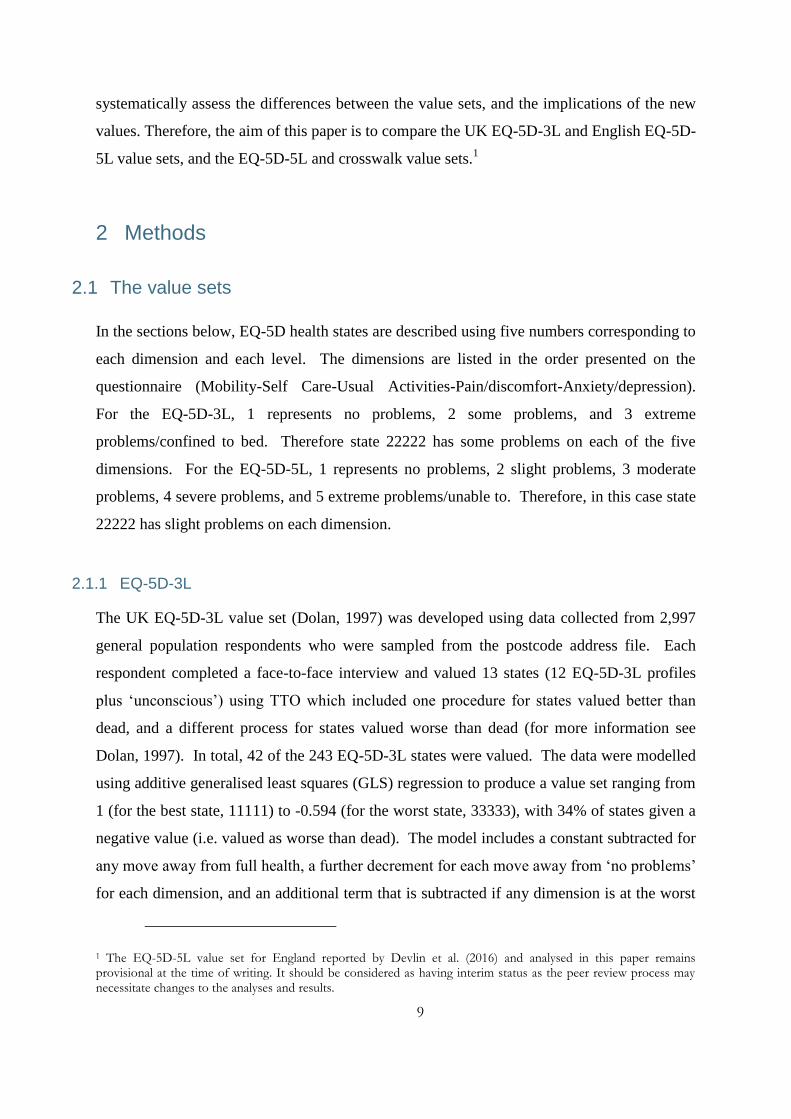
systematically assess the differences between the value sets, and the implications of the new
values. Therefore, the aim of this paper is to compare the UK EQ-5D-3L and English EQ-5D-
5L value sets, and the EQ-5D-5L and crosswalk value sets.1
2 Methods
2.1 The value sets
In the sections below, EQ-5D health states are described using five numbers corresponding to
each dimension and each level. The dimensions are listed in the order presented on the
questionnaire (Mobility-Self Care-Usual Activities-Pain/discomfort-Anxiety/depression).
For the EQ-5D-3L, 1 represents no problems, 2 some problems, and 3 extreme
problems/confined to bed. Therefore state 22222 has some problems on each of the five
dimensions. For the EQ-5D-5L, 1 represents no problems, 2 slight problems, 3 moderate
problems, 4 severe problems, and 5 extreme problems/unable to. Therefore, in this case state
22222 has slight problems on each dimension.
2.1.1 EQ-5D-3L
The UK EQ-5D-3L value set (Dolan, 1997) was developed using data collected from 2,997
general population respondents who were sampled from the postcode address file. Each
respondent completed a face-to-face interview and valued 13 states (12 EQ-5D-3L profiles
plus ‘unconscious’) using TTO which included one procedure for states valued better than
dead, and a different process for states valued worse than dead (for more information see
Dolan, 1997). In total, 42 of the 243 EQ-5D-3L states were valued. The data were modelled
using additive generalised least squares (GLS) regression to produce a value set ranging from
1 (for the best state, 11111) to -0.594 (for the worst state, 33333), with 34% of states given a
negative value (i.e. valued as worse than dead). The model includes a constant subtracted for
any move away from full health, a further decrement for each move away from ‘no problems’
for each dimension, and an additional term that is subtracted if any dimension is at the worst
1 The EQ-5D-5L value set for England reported by Devlin et al. (2016) and analysed in this paper remains provisional at the time of writing. It should be considered as having interim status as the peer review process may necessitate changes to the analyses and results.
10
level (known as the N3 term). Another feature of the EQ-5D-3L value set is the large change
in utility between 11111 and the next best state (11211) which is scored at 0.883.
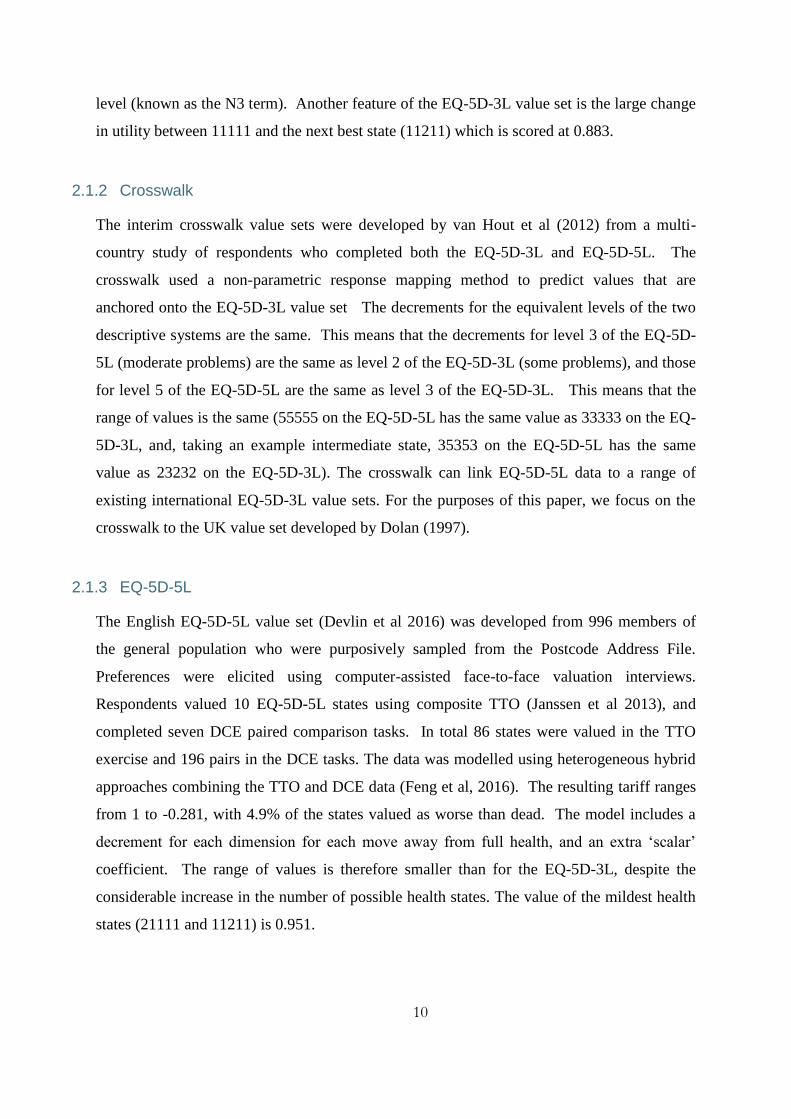
2.1.2 Crosswalk
The interim crosswalk value sets were developed by van Hout et al (2012) from a multi-
country study of respondents who completed both the EQ-5D-3L and EQ-5D-5L. The
crosswalk used a non-parametric response mapping method to predict values that are
anchored onto the EQ-5D-3L value set The decrements for the equivalent levels of the two
descriptive systems are the same. This means that the decrements for level 3 of the EQ-5D-
5L (moderate problems) are the same as level 2 of the EQ-5D-3L (some problems), and those
for level 5 of the EQ-5D-5L are the same as level 3 of the EQ-5D-3L. This means that the
range of values is the same (55555 on the EQ-5D-5L has the same value as 33333 on the EQ-
5D-3L, and, taking an example intermediate state, 35353 on the EQ-5D-5L has the same
value as 23232 on the EQ-5D-3L). The crosswalk can link EQ-5D-5L data to a range of
existing international EQ-5D-3L value sets. For the purposes of this paper, we focus on the
crosswalk to the UK value set developed by Dolan (1997).
2.1.3 EQ-5D-5L
The English EQ-5D-5L value set (Devlin et al 2016) was developed from 996 members of
the general population who were purposively sampled from the Postcode Address File.
Preferences were elicited using computer-assisted face-to-face valuation interviews.
Respondents valued 10 EQ-5D-5L states using composite TTO (Janssen et al 2013), and
completed seven DCE paired comparison tasks. In total 86 states were valued in the TTO
exercise and 196 pairs in the DCE tasks. The data was modelled using heterogeneous hybrid
approaches combining the TTO and DCE data (Feng et al, 2016). The resulting tariff ranges
from 1 to -0.281, with 4.9% of the states valued as worse than dead. The model includes a
decrement for each dimension for each move away from full health, and an extra ‘scalar’
coefficient. The range of values is therefore smaller than for the EQ-5D-3L, despite the
considerable increase in the number of possible health states. The value of the mildest health
states (21111 and 11211) is 0.951.

11
2.2 Analysis
We carried out analysis comparing the predicted values from each of the three value sets, and
also using patient reported EQ-5D-3L and EQ-5D-5L data. The patient data used was taken
from the crosswalk development study dataset where all respondents self-reported their
health using both the EQ-5D-3L and EQ-5D-5L descriptive systems thereby enabling direct
comparisons between the measures. The key comparisons carried out were between the EQ-
5D-3L and EQ-5D-5L value sets, and the EQ-5D-5L value set and the crosswalk tariff.
2.3 Comparison of predicted values
2.3.1 Comparing value set models
Firstly, we compared the coefficient models used to calculate the values. This was done to
assess the overall magnitude of the coefficients for each dimension, and the impact of the
various interaction coefficients included in each model on the values produced. We also
compared the process for calculating values using each method using an example health state.
2.3.2 Comparing value set characteristics
We assessed a range of descriptive statistics for all of the possible theoretical values (i.e. 243
for the EQ-5D-3L and 3,125 for the EQ-5D-5L), including the value set range, number of
states valued as worse than dead, and the state with the smallest utility decrement from
11111. We looked at the modality of the overall distributions using kernel density
histograms, and also compared the values of selected states to demonstrate differences
between the value sets. This was done for the three value sets compared in this study
2.3.3 Comparing value set characteristics for matched states
We carried out a comparative analysis on the states that are comparable across the EQ-5D-3L
and EQ-5D-5L (i.e. the matched 243 states). The crosswalk value set is not relevant here as
for these states the values are the same as the EQ-5D-3L tariff due to the response mapping
procedure used. We considered comparable states to be those from the intermediate levels of
the EQ-5D-5L descriptive system (none, moderate and extreme/unable to) which, to a certain
extent, ‘match’ the three-level states (as an example the EQ-5D-3L state 12321 is defined as

12
comparable to 13531 on the EQ-5D-5L). We assessed similarities and differences, both for
individual states and overall, to highlight where the largest differences occur across the value
sets.
2.3.4 Comparing differences in utility between adjacent states
Analysis was also carried out to understand how changes in health that could be reported by
patients on the descriptive system are reflected by changes in utility within the value sets.
This was done by assessing the values of adjacent states within the descriptive system, and
comparing the differences across the three value sets. An adjacent state pair was defined as
having one (and only one) dimension with a one-level change (for example calculating the
change in value between 21111 and 11111). This was done for states where only one
dimension changed at a time, so we focused on the change in utility between level 3/5 and
level 1 on one dimension, with the other four dimensions held at the same level. For
example, for mobility we compared the changes between 51111-41111-31111-21111 and
11111, and we repeated this for each of the five dimensions. The size of the descriptive
system means that many comparisons are possible. However, we decided to focus on a small
number of adjacent states so that an overall view of the change could be interpreted. The
magnitude of the change between all level changes, and the matched states, was assessed.
This analysis reflects the coefficient decrements in a different way and provides an insight
about how change in self-reported health would lead to change in utility in the absence of
longitudinal data.
2.4 Analysis on patient data
2.4.1 Data used:
The data used to develop the crosswalk value sets were used for the analysis. The data were
collected online across a range of patient groups with different health conditions who
completed both the EQ-5D-3L and EQ-5D-5L descriptive systems. Respondents from seven
countries took part, but given the value sets that we are comparing, the analysis reported here
only used the English and Scottish data. The characteristics of the 1,501 respondents from
England and Scotland are reported in Table 1.

13
2.4.2 Comparing the descriptive system and value sets
Firstly, we compared the number of respondents reporting each level of the three-level and
five-level descriptive system. This was done to understand how the addition of the extra
levels changes response patterns. We compared the values reported using density plots, and
also by assessing the scores overall and across patient groups (with the exception of those
with a sample size of less than 50) using one way ANOVA. The mean difference statistics
were also assessed. We also compared the agreement between the value sets using Bland
Altman plots (Bland and Altman, 1986). These present the mean of two scores on the x axis
and the difference on the y axis, with lines indicating the upper and lower limits of agreement
(calculated as mean +/- 1.96 x standard deviation) added. Agreement across the full severity
range can then be assessed, with points outside the limits defined as outliers.
3 Results
3.1 Comparison of models
The models used to derive EQ-5D-3L and EQ-5D-5L values are displayed in Table 2. In
each case, the coefficient decrements are larger for the more severe levels of each dimension
and are therefore ordered as expected. Both models include a constant term, and in the EQ-
5D-3L this involves a decrement of 0.081 for the move away from the best health state
(11111). The EQ-5D-5L constant is 1, but the model includes a set of scalar coefficients
(which relate to the probability of belonging to one of the three latent classes in the model,
and the slope of each group). The scalar coefficient has the overall impact of increasing the
value of each state, and therefore reducing the overall utility range. The magnitude of the
dimension level coefficients between the EQ-5D-3L and EQ-5D-5L varies (for example,
pain/discomfort has a larger overall decrement on the EQ-5D-3L and anxiety/depression has
a larger decrement on the EQ-5D-5L), and the extra interactions and scalars included in the
models have a large impact. The EQ-5D-3L N3 term is an extra decrement when at least one
of the levels is at the most severe (i.e. level 3), and therefore this reduces the value of the
more severe states. As an example, table 2 also displays how to calculate a value for a state.
The calculation of the value for EQ-5D-5L state 21223 and the corresponding EQ-5D-5L
state 31335, and shows that the EQ-5D-3L coefficients produce a substantially lower value
(0.186 vs. 0.510).

14
3.2 Comparison of value sets overall
Table 3 compares the descriptive characteristics of the three value sets. The EQ-5D-5L value
set has a higher value for the worst possible health state and substantially fewer worse than
dead values. Also, the decrement from the best (11111) to next best health state (11211) is
smaller for the EQ-5D-5L value set, as expected given differences in the number of levels
and labelling between the instruments (e.g. 11211 describes ‘slight’ problems performing
usual activities in the five-level instrument and ‘some’ problems in the three-level version).
In all three value sets, pain/discomfort has the largest overall decrement (but not at the less
severe levels), while self-care and usual activities have the smallest.
Figure 1 compares all unique theoretical values for the EQ-5D-5L and EQ-5D-3L value sets,
and the EQ-5D-5L and crosswalk. The results demonstrate that the range for the EQ-5D-3L
(and therefore the crosswalk) is quite different from that for the EQ-5D-5L. Comparing
panel 1, the large coefficients for level 3 on the EQ-5D-3L (and the impact of the N3 term)
means that there is a higher density of lower values. The EQ-5D-5L is unimodal with
moderate negative skew, whereas the EQ-5D-3L is more bimodal as has previously been
observed (Parkin et al 2016).
3.3 Comparison of predicted values for matched states
Figure 2 displays the values of the comparable states from the EQ-5D-3L and the EQ-5D-5L
value sets ordered by the EQ-5D-5L value (in descending order). The EQ-5D-3L health state
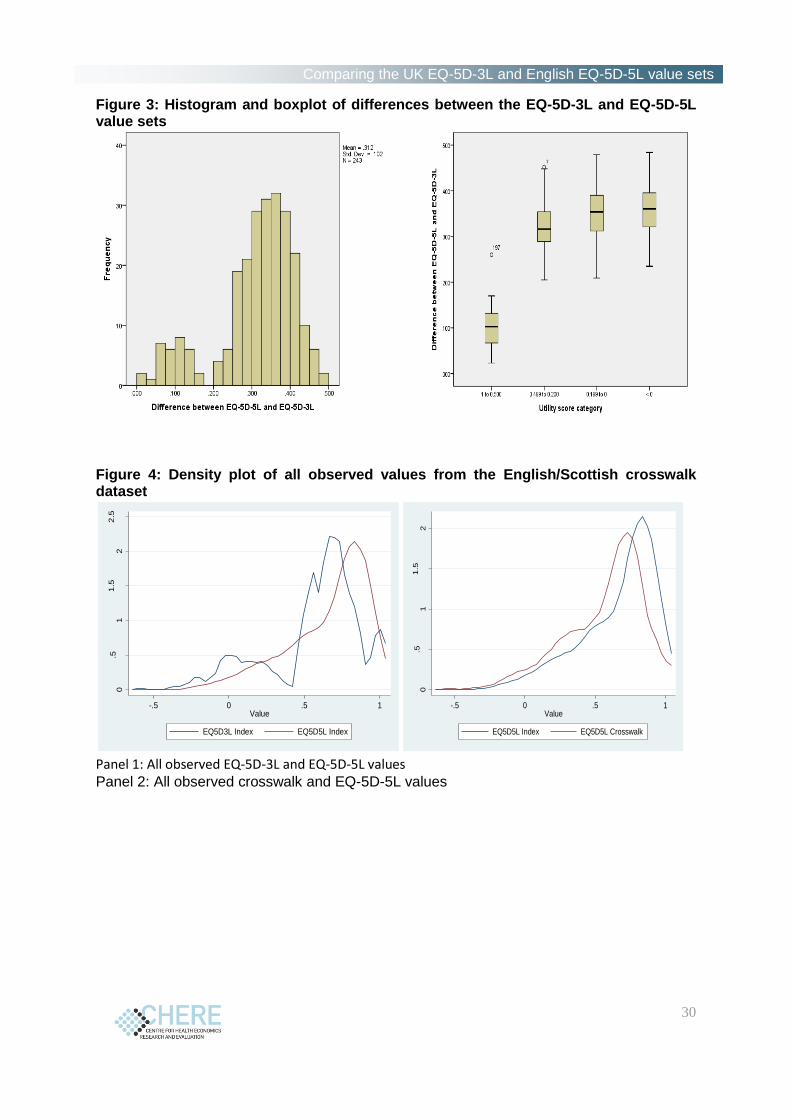
values are consistently lower across the full severity range. Figure 3 shows a histogram of
the differences for each comparable state across the value sets, and a box plot of the mean
difference by utility score category as a proxy for severity (1 to 0.500; 0.499 to 0.200; 0.199
to 0; <0). The mean difference is large overall at 0.313 (sd 0.102; range 0.023 to 0.484). The
mean difference increases as severity increases, and the difference is significant (F2,238) =
184.3, p < 0.001). The majority of the differences are between 0.3 and 0.4. Only 16 (6.6%)
of 243 states have a mean difference smaller than 0.1, and 40 (16.4%) states have a difference
of at least 0.4. The state with the largest difference is 32131 (0.484) and the state with the
smallest difference is 11212 (0.023).
15
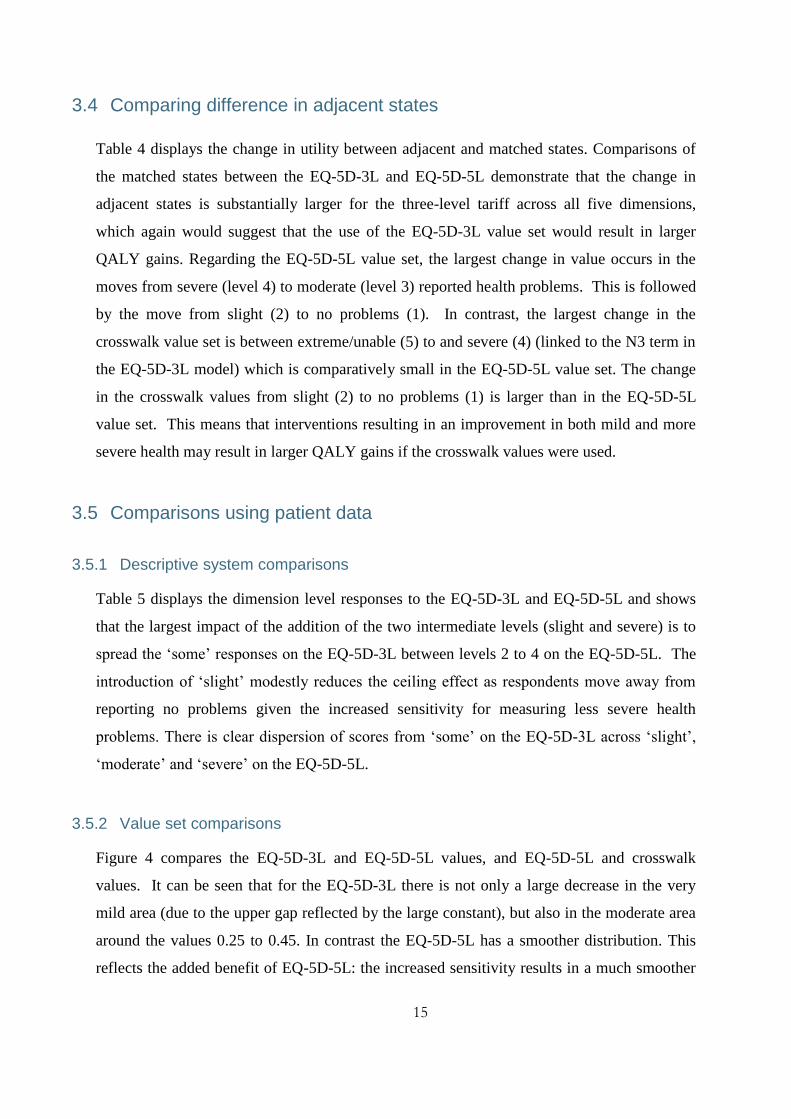
3.4 Comparing difference in adjacent states
Table 4 displays the change in utility between adjacent and matched states. Comparisons of
the matched states between the EQ-5D-3L and EQ-5D-5L demonstrate that the change in
adjacent states is substantially larger for the three-level tariff across all five dimensions,
which again would suggest that the use of the EQ-5D-3L value set would result in larger
QALY gains. Regarding the EQ-5D-5L value set, the largest change in value occurs in the
moves from severe (level 4) to moderate (level 3) reported health problems. This is followed
by the move from slight (2) to no problems (1). In contrast, the largest change in the
crosswalk value set is between extreme/unable (5) to and severe (4) (linked to the N3 term in
the EQ-5D-3L model) which is comparatively small in the EQ-5D-5L value set. The change
in the crosswalk values from slight (2) to no problems (1) is larger than in the EQ-5D-5L
value set. This means that interventions resulting in an improvement in both mild and more
severe health may result in larger QALY gains if the crosswalk values were used.
3.5 Comparisons using patient data
3.5.1 Descriptive system comparisons
Table 5 displays the dimension level responses to the EQ-5D-3L and EQ-5D-5L and shows
that the largest impact of the addition of the two intermediate levels (slight and severe) is to
spread the ‘some’ responses on the EQ-5D-3L between levels 2 to 4 on the EQ-5D-5L. The
introduction of ‘slight’ modestly reduces the ceiling effect as respondents move away from
reporting no problems given the increased sensitivity for measuring less severe health
problems. There is clear dispersion of scores from ‘some’ on the EQ-5D-3L across ‘slight’,
‘moderate’ and ‘severe’ on the EQ-5D-5L.
3.5.2 Value set comparisons
Figure 4 compares the EQ-5D-3L and EQ-5D-5L values, and EQ-5D-5L and crosswalk
values. It can be seen that for the EQ-5D-3L there is not only a large decrease in the very
mild area (due to the upper gap reflected by the large constant), but also in the moderate area
around the values 0.25 to 0.45. In contrast the EQ-5D-5L has a smoother distribution. This
reflects the added benefit of EQ-5D-5L: the increased sensitivity results in a much smoother

16
transition between adjacent values that are closer together than on the EQ-5D-3L.
Comparing the EQ-5D-5L and crosswalk value sets, it can be seen that the crosswalk data is
smoother, whereby the lack of EQ-5D-3L values in the range between 0.25 and 0.45 is not
apparent.
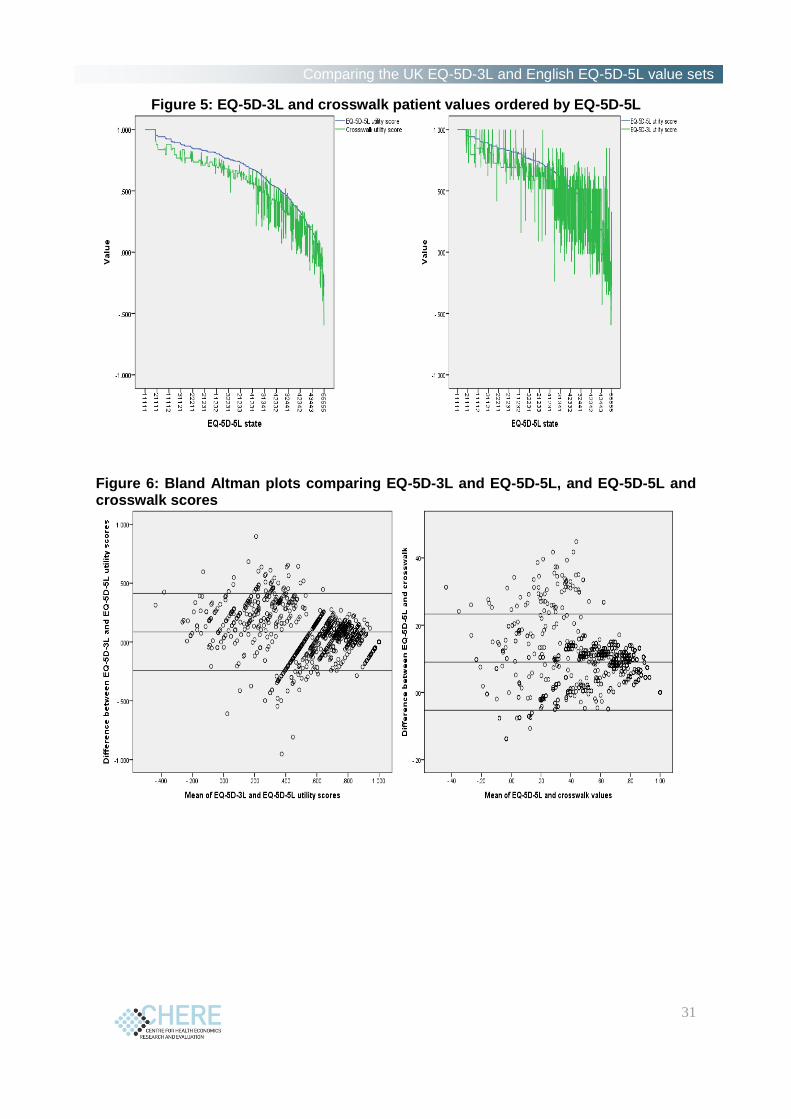
Figure 5 compares the EQ-5D-3L and crosswalk values with the EQ-5D-5L and shows that
there are differences in values across the entire severity scale, but greater variation for more
severe health states (where the mean utility value is lower). Figure 6 displays Bland Altman
plots comparing EQ-5D-3L and EQ-5D-5L, and EQ-5D-5L and crosswalk scores. There is
evidence of disagreement between values across the severity scale, where the difference in
utility values is outside the +/- 2 SD range. Disagreement means more diverse utility scores
for states of a similar severity.
The mean difference between the EQ-5D-3L and EQ-5D-5L values as reported by the patient
sample is 0.086 (range 0.952 to -0.897). Some respondents are inconsistent and this results in
the wide range overall. For example, the difference of 0.952 results from a patient reporting
11112 on EQ-5D-3L and 44444 on EQ-5D-5L. Comparing the EQ-5D-5L and crosswalk
value sets, the mean difference is 0.091 with a range from 0.001 for the smallest non zero
difference (states 43544 and 41221) to 0.45 (for state 44444).
Table 6 compares the value set scores overall and across the different health conditions
reported in the patient data with significance statistics reported for the conditions including
more than 50 patients. As would be expected, the EQ-5D-5L value set scores are higher for
all conditions than the EQ-5D-3L and crosswalk, and the difference is significant for all
conditions except for rheumatoid arthritis and ADHD. The percentage of states worse than
dead overall and also across each condition is lower for the EQ-5D-5L. Table 6 also displays
the rank order of the severity of the conditions according to the mean utility values generated
for each value set. There is evidence of consistency for seven of the 12 conditions, including
the most (Parkinson’s disease) and third most (back pain) severe conditions, and the five least
severe (ADHD, breathing problems, arthritis, depression and diabetes) as scored by the value
sets. The most variable condition is multiple sclerosis, which is second most severe for the
EQ-5D-3L, but fifth and seventh overall for the crosswalk and EQ-5D-5L value sets
respectively.

17
4 Discussion
We have compared three EQ-5D value sets for use in HTA in the UK. The comparison
firstly investigated differences in the ‘theoretical’ values possible from the value sets for
health states matched across the EQ-5D-3L and EQ-5D-5L descriptive systems and secondly
compared values observed in patient data.
Regarding the theoretical values, the results demonstrate that there are differences between
the EQ-5D-3L and EQ-5D-5L value sets, where the EQ-5D-5L values for matched states are
higher, and the overall range and therefore change between adjacent states is smaller than for
the EQ-5D-3L. The distribution of values also differs. There are also similar differences
between the EQ-5D-5L value set and the crosswalk tariff given that the latter is linked to the
EQ-5D-3L value set. However, it is also worth noting that some underlying features of the
preferences, and therefore utility scales, are similar. For example, the overall importance of
each dimension is similar, with only one difference (where the rank order of the dimensions
is the same, apart from two dimensions, mobility and anxiety/depression, changing position
in the ordering), and the relative distance between the levels for different dimensions is
similar.
Regarding the observed values from the patient data, the EQ-5D-5L value set produces higher
values overall and across all of the conditions included, and the differences are generally
significant. This is expected given the overall increase in the values of matched states and
reduction in the overall utility scale. There is some evidence that the value sets rank different
health conditions in a similar order, particularly the most and least severe conditions as
measured by the descriptive system. However, this requires further exploration across a
larger range of conditions.
There are a number of possible reasons why the EQ-5D-3L and EQ-5D-5L value sets differ.
These include differences in the samples used in terms of demographics and country. The
project team has since collected EQ-5D-5L valuation data for the other countries in the UK
so will be able to compare using a more representative sample (albeit one that is smaller than
that used for the EQ-5D-3L). Assessing the impact of other demographic differences is

18
difficult, as is assessing potential changes in population preferences over time, which is
another possible reason why the value sets demonstrate differences. One indication of this
might be the increased magnitude of the anxiety/depression dimension given increased focus
on the detrimental aspects of mental health conditions in policy (Layard, 2015), and reduction
in stigma surrounding conditions such as depression (Rusch et al, 2005). Overall the
dimension preference structure between the EQ-5D-3L and EQ-5D-5L is similar, with only
one inversion (anxiety/depression and mobility) which is encouraging given the differences
between the studies. This may demonstrate that preferences for the dimensions are generally
consistent over time and changes in population preferences for the dimensions are not a major
factor in the differences seen.
Other reasons why the value sets may differ relate to the descriptive system and the valuation
method used. Firstly, regarding the descriptive system, the EQ-5D-5L uses more consistent
wording, particularly for the more severe levels, and it is possible that the change in labelling
of the mobility dimension (from ‘confined to bed’ to ‘unable to walk about’) has impacted on
the values, where mobility has a smaller weighting in the EQ-5D-5L than in the EQ-5D-3L.
The increase in levels and associated sensitivity also may impact the magnitude of the
difference and transition between the intermediate levels and therefore the overall value set.
Secondly, the valuation method differs, particularly regarding the process used to value states
worse than dead which was problematic for the EQ-5D-3L (Lamers et al 2007). The
methodological change to a new approach to eliciting values < 0, the lead time TTO meant
that the lowest possible value for an EQ-5D-5L health state in the protocol used was -1
(Devlin et al 2010; Janssen et al 2013), in contrast to -39 in the Dolan (1997) study, which
was rescaled to -1, and this therefore led to a reduction in the overall scale. The inclusion of
DCE tasks, which provides a different type of valuation data focusing on the choices between
states rather than measuring direct values for states as is the case with TTO, and the
development of innovative modelling methods combining TTO and DCE data in one model
(see e.g. Rowen et al 2014; Ramos-Goni et al 2015) is another reason for differences in the
value sets. The modelling process for the EQ-5D-5L data also developed heterogeneous
models for the TTO data only (Feng et al 2016), and further work is underway to model the
EQ-5D-3L valuation data applying the methods developed for the 5L.

19
There are also large differences in the proportion of states valued as worse than dead (i.e.
with a negative value) and the associated values assigned to these states which has resulted in
a smaller range. The impact of this is unclear, as it is not well established how often states
that are actually worse than dead appear in cost effectiveness models, and there are not many
in the crosswalk data we use in this study. As the overall scale of the EQ-5D-5L is smaller,
the change in QALYs (for estimates generated from quality of life changes) will be reduced
across the whole scale for states both better and worse than dead.
It is unclear how the differences between the value sets indicated in both analysis of the
estimates and patient data will impact the HTA process. This is because the utility values will
be applied to both treatments and their comparators, and therefore to some extent the
differences may be even, and the estimates of improvements in quality of life between arms
of a clinical trial will be similar using the EQ-5D-3L or EQ-5D-5L value sets. The increased
sensitivity of the EQ-5D-5L may also favour QALY gains even if the changes in utility are
smaller, and an added complexity is whether the gain is linked to quality of life or survival.
This requires further investigation on clinical trial data, which is the next proposed step of
this programme of research, and is being investigated by other researchers (Hernandez et al
2016).
There are also implications for the NICE reference case. The improvement in the methods
used to both collect and model the valuation data, and the increased use of the improved
descriptive system, make a strong case for the use of the new EQ-5D-5L value set. The EQ-
5D-3L value set has benefits if the instrument is still being used in trials and other settings,
but is based on societal preferences from decades ago. The crosswalk draws on the EQ-5D-
3L values so is prone to the same issues as that value set. There is also the potential for
‘gaming’ where the crosswalk may be used instead of the EQ-5D-5L value set to inflate
QALY gains (as the utility range, and therefore change between states, is larger). One
important point is how to compare results of cost utility analyses using the EQ-5D-5L against
those using the EQ-5D-3L and establishing the cost per QALY thresholds that should be
used. Further work is required to explore this.
The main limitation of this study is that we have not tested the impact of the value sets on any
clinical trial data which would have enabled us to directly compare QALY estimations. This
would allow us to test some of the issues raised in data previously used for cost utility

20
analysis, and is the next planned stage of this programme of research. It will also be
important to compare the psychometric performance, and impact on cost utility analysis, of
the EQ-5D-5L descriptive system and value set with those of other widely used generic
measures. In particular, comparisons with version two of the SF-6D (SF-6Dv2; Mulhern &
Brazier, 2014) which has been valued using DCE with duration methods would be
interesting.
In conclusion, we have demonstrated key differences in the theoretical and observed values
from a number of EQ-5D value sets that can be used in HTA. The value sets will lead to
differences, and the use of the EQ-5D-5L value set will have implications for the decision-
making process carried out by NICE and may require revision to the guidelines used.

21
References
Appleby J, Devlin N, Parkin D. (2015) Using Patient Reported Outcomes to Improve
Health Care. London: Wiley-Blackwell.
Bland JM, Altman DG: Statistical methods for assessing agreement between two
methods of clinical measurement. Lancet 1986, 1: 307–310.
Brazier J, Connell J, Papaioannou D, Mukuria C, Mulhern B, Peasgood T, Lloyd Jones M,
Paisley S, O’Cathain A, Barkham M, Knapp M, Byford S, Gilbody S, Parry G. (2014). A
systematic review, psychometric analysis and qualitative assessment of Generic
Preference-Based Measures of Health in Mental Health Populations and the estimation of
mapping functions from widely used specific measures. Health Technology Assessment,
18:34.
Brazier J, Roberts J, Tsuchiya A, Busschbach J. (2004). A comparison of the EQ-5D and
SF-6D across seven patient groups. Health Economics, 13(9), 873-84.
Brooks, R. (1996). EuroQol: The current state of play. Health Policy 37, 53-72.
Canadian Agency for Drugs and Technology in Health. (2006). Guidelines for the
Economic Evaluation of Health Technologies: Canada.
Devlin N, Brooks R. (2016) EQ-5D past, present and future. Journal of Applied Health
Economics and Health Policy (forthcoming).
Devlin N, Shah K, Feng Y, Mulhern B, van Hout B. (2016). Valuing Health-Related
Quality of Life: An EQ-5D-5L Value Set for England. OHE Research paper, 16/1.
Devlin N, Tsuchiya A, Buckingham K, Tilling C. (2010) A uniform Time Trade Off method
for states better and worse than dead: feasibility study of the ‘lead time’ approach.
Health Economics 20(3), pages 348-361
Dolan, P. (1997). Modeling valuations for EuroQol health states. Medical Care, 35(11),
1095-108.
Feng Y, Devlin N, Shah K, Mulhern B, van Hout B. (2016). New Methods for Modelling
EQ-5D-5L Value Sets: An Application to English Data. OHE Research paper, 16/2.
Hernandez Alava M, Wailoo A, Grimm S, Pudney S, Gomes M, Sadique Z, Meads D,
O’Dwyer J, Barton G, Irvine L. (2017). EQ-5D- 5L versus 3L: the impact on cost-
effectiveness. HEDS Discussion Paper, 17:2
Herdman, M., Gudex, C., Lloyd, A., Janssen, M.F., Kind, P., Parkin, D., et al. (2011).
Development and preliminary testing of the new five-level version of EQ-5D (EQ-5D-5L).
Quality of Life Research, 20(10), 1727-36.
Janssen, B.M., Oppe, M., Versteegh, M.M. and Stolk, E.A., 2013. Introducing the
composite time trade-off: a test of feasibility and face validity. European Journal of
Health Economics, 14(1), pp.5-13.
Janssen MF, Pickard AS, Golicki D, Gudex C, Niewada M, Scalone L, Swinburn P,
Busschbach J. (2013). Measurement properties of the EQ-5D-5L compared to the EQ-5D-
3L across eight patient groups: a multi-country study. Quality of Life Research, 22(7),
1717-27.
Lamers LM. (2007). The transformation of utilities for health states worse than death:
consequences for the estimation of EQ-5D value sets. Medical Care, 45(3), 238-44.
Layard R. (2015). A New Priority for Mental Health. London: London School of
Economics.

22
Longworth L, Yang Y, Young T, Mulhern B, Hernandez-Alava M, Mukuria C, Rowen D,
Tosh J, Tsuchiya A, Evans P. (2014). Use of generic and condition specific measures of
health related quality of life in NICE decision making: systematic review, statistical
modelling and survey. Health Technology Assessment, 18:9.
Mulhern B, Brazier J. (2014). Developing SF-6D-V2: The classification system. Quality of
Life Research, 23:49
National Institute of Health and Care Excellence (2013). Guide to the methods of
technology appraisal. London: NICE.
Oppe, M., Devlin, N.J., van Hout, B., Krabbe P.F.M., de Charro, F. (2014). A program of
methodological research to arrive at the new international EQ-5D-5L valuation protocol.
Value in Health,17, 445-53.
Parkin D, Devlin N, Feng Y. (forthcoming). What determines the shape of an EQ-Index
distribution? Medical Decision Making.
Pharmaceutical Benefits Advisory Committee (2015). Guidelines for preparing
submissions to the Pharmaceutical Benefits Advisory Committee. Canberra: Australian
Department of Health.
Ramos-Goñi J.M, Pinto-Prades J.L, Cabasés J.M, Rivero-Arias O. 2014. Valuation and
modeling of EQ-5D-5L health states using a hybrid approach. Medical Care doi:
10.1097/MLR.0000000000000283
Rowen D, Brazier J, van Hout B. 2014. A Comparison of Methods for Converting DCE
Values onto the Full Health-Dead QALY Scale. Medical Decision Making 35: 328-40.
Rüsch N, Angermeyer M, Corrigan P. (2005). Mental illness stigma: Concepts,
consequences, and initiatives to reduce stigma. European Psychiatry,20(8), 529–39.
Tosh JC, Longworth LJ, George E. (2011). Utility values in National Institute for Health
and Clinical Excellence (NICE) Technology Appraisals. Value in Health, 14(1), 102-9.
van Hout B, Janssen MF, Feng YS, Kohlmann T, Busschbach J, Golicki D, Lloyd A,
Scalone L, Kind P, Pickard AS. (2012). Interim scoring for the EQ-5D-5L: mapping the
EQ-5D-5L to EQ-5D-3L value sets. Value in Health, 15(5), 708-15.

23
Tables and Figures
Table 1: Demographic characteristics of the crosswalk data used for the comparative
analysis
Demographic N(%)
N 1,501 Country
Scotland 500 England 1,001
Age Mean (sd) 57 (16)
Range 19 - 94 Gender male 734 (49) Education
1 485 (32) 2 339 (23) 3 353 (24) 4 290 (19) 5 34 (2)
Condition COPD 320 (21)
Heart problems 251 (17) Arthritis 250 (17)
Depression 250 (17) Rheumatoid
arthritis 87 (6)
Stroke 85 (6) Back pain 70 (5)
ADHD 69 (5) Diabetes 45 (3)
Parkinson’s 37 (3) Breathing problems
22 (2)
Multiple sclerosis 15 (1)
Taken from van Hout et al (2012)

24
Table 2: Comparing the EQ-5D-3L and EQ-5D-5L models Parameters EQ-5D-
3L EQ-5D-5L Value calculation (21223/31335)
EQ-5D-3L EQ-5D-5L
Constant 0.081
EQ-5D dimensions Mobility None
0 0
Slight 0.051 Some/Moderate 0.069 0.063 0.069 0.063
Severe 0.212 CTB*/Unable to 0.314 0.275
Self-care None
0 0 0 0
Slight 0.057 Some/Moderate 0.104 0.076
Severe 0.181 Unable to 0.214 0.217
Usual Activities None
0 0
Slight 0.051 Some/Moderate 0.036 0.067 0.036 0.067
Severe 0.174 Unable to 0.094 0.190
Pain/discomfort None
0 0
Slight 0.060 Some/Moderate 0.123 0.075 0.123 0.075
Severe 0.276 Extreme 0.386 0.341
Anxiety/depression None
0 0
Slight 0.079 Some/Moderate 0.071 0.104
Severe 0.296 Extreme 0.236 0.301 0.236 0.301
Interactions EQ-5D-3L N3 term 0.269 0.269
EQ-5D-5L scalars 0.397x0.427+0.270x 0.939+0.333x1.635=0.9675
Prob. (group 1) 0.397 Prob. (group 2) 0.270 Prob. (group 3) 0.333 Slope (group 1) 0.427 Slope (group 2) 0.939 Slope (group 3) 1.635
Value of state 1-0.081-0.069-0-0.036-0.123-0.236-0.269=0.186
1- 0.9675x(0.063+0+0.067+0 .075+0.301) = 0.510
*CTB: Confined to bed

25
Table 3: Overall descriptive characteristics of the three value sets (modelled values)
EQ-5D-3L value set EQ-5D-5L crosswalk
EQ-5D-5L value set
Range 1 to -0.594 1 to -0.594 1 to -0.281
% health states worse than dead
34.6% (84 out of 243)
26.7% (833 out of 3,125)
4.93% (154 out of 3,125)
Dimension importance order §
Pain/Discomfort Mobility Anxiety/depression Self-care Usual Activities
Pain/Discomfort Mobility Anxiety/Depression Self-care Usual Activities
Pain/Discomfort Anxiety/depression Mobility Self-care Usual Activities
Health state values ‘Mildest’ state (11211)*
0.883 0.906 0.951 (11211/21111)
‘Moderate’ state (22222 (3L) or 33333 (5L))
0.516 0.516 0.628
‘Worst’ state (33333 (3L) or 55555 (5L))
-0.594 -0.594 -0.281
§Importance is judged by the size of the coefficient for level 5 in each dimension. *Note that for each of the asterisked health states, the level of problems indicated on the five-level and three-level versions of EQ-5D differ: for example, on the EQ-5D-5L, 11112 means no problems on any dimension except slight problems with anxiety/depression, whereas on the EQ-5D, 11112 means no problems on any dimensions except some problems with anxiety/depression. A priori, we would expect the values for these health states to be higher in the EQ-5D-5L value set than the EQ-5D value set, which is what we observe.

26
Table 4: Comparing the change in utility between adjacent health states
EQ-5D-5L value set Crosswalk value set EQ-5D-3L value set
EQ-5D-5L state Value Difference Difference matched
Value Difference
Difference matched
EQ-5D-3L state
Value Difference
11111 1.000 1.000 11111 1.000 21111 0.951 0.049 0.877 0.123 31111 0.939 0.012 0.061 0.850 0.027 0.150 21111 0.850 0.150 41111 0.795 0.144 0.813 0.037 51111 0.734 0.061 0.205 0.336 0.477 0.514 31111 0.336 0.514
11111 1.000 1.000 11111 1.000 12111 0.945 0.055 0.846 0.154 13111 0.926 0.019 0.074 0.815 0.031 0.185 12111 0.815 0.185 14111 0.825 0.101 0.723 0.092 15111 0.790 0.035 0.136 0.436 0.287 0.379 13111 0.436 0.379
11111 1.000 1.000 11111 1.000 11211 0.951 0.049 0.906 0.094 11311 0.935 0.016 0.065 0.883 0.023 0.117 11211 0.883 0.117 11411 0.832 0.103 0.776 0.107 11511 0.816 0.016 0.119 0.556 0.220 0.327 11311 0.556 0.327
11111 1.000 1.000 11111 1.000 11121 0.942 0.058 0.837 0.163 11131 0.927 0.015 0.073 0.796 0.041 0.204 11121 0.796 0.204 11141 0.733 0.194 0.584 0.212 11151 0.670 0.063 0.257 0.264 0.320 0.532 11131 0.264 0.532
11111 1.000 1.000 11111 1.000 11112 0.924 0.076 0.879 0.121 11113 0.899 0.025 0.101 0.848 0.031 0.152 11112 0.848 0.152 11114 0.714 0.185 0.635 0.213 11115 0.709 0.005 0.190 0.414 0.221 0.434 11113 0.414 0.434

27
Table 5: Dimension level responses across the EQ-5D-3L/EQ-5D-5L (English and Scottish data) Dimension responses EQ-5D-3L (n,%) EQ-5D-5L (n,%)
Mobility None 506 (33.7) 435 (29.0) Slight 392 (26.1)
Some/Moderate 983 (65.5) 377 (25.1) Severe 277 (18.5)
CTB*/Unable to 12 (0.8) 20 (1.3)
Self-care None 951 (63.4) 907 (60.4) Slight 301 (20.1)
Some/Moderate 517 (34.4) 201 (13.4) Severe 74 (4.9)
Unable to 33 (2.2) 18 (1.2)
Usual Activities None 464 (30.9) 390 (26.0) Slight 447 (29.8)
Some/Moderate 881 (58.7) 358 (23.9) Severe 228 (15.2)
Unable to 156 (10.4) 78 (5.2)
Pain/discomfort None 380 (25.3) 303 (20.2) Slight 447 (29.8)
Some/Moderate 947 (63.1) 449 (29.9) Severe 243 (16.2)
Extreme 174 (11.6) 59 (3.9)
Anxiety/depression None 672 (44.8) 571 (38.0) Slight 444 (29.6)
Some/Moderate 721 (48.0) 324 (21.6) Severe 111 (7.4)
Extreme 108 (7.2) 51 (3.4)

28
Table 6: Comparing value set scores overall and across different conditions Demographic N EQ-5D-3L Crosswalk EQ-5D-5L Significance
Mean (sd) Range % SWD
Sev order
Mean (sd) Range % SWD
Sev order
Mean (sd) Range % SWD
Sev order
3L - 5L 5L - Xwalk
Overall 1,501 0.577 (0.31)
1 to -0.594 8.6 0.571 (0.28)
1 to -0.594 4.5 0.662 (0.27)
1 to -0.281 2.2 <0.001 <0.001
Condition COPD 320 0.546
(0.32) 1 to -0.349 11.3 6 0.558
(0.29) 1 to -0.292 1.9 6 0.641
(0.28) 1 to -0.185 5.0 5 <0.001 <0.001
Heart problems 251 0.567 (0.32)
1 to -0.429 6.8 7 0.559 (0.29)
1 to -0.594 4.8 7 0.649 (0.27)
1 to -0.281 1.2 6 0.002 <0.001
Arthritis 250 0.636 (0.23)
1 to -0.181 5.6 10 0.618 (0.21)
1 to -0.134 0.8 10 0.718 (0.21)
1 to -0.063 0.4 10 <0.001 <0.001
Depression 250 0.643 (0.30)
1 to -0.349 6.8 11 0.640 (0.27)
1 to -0.160 3.6 11 0.727 (0.24)
1 to -0.165 2.0 11 0.001 <0.001
Rheumatoid arthritis 87 0.480 (0.34)
1 to -0.239 14.9 4 0.455 (0.31)
1 to -0.353 8.0 2 0.544 (0.32)
1 to -0.185 8.0 2 0.200 0.062
Stroke 85 0.521 (0.32)
1 to -0.074 9.4 5 0.523 (0.29)
1 to -0.122 9.4 4 0.620 (0.27)
1 to -0.021 1.2 4 0.022 0.024
Back pain 70 0.475 (0.28)
1 to -0.319 10.0 3 0.466 (0.28)
1 to -0.472 8.6 3 0.579 (0.26)
1 to -0.231 4.3 3 0.025 0.015
ADHD 69 0.587 (0.33)
1 to -0.349 8.7 8 0.571 (0.28)
1 to -0.116 2.9 8 0.661 (0.27)
1 to -0.117 2.9 8 0.150 0.056
Diabetes 45 0.723 (0.25)
1 to -0.016 2.2 12 0.707 (0.24)
1 to 0.093 0 12 0.783 (0.22)
1 to 0.018 0 12 NR NR
Parkinson’s 37 0.431 (0.43)
1 to -0.594 18.9 1 0.410 (0.36)
1 to -0.594 13.5 1 0.497 (0.36)
1 to -0.281 16.2 1 NR NR
Breathing problems 22 0.616 (0.26)
1 to -0.181 4.5 9 0.616 (0.22)
1 to 0.206 0 9 0.703 (0.22)
1 to 0.185 0 9 NR NR
Multiple sclerosis 15 0.474 (0.37)
1 to -0.074 20.0 2 0.533 (0.31)
1 to -0.104 6.7 5 0.653 (0.26)
1 to 0.030 0 7 NR NR
Sev order: Most severe mean value for each condition (where 1 is the most severe)

29
Comparing the UK EQ-5D-3L and English EQ-5D-5L value sets
Figure 1: All unique theoretical values
Panel 1: All unique “theoretical” EQ-5D-3L and EQ-5D-5L values Panel 2: All unique “theoretical” Crosswalk and EQ-5D-5L values
Figure 2: Values of comparable states ordered by EQ-5D-5L value
30
Comparing the UK EQ-5D-3L and English EQ-5D-5L value sets
Figure 3: Histogram and boxplot of differences between the EQ-5D-3L and EQ-5D-5L value sets
Figure 4: Density plot of all observed values from the English/Scottish crosswalk dataset
Panel 1: All observed EQ-5D-3L and EQ-5D-5L values Panel 2: All observed crosswalk and EQ-5D-5L values
0.5
11
.52
2.5
Den
sity
-.5 0 .5 1Value
EQ5D3L Index EQ5D5L Index
0.5
11
.52
Den
sity
-.5 0 .5 1Value
EQ5D5L Index EQ5D5L Crosswalk
31
Comparing the UK EQ-5D-3L and English EQ-5D-5L value sets
Figure 5: EQ-5D-3L and crosswalk patient values ordered by EQ-5D-5L
Figure 6: Bland Altman plots comparing EQ-5D-3L and EQ-5D-5L, and EQ-5D-5L and crosswalk scores