comparing the current crisis to the great depression · causes, changes necessary to prevent...
TRANSCRIPT

Karl Aiginger
Comparing the Current Crisis to the
Great Depression
OECD - Nero ConferenceParis, September 21, 2009
H:user/aig/vortrag/OECD_crises_210909_short.ppt

1 23.09.2009
Great Depression (GD)
vs. Current Crisis (CC)
Comparison of the two crises with regard to two aspects
depth and length
policy reactions
Non goals:
causes, changes necessary to prevent further crises;
long-run effects on economic growth;
exit strategies;
missed chances, lessons forgotten;
regulatory changes, incentives, behavior.
2 23.09.2009
References for the other questions
Karl Aiginger: Causes, cures and consequences, WIFO WP No 341http://www.wifo.ac.at/aiginger/crisis/
Karl Aiginger: Strengthening the resilience, WIFO WP No 338(forthcoming in Intereconomics, October 2009) http://www.wifo.ac.at/aiginger/resilience/
Bernanke (2004), Eichengreen - O’Rourke (2009), Friedman-Schwartz (1963), Galbraith (1954), Hahn (2008), Kindleberger (1986), Krugman (2009), Mooslechner (2008), Romer (1991), Schulmeister (2009), Sim (2009), Tichy (2008), etc.
The understanding of the causes of the crisis is increasing –if not the weight for the individual reasons.

3 23.09.2009
Triggers, causes, amplifiers
Triggers: subprime loans (for the lingering phase)Lehman Brothers (for the showdown phase)
Causes:
Macroeconomic causes Surpluses and deficits, monetary policy US 2002ff
Inflated expectations about returns, asset prices
Shift from real economy to financial sector,
Microeconomic causes Short termism and overleveraging
Financial innovations: originate to distribute
Regulatory lenience and regulatory failure Belief in self regulation, circumvention of regulation
Competition policy uncritical merger, too big to fail,
Neglect of systemic risks,
Pro cyclicality of Basel 2 and accounting rules
Amplifiers: weakness in coordination, income distribution
Shortages food, raw materials, energy (bubbles, speculation).

4 23.09.2009
Motivation of the research questions
Some authors claim (Eichengreen – O’Rourke) that this crisis had been “as severe or stronger”
Whether policy made the difference and how policy should continue (2010/11)
Finally to learn whether further declines (“steps”) are probably in the short term; phases of hopes/despair.
5 23.09.2009
Methodology and data
Assumption: crisis is currently leveling off (as it looks for production in 09/09)
Methodology: own research, literature, stylized facts
Concentrating on industrialized countries
Data are incomplete, not fully comparable
Data sets are increasing daily
Project: WIFO Long-term database.
6 23.09.2009
Caveats and limits
Crisis is definitely not over as far as unemploymentis concerned
Policy is unknown for 2010
Fiscal consolidation strategies, regulatory reform
History warns us that crises can continue and may come back.

7 23.09.2009
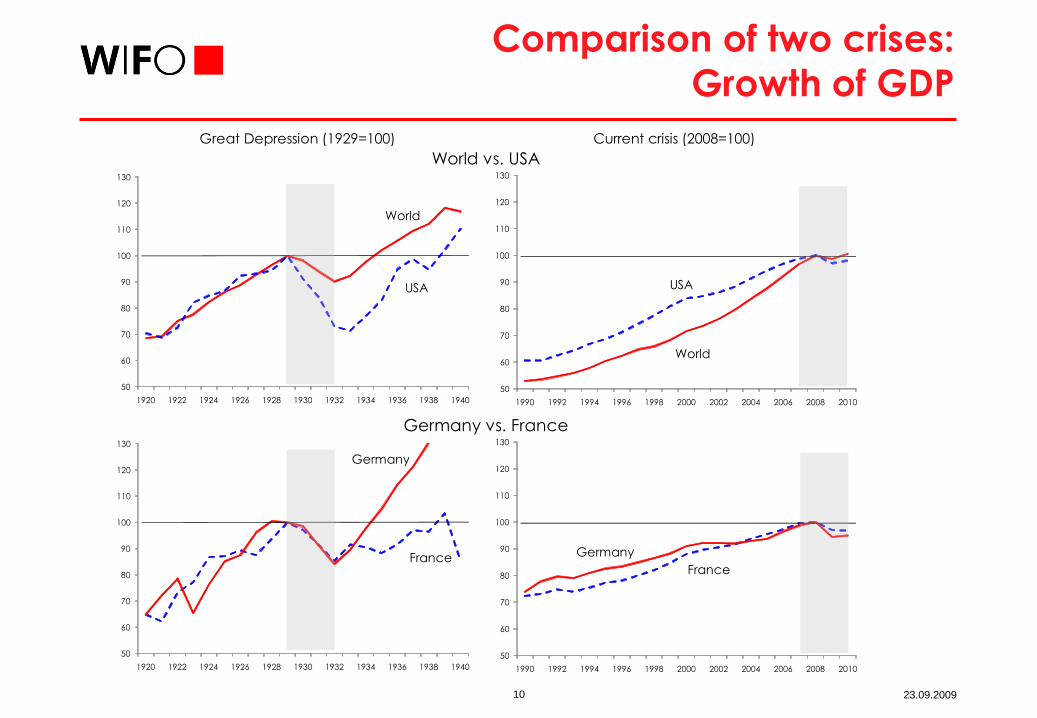
Results I: in CC drop in activity much smaller
In this crisis - if it ends in 2009 - drop in activity was much smallerthan in the Great Recession
Specifically for GDP, employment, less for manufacturing, exports;for world output, industrialized countries, US, France, Germany
The drop in GDP and manufacturing is more synchronized;the Great Depression had two epicenters: Germany, Austria and USA
High growth in build-up period, GD volatile, CC smooth
Deflationary background and overcapacities in GD, scarcities of food, raw materials, energy in CC (incl. speculation).

8 23.09.2009
Results on depth in a nutshell: depth
1932/1929 vs. 2009
Great Depression Current Crisis
GDP - 10 % - 2 % (- 5%)
Manufacturing - 30 % -17 % (-19%)
Exports- 43 % - 18% (-30%)
Stock markets - 69 % - 48% (+33%)
Employment - 16 % - 3% (- 2%)
Unemployment 15 % (1932) 8% (2010)
Unemployment change + 12 PP + 3 PP (2010-2008)
Inflation - 14 % 0.5%
Data for world if existent, for subsets of mainly large industrial countries (GDP weighted) otherwise (in parenthesis quarterly data).

9 23.09.2009
Comparison of two crises:
Growth of GDP
1929/1921 1932/1929 2008/2000
2009
forecast
Trough 2009/
peak 2008
Quarterly data
Austria 43.0 -19.8 17.3 -3.4 -4.4 1)
Germany 38.4 -15.8 9.8 -5.4 -6.7 2)
Belgium 33.4 -7.1 15.6 -3.5 -3.8 1)
Spain 34.2 -3.8 27.9 -3.2 -4.2 3)
France 61.0 -14.7 13.6 -3.0 -3.4 2)
Finland 55.7 -4.0 25.1 -4.7 -6.0 2)
Sweden 49.2 -4.3 20.9 -4.0 -6.4 3)
United Kingdom 28.5 -5.1 19.5 -3.8 -5.7 3)
USA 45.4 -27.0 19.0 -2.9 -3.9 1)
Japan 22.0 1.3 10.7 -5.3 -8.3 3)
World 44.7 -9.8 39.8 -1.3 -4.6 4)
Unweighted average over countries 41.1 -10.0 17.9 -3.9 -5.3
Standard deviation 12.2 8.9 5.8 0.9 1.6
Coefficient of variation 0.297 -0.886 0.325 -0.234 -0.301
Great Depression (1932) Current crisis (2007ff)
Annual data
Percentage change
Annual data
10 23.09.2009
Comparison of two crises:
Growth of GDP
1408.89715
1408.89715
Great Depression (1929=100) Current crisis (2008=100)
World vs. USA
Germany vs. France
50
60
70
80
90
100
110
120
130
1990 1992 1994 1996 1998 2000 2002 2004 2006 2008 2010
World
USA
50
60
70
80
90
100
110
120
130
1920 1922 1924 1926 1928 1930 1932 1934 1936 1938 1940
World
USA
50
60
70
80
90
100
110
120
130
1990 1992 1994 1996 1998 2000 2002 2004 2006 2008 2010
France
Germany
50
60
70
80
90
100
110
120
130
1920 1922 1924 1926 1928 1930 1932 1934 1936 1938 1940
France
Germany

11 23.09.2009
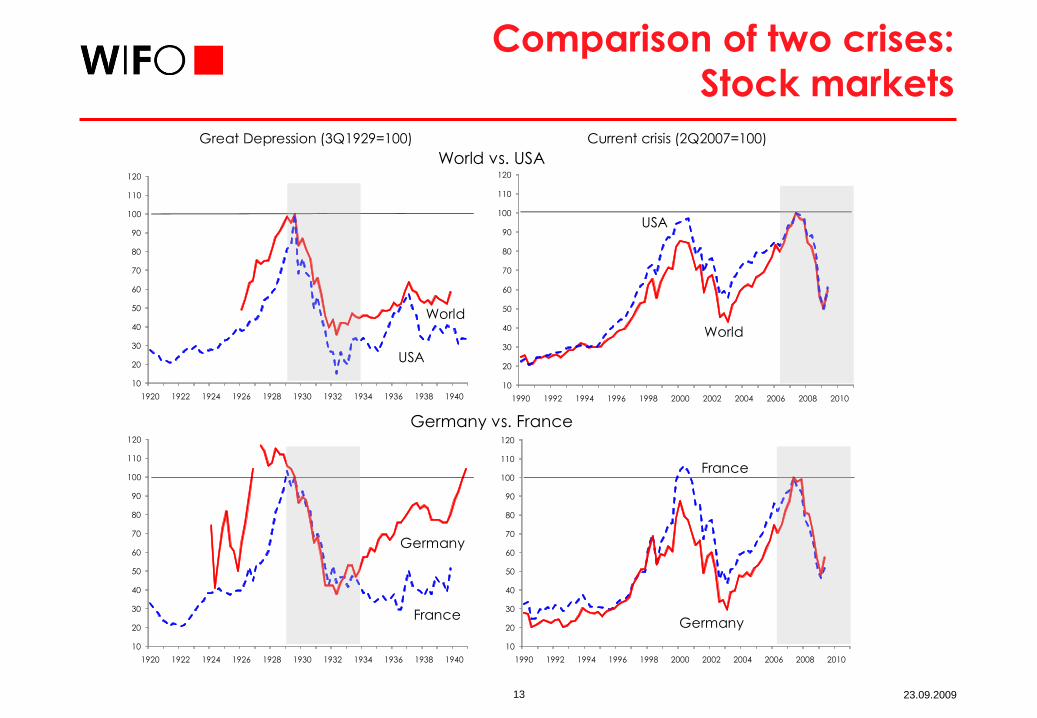
Results II: Stock market decline smaller in
CC, rebound definitely larger
GD: steep fall at the start, long recovery
70% (GDP weighted), US -84% (1929/1932)
CC: steepest part 08/2008 to 03/2009
Overall decline much smaller (44% vs. 69%; 4 big indices)
Rebound up to 33% (weighted), 45% unweighted (monthly)
Largest rebound in GD: +13% in world, 16% in US in 11/1929
Outsider Japan: now steeper than in GD (in Austria, too)
Steeper decline (than in GD) from 08/2008 to 03/2009Proportionate decline now for given period (17 month) smaller (Contrary to Eichengreen who started graphs in April 1929).

12 23.09.2009
Comparison of two crises:
Stock markets
Peak 1929/
trough 1921
Trough 1932/
peak 1929
Peak 2007/
trough 2003
Trough 2008/
peak 2007
August 2009/
trough 2009
Austria -45.6 318.6 -65.2 69.0
Germany -83.9 -62.1 237.7 -51.7 44.7
Belgium
Spain
France 335.3 -56.2 131.2 -53.6 36.7
Finland
Sweden
United Kingdom -49.3 191.1 -44.7 45.8
USA 377.9 -84.8 78.8 -50.0 30.7
Japan -34.2 127.5 -55.3 35.7
"World" -68.9 130.1 -47.7 32.7
Unweighted average over countries 209.8 -59.6 191.5 -53.0 45.4
Standard deviation 255.2 15.4 93.0 7.5 14.6
Coefficient of variation 1.217 -0.259 0.486 -0.142 0.321
Current crisis (2007ff)
Quarterly data; percentage change
Great Depression (1932)
13 23.09.2009
Comparison of two crises:
Stock markets
1408.89715
Great Depression (3Q1929=100) Current crisis (2Q2007=100)
World vs. USA
Germany vs. France
10
20
30
40
50
60
70
80
90
100
110
120
1990 1992 1994 1996 1998 2000 2002 2004 2006 2008 2010
World
USA
10
20
30
40
50
60
70
80
90
100
110
120
1920 1922 1924 1926 1928 1930 1932 1934 1936 1938 1940
USA
World
10
20
30
40
50
60
70
80
90
100
110
120
1990 1992 1994 1996 1998 2000 2002 2004 2006 2008 2010
Germany
France
10
20
30
40
50
60
70
80
90
100
110
120
1920 1922 1924 1926 1928 1930 1932 1934 1936 1938 1940
France
Germany
14 23.09.2009
Results III: The decline was very steeper in
several months in the CC
Exports declined by 25% between 2Q/2008 and 1Q/2009
Manufacturing by 19% between 4Q/2007 and 2Q/2009
Starting with a comparison in some month in 2008, leaving out the lingering phase of CC (after burst of US housing and Lehmann) gave rise to message “as strong or stronger”
The Current Crisis had the potential to become a very deep and long depression.
15 23.09.2009
Results IV: Economic policy
made the difference
Recapitalization of banks, guarantees, support incl. nationalization
Monetary policy
Fiscal policy
International coordination
(Surprising) consensus of economists
Better institutions
Less protectionism – up to now.

16 23.09.2009
Result in a nutshell: policy variables
Great Depression Current Crisis
M1 -11 % (1932/1929) + 8% (2008/2007)
Discount Rates 4% (1930) 0.5 % (2009)
Budget deficit/GDP -2.5% (1932) - 9 % (2009)
There are many indicators on monetary/fiscal policy
– all show quicker, stronger reactions in CC.

17 23.09.2009
Monetary Policy
Great Depression
Increasing rate in 1928 to curb speculation
Reducing it slightly, increasing in some countries to prevent capital outflow
Asymmetric handling of gold standard
Imploding multipliers after bank runs and export decline.

18 23.09.2009
Monetary policy in GD vs. CC(Alternative)
Fed increased Rate in 1928 to curb stock market speculation
M1 flat in 1929/30 (18 countries), then -15% 1929/32
Gold standard, currency goal, asymmetric reaction
Decreasing multiplier, higher reserve requirements, bank runs and failures
Nominal discount rates reduced somewhat from 5.5 to less than 4
Deflation resulted in enormous (double digit) real rates!
Real wage increases (despite lower nominal / lower working hours)
From 1934/35 rapidly increasing M1, the more the less gold standard
Current Crisis
Discount rate 0,
Quantitative easing,
Unconventional operations.
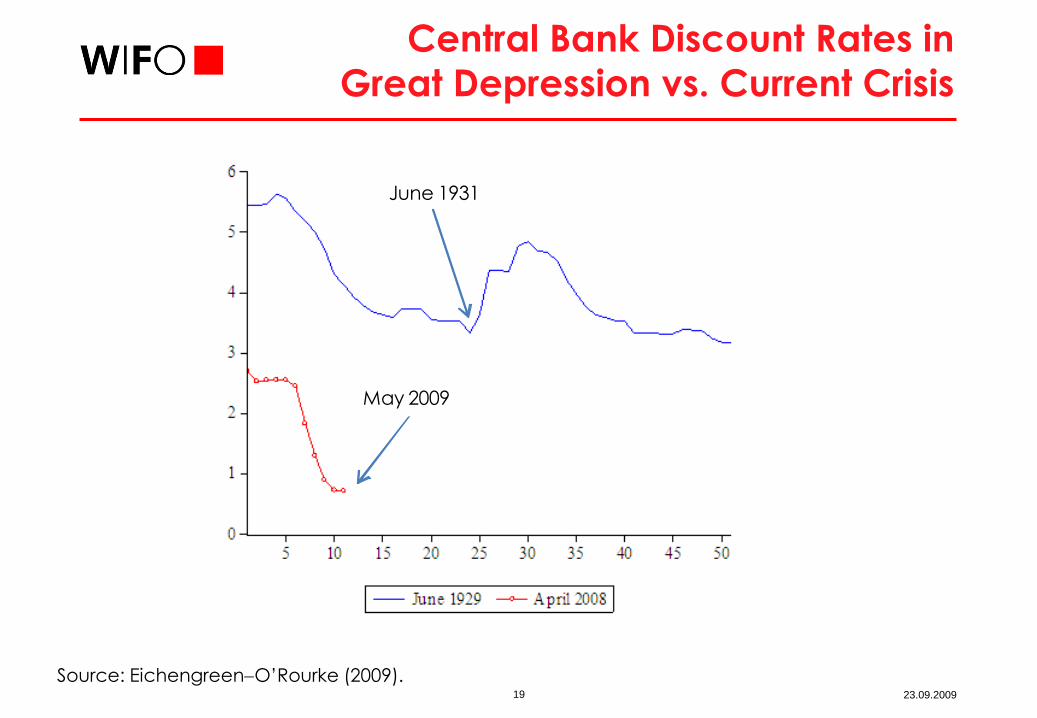
19 23.09.2009
Central Bank Discount Rates in
Great Depression vs. Current Crisis
Source: Eichengreen-O’Rourke (2009).
June 1931
May 2009

20 23.09.2009
Comparison of two crises: inflation/
deflation (consumer prices)Great Depression (1932) Current crisis (2007ff)
1930 1931 1932 1932/1929 2008
2009
forcast
Percentage
price
change
Austria 0.0 -5.0 2.1 -3.0 3.2 1.1
Germany -4.0 -8.3 -11.4 -22.0 2.6 0.7
Belgium 1.2
Spain 1.4
France 1.0 -4.0 -9.3 -12.0 2.8 0.9
Finland 1.1
Sweden -3.6 -3.1 -1.3 -7.7 3.4 0.7
United Kingdom -4.0 -6.3 -2.2 -12.0 4.0 1.3
USA -2.9 -8.3 -10.4 -20.2 3.9 0.3
Japan -0.5
"World" 4) -2.2 -5.8 -6.9 -14.1 2.8 0.5
Unweighted average over countries -2.2 -5.8 -5.4 -12.8 3.3 1.0
Standard deviation 2.2 2.2 5.6 7.2 0.5 0.4
Coefficient of variation -0.975 -0.379 -1.043 -0.565 0.163 0.362
Change over previous year
Change over previous
year

21 23.09.2009
Money Supplies in
Great Depression vs. Current Crisis
Source: Eichengreen-O’Rourke (2009).

22 23.09.2009
Expansion of Central Banks’
balance sheets 2000/2009
Source: IMF (2009) using Bloomberg,Bank of Japan, Datastream, ECB.
23 23.09.2009
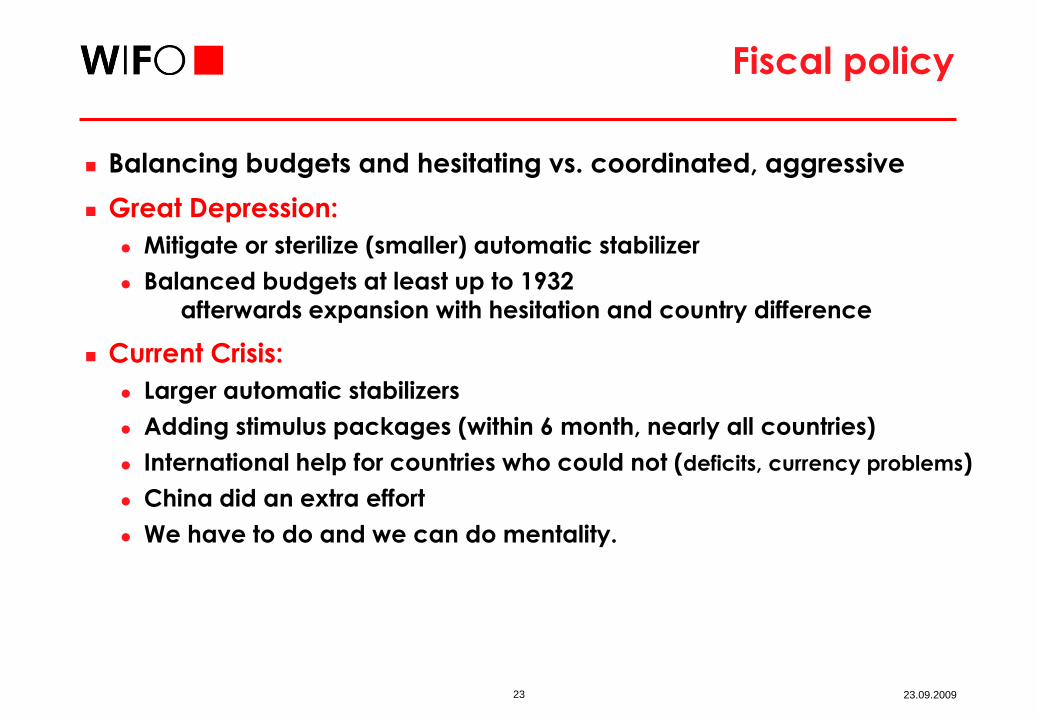
Fiscal policy
Balancing budgets and hesitating vs. coordinated, aggressive
Great Depression:
Mitigate or sterilize (smaller) automatic stabilizer
Balanced budgets at least up to 1932
afterwards expansion with hesitation and country difference
Current Crisis:
Larger automatic stabilizers
Adding stimulus packages (within 6 month, nearly all countries)
International help for countries who could not (deficits, currency problems)
China did an extra effort
We have to do and we can do mentality.
24 23.09.2009
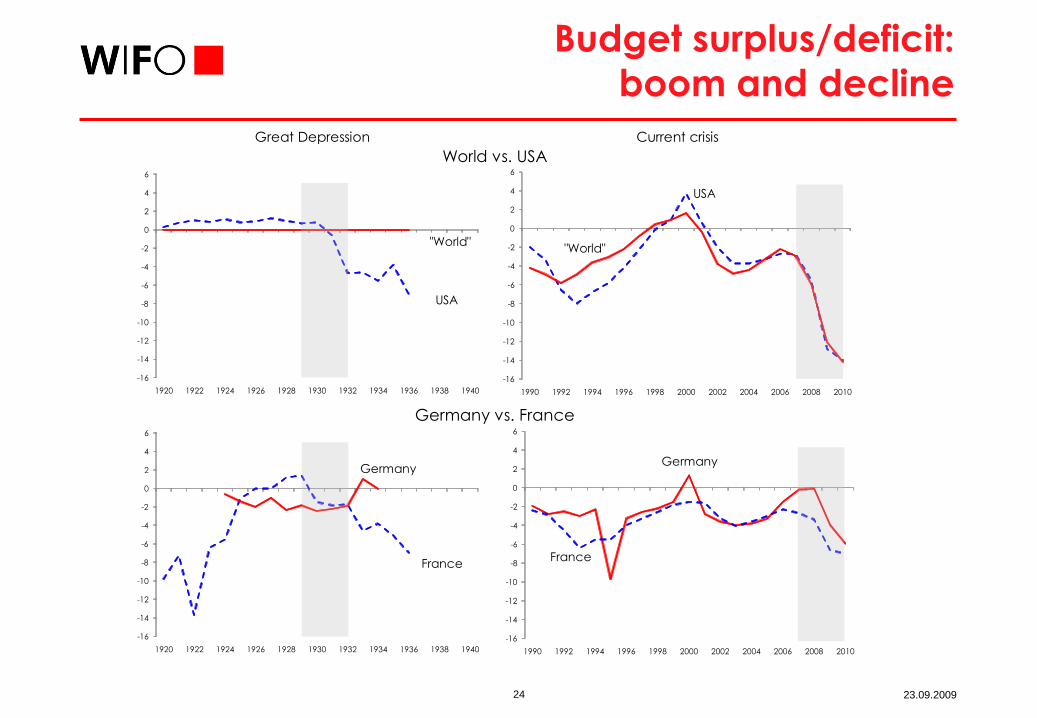
Budget surplus/deficit:
boom and decline
1408.89715
1408.89715
Great Depression Current crisis
World vs. USA
Germany vs. France
-16
-14
-12
-10
-8
-6
-4
-2
0
2
4
6
1990 1992 1994 1996 1998 2000 2002 2004 2006 2008 2010
France
Germany
-16
-14
-12
-10
-8
-6
-4
-2
0
2
4
6
1920 1922 1924 1926 1928 1930 1932 1934 1936 1938 1940
Germany
France
-16
-14
-12
-10
-8
-6
-4
-2
0
2
4
6
1990 1992 1994 1996 1998 2000 2002 2004 2006 2008 2010
USA
"World"
-16
-14
-12
-10
-8
-6
-4
-2
0
2
4
6
1920 1922 1924 1926 1928 1930 1932 1934 1936 1938 1940
"World"
USA

25 23.09.2009
Government Budget Surpluses in the
Great Depression vs. Current Crisis
Source: Eichengreen-O’Rourke (2009).
1929
2010 world2009
advanced
countries
26 23.09.2009
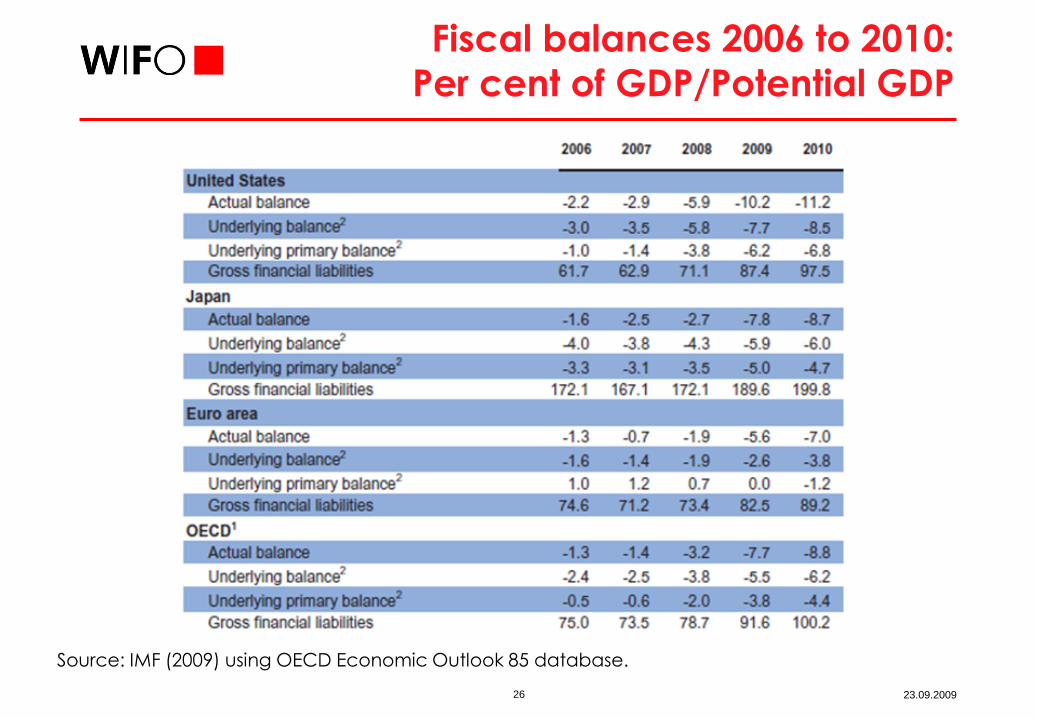
Fiscal balances 2006 to 2010:
Per cent of GDP/Potential GDP
Source: IMF (2009) using OECD Economic Outlook 85 database.

27 23.09.2009
Is the Current Crisis over?
Burdens left
For production it could be over (decline stopped)
Not for unemployment
Lower growth expected in the medium term
Mega burdens to be tackled:
Consolidation of budgets without increasing taxes (too much)
Fighting unemployment while preparing for ageing society
Increasing economic growth while switching towards sustainability
Regulatory reforms without impairing financing of firms, consumers
Prudent governments and excellent
policy advice needed.

28 23.09.2009
Why there should be no further
steps of decline (we hope)?
Everything happened in the beginning Burst of bubbles, stock market decline, break down of exports,
bank failures
These problems occurred step by step during GD, as hopes of end
had come up
The policy reacted this time with force, determinedness, coordinated
In GD first un-decisive, partly restrictive as fiscal policy started to stabilize - money supply collapsed
Bank failures were unexpected, at least policy reaction and
repercussions
No deflation this time
No center periphery pattern - in the contrary: China, India restart the engine Surplus money (sovereign state funds) available for recapitalization
and reinvestment: Arab countries, Norway, Indonesia.

29 23.09.2009
Policy requirements to prevent
further steps similar to GD
Policy recommendation (learning from GD)
Refrain from early exit: fiscal policy, monetary policy, bank support
Keep reserve funds and task forces for critical situations
Minimize protectionism
Policy recommendations (learning from causes of CC)
Shift support from old structures (cash for clunkers) to future needs
Improve regulation and international coordination
Reduce imbalances in a consistent medium-run strategy
Will the consensus of economists last: if unemployment and fiscal deficits approach 10%? (in some countries, 7% in others).

30 23.09.2009
Summary I
The drop in activity was much smaller, the CC was shorter
The rebound of the stock market is larger and longer than during GD
The CC had the potential of a much greater crisis
Better institutions, higher globalization and synchronization potentialbut also multi polarity
Policy acted decisively, strong, early, partially coordinated
All policy lines were applied at the same time
Consensus of economists was surprisingly strong.

31 23.09.2009
Summary II
Further steps can not to be excluded -probability can be minimized by watchful policy
Exit phase very demanding
Long-run lessons not learned, long-run problems not attacked
The two crisis are siblings (not twins)who got different foster parents
How will the younger one behave in adolescence and as grown up (in adulthood).
32 23.09.2009
Karl Aiginger
Comparing the Current Crisis to the
Great Depression
OECD - Nero ConferenceParis, September 21, 2009
H:user/aig/vortrag/OECD_crises_210909_short.pptx
33 23.09.2009
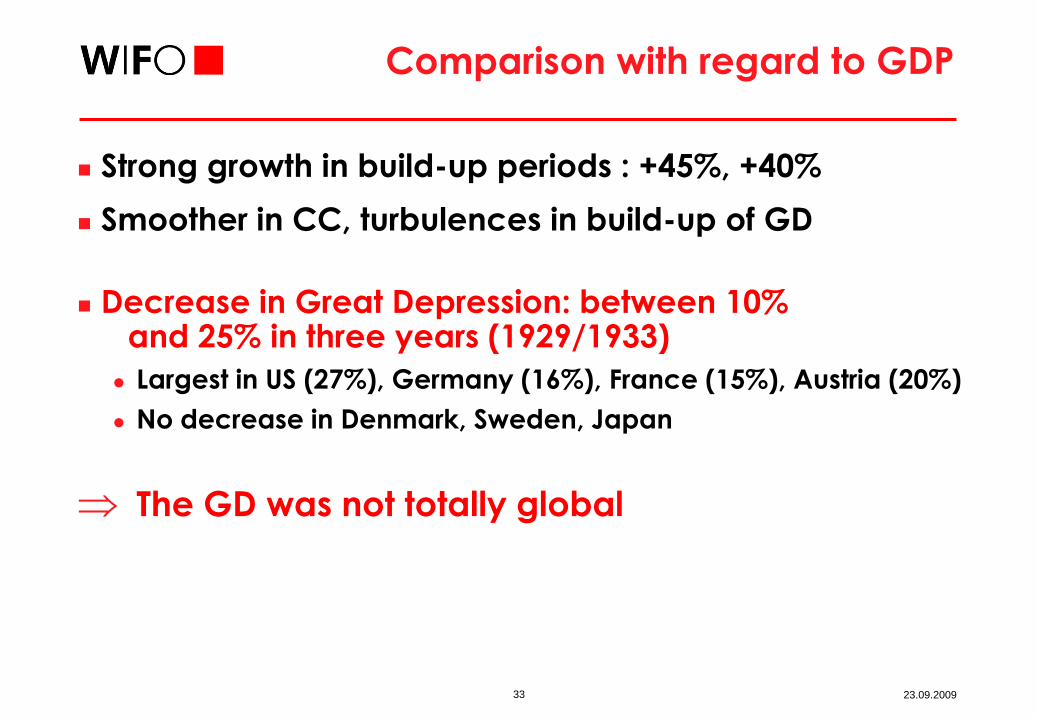
Comparison with regard to GDP
Strong growth in build-up periods : +45%, +40%
Smoother in CC, turbulences in build-up of GD
Decrease in Great Depression: between 10% and 25% in three years (1929/1933)
Largest in US (27%), Germany (16%), France (15%), Austria (20%)
No decrease in Denmark, Sweden, Japan
The GD was not totally global

34 23.09.2009
Further results for GDP
Decrease in Current Crisis: about 5% in quarterly data (2Q2009/peak 2008)
Between 2% world, 4% US, 7% Germany, 8% Japan
More severe in Russia, Ukraine, Baltics, Turkey
Continued growth in Poland, China, India
This comparison overstates Current Crisis
(quarterly data vs. annual)
Much smaller decline in GDP
Less dispersion (for industrialized countries)
35 23.09.2009
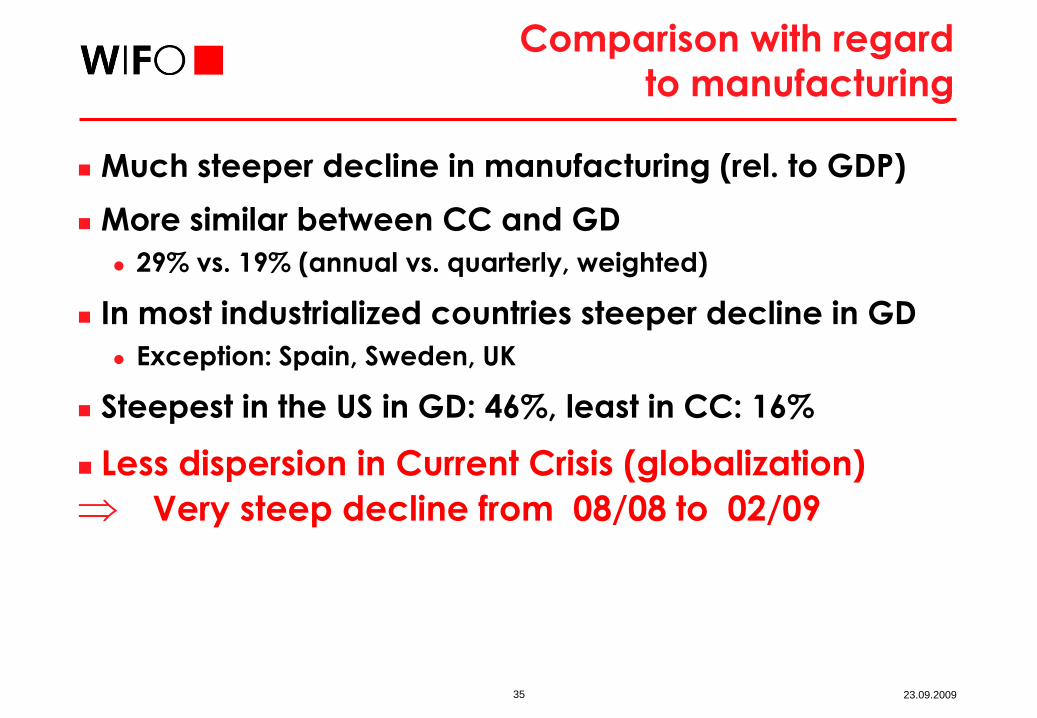
Comparison with regard
to manufacturing
Much steeper decline in manufacturing (rel. to GDP)
More similar between CC and GD
29% vs. 19% (annual vs. quarterly, weighted)
In most industrialized countries steeper decline in GD
Exception: Spain, Sweden, UK
Steepest in the US in GD: 46%, least in CC: 16%
Less dispersion in Current Crisis (globalization)
Very steep decline from 08/08 to 02/09

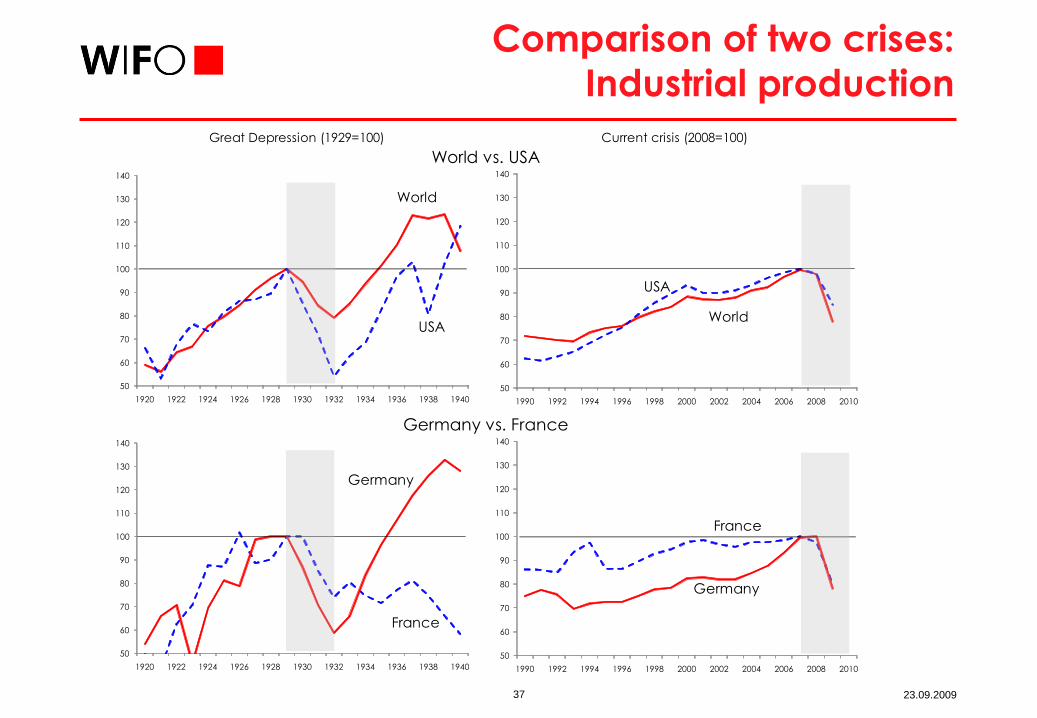
36 23.09.2009
Comparison of two crises:
Industrial production
1929/1921 1932/1929 Peak/2000 Peak/1990
2009
forecast
2Q2009/
peak 2008
Quarterly data
Austria 52.1 -39.0 33.0 77.2 -15.3 -20.5
Germany 51.8 -41.2 21.2 33.5 -21.8 -24.3
Belgium 113.0 -36.5 12.3 29.8 -19.0 -16.9
Spain 48.1 -6.4 8.5 23.8 -22.7 -22.8
France 127.8 -26.0 2.4 13.4 -18.2 -24.6
Finland 134.6 -13.1 25.4 108.6 -24.3 -28.2
Sweden 94.1 -10.6 19.1 73.9 -22.3 -26.9
United Kingdom 57.3 -10.8 0.9 7.1 -12.9 -18.4
USA 87.9 -46.0 7.3 56.6 -13.0 -15.7
Japan 50.0 -2.6 8.9 4.7 -32.2 -32.1
"World" 72.2 -29.5 8.0 34.3 -16.5 -18.9
Unweighted average over countries 81.7 -23.2 13.9 42.9 -20.2 -23.0
Standard deviation 34.3 16.3 10.4 34.8 5.9 5.2
Coefficient of variation 0.420 -0.703 0.750 0.811 -0.290 -0.227
Great depression (1932) Current crisis (2007 ff)
Percentage change
Annual data
37 23.09.2009
Comparison of two crises:
Industrial production
1408.89715
1408.89715
Great Depression (1929=100) Current crisis (2008=100)
World vs. USA
Germany vs. France
50
60
70
80
90
100
110
120
130
140
1990 1992 1994 1996 1998 2000 2002 2004 2006 2008 2010
World
USA
50
60
70
80
90
100
110
120
130
140
1920 1922 1924 1926 1928 1930 1932 1934 1936 1938 1940
World
USA
50
60
70
80
90
100
110
120
130
140
1990 1992 1994 1996 1998 2000 2002 2004 2006 2008 2010
France
Germany
50
60
70
80
90
100
110
120
130
140
1920 1922 1924 1926 1928 1930 1932 1934 1936 1938 1940
France
Germany
38 23.09.2009
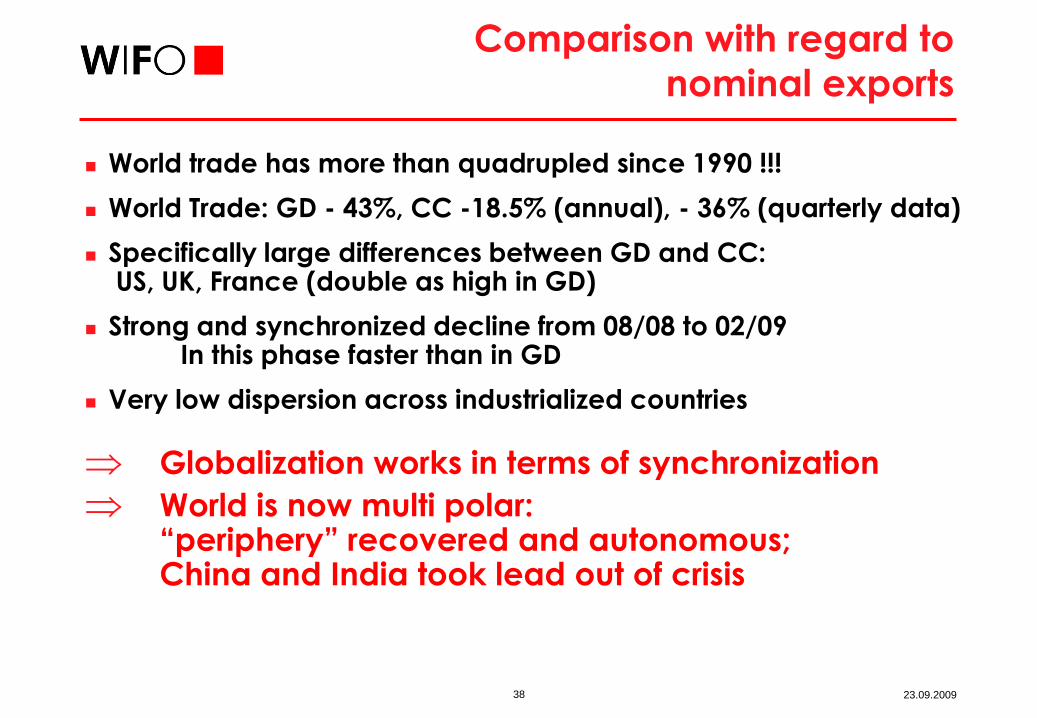
Comparison with regard to
nominal exports
World trade has more than quadrupled since 1990 !!!
World Trade: GD - 43%, CC -18.5% (annual), - 36% (quarterly data)
Specifically large differences between GD and CC:US, UK, France (double as high in GD)
Strong and synchronized decline from 08/08 to 02/09In this phase faster than in GD
Very low dispersion across industrialized countries
Globalization works in terms of synchronization
World is now multi polar: “periphery” recovered and autonomous;China and India took lead out of crisis

39 23.09.2009
Comparison of two crises:
Nominal export growth
Great Depression (1932)
1929/1921 1932/1929 Peak/2000
2009
forecast
1Q2009/
peak 2008
Quarterly data
Austria 68.1 -41.0 68.6 -22.9 -26.2
Germany 45.3 -28.9 66.1 -21.0 -22.9
Belgium -24.2
Spain -25.7
France 153.6 -39.3 25.6 -21.1 -21.5
Finland -40.7
Sweden 65.2 -38.1 47.9 -30.0 -20.7
United Kingdom 3.6 -45.8 32.7 -19.8 -14.8
USA 17.3 -54.0 66.4 -10.6 -28.3
Japan
World 67.5 -43.3 150.0 -18.4 -30.0
Unweighted average over countries 58.8 -41.2 51.2 -20.9 -25.0
Standard deviation 53.0 8.4 18.8 6.2 7.1
Coefficient of variation 0.901 -0.203 0.367 -0.298 -0.282
Current crisis (2007ff)
Percentage change
Annual data

40 23.09.2009
Comparison of two crises:
Nominal export growth
1408.89715
1408.89715
Great Depression (1929=100) Current crisis (2008=100)
World vs. USA
Germany vs. France
20
40
60
80
100
120
140
1990 1992 1994 1996 1998 2000 2002 2004 2006 2008 2010
World
USA
20
40
60
80
100
120
140
1920 1922 1924 1926 1928 1930 1932 1934 1936 1938 1940
World
USA
20
40
60
80
100
120
140
1990 1992 1994 1996 1998 2000 2002 2004 2006 2008 2010
France
Germany
20
40
60
80
100
120
140
1920 1922 1924 1926 1928 1930 1932 1934 1936 1938 1940
France
Germany

41 23.09.2009
Stock Market Decline
GD: steep fall at the start, long recovery
70% (GDP weighted), US -84% (1929/1932)
CC: steepest part 08/2008 to 03/2009
Overall decline much smaller (44% vs. 69%; 4 big indices)
Rebound up to 33% (weighted), 45% unweighted (monthly)
Largest rebound in GD: +13% in world, 16% in US in 11/1929
Outsider Japan: now steeper than in GD (in Austria, too)
Steeper decline (than in GD) from 08/2008 to 03/2009Proportionate decline now for given period (17 month) smaller (Contrary to Eichengreen who started graphs in April 1929)

42 23.09.2009
Unemployment rate, employment,
income level
Unemployment rose from 3% (1929) to 12% (1932; world) in GD
From 3% to 24% (USA)
From 9% to 30% (Germany)
From 12% to 25% (Austria)
CC: from 5% to 7% (2009), maybe surpassing 10% in US, EU 2010/11
Employment decreased by 16% (World, US: -18%, DE: -29%) in GD
And is expected to decrease by 2% to 3% in CC 2009
Employment doubled since GD, +8% since 2000
Income (real, PPP) is 8 to 10fold of 1929 at the start of the crisis
43 23.09.2009
Fiscal policy in GD
Surplus or small deficits in 1929
Deficit of 0.5% (1930), 1% (1931), 3% (1932), and then finally more (data for general government)
This looks to be much less than automatic stabilizers(at least up to 1931)
Governments (and states) tried to keep deficits low,
raised taxes
Restraints due to currency stabilization,
gold standard, memories of war debt and hyperinflation

44 23.09.2009
Fiscal policy in CC
Starting from -2.7% in US, -0.7% in EU, -5.5% in UK (2008)
Allowed automatic stabilizers to work
And added stimulus packages as of 4-5% of GDP (08/10)
At the start (2008/09) larger part were automatic stabilizers,
but intention to allow and to amplify them was clear from the start
Larger multipliers today
Political will to increase public demand/decrease taxes
(Nearly) all countries in (loosely) coordinated effort

45 23.09.2009
Fiscal policy: Interpretation
Great Depression:
1929-1931 Attempts to mitigate (smaller) automatic stabilizers
to balance budget, secure currency
prevent money/gold outflow
small deficits or even surpluses
from 1932 on more active (USA, France)
non coordinated internationally
Current Crisis:
different starting level in US, EU, UK
all allowed automatic stabilizers to work
additional stimulus packages
coordinated
46 23.09.2009
Complementary policies
in the Current Crisis
Fiscal/monetary intersection in CC
Guarantees of deposits
Recapitalization of banks
State ownership (partly, temporary) from banks to car firms
Similar guarantees of deposits recapitalization also in GD, but late, eclectic, uncoordinated (no ex ante funds and rules)
Employment policy: short-term working programs
Protectionism: strong verbal opposition
Opposition and mitigation where it occurred
Soft protectionism and “buy national” clauses exist
and may become more frequent (US tires etc.)

47 23.09.2009
The Current Crisis had the potential
of a Great Depression
Decline of manufacturing (and exports) for several months similar
“Fast start” of CC – at least after it was transmitted to real sector in 2008
Short length (at least for production and given if it is over in 2009)
Soft start in GD (slower transmission of stock crash in less globalized world); cycle had leveled off before
The final difference was in the length of the depression, not the speed at the beginning
48 23.09.2009
What made the difference?
Differences in institutions:
Lower share of manufacturing, larger public sector
New institutions (IMF, G20, World Bank), new coordination will
No gold standard, no competitive devaluations, Euro members sheltered
Difference in policy
All strands of policy worked together (with national differences)
Economists had a clear message: you can and should do somethingHalf of the economists did restrain from their usual advice
or were sidelined ;
OECD adopted a proactive approachit
Politicians of all large countries wanted pro active
policy at any costs, within or outside of existing rules

49 23.09.2009
Is the Current Crisis over?
Burdens left
For production it could be over (decline stopped)
Not for unemployment
Lower growth expected in the medium term
Mega burdens to be tackled:
Consolidation of budgets without increasing taxes (too much)
Fighting unemployment while preparing for ageing society
Increasing economic growth while switching towards sustainability
Regulatory reforms without impairing financing of firms, consumers
Prudent governments and excellent
policy advice needed
50 23.09.2009
Why there should be no further
steps of decline (we hope)?
Everything happened in the beginning Burst of bubbles, stock market decline, break down of exports,
bank failures
These problems occurred step by step during GD, as hopes of end
had come up
The policy reacted this time with force, determinedness, coordinated
In GD first un-decisive, partly restrictive as fiscal policy started to stabilize - money supply collapsed
Bank failures were unexpected, at least policy reaction and
repercussions
No deflation this time
No center periphery pattern - in the contrary: China, India restart the engine Surplus money (sovereign state funds) available for recapitalization
and reinvestment: Arab countries, Norway, Indonesia
51 23.09.2009
Policy requirements to prevent
further steps similar to GD
Policy recommendation (learning from GD)
Refrain from early exit: fiscal policy, monetary policy, bank support
Keep reserve funds and task forces for critical situations
Minimize protectionism
Policy recommendations (learning from causes of CC)
Shift support from old structures (cash for clunkers) to future needs
Improve regulation and international coordination
Reduce imbalances in a consistent medium-run strategy
Will the consensus of economists last: if unemployment and fiscal deficits approach 10%? (in some countries, 7% in others)

52 23.09.2009
Summary over stylized facts I
Given that policy decline has leveled off in summer 2009
The drop in GDP has been much smaller than in GD
Definitely for world output (-10% vs. -1% to -2%)
Specifically for all USA, France, Germany
Not for Japan, and some countries less affected in GD

53 23.09.2009
Summary over stylized facts II
Difference GD-CC is less in manufacturing and for exports
but still smaller drop for most industrialized countries
Stock market decline has been less for big stock exchanges
Effect on unemployment (up to now and including forecasts
2010/11) much smaller, the same holds for employment loss
Difference is not so much in the speed of decline,
but in the length, therefore the results depend on
the recurrence of the crisis or not
Prudent policy can prevent the recurrence