comparing math achievement growth by textbook … · author affiliations david blazar, university...
TRANSCRIPT

iCenter for Education Policy Research (CEPR) | cepr.harvard.edu
MARCH 2019
David Blazar
Thomas J. Kane
Douglas Staiger
Dan Goldhaber
Rachel Hitch
Michal Kurlaender
Blake Heller
Morgan Polikoff
Scott Carrell
Douglas Harris
Kristian L. Holden
Learning by the BookCOMPARING MATH ACHIEVEMENT GROWTH BY TEXTBOOK IN SIX COMMON CORE STATES
AUTHOR AFFILIATIONS
David Blazar, University of MarylandBlake Heller, Harvard UniversityThomas J. Kane, Harvard UniversityMorgan Polikoff, University of Southern CaliforniaDouglas Staiger, Dartmouth CollegeScott Carrell, University of California, DavisDan Goldhaber, American Institutes for Research, University of WashingtonDouglas Harris, Tulane University Rachel Hitch, Harvard University Kristian L. Holden, American Institutes for ResearchMichal Kurlaender, University of California, Davis
SUGGESTED CITATION
Blazar, D., Heller, B., Kane, T., Polikoff, M., Staiger, D., Carrell, S.,...& Kurlaender, M. (2019). Learning by the Book: Comparing math achievement growth by textbook in six Common Core states. Research Report. Cambridge, MA: Center for Education Policy Research, Harvard University.
We gratefully acknowledge funding from the Bill & Melinda Gates Foundation, the Charles and Lynn Schusterman Foundation, the William and Flora Hewlett Foundation, and the Bloomberg Philanthropies. The research reported here also was supported by the Institute of Education Sciences, U.S. Department of Education, through grant R305B150010 to Harvard University and Grant R305E150006 to the Regents of the University of California (Michal Kurlaender, Principal Investigator, UC Davis School of Education) in partnership with the California Department of Education ( Jonathan Isler, Co-Principal Investigator). The opinions expressed are those of the authors and do not represent views of the Institute of Education Sciences, the philanthropic funders, the departments of education in any of the participating states, the research institutions, nor the advisory board members.
Thomas Kelley-Kemple, Jake Kramer, and Virginia Lovison at Harvard University; Lihan Liu at Tulane University; Matthew Naven and Derek Rury at the University of California Davis provided excellent research assistance. Rachel Urso and Sophie Houstoun at Center for Education Policy Research at Harvard University led the recruitment of schools and teachers for our surveys, and Nate Brown at the University of Washington led additional outreach in Washington state. Eric Hirsch, Lauren Weisskirk and Mark LaVenia at EdReports provided invaluable support and feedback in understanding the breadth of curriculum choices and textbook alignment to the Common Core.
Our project depended upon the collaboration and support of our state partners, including John White, Jessica Baghian, Kim Nesmith, Rebecca Kockler, and Alicja Witkowski at the Louisiana Department of Education; Carol Williamson and Debra Ward from Maryland Department of Education; Peter Shulman, James Riddlesperger, LaShona Burke, and Jessica Merville at the New Jersey Department of Education; and Christopher Ruzkowski and Anthony Burns from New Mexico Public Education Department.
The study also benefited from the experience and feedback from an advisory board of experts on curriculum design and value-added methodology, including: Matthew Chingos (Urban Institute), Erin Grogan and Dan Weisberg (TNTP), Cory Koedel (University of Missouri), Darleen Opfer and Julia Kaufman (RAND Corporation), Grover J. “Russ” Whitehurst (Brookings), David Steiner ( Johns Hopkins University), and Jason Zimba (Student Achievement Partners) who read drafts of the report and provided comments.
Finally, we thank the thousands of district leaders, school principals, administrators, and classroom teachers who generously provided input about their curriculum choices to ensure that our project was a success.

iv Learning by the Book | RESEARCH REPORT
TABLE OF CONTENTSAbstract .................................................................................................................... 1
Introduction .............................................................................................................. 2
Literature Review ..................................................................................................... 4
Prior Evidence on Textbook Effectiveness ....................................................... 5
Randomized Trials ................................................................................. 5
Non-Experimental Studies .................................................................... 6
Motivation for Our Study .................................................................................. 6
Data Collection ......................................................................................................... 7
Textbook Adoptions .......................................................................................... 7
Teacher Survey ............................................................................................... 11
Student Achievement and Demographic Data ............................................... 12
Empirical Methodology .......................................................................................... 13
Results ................................................................................................................... 15
Teacher-Reported Use of Textbooks .............................................................. 15
Differences in Average Student Achievement Gains Between Textbooks .... 19
The Underlying Variation in Textbook Efficacy ............................................... 23
Heterogeneity in Textbook Efficacy ................................................................ 24
Variation in Textbook Efficacy in Schools by Level of Teacher Usage ................................................................... 24
Variation in Textbook Efficacy by Years Since Adoption ...................... 26
Variation in Textbook Efficacy by Days of Textbook-Aligned Professional Development .................................................................. 26
Textbook Efficacy among Pre- and Post-CCSS Texts .......................... 26
Additional Robustness Checks ...................................................................... 28
Reconciling with the Previous Literature ...................................................... 29
Conclusion ............................................................................................................. 31
References ............................................................................................................. 33
Appendix ................................................................................................................ 36

1Center for Education Policy Research (CEPR) | cepr.harvard.edu
ABSTRACTCan a school or district improve student achievement simply by switching to a higher-quality textbook? The question is a timely one, as thousands of school districts have been adopting new texts to align with the Common Core State Standards (CCSS). Indeed, we find that over 80% of schools in six Common Core states are using a CCSS-edition elementary math textbook, and 93% of teachers reported using those textbooks in more than half their lessons. Few central office decisions have a broader impact than textbook adoptions on the work that students and teachers do every day.
To explore the consequences of textbook choice for student achievement, we combined data on math textbook use with fourth- and fifth-grade student test scores during the first three years of administration of CCSS-aligned assessments (2014–15 through 2016–17). Overall, we found little evidence of differences in average achievement gains for schools using different math textbooks. We also did not find impacts of textbooks for schools where teachers reported above-average levels of textbook usage, for schools that had been using the text for more than one year, or in schools that provided an above-average number of days of professional development aligned to the textbook. We also found some evidence of greater variation in achievement gains among schools using pre-CCSS editions, which may have been more varied in their content prior to the use of common standards. Our results differ from previous research, including several randomized trials, which reported substantial differences in achievement gains for schools using different textbooks. We offer several possible explanations for the difference between our results and the previous literature.
At current levels of classroom implementation, we do not see evidence of differences in achievement growth for schools using different elementary math textbooks and curricula. It is possible that, with greater supports for classroom implementation, the advantages of certain texts would emerge, but that remains to be seen.
2 Learning by the Book | RESEARCH REPORT
INTRODUCTIONThe choice of textbook or curriculum is an enticing lever for district leaders seeking to improve student outcomes. Few central office decisions have such far-ranging implications for the work that students and teachers do together in classrooms every day. Indeed, in our own survey, which we discuss below, we find that 93% of elementary math teachers in six U.S. states reported using the official district-adopted textbook or curriculum in more than half of their lessons.1 Given such widespread usage, helping school districts to switch from less to more effective materials offers a large potential “bang-for-the-buck” (Kirst, 1982; Whitehurst, 2009). As Chingos and Whitehurst (2012) point out, “…whereas improving teacher quality…is challenging, expensive, and time consuming, making better choices among available instructional materials should be relatively easy, inexpensive, and quick” (p. 1).
Textbook choice has been especially salient in recent years, after many states adopted the Common Core State Standards (CCSS). In the years since CCSS adoption, large publishing houses (e.g., Houghton Mifflin Harcourt, McGraw Hill, Pearson) have invested heavily in adapting existing textbooks and curriculum materials to the new standards, and in writing new materials from scratch. New York State spent over $35 million dollars to develop a set of curriculum materials, Engage NY, which are now widely used across the country (Cavanaugh, 2015). As of 2016-17, over 80% of the schools in our sample had adopted a CCSS-edition in elementary math.
Despite the potential value to districts and schools, the research literature on the efficacy of alternative textbooks or curricula is sparse. We are aware of one multi-textbook randomized trial (Agodini et al., 2010), two randomized trials assessing the effectiveness of a single textbook (Eddy et al., 2014; Jaciw et al., 2016), and a handful of non-experimental studies (Bhatt & Koedel, 2012; Bhatt, Koedel, & Lehmann, 2013; Koedel, Polikoff, Hardaway, & Wrabel, 2017). However, most of the textbook editions or curriculum materials in common use today have never been subjected to a rigorous test of efficacy (Chingos & Whitehurst, 2012).
One reason for the weakness of the evidence base is the historic diversity in state standards and assessments. When each state had its own standards and assessments, single-state studies were relevant only for schools in a given state, and few states were sufficiently large to justify the cost of such an analysis. A second, more practical barrier has been the omission of textbook adoptions from state data collection efforts (Polikoff, 2018). As useful as adoption data would be for measuring efficacy, states have concentrated their data collection efforts on fulfilling accountability requirements, rather than informing district decision-makers. Historically, many states have stayed away from collecting data on curriculum adoptions in deference to local authorities (Hutt & Polikoff, 2018). We are aware of only six states that regularly collect information on the textbooks used by schools: California, Florida, Indiana, Louisiana, New Mexico, and Texas.2 As a result, it
1 Throughout the paper, we use the terms “textbook” and “curriculum” interchangeably. We recognize, though, that the physical textbook may be just one of multiple materials that make up a given curriculum. Curricula can include student and teacher editions of the textbook, formative assessment materials, manipulative sets, etc. In our survey to schools and teachers, we referred to the “primary textbook or curriculum materials” used by teachers, which could consist of “a printed textbook from a publisher, an online text, or a collection of materials assembled by the school, district, or individual teachers [but] does not include supplemental resources that individual teachers may use from time to time to supplement the curriculum materials.”
2 California schools are mandated under law to report curriculum materials on school accountability report cards
3Center for Education Policy Research (CEPR) | cepr.harvard.edu
has been difficult to bring to bear states’ longitudinal data on student achievement to compare the achievement gains of similar schools using different curricula.
Ours is the first multi-state effort to measure textbook efficacy in the CCSS era. We began by assembling data on math textbook adoptions in fourth- and fifth-grade classrooms in six states (California, Louisiana, Maryland, New Jersey, New Mexico, and Washington state) over three academic years (2014–15 through 2016–17). Our study period coincides with the first years of testing by the two CCSS assessment consortia, the Smarter Balanced Assessment Consortium (SBAC) and the Partnership for Assessment of Readiness for College and Career (PARCC). In two states, California and New Mexico, we assembled data on textbook use in elementary math from administrative records. In the remaining states, we surveyed a stratified random sample of 1,086 elementary schools to learn which math textbooks they were using.
In a second phase, we collected information from a subsample of teachers using one of the top seven most frequently used curricula. The roughly 20-minute online survey asked about teachers’ use of textbook materials for various purposes (lesson planning, student assessment, etc.). We also asked about teachers’ use of supplementary materials (including educational software), the presence of math coaches in the school, and professional development related to math instruction or math curriculum. We selected a random sample of roughly 60 schools per curriculum and recruited the fourth- and fifth-grade teachers in each of the selected schools.
In the third phase, we assembled student-level achievement data over time to estimate school-level differences in average student achievement growth, adjusting for differences in students’ baseline achievement and demographics—that is, school-level “value-added” (for a discussion of the validity of school-level value-added measures, see Angrist et al., 2017; Deming, 2014).3
We summarize our findings below:
» Despite a plethora of options, including open source curriculum materials, the elementary math textbook market remains fairly concentrated. Roughly 70% of elementary schools in the six states used one of seven texts, and 90% used one of 15 texts (out of a total of 38 textbooks identified in our sample).
» Despite the fact that the six states had similar standards and assessments, the market share for particular curricula varied by state. For instance, in New Mexico, the market was nearly evenly split among three textbook series, enVision, My Math, and Stepping Stones, all of which were written for or adapted to the CCSS. Comparatively, in Louisiana, almost 60% of schools used Engage NY, an open source curriculum written for the CCSS (also published under the title Eureka).
(Holden, 2016; Hutt & Polikoff, 2018). In Florida and Indiana, centralized adoption processes allow state agencies to capture information on districts’ adoption of certain texts (Bhatt & Koedel, 2012; Bhatt, Koedel, & Lehmann, 2013). New Mexico collects curriculum data based on purchasing records from a state-organized curriculum warehouse, and these records can be attached to individual schools. Recently, Louisiana has started to collect data on textbook adoptions through district and school surveys. Texas tracks adoption data based on requisitions and disbursements, and posts this information on a public website.
3 For our study, we assume that the school value-added measures are “forecast-unbiased”.

4 Learning by the Book | RESEARCH REPORT
» The vast majority of teachers (93%) reported using the official curriculum in more than half of their lessons for purposes such as creating tasks/activities for class, selecting examples to present, or assigning problems for independent practice or homework; 76% reported that they used the curriculum for one of these purposes during “nearly all” of their lessons. At the same time, only 25% of teachers reported using the textbook in nearly all their lessons for all essential activities, including in-class exercises, practice problems, and homework problems.
» Nevertheless, unlike the prior literature (Agodini et al., 2010; Bhatt & Koedel, 2012; Bhatt et al., 2013; Koedel et al., 2017), we found little evidence of substantial differences in average math achievement growth in schools using different elementary math curricula. Although we saw substantial variation in achievement growth among the schools using each curriculum, the differences in average achievement growth between curricula are small. Our findings are similar for specific subgroups of students, by English language learner (ELL) status, free or reduced-price lunch status (a proxy measure of socioeconomic status), and high- or low-baseline achievement. The variance in textbook efficacy also was not significant in the subset of schools in which teachers reported the highest average levels of textbook usage, or in schools that had been using the text for two or more years.
Below, we briefly review the literature on the implementation and efficacy of curriculum materials. In subsequent sections, we describe our data and methodology, and present results on teachers’ use of textbook and measured efficacy. Afterwards, we attempt to reconcile our findings with the prior literature on textbook effects, especially the randomized controlled trial conducted by Agodini et al. (2010). We discuss the role of possible biases in our value-added methodology, possible limits on the generalizability of the randomized controlled trial, the role of implementation, and the possible greater uniformity in textbook coverage following the CCSS. We conclude with a discussion of the implications of our results for policy and future research.
LITERATURE REVIEWEach year, schools and districts spend upwards of $10 billion on textbooks and other instructional materials (Boser, Chingos, & Straus, 2015; McFarland et al., 2017). However, districts must select curricula in the absence of evidence of efficacy, relying instead on the judgements of central office staff, textbook selection committees, and the choices of neighboring districts (for a review of the adoption literature and new qualitative analyses, see Polikoff et al., 2018). Of the 38 textbooks we observe in our sample, only five have been evaluated in a manner meeting the highest evidence standards of the federal What Works Clearinghouse (WWC), a repository for education research. Only three of these are among the top 15 most commonly used textbooks in our sample.
One recent study describing teachers’ instructional decisions in the CCSS era suggests that textbooks are a primary resource for math instruction, although not the sole source. In a nationally representative survey of schools, Opfer et al. (2016) found that 98% of elementary math teachers reported using instructional materials selected or developed by district leadership. Roughly 85% of teachers reported that their districts required (57%) or recommended (27%) that they use specific textbooks to teach mathematics. At the same time, the authors observed that teachers often used other materials, including lessons from online resources (e.g., Google.com, Pinterest.com) to supplement their primary textbook.
5Center for Education Policy Research (CEPR) | cepr.harvard.edu
PRIOR EVIDENCE ON TEXTBOOK EFFECTIVENESSWe discuss the past research on math textbook efficacy in two broad categories: randomized trials and non-experimental studies.
Randomized TrialsTo our knowledge, only one study has used a randomized design to compare the impact of multiple elementary math textbooks on student achievement.4 Agodini et al. (2010) randomly assigned one of four curricula to 111 schools in 12 districts across 10 states. All four curricula were published prior to the roll out of the CCSS: Investigations in Mathematics, Math Expressions, Saxon Math, or Scott Foresman-Addison Wesley Elementary Math (SFAW). The study took place during three school years (2006–07, 2007–08, and 2009–10) and focused on first- and second-grade classrooms. Teachers received 1–2 days of training on the assigned textbook in the summer before implementation and an additional 1.5 days during the following spring. (The amount of training was similar to that reported by teachers in our surveys.) Second-grade classrooms using Math Expressions or Saxon Math outperformed those using SFAW by 0.12 SD and 0.17 SD respectively.5 These effect sizes are quite large relative to the vast majority of educational interventions (Fryer, 2017). For instance, they would be larger than the effect of having an experienced teacher versus a novice teacher (generally found to be roughly 0.08 SD) and roughly equivalent to a 1 SD increase in teacher efficacy.
Two other studies used randomized designs to study individual curricula. Eddy et al. (2014) randomly assigned the Go Math curriculum to first- through third-grade classrooms in nine schools across seven states during the 2012–2013 school year. After one year, the authors did not find statistically significant differences in student achievement. Jaciw et al. (2016) evaluated the effectiveness of the Math in Focus textbook (modelled after a Singaporean math curriculum) by randomly assigning 22 clusters of third- through fifth-grade teachers in 12 schools in Clark County School District (Las Vegas) in Nevada during the 2011–2012 school year. Teachers attended a short training session (1.5 to 3 hours) during the summer before, and four half-day
4 Several additional studies that attempted to use randomized designs to evaluate specific curricula were rejected from the What Works Clearinghouse (WWC)—a repository of education research—for failing to meet inclusion standards, generally due to imbalance between groups at baseline. Two doctoral dissertations cited by WWC used experimental designs to evaluate textbook effectiveness but never were published and rely on extremely small samples (N<100 students). WWC reviews two additional studies with randomized designs that meet their evidence standards; however, these studies are not available online (Beck Evaluation & Testing Associates Inc., 2005; Gatti & Giordano, 2010). In a currently unpublished review, Pellegrini et al. (2018)—updated from an earlier published review of the same topic (Slavin & Lake, 2008)—also cite a recent randomized evaluation of enVision Math 2.0 that is not available online (Strobel, Resendez, & DuBose, 2017). At the time of writing, we were unable to obtain access to review these studies. Additionally, Pellegrini et al. (2018) cite results from randomized trials evaluating Everyday Mathematics and JUMP Math textbooks that were gleaned from conference presentations, where a full description of each study’s experimental design and associated balance tests are not available online.
There also are several randomized evaluations of math materials, which we see as different from the textbooks evaluated by Agodini et al. (2010) and that we examine in our studies. Math software products that sometimes are described as curriculum, including Cognitive Tutor Bridge to Algebra, Compass Learning’s Odyssey Math, PLATO Achieve Now, and Larson Pre-Algebra, have been subjected to randomized evaluations. In our study, we define these materials as supplemental and not the primary curriculum to teach mathematics. Jackson and Makarin (2018) experimentally evaluated the effectiveness of “off-the-shelf” curriculum materials for middle school math teachers, which we distinguish from complete textbooks.
5 Agodini et al. (2010), Table III.2.

6 Learning by the Book | RESEARCH REPORT
or full-day sessions throughout the year.6 The authors found that students in grade-level teams randomly assigned to adopt Math in Focus outperformed students in the control group by 0.11 to 0.15 SD on the Stanford Achievement Test (10th edition) at the end of the first year of usage. However, the study team found no impact of Math in Focus on the criterion-referenced test required by the state of Nevada.
Non-Experimental StudiesIn addition to the randomized trial, a handful of non-experimental studies have identified effects of textbooks on student achievement gains. For example, Koedel and co-authors used matching methods and school-level aggregate achievement to measure textbook efficacy in three states: California, Florida, and Indiana (Bhatt & Koedel, 2012; Bhatt, Koedel & Lehmann, 2013; Koedel et al., 2017). Given the large number of texts used in California and Florida, the analysts used a two-step process in those states. They first identified a differently effective or widely used text based on an initial exploratory analysis. They then subsequently compared that text against a composite comparison group. Although it helps to narrow the focus of inquiry, the danger is that the initial exploration may identify the “winning” text due to chance differences in achievement. (For the analysis in Indiana, they did not have to winnow down the texts beforehand.) Although the authors are careful to conduct a number of validity tests in the second step—e.g., verifying that the timing of any achievement increase aligned with the textbook adoption and that achievement did not grow in English Language Arts (ELA)—such tests would not necessarily reveal a within-sample anomaly.7
The only textbook that appears in both the randomized trial and the non-experimental studies conducted by Koedel and collaborators (i.e., Bhatt & Koedel, 2012) is Saxon Math. The text was among the most effective in the randomized trial, but was among the lower-performing textbooks in the non-experimental analysis.8
MOTIVATION FOR OUR STUDYWe designed our study as a field test of a replicable, low-cost approach to measuring curriculum efficacy. By estimating value-added models in states using CCSS-aligned assessments, we eliminated the need to collect our own assessments or to recruit schools to switch textbooks. In addition, by coordinating with researchers in other states—each team estimating the same model with student-level data and then sharing only aggregated data with us—we reduced the need to share student-level data across state lines. Finally, by collecting textbook data for a random sample of schools, we ensured that we had a representative sample of schools (at least in these six states) and were focused on the textbook editions that schools were using in the present CCSS-era. By
6 The amount of training was more than the average we found in our sample, but roughly equivalent to the top half of schools in our sample in terms of days of teacher training on the text.
7 WWC and Pellegrini et al. (2018) cite several non-experimental evaluations of single textbooks. We omit these evaluations from our literature review and focus on non-experimental analyses that compare multiple textbooks, preferencing the highest-quality research designs (randomized trials) or multi-textbook evaluations that are most similar to our own study.
8 The difference in efficacy for Saxon Math in the RCT and in the Koedel et al. studies might not be due to the methodological differences alone. As Koedel et al. discuss, Saxon Math, as a highly scripted curriculum, was designed for implementation in schools where the teachers have weak math backgrounds, the very type of schools that participated in the RCT.
7Center for Education Policy Research (CEPR) | cepr.harvard.edu
relying on secondary assessment data and the textbook editions in use today, we designed the study so that the same methodology could be used to update results as textbook editions come and go.
Although randomized trials may be the most convincing way to estimate the causal effect of textbooks for a given sample of schools, the estimated impacts might not generalize beyond the small subset of schools that are willing to have their textbooks randomly assigned. By relying on school-level value-added, we have to make stronger statistical assumptions—namely, that we are able to control for the key differences between schools using different texts. However, the benefit is that we are able to estimate value-added for nearly every school in the six states we are studying.
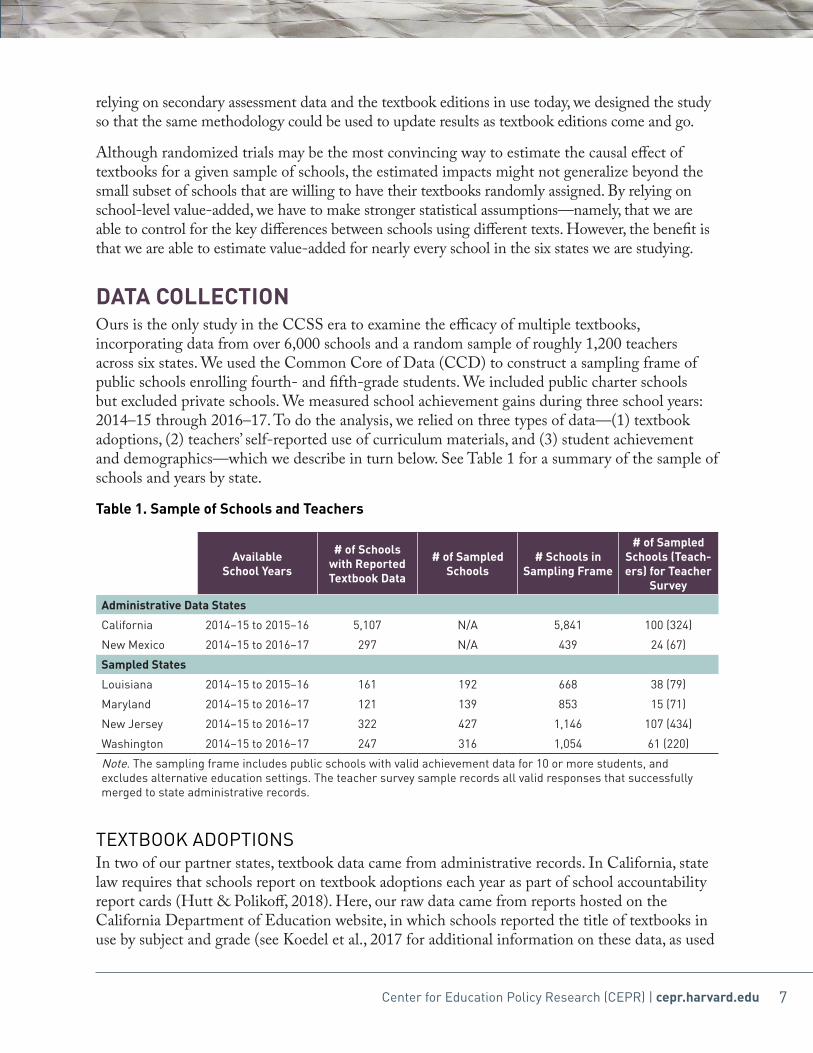
DATA COLLECTIONOurs is the only study in the CCSS era to examine the efficacy of multiple textbooks, incorporating data from over 6,000 schools and a random sample of roughly 1,200 teachers across six states. We used the Common Core of Data (CCD) to construct a sampling frame of public schools enrolling fourth- and fifth-grade students. We included public charter schools but excluded private schools. We measured school achievement gains during three school years: 2014–15 through 2016–17. To do the analysis, we relied on three types of data—(1) textbook adoptions, (2) teachers’ self-reported use of curriculum materials, and (3) student achievement and demographics—which we describe in turn below. See Table 1 for a summary of the sample of schools and years by state.
Table 1. Sample of Schools and Teachers
Available School Years
# of Schools with Reported Textbook Data
# of Sampled Schools
# Schools in Sampling Frame
# of Sampled Schools (Teach-ers) for Teacher
Survey
Administrative Data States
California 2014–15 to 2015–16 5,107 N/A 5,841 100 (324)
New Mexico 2014–15 to 2016–17 297 N/A 439 24 (67)
Sampled States
Louisiana 2014–15 to 2015–16 161 192 668 38 (79)
Maryland 2014–15 to 2016–17 121 139 853 15 (71)
New Jersey 2014–15 to 2016–17 322 427 1,146 107 (434)
Washington 2014–15 to 2016–17 247 316 1,054 61 (220)
Note. The sampling frame includes public schools with valid achievement data for 10 or more students, and excludes alternative education settings. The teacher survey sample records all valid responses that successfully merged to state administrative records.
TEXTBOOK ADOPTIONSIn two of our partner states, textbook data came from administrative records. In California, state law requires that schools report on textbook adoptions each year as part of school accountability report cards (Hutt & Polikoff, 2018). Here, our raw data came from reports hosted on the California Department of Education website, in which schools reported the title of textbooks in use by subject and grade (see Koedel et al., 2017 for additional information on these data, as used

8 Learning by the Book | RESEARCH REPORT
in another analysis covering a different set of school years). Those data allowed us to identify the math textbook in use for over 85% of elementary schools in the state. Given the lag in reporting, we captured textbooks used by California schools in 2014–15 and 2015–16, but not in 2016–17.
In New Mexico, we relied on purchasing data to capture textbook adoptions. Because schools receive a discount when they purchase from a centralized warehouse, we observed textbook orders for 67% of public elementary schools. The purchasing data included ISBNs and textbook titles, quantity purchased, and school addresses. To distinguish between one-off purchases and official textbook adoptions, we limited our analysis to instances where the number of texts purchased was at least 50% of fourth- and fifth-grade enrollment in a given school and year. We observed such purchases between 2010 and 2017. If we observed a qualifying purchase of a textbook in this time frame, we imputed that data to future years, until/unless we observed a subsequent qualifying purchase.9
In the four remaining states (Louisiana, Maryland, New Jersey, and Washington), we surveyed schools in the winter of the 2016–17 school year in order to identify the textbooks they used that year and the two years prior. Beginning with the population of public elementary schools and districts in the CCD, we selected a random sample of districts, stratified by the number of elementary schools (i.e., districts with just one school that fit our inclusion criteria, two to three schools, four to seven schools, and those with eight or more schools) and the percentage of students receiving free or reduced-price lunches (above and below median of the state).
The schools within most urban school districts share a single text. Therefore, if we had sampled schools proportional to their enrollments, we would have ended up with a large number of urban schools, using a small number of texts. Instead, we used the following sampling procedure to ensure that we obtained responses from a broad number of texts. First, we randomly selected half of the one-school districts as part of our sample. We attempted to survey at least one school from all districts with two or more schools. We sampled one school from districts with two to three schools, two schools from districts with four to seven schools. In districts with eight or more elementary schools, each school had a 20% chance of being selected.10 Under this schema, we arrived at a total sample of 1,086 schools in our sample using a broad range of textbooks.
To recruit schools, we first sent an electronic survey to the principal or curriculum coordinator in each school, providing a description of the project and a promise of a $50 gift card for successful completion of the survey. We followed up with an email and called the school every 10 days until we received a response. We also contacted district personnel to help with outreach to schools.
After multiple rounds of follow-up over five months, we achieved response rates of 79% overall and between 75% and 87% for each state (see Table 1). In Table 2, we compare observable school and district characteristics for schools with and without textbook data. In California and New Mexico, where we relied on administrative data, we do see differences between schools with and without textbook data: In California, the schools not providing textbook data had higher percentages of special education students, higher per pupil expenditures and lower baseline
9 Of the 67 teachers from New Mexico that participated in our teacher survey, 91% indicated that the textbook we had on file for them based on the purchasing data was correct.
10 One exception was in Maryland, where initial conversations with state and district staff indicated that very large districts in the state (several with over 100 schools that met our inclusion criteria) adopted a single textbook across the entire district. Therefore, we limited the random sample of schools to just 10, rather than 20%.
9Center for Education Policy Research (CEPR) | cepr.harvard.edu
math achievement. In New Mexico, the schools without textbook data had somewhat lower percentages of students on free lunch, but other differences were not statistically significant or small. In the states where we conducted our own survey, the non-respondents differed from respondents on only one out of 17 characteristics (a 2-percentage-point difference in the percent of students who were of Asian descent).11 On observable measures at least, the schools in our analyses are representative of their states.
For the final analysis, we excluded a handful of schools for two reasons. First, we dropped 12 schools that had fewer than 10 students with the data needed to calculate school-level value-added (i.e., current and prior year math achievement and student demographics). Second, we excluded schools that responded to our survey but indicated that the school did not use any textbook (N = 23), used different texts between fourth and fifth grade (N = 18), or used district-developed materials (N = 57). We excluded the schools using district-developed materials since each was likely to be unique. District-developed materials were most common in Maryland, where 33% percent of schools reported using district-developed materials.
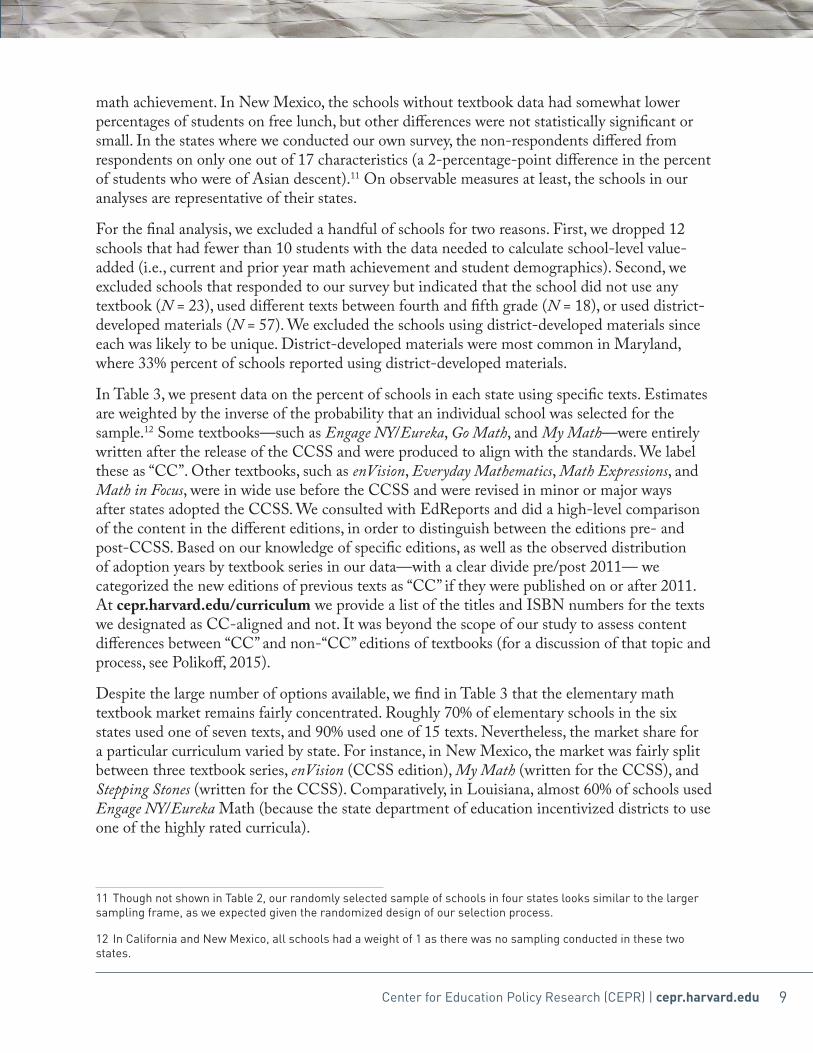
In Table 3, we present data on the percent of schools in each state using specific texts. Estimates are weighted by the inverse of the probability that an individual school was selected for the sample.12 Some textbooks—such as Engage NY/Eureka, Go Math, and My Math—were entirely written after the release of the CCSS and were produced to align with the standards. We label these as “CC”. Other textbooks, such as enVision, Everyday Mathematics, Math Expressions, and Math in Focus, were in wide use before the CCSS and were revised in minor or major ways after states adopted the CCSS. We consulted with EdReports and did a high-level comparison of the content in the different editions, in order to distinguish between the editions pre- and post-CCSS. Based on our knowledge of specific editions, as well as the observed distribution of adoption years by textbook series in our data—with a clear divide pre/post 2011— we categorized the new editions of previous texts as “CC” if they were published on or after 2011. At cepr.harvard.edu/curriculum we provide a list of the titles and ISBN numbers for the texts we designated as CC-aligned and not. It was beyond the scope of our study to assess content differences between “CC” and non-“CC” editions of textbooks (for a discussion of that topic and process, see Polikoff, 2015).
Despite the large number of options available, we find in Table 3 that the elementary math textbook market remains fairly concentrated. Roughly 70% of elementary schools in the six states used one of seven texts, and 90% used one of 15 texts. Nevertheless, the market share for a particular curriculum varied by state. For instance, in New Mexico, the market was fairly split between three textbook series, enVision (CCSS edition), My Math (written for the CCSS), and Stepping Stones (written for the CCSS). Comparatively, in Louisiana, almost 60% of schools used Engage NY/Eureka Math (because the state department of education incentivized districts to use one of the highly rated curricula).
11 Though not shown in Table 2, our randomly selected sample of schools in four states looks similar to the larger sampling frame, as we expected given the randomized design of our selection process.
12 In California and New Mexico, all schools had a weight of 1 as there was no sampling conducted in these two states.

10
Table 2. Comparing Respondents and Non-Respondents
Administrative Data States: California and New Mexico Sampled States: Louisiana, Maryland, New Jersey, and WashingtonCA NM
School Characteristics Schools with Known Text
Difference for Schools with
Unknown Text
Schools with Known Text
Difference for Schools with
Unknown Text Respondents Difference for
Non-Respondents
FRPL (%) 62.0 -3.9 ~ 84.3 -10.6 ** 50.5 3.5
Special Education (%) 12.6 5.6 *** 17.6 -0.9 14.5 0.0
ELL (%) 24.2 -5.9 *** 16.1 -4.0 * 605 1.5
Male (%) 51.4 2.5 *** 50.7 0.2 51.3 -0.2
African American (%) 5.8 0.5 1.6 0.0 22.7 1.6
Asian (%) 10.5 -3.4 *** 0.9 0.1 6.4 -2.1 **
Hispanic (%) 52.4 -9.4 *** 63.0 -5.7 17.4 5.1
Native American (%) 0.9 0.4 * 11.8 -1.9 0.6 0.5
Mixed Race or Other (%) 3.5 0.4 ~ 1.9 0.2 3.1 0.0
Prior Math Test Score (Standardized) -0.026 -0.089 * -0.023 0.027 -0.032 -0.09
Prior Reading Test Score (Standardized) -0.021 -0.049 -0.017 0.042 -0.024 -0.059
Per-pupil Instructional Expenditure ($) 5,859.45 1,178.96 *** 5,505.23 -107.97 7,956.29 40.05 ~
Parents Married (%) 65.3 0.4 55.4 2.2 62.2 -1.0
Speaks Language Other than English (%) 45.2 -4.6 * 33.8 -3.9 20.0 1.2
Household Income ($) 62,380 1,197 46,444 4,833 ~ 70,898 -142
Parent Attended College, no BA (%) 29.1 1.0 33.0 2.9 * 30.2 1.1 ~
Parent Holds BA Degree + (%) 23.7 1.2 19.9 -1.3 30.1 -2.1 ~
p-Value from Test of Joint Significance 0.000 0.000 0.097
School Observations 5,107 734 297 142 851 223
Note. ~ p < .10, * p < .05, ** p < .01, *** p < .001. For states where schools were randomly sampled, estimates are weighted by the inverse of the sampling probability.
11Center for Education Policy Research (CEPR) | cepr.harvard.edu
Table 3. Textbook Market Share for the Top 15 Textbooks by State
Textbook (Sorted by Share in Pooled Sample)
Pooled 6
States
Califor-nia
Louisi-ana
Mary-land
New Jersey
New Mexico
Wash-ington
enVision CC (% share) 15.2 11.4 15.5 16.0 29.7 28.3 8.1
Engage NY/Eureka CC 14.4 8.8 58.7 17.9 1.4 0.0 20.5
Go Math CC 12.6 17.2 11.6 1.6 19.9 3.6 0.8
My Math CC 12.2 17.0 8.5 2.2 6.3 29.2 4.5
enVision 7.7 13.7 0.6 5.6 1.2 0.0 1.8
Math Expressions CC 7.3 9.7 0.5 0.0 2.2 0.0 16.9
Everyday Mathematics CC 4.5 3.6 0.0 0.5 16.6 6.2 1.1
Math in Focus CC 2.8 1.3 0.0 0.0 11.6 1.7 3.8
Everyday Mathematics 2.7 3.5 0.0 3.5 3.2 0.3 1.4
Bridges in Mathematics CC 2.2 1.8 0.0 0.0 0.0 0.0 10
Houghton Mifflin Math 2.2 4.4 0.0 0.0 0.2 0.0 0.0
Stepping Stones CC 1.9 0.3 0.0 1.0 0.0 28.9 2.0
Ready Common Core CC 1.8 0.1 2.3 14.9 0.0 0.0 0.0
Math Connects 1.3 0.0 0.0 2.2 1.2 0.0 6.9
Math Expressions 1.2 0.2 0.0 0.0 0.2 0.3 7.8
Other 10.0 7.0 2.3 34.6 6.3 1.5 14.4
School*Year Observations 12,096 8,766 468 334 920 901 468
Note. Estimates are weighted by the inverse of the sampling probability. Only the top 15 texts are listed. Percent-ages in each column sum to 100% when including the “Other” category.
Given these patterns, we limited the primary analysis sample to schools using one of the top 15 textbooks by market share, which encompassed 90% of school-by-year observations in our sample. In supplementary analyses (see Online Appendix Table 1), we found similar results when expanding the sample beyond these top 15 texts, as well as further restricting the sample to the top five or 10 textbooks that all had substantial shares of the market.
TEACHER SURVEYTo gain insight into teacher use of adopted textbooks, we conducted a teacher survey in a random subset of 50–60 schools using each of the seven most commonly used texts. The survey was administered in the fall of 2017 but asked teachers about their use of textbooks the prior academic year (i.e., the year in which we administered the school survey).13 The survey focused on several domains: frequency of textbook use for different activities (e.g., preparation of lessons, classroom assignments), use of supplementary materials (e.g., those found online, developed by
13 We originally planned on administering the teacher survey in the spring of 2017, to occur during the same school year as the school survey. However, we decided to delay in order to first ensure sufficiently high response rates on the school survey, which provided data for our main analyses. This delay likely is one reason for lower response rates on the teacher survey relative to the school survey. For example, our population of interest were all fourth- and fifth-grade math teachers working in randomly selected schools during the 2016–17 school year; however, some of these teachers no longer were working in the same schools in the fall of 2017–18 school year.

12 Learning by the Book | RESEARCH REPORT
the teacher), access to professional development and coaching, and use of educational software. (See the Appendix for a copy of the questionnaire.)
We stratified schools by textbook, state, and an indicator of whether they were above or below the median percentage of students receiving free or reduced-price lunch within each state. We allowed for sampling with replacement in instances where districts or schools turned down our request to survey teachers, where we were unable to identify the roster of fourth- and fifth-grade teachers in a particular school, or where no teachers in the school responded within a three-month period. When a school needed to be replaced, we picked the next school on the randomly sorted list, using the same textbook, in the same state, and income bracket. Of the 368 schools that were part of our original sample, 264 (72%) participated in data collection. We reached out to an additional 118 schools as part of our replacement strategy. Of the 486 total schools we contacted for the teacher survey, 345 (71%) had at least one teacher complete and were successfully linked to administrative records (see Table 1).14
If we selected a school for participation, we searched the schools’ website or called the school office for contact information on all fourth- and fifth-grade teachers from the 2016–17 school year. We provided a survey link by email and a $30 gift card for respondents. Of the 2,370 eligible teachers from 486 schools invited to participate, 1,195 (50%) completed the survey and were successfully linked to administrative records.
STUDENT ACHIEVEMENT AND DEMOGRAPHIC DATAThe Harvard-based research team worked with student achievement and demographic data for three states—Maryland, New Jersey, and New Mexico—with which we signed data use agreements. In the three remaining states—California, Louisiana, and Washington—we coordinated with researchers who had access to the student-level data through their own agreements with state agencies. In these states, the partner researchers implemented similar statistical specifications to those we were estimating and sent us the parameter estimates, which we then aggregated with the remaining states.15 In California, the state did not record student-level test scores in the spring of 2014, as schools prepared for the new CCSS-aligned assessments to be administered in the spring of 2015. As a result, we used achievement data from the prior school year, 2012–13, as a baseline control for 2014–15. In Louisiana, test scores were not yet available for the 2016–17 school year by the time of our analyses.
14 Thirteen schools declined participation in the teacher survey as part of their response to our original school survey; 48 schools were from districts that declined participation; 20 school principals declined participation upon outreach; 21 schools did not provide sufficient information to identify teachers for recruitment; and 17 schools were no longer eligible to participate given that they switched textbooks from the prior year when we administered the school survey, the school closed from the prior year, or there no longer were eligible fourth- and fifth-grade teachers who also worked in the school the prior year.
15 For the models discussed below, we received annual school-level aggregates (derived from student-level value-added models) from Louisiana and Washington, and these were pooled with school-level aggregates from Maryland, New Jersey, and New Mexico to estimate second-stage models of textbook effects using all five states. The Data Use Agreement for California did not allow for sharing of school-level estimates. Therefore, we estimated separate second-stage (school-level) models using only the California data. Estimates of textbook effects from California were pooled with estimates from the remaining five states using a precision-weighted average of the estimates from each (that is, weighting each set of estimates by the inverse of the variance-covariance matrix of the parameters).

13Center for Education Policy Research (CEPR) | cepr.harvard.edu
EMPIRICAL METHODOLOGYWe estimated school-level differences in achievement growth using the following model for student i in school j and grade g in year t:
Sijgt= β0+β1g f (Sit-1Math)+β2g f (Sit-1
ELA)+β3 Xijgt+θgt+δjt+εijgt (1)
We estimated the model separately in each state. For each academic year, 2014–15 through 2016–17, we modeled students’ current-year math achievement score (S) as a cubic function of prior achievement in math and ELA.16 We interacted these with grade fixed effects, allowing for different relationships between prior and current test scores across grades. In addition, we included grade-by-year fixed effects, θgt, to account for differences in scaling of tests at this level. We controlled for a vector of student characteristics, Xijgt, that includes gender, race/ethnicity (six mutually exclusive indicators for Asian or Pacific Islander, Black, Hispanic, Native American, White, and multiple), an indicator for free or reduced-price lunch receipt, special education (SPED) status, ELL status, and an indicator for students that repeated the current grade (at time t).17 Finally, we included school-by-year fixed effects, δjt, which were our parameters of interest from equation (1). The estimated school-by-year effects, δjt, are commonly referred to as “value-added” estimates because they measure the degree to which students in a given school outperform or underperform other students with similar math and ELA scores and student characteristics (see Angrist et al., 2017). In equation (1), we conditioned on students’ prior achievement scores to measure a student’s achievement growth in the current year. Thus, even if the students used a given text in the prior year, we are measuring the effect of a given textbook on a student’s current year achievement growth.18
We then used the estimated school-by-year effects in a second stage to estimate a vector of textbook effects, mk, controlling for mean school characteristics, Xjt , and characteristics of public-school parents in the school district, Zd, from the 2010 and 2014 American Community Surveys:
δjt = g0 +Skmktextbook_kjt + gXjt + λZd + wjt (2)
We used the CCSS version of the textbook series enVision as the left-out category, since it was one of the few curricula in high use in all states and years. As a result, the parameter estimates, mk, estimate differences in student achievement growth for a given textbook relative to schools using that edition of enVision. When pooling data across years or states, we included state-by-year fixed effects.
16 As noted earlier, we did not have access to prior-year test scores in California in 2014–15. However, because California administers assessments to students in grades 2 through 8, we are able to get twice-lagged scores for both fourth and fifth graders in 2014–15. This approach is consistent with other work using California state data (see Carrell, Kurlaender, Martorell, & Naven, 2018). For all states, if the prior score was missing in math (the primary outcome), we dropped that observation. If the prior score was missing in ELA, we created a flag for missing prior score, imputed the missing score to 0, and included the missing flag in the specification.
17 If any of the student-level characteristics were missing, we imputed the dummy variable to 0 and included a flag for missing.
18 We define an “effective” text as one that raises the amount of growth that the average student achieves in a given year. Thus, even if a student used an effective text in the prior grade and, thus started off the year with higher achievement, we would expect an additional boost to growth in the current year.
14 Learning by the Book | RESEARCH REPORT
Because textbooks typically vary at the district level and not at the school level, we needed to account for the fact that the school-level error term, wjt, is not independent for schools in the same district, and not independent for the same school over time. As a result, we separated the error term into three components: a district component, φd, a school component, χj, and an independent school-by-year error, ξjt:
wjt = φd + χj + ξjt
We estimated equation (2) using a hierarchical (random effects) model to account for the error terms at the district and school levels.19
When estimating the efficacy of individual textbooks using equation (2), we treated mk as a vector of fixed effects. While each should provide an unbiased estimate of the effect of individual textbooks, the variance across these parameter estimates overstates the underlying heterogeneity in textbook effects, since collectively they include sampling error at the student, school, and district levels. As a result, we also specified mk as a set of random effects, with state-by-year fixed effects (in pooled analyses), and state, district, and school random effects nested within each textbook. Because the textbook random effect variance estimate is adjusted for the school-, district-, and state-level errors, we interpret it as an estimate of the “true” underlying variance in textbook efficacy. This specification allows for variation in value-added within textbook across states, districts, and schools, and estimates the component of variation in student achievement gains attributable to textbook effects that are common across states and over time.20
If textbooks vary in price, marketing materials, level of rigor, instructional approach, etc., we might expect some differences in the baseline characteristics of schools using different texts (Bianchini & Kelly, 2003; Polikoff, 2018; Seeley, 2003; Tulley, 1985). In Table 4, we report the baseline characteristics of schools and districts using different textbooks, pooling across all six states. There are statistically significant differences in the observed characteristics of schools using different textbooks. For example, the schools using Stepping Stones (CCSS edition), My Math, enVision (either pre- or post-CCSS), and Engage NY/Eureka tended to be somewhat more disadvantaged; they had higher percentages of students receiving federal-reduced price lunches, had lower expenditures per student, and lower levels of parental education. In contrast, Everyday Mathematics (CCSS edition), Bridges in Mathematics (CCSS edition), and Ready Common Core seemed to be used in somewhat more affluent schools, with lower percentages of students receiving
19 An alternative approach would have been simply to allow for clustering at the state or district level. However, clustering can lead to overly optimistic standard errors when clusters have small numbers of observations (Cameron & Miller, 2015; Pustejovsky & Tipton, 2016). This is apparent in our data. We calculated standard errors for textbook effects two ways: clustering at the district level and specifying hierarchical random effects at the district and school level. In Appendix Figure 1, we plot the ratio of the clustered standard errors to the random effects standard errors for each textbook, against the number of districts (clusters) using each textbook. For textbooks used in more than 15 districts, the standard errors were quite similar from the two methods. However, for the textbooks used in fewer than 15 districts, the standard error estimates differed dramatically depending upon the methods used, with standard errors for two of the textbooks falling by more than half when we clustered at the district level. This is consistent with Cameron & Miller’s findings that standard errors for parameters that are identified off of few clusters are unreliable and tend to overstate the precision of these estimates. Because we only saw the dramatic differences in standard errors for textbooks used by few districts, and saw much greater consistency in the standard errors for textbooks used by more districts, we took this as evidence in favor of the random effects model.
20 Because there are some districts using more than one text, we also explored models that crossed the state, district, and school random effects with the textbook random effects (e.g., non-nested) with similar results.

15Center for Education Policy Research (CEPR) | cepr.harvard.edu
federal subsidized lunches and higher parental education. As a result, we included statistical controls for a variety of school-by-year demographic and test score measures and for district characteristics.21
Although we can control for observed characteristics, it is possible that there are unmeasured determinants of student performance related to textbook adoption. Therefore, in California, where we had a sufficient number of schools that switched curricula between 2014–15 and 2015–16, we also specified models that included school fixed effects. This model implicitly controls for fixed differences between schools using different texts by focusing on changes in student achievement gains associated with new textbook adoptions. Schools in California that switched textbooks look similar on all available observable characteristics to those schools that did not switch (p = 0.857 on joint test of significance; see Online Appendix Table 2), implying that estimates from school switchers may generalize to the larger state population. Unfortunately, we did not have a sufficient number of textbook switches in our sample of schools in the remaining five states to generate precise estimates of textbook fixed effects with school fixed effects included.22
RESULTS
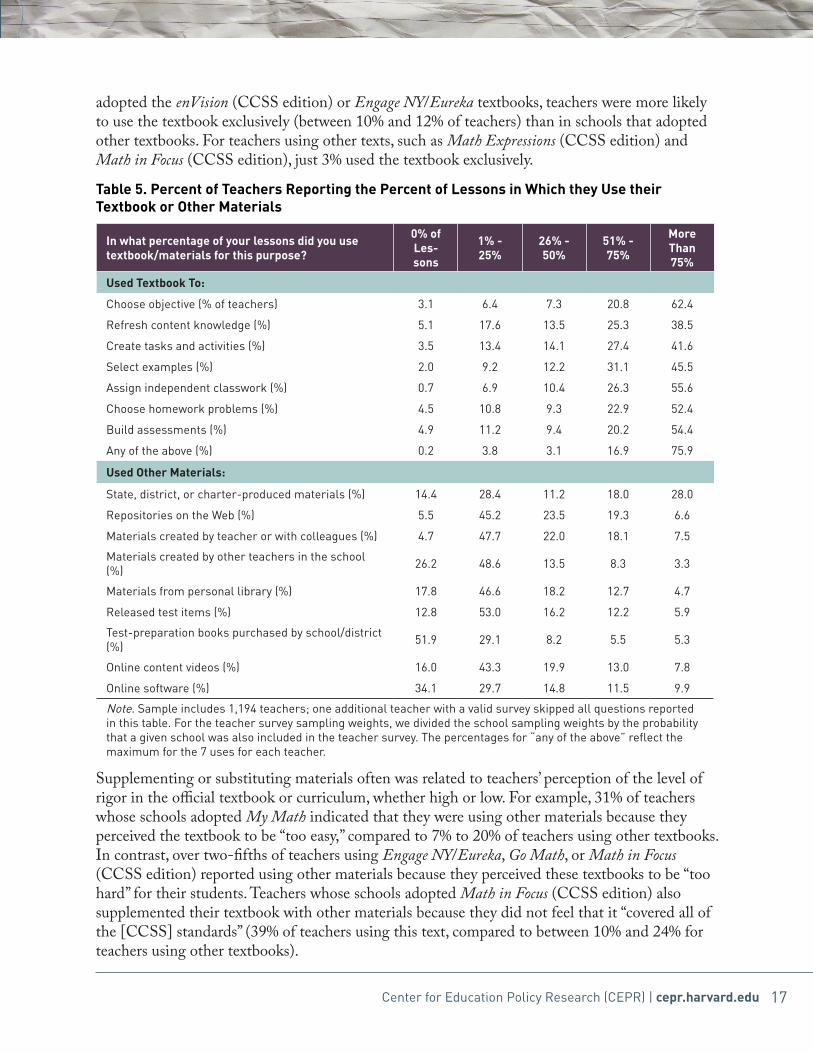
TEACHER-REPORTED USE OF TEXTBOOKSMost teachers reported using the adopted textbook frequently in their classes (see Table 5, which focuses on survey data from top seven textbooks by market share). Seventy-six percent of teachers used their textbook for one of the listed purposes—including choosing the objective, creating tasks and activities, selecting examples, and building assessments—in at least 75% of lessons; 93% of teachers used their textbook for one of these purposes in 50% or more of their lessons. Teachers also reported covering an average of 82% of chapters over the course of the school year.
At the same time, we found that teachers often supplemented or substituted into their lessons content from other sources. For example, 46% of teachers used materials provided to them by the state, district, or school in more than half of their lessons. Moreover, about a quarter of teachers reported using material they had found on the internet or developed themselves in more than half of their lessons (see Table 5). Overall, only 7% of teachers used their textbooks exclusively (see Table 6).
While Table 5 reports teachers’ usage characteristics across all seven texts that were a focus of the teacher survey, Table 6 examines differences by textbook. We found that teachers were likely to use supplemental materials with some textbooks more than others. For example, in schools that
21 The full set of school by year characteristics included percent of students who qualified for free or reduced-price lunch, percent who received special education services, percent identified as ELLs, percent male, percent African American or Black, percent Hispanic or Latino, percent Asian, percent Native American, percent who identified with multiple races or another racial group, average prior year math test score (standardized within grade, state, and year), and average prior year reading/ELA test score (standardized within grade, state, and year). The full set of district characteristics from the census included instructional expenditure per-pupil, median household income, percent of households that spoke a language other than English at home, percent of parents of school-aged children who were married, percent of parents who attended some college or hold an associate’s degree (but no bachelor’s degree), and percent of parents who held at least a bachelor’s degree.
22 Excluding California, 116 schools switched textbooks in the other five states. We exclude from this sample those that switched to/from no primary textbook to a specific textbook, as well as schools where only fourth or fifth graders switched texts.

16
Table 4. Differences in School and District Characteristics Adopting Different Textbooks (Pooled 6 States)
School Characteristics District Characteristics
Textbooks (Sorted by % FRPL) FRPL (%) Special Edu-cation (%) ELL (%)
African American
(%)Hispanic (%)
Prior Math Test Score (Standard-
ized)
Per-pupil Instructional Expenditure
($)
Parent Holds BA Degree or Higher (%)
Stepping Stones CC 74.7 18.9 16.6 5.3 56.8 -0.042 5424.31 25.8
My Math CC 70.7 13.5 23.0 9.2 52.7 -0.136 6186.50 19.6
Engage NY/Eureka CC 65.3 12.8 13.9 27.5 26.8 -0.123 6606.23 19.6
enVision 64.6 15.0 33.3 9.3 51.4 -0.047 6093.33 23.7
Go Math CC 58.7 13.2 20.4 10.3 45.5 -0.036 6509.46 24.0
enVision CC 57.7 14.9 14.5 14.0 35.6 0.002 7199.19 28.9
Math Expressions CC 54.7 13.6 23.5 7.2 38.3 0.022 5990.72 29.3
Houghton Mifflin Math 50.8 11.8 29.4 3.6 46.8 0.172 5478.23 31.9
Math in Focus CC 49.9 17.2 13.7 12.5 31.4 0.018 7240.61 33.0
Math Connects 49.1 14.3 4.6 5.0 17.4 -0.024 6802.08 25.7
Everyday Mathematics 47.6 12.9 25.9 6.2 31.3 0.176 6841.01 35.9
Math Expressions 47.3 13.7 19.5 7.9 20.3 0.006 5981.59 36.9
Ready Common Core CC 44.5 10.6 3.0 33.5 12.2 0.133 8037.06 33.2
Everyday Mathematics CC 44.0 15.5 13.3 8.9 29.2 0.038 7916.23 34.1
Bridges in Mathematics CC 43.4 13.2 14.7 3.1 27.0 0.102 6072.18 34.4
p-value from Test of Joint Significance 0.000 0.000 0.000 0.000 0.000 0.000 0.000 0.000
Observations 10797 10797 10797 10797 10797 10797 10797 10797
Note. Observations refer to school years. Estimates are weighted by the inverse of the sampling probability. Textbooks included are the top 15 listed in Table 3.
17Center for Education Policy Research (CEPR) | cepr.harvard.edu
adopted the enVision (CCSS edition) or Engage NY/Eureka textbooks, teachers were more likely to use the textbook exclusively (between 10% and 12% of teachers) than in schools that adopted other textbooks. For teachers using other texts, such as Math Expressions (CCSS edition) and Math in Focus (CCSS edition), just 3% used the textbook exclusively.
Table 5. Percent of Teachers Reporting the Percent of Lessons in Which they Use their Textbook or Other Materials
In what percentage of your lessons did you use textbook/materials for this purpose?
0% of Les-sons
1% - 25%
26% - 50%
51% - 75%
More Than 75%
Used Textbook To:
Choose objective (% of teachers) 3.1 6.4 7.3 20.8 62.4
Refresh content knowledge (%) 5.1 17.6 13.5 25.3 38.5
Create tasks and activities (%) 3.5 13.4 14.1 27.4 41.6
Select examples (%) 2.0 9.2 12.2 31.1 45.5
Assign independent classwork (%) 0.7 6.9 10.4 26.3 55.6
Choose homework problems (%) 4.5 10.8 9.3 22.9 52.4
Build assessments (%) 4.9 11.2 9.4 20.2 54.4
Any of the above (%) 0.2 3.8 3.1 16.9 75.9
Used Other Materials:
State, district, or charter-produced materials (%) 14.4 28.4 11.2 18.0 28.0
Repositories on the Web (%) 5.5 45.2 23.5 19.3 6.6
Materials created by teacher or with colleagues (%) 4.7 47.7 22.0 18.1 7.5
Materials created by other teachers in the school (%) 26.2 48.6 13.5 8.3 3.3
Materials from personal library (%) 17.8 46.6 18.2 12.7 4.7
Released test items (%) 12.8 53.0 16.2 12.2 5.9
Test-preparation books purchased by school/district (%) 51.9 29.1 8.2 5.5 5.3
Online content videos (%) 16.0 43.3 19.9 13.0 7.8
Online software (%) 34.1 29.7 14.8 11.5 9.9
Note. Sample includes 1,194 teachers; one additional teacher with a valid survey skipped all questions reported in this table. For the teacher survey sampling weights, we divided the school sampling weights by the probability that a given school was also included in the teacher survey. The percentages for “any of the above” reflect the maximum for the 7 uses for each teacher.
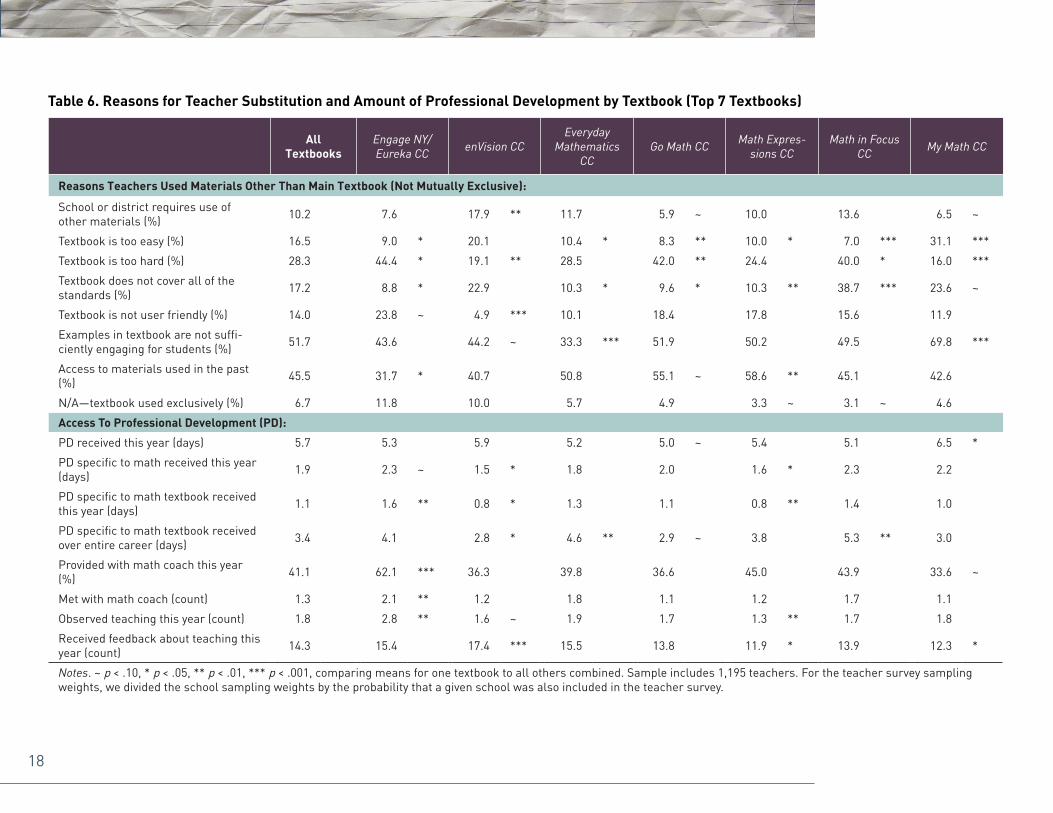
Supplementing or substituting materials often was related to teachers’ perception of the level of rigor in the official textbook or curriculum, whether high or low. For example, 31% of teachers whose schools adopted My Math indicated that they were using other materials because they perceived the textbook to be “too easy,” compared to 7% to 20% of teachers using other textbooks. In contrast, over two-fifths of teachers using Engage NY/Eureka, Go Math, or Math in Focus (CCSS edition) reported using other materials because they perceived these textbooks to be “too hard” for their students. Teachers whose schools adopted Math in Focus (CCSS edition) also supplemented their textbook with other materials because they did not feel that it “covered all of the [CCSS] standards” (39% of teachers using this text, compared to between 10% and 24% for teachers using other textbooks).
18
Table 6. Reasons for Teacher Substitution and Amount of Professional Development by Textbook (Top 7 Textbooks)
AllTextbooks
Engage NY/ Eureka CC enVision CC
Everyday Mathematics
CCGo Math CC Math Expres-
sions CCMath in Focus
CC My Math CC
Reasons Teachers Used Materials Other Than Main Textbook (Not Mutually Exclusive):
School or district requires use of other materials (%) 10.2 7.6 17.9 ** 11.7 5.9 ~ 10.0 13.6 6.5 ~
Textbook is too easy (%) 16.5 9.0 * 20.1 10.4 * 8.3 ** 10.0 * 7.0 *** 31.1 ***
Textbook is too hard (%) 28.3 44.4 * 19.1 ** 28.5 42.0 ** 24.4 40.0 * 16.0 ***
Textbook does not cover all of the standards (%) 17.2 8.8 * 22.9 10.3 * 9.6 * 10.3 ** 38.7 *** 23.6 ~
Textbook is not user friendly (%) 14.0 23.8 ~ 4.9 *** 10.1 18.4 17.8 15.6 11.9
Examples in textbook are not suffi-ciently engaging for students (%) 51.7 43.6 44.2 ~ 33.3 *** 51.9 50.2 49.5 69.8 ***
Access to materials used in the past (%) 45.5 31.7 * 40.7 50.8 55.1 ~ 58.6 ** 45.1 42.6
N/A—textbook used exclusively (%) 6.7 11.8 10.0 5.7 4.9 3.3 ~ 3.1 ~ 4.6
Access To Professional Development (PD):
PD received this year (days) 5.7 5.3 5.9 5.2 5.0 ~ 5.4 5.1 6.5 *
PD specific to math received this year (days) 1.9 2.3 ~ 1.5 * 1.8 2.0 1.6 * 2.3 2.2
PD specific to math textbook received this year (days) 1.1 1.6 ** 0.8 * 1.3 1.1 0.8 ** 1.4 1.0
PD specific to math textbook received over entire career (days) 3.4 4.1 2.8 * 4.6 ** 2.9 ~ 3.8 5.3 ** 3.0
Provided with math coach this year (%) 41.1 62.1 *** 36.3 39.8 36.6 45.0 43.9 33.6 ~
Met with math coach (count) 1.3 2.1 ** 1.2 1.8 1.1 1.2 1.7 1.1
Observed teaching this year (count) 1.8 2.8 ** 1.6 ~ 1.9 1.7 1.3 ** 1.7 1.8
Received feedback about teaching this year (count) 14.3 15.4 17.4 *** 15.5 13.8 11.9 * 13.9 12.3 *
Notes. ~ p < .10, * p < .05, ** p < .01, *** p < .001, comparing means for one textbook to all others combined. Sample includes 1,195 teachers. For the teacher survey sampling weights, we divided the school sampling weights by the probability that a given school was also included in the teacher survey.
19Center for Education Policy Research (CEPR) | cepr.harvard.edu
Access to professional development—particularly math-specific programming and those aligned to textbook implementation—also differed by textbook. Teachers using Engage NY/Eureka reported receiving the most professional development tailored to the curriculum, but it was still modest: 1.6 days, on average, compared to 0.8 to 1.4 days, on average, for teachers using other textbooks. Moreover, 62% of teachers using Engage NY/Eureka reported working with a math coach, compared to 38% of teachers using other textbooks.
Differences in use and support could influence a given textbook’s efficacy. However, we did not attempt to “control for” such differences given that these factors almost certainly are endogenous. That is, they likely are a result of a given textbook’s strengths and flaws. Instead, we report the average achievement gains of the schools using a given textbook as adopted. We do not report—because we cannot validly estimate—the magnitude of gain that a given school or district could have achieved with a given text if implemented in the ideal manner. The estimates presented below also are those most relevant to our policy question of interest: What is the effect of purchasing a higher-quality textbook? The purchase and high-quality implementation of new textbook is a different, much more complicated, and much more expensive intervention to assess. Nevertheless, we return to this topic in our conclusion.
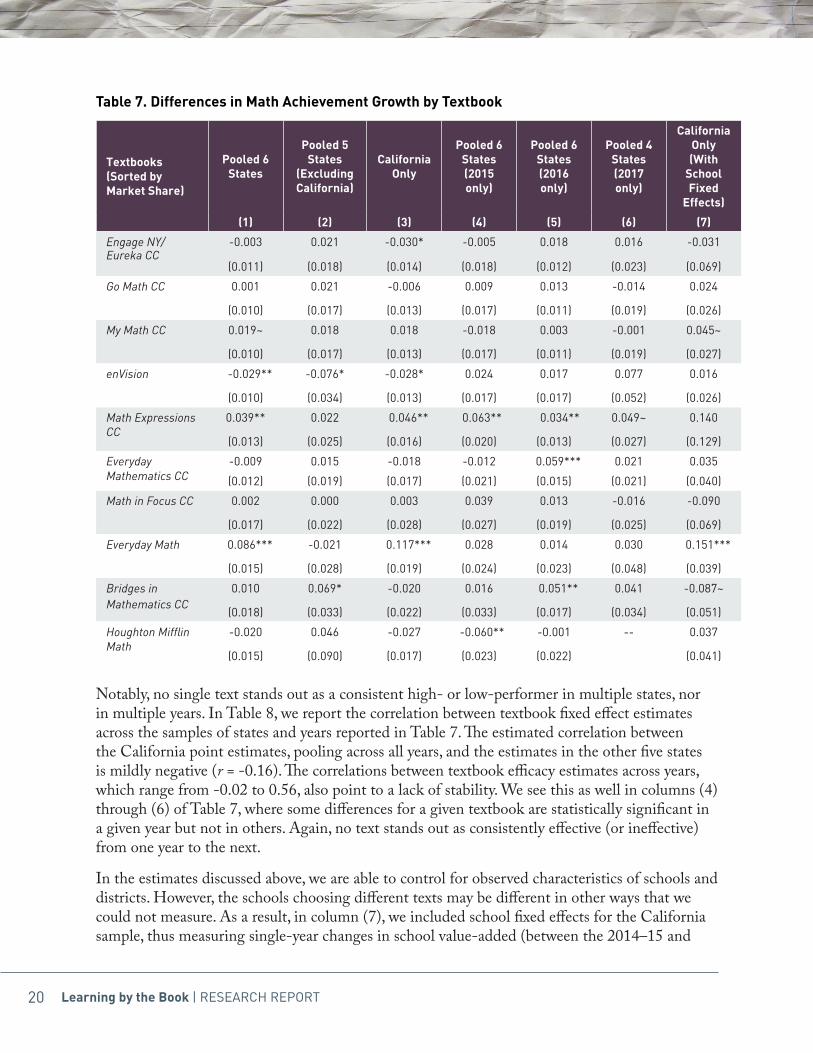
DIFFERENCES IN AVERAGE STUDENT ACHIEVEMENT GAINS BETWEEN TEXTBOOKS In Table 7, we report estimates from Equation (2) of the average student achievement gains for each of the top 15 textbooks from Table 3. The left-out category is enVision (CCSS edition), meaning that efficacy estimates for the other 14 texts are estimated relative to that text. Estimates are reported in student-level SD of math achievement in a given state, grade, and school year.
In the pooled sample across all six states in column (1), three texts have student achievement gains statistically significantly different from enVision (CCSS edition): two with larger gains (Everyday Mathematics pre-CCSS and Math Expressions CCSS edition), and one with smaller gains (enVision pre-CCSS). However, the results in column (1) are driven by the sample of schools in California. When we exclude California in column (2), we see two individual coefficients that are statistically different from zero (enVision pre-CCSS and Bridges in Mathematics (CCSS edition). When we test the stronger hypothesis that all the differences between textbooks are equal to zero (the p-value reported at the bottom of the table), we cannot reject it (p-value = 0.323.) In other words, when comparing such a large number of textbooks, it is possible that one or two are significantly different from each other by chance. However, when looking across the full set of textbooks, there were so few such instances that we could not reject the hypothesis of no difference between textbooks.
In column (3), we report estimates for the California sample by itself. Here, Math Expressions (CCSS edition) and Everyday Mathematics (pre-CCSS edition) are associated with better math performance relative to enVision (CCSS edition), while those schools using Eureka/Engage NY or a pre-CCSS edition of enVision have lower math performance after adjusting for student and district baseline characteristics. Even for textbooks where we do see statistically significant differences, estimates generally are far smaller than those reported in the Agodini et al. (2010) or Jaciw et al. (2016) experiments.
20 Learning by the Book | RESEARCH REPORT
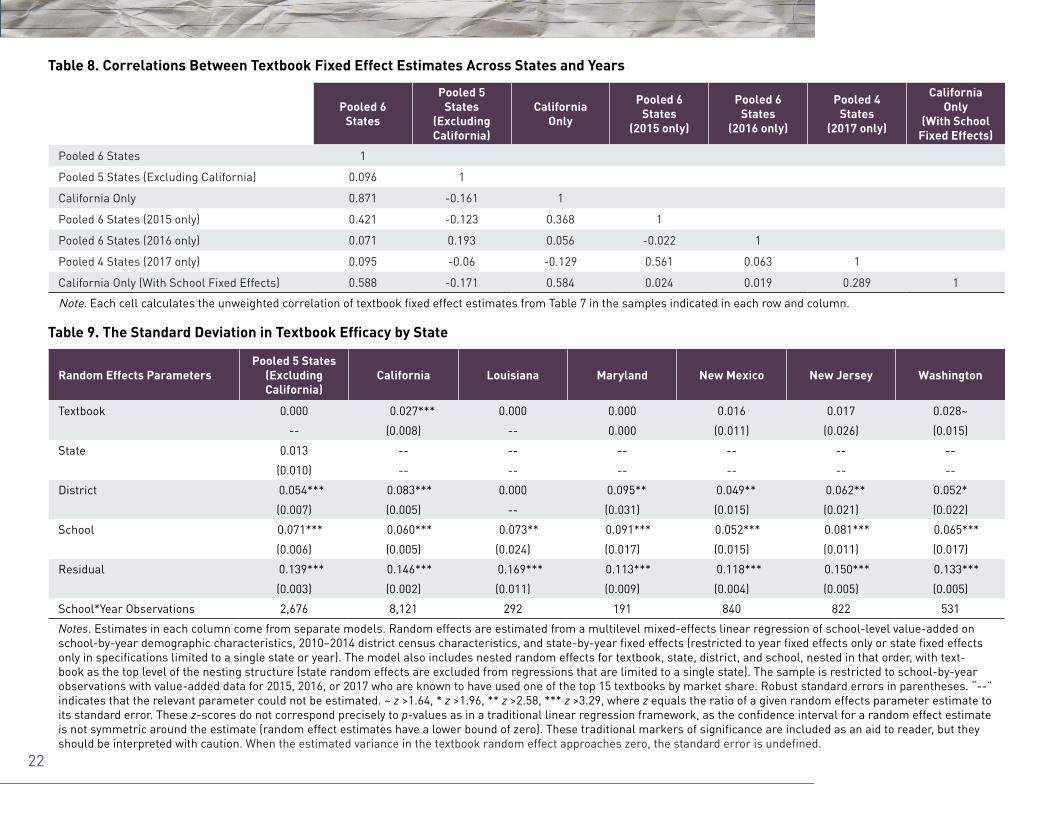
Notably, no single text stands out as a consistent high- or low-performer in multiple states, nor in multiple years. In Table 8, we report the correlation between textbook fixed effect estimates across the samples of states and years reported in Table 7. The estimated correlation between the California point estimates, pooling across all years, and the estimates in the other five states is mildly negative (r = -0.16). The correlations between textbook efficacy estimates across years, which range from -0.02 to 0.56, also point to a lack of stability. We see this as well in columns (4) through (6) of Table 7, where some differences for a given textbook are statistically significant in a given year but not in others. Again, no text stands out as consistently effective (or ineffective) from one year to the next.
In the estimates discussed above, we are able to control for observed characteristics of schools and districts. However, the schools choosing different texts may be different in other ways that we could not measure. As a result, in column (7), we included school fixed effects for the California sample, thus measuring single-year changes in school value-added (between the 2014–15 and
Table 7. Differences in Math Achievement Growth by Textbook
Textbooks (Sorted by Market Share)
Pooled 6 States
Pooled 5 States
(Excluding California)
California Only
Pooled 6 States (2015 only)
Pooled 6 States (2016 only)
Pooled 4 States (2017 only)
California Only (With
School Fixed
Effects)
(1) (2) (3) (4) (5) (6) (7)
Engage NY/Eureka CC
-0.003 0.021 -0.030* -0.005 0.018 0.016 -0.031
(0.011) (0.018) (0.014) (0.018) (0.012) (0.023) (0.069)
Go Math CC 0.001 0.021 -0.006 0.009 0.013 -0.014 0.024
(0.010) (0.017) (0.013) (0.017) (0.011) (0.019) (0.026)
My Math CC 0.019~ 0.018 0.018 -0.018 0.003 -0.001 0.045~
(0.010) (0.017) (0.013) (0.017) (0.011) (0.019) (0.027)
enVision -0.029** -0.076* -0.028* 0.024 0.017 0.077 0.016
(0.010) (0.034) (0.013) (0.017) (0.017) (0.052) (0.026)
Math Expressions CC
0.039** 0.022 0.046** 0.063** 0.034** 0.049~ 0.140
(0.013) (0.025) (0.016) (0.020) (0.013) (0.027) (0.129)
Everyday Mathematics CC
-0.009 0.015 -0.018 -0.012 0.059*** 0.021 0.035
(0.012) (0.019) (0.017) (0.021) (0.015) (0.021) (0.040)
Math in Focus CC 0.002 0.000 0.003 0.039 0.013 -0.016 -0.090
(0.017) (0.022) (0.028) (0.027) (0.019) (0.025) (0.069)
Everyday Math 0.086*** -0.021 0.117*** 0.028 0.014 0.030 0.151***
(0.015) (0.028) (0.019) (0.024) (0.023) (0.048) (0.039)
Bridges in Mathematics CC
0.010 0.069* -0.020 0.016 0.051** 0.041 -0.087~
(0.018) (0.033) (0.022) (0.033) (0.017) (0.034) (0.051)
Houghton Mifflin Math
-0.020 0.046 -0.027 -0.060** -0.001 -- 0.037
(0.015) (0.090) (0.017) (0.023) (0.022) (0.041)

21Center for Education Policy Research (CEPR) | cepr.harvard.edu
2015–16 academic years) when schools switched from one textbook to another. The advantage of these estimates is that they implicitly control for all unmeasured differences between schools that are fixed over time, measured or unmeasured. The disadvantage is that they focus on changes in student achievement during the first year following adoption, and could be misleading if the effect of a given text grows over time as teachers, coaches, and administrators become accustomed to it. In comparing estimates with and without school fixed effects, the primary difference is that the positive estimate for Everyday Mathematics (pre-CCSS edition) is larger. The correlation between the estimates in California from models that include or exclude school fixed effects is 0.58. This correlation would increase if adjusted for measurement error in the textbook effect point estimates. Because many districts in California were switching out of the pre-CCSS edition of Everyday Mathematics, this may simply reflect the fact that achievement fell in those districts
Textbooks (Sorted by Market Share)
Pooled 6 States
Pooled 5 States
(Excluding California)
California Only
Pooled 6 States (2015 only)
Pooled 6 States (2016 only)
Pooled 4 States (2017 only)
California Only (With
School Fixed
Effects)
(1) (2) (3) (4) (5) (6) (7)
Stepping Stones CC
0.010 -0.019 0.071 -0.024 0.037 -0.054* --
(0.031) (0.036) (0.061) (0.060) (0.034) (0.026)
Ready Common Core CC
-0.020 -0.015 -0.060 -0.039 0.015 -0.008 0.042
(0.039) (0.047) (0.075) (0.067) (0.051) (0.041) (0.127)
Math Connects 0.015 0.017 -- 0.062 -0.003 0.046 --
(0.028) (0.029) (0.048) (0.035) (0.036)
Math Expressions -0.016 -0.014 -0.005 0.025 -0.003 0.000 -0.076
(0.034) (0.039) (0.082) (0.052) (0.043) (0.040) (0.127)
p-value from Test of Joint Significance
0.000 0.323 0.000 0.000 0.000 0.223 0.000
SD of Textbook Fixed Effects
0.029 0.035 0.048 0.036 0.02 0.035 0.079
School*Year Observations
10,797 2,676 8,121 4,854 5,100 843 8,121
Notes. ~ p < .10, * p < .05, ** p < .01, *** p < .001. Estimates in each column come from separate models. In columns (1) to (6), we report textbook fixed effects from a multilevel mixed-effects linear regression of school value-added. We report coefficients for a set of binary indicators for each textbook. We also include school-by-year demographic char-acteristics, 2010–2014 district census characteristics, and state-by-year fixed effects (restricted to year fixed effects only or state fixed effects only in specifications limited to a single state or year). The omitted textbook category is enVi-sion CC. The model also includes nested random effects for schools nested within districts. In column (7), we estimate textbook fixed effects with an OLS regression of school value-added on the same set of binary indicators for whether a school used a given textbook, school-by-year demographic characteristics, school fixed effects, and year fixed effects. Standard errors in column (7) are clustered at the district level. The sample is restricted to school-by-year observa-tions with value-added data for 2015, 2016, or 2017 who are known to have used one of the top 15 textbooks by market share. The 2017-specific estimates come from Maryland, New Jersey, New Mexico, and Washington, and exclude Lou-isiana (which did not have value-added data in that year) and California (which did not have textbook data in that year). Robust standard errors in parentheses.
Table 7. Differences in Math Achievement Growth By Textbook (continued)
22
Table 8. Correlations Between Textbook Fixed Effect Estimates Across States and Years
Pooled 6 States
Pooled 5 States
(Excluding California)
California Only
Pooled 6 States
(2015 only)
Pooled 6 States
(2016 only)
Pooled 4 States
(2017 only)
California Only
(With School Fixed Effects)
Pooled 6 States 1
Pooled 5 States (Excluding California) 0.096 1
California Only 0.871 -0.161 1
Pooled 6 States (2015 only) 0.421 -0.123 0.368 1
Pooled 6 States (2016 only) 0.071 0.193 0.056 -0.022 1
Pooled 4 States (2017 only) 0.095 -0.06 -0.129 0.561 0.063 1
California Only (With School Fixed Effects) 0.588 -0.171 0.584 0.024 0.019 0.289 1
Note. Each cell calculates the unweighted correlation of textbook fixed effect estimates from Table 7 in the samples indicated in each row and column.
Table 9. The Standard Deviation in Textbook Efficacy by State
Random Effects ParametersPooled 5 States
(Excluding California)
California Louisiana Maryland New Mexico New Jersey Washington
Textbook 0.000 0.027*** 0.000 0.000 0.016 0.017 0.028~
-- (0.008) -- 0.000 (0.011) (0.026) (0.015)
State 0.013 -- -- -- -- -- --
(0.010) -- -- -- -- -- --
District 0.054*** 0.083*** 0.000 0.095** 0.049** 0.062** 0.052*
(0.007) (0.005) -- (0.031) (0.015) (0.021) (0.022)
School 0.071*** 0.060*** 0.073** 0.091*** 0.052*** 0.081*** 0.065***
(0.006) (0.005) (0.024) (0.017) (0.015) (0.011) (0.017)
Residual 0.139*** 0.146*** 0.169*** 0.113*** 0.118*** 0.150*** 0.133***
(0.003) (0.002) (0.011) (0.009) (0.004) (0.005) (0.005)
School*Year Observations 2,676 8,121 292 191 840 822 531
Notes. Estimates in each column come from separate models. Random effects are estimated from a multilevel mixed-effects linear regression of school-level value-added on school-by-year demographic characteristics, 2010–2014 district census characteristics, and state-by-year fixed effects (restricted to year fixed effects only or state fixed effects only in specifications limited to a single state or year). The model also includes nested random effects for textbook, state, district, and school, nested in that order, with text-book as the top level of the nesting structure (state random effects are excluded from regressions that are limited to a single state). The sample is restricted to school-by-year observations with value-added data for 2015, 2016, or 2017 who are known to have used one of the top 15 textbooks by market share. Robust standard errors in parentheses. “--” indicates that the relevant parameter could not be estimated. ~ z >1.64, * z >1.96, ** z >2.58, *** z >3.29, where z equals the ratio of a given random effects parameter estimate to its standard error. These z-scores do not correspond precisely to p-values as in a traditional linear regression framework, as the confidence interval for a random effect estimate is not symmetric around the estimate (random effect estimates have a lower bound of zero). These traditional markers of significance are included as an aid to reader, but they should be interpreted with caution. When the estimated variance in the textbook random effect approaches zero, the standard error is undefined.
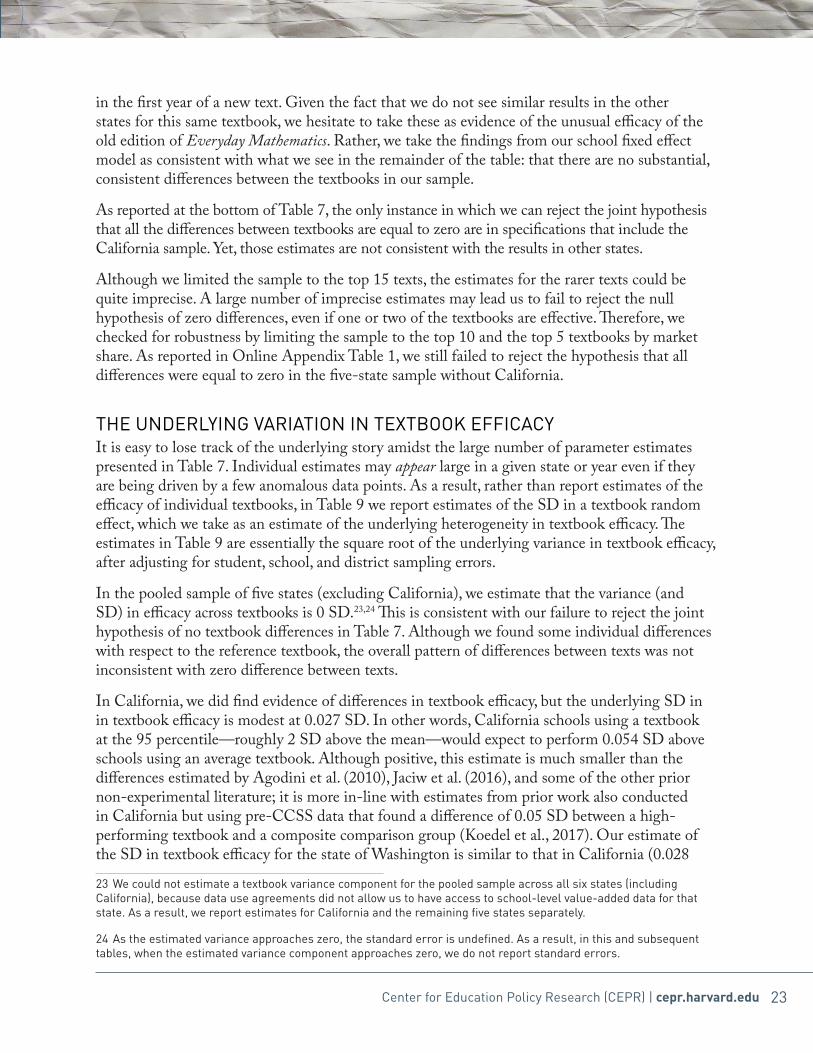
23Center for Education Policy Research (CEPR) | cepr.harvard.edu
in the first year of a new text. Given the fact that we do not see similar results in the other states for this same textbook, we hesitate to take these as evidence of the unusual efficacy of the old edition of Everyday Mathematics. Rather, we take the findings from our school fixed effect model as consistent with what we see in the remainder of the table: that there are no substantial, consistent differences between the textbooks in our sample.
As reported at the bottom of Table 7, the only instance in which we can reject the joint hypothesis that all the differences between textbooks are equal to zero are in specifications that include the California sample. Yet, those estimates are not consistent with the results in other states.
Although we limited the sample to the top 15 texts, the estimates for the rarer texts could be quite imprecise. A large number of imprecise estimates may lead us to fail to reject the null hypothesis of zero differences, even if one or two of the textbooks are effective. Therefore, we checked for robustness by limiting the sample to the top 10 and the top 5 textbooks by market share. As reported in Online Appendix Table 1, we still failed to reject the hypothesis that all differences were equal to zero in the five-state sample without California.
THE UNDERLYING VARIATION IN TEXTBOOK EFFICACYIt is easy to lose track of the underlying story amidst the large number of parameter estimates presented in Table 7. Individual estimates may appear large in a given state or year even if they are being driven by a few anomalous data points. As a result, rather than report estimates of the efficacy of individual textbooks, in Table 9 we report estimates of the SD in a textbook random effect, which we take as an estimate of the underlying heterogeneity in textbook efficacy. The estimates in Table 9 are essentially the square root of the underlying variance in textbook efficacy, after adjusting for student, school, and district sampling errors.
In the pooled sample of five states (excluding California), we estimate that the variance (and SD) in efficacy across textbooks is 0 SD.23,24 This is consistent with our failure to reject the joint hypothesis of no textbook differences in Table 7. Although we found some individual differences with respect to the reference textbook, the overall pattern of differences between texts was not inconsistent with zero difference between texts.
In California, we did find evidence of differences in textbook efficacy, but the underlying SD in in textbook efficacy is modest at 0.027 SD. In other words, California schools using a textbook at the 95 percentile—roughly 2 SD above the mean—would expect to perform 0.054 SD above schools using an average textbook. Although positive, this estimate is much smaller than the differences estimated by Agodini et al. (2010), Jaciw et al. (2016), and some of the other prior non-experimental literature; it is more in-line with estimates from prior work also conducted in California but using pre-CCSS data that found a difference of 0.05 SD between a high-performing textbook and a composite comparison group (Koedel et al., 2017). Our estimate of the SD in textbook efficacy for the state of Washington is similar to that in California (0.028
23 We could not estimate a textbook variance component for the pooled sample across all six states (including California), because data use agreements did not allow us to have access to school-level value-added data for that state. As a result, we report estimates for California and the remaining five states separately.
24 As the estimated variance approaches zero, the standard error is undefined. As a result, in this and subsequent tables, when the estimated variance component approaches zero, we do not report standard errors.
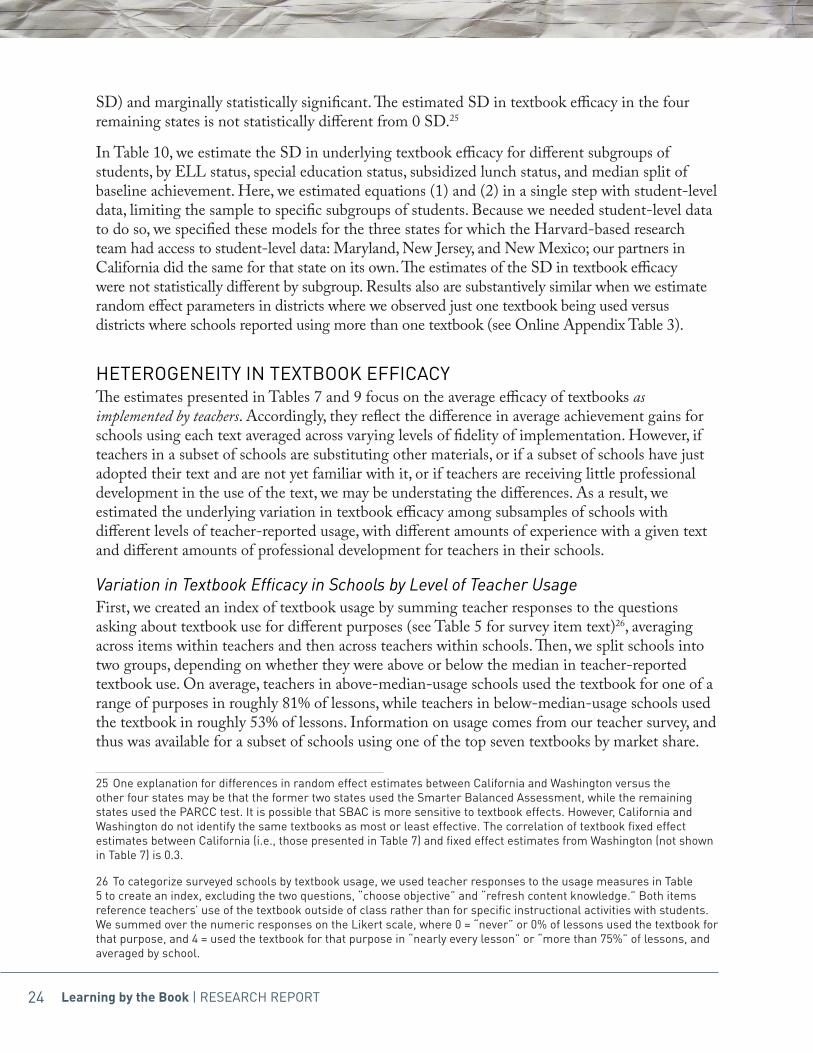
24 Learning by the Book | RESEARCH REPORT
SD) and marginally statistically significant. The estimated SD in textbook efficacy in the four remaining states is not statistically different from 0 SD.25
In Table 10, we estimate the SD in underlying textbook efficacy for different subgroups of students, by ELL status, special education status, subsidized lunch status, and median split of baseline achievement. Here, we estimated equations (1) and (2) in a single step with student-level data, limiting the sample to specific subgroups of students. Because we needed student-level data to do so, we specified these models for the three states for which the Harvard-based research team had access to student-level data: Maryland, New Jersey, and New Mexico; our partners in California did the same for that state on its own. The estimates of the SD in textbook efficacy were not statistically different by subgroup. Results also are substantively similar when we estimate random effect parameters in districts where we observed just one textbook being used versus districts where schools reported using more than one textbook (see Online Appendix Table 3).
HETEROGENEITY IN TEXTBOOK EFFICACYThe estimates presented in Tables 7 and 9 focus on the average efficacy of textbooks as implemented by teachers. Accordingly, they reflect the difference in average achievement gains for schools using each text averaged across varying levels of fidelity of implementation. However, if teachers in a subset of schools are substituting other materials, or if a subset of schools have just adopted their text and are not yet familiar with it, or if teachers are receiving little professional development in the use of the text, we may be understating the differences. As a result, we estimated the underlying variation in textbook efficacy among subsamples of schools with different levels of teacher-reported usage, with different amounts of experience with a given text and different amounts of professional development for teachers in their schools.
Variation in Textbook Efficacy in Schools by Level of Teacher UsageFirst, we created an index of textbook usage by summing teacher responses to the questions asking about textbook use for different purposes (see Table 5 for survey item text)26, averaging across items within teachers and then across teachers within schools. Then, we split schools into two groups, depending on whether they were above or below the median in teacher-reported textbook use. On average, teachers in above-median-usage schools used the textbook for one of a range of purposes in roughly 81% of lessons, while teachers in below-median-usage schools used the textbook in roughly 53% of lessons. Information on usage comes from our teacher survey, and thus was available for a subset of schools using one of the top seven textbooks by market share.
25 One explanation for differences in random effect estimates between California and Washington versus the other four states may be that the former two states used the Smarter Balanced Assessment, while the remaining states used the PARCC test. It is possible that SBAC is more sensitive to textbook effects. However, California and Washington do not identify the same textbooks as most or least effective. The correlation of textbook fixed effect estimates between California (i.e., those presented in Table 7) and fixed effect estimates from Washington (not shown in Table 7) is 0.3.
26 To categorize surveyed schools by textbook usage, we used teacher responses to the usage measures in Table 5 to create an index, excluding the two questions, “choose objective” and “refresh content knowledge.” Both items reference teachers’ use of the textbook outside of class rather than for specific instructional activities with students. We summed over the numeric responses on the Likert scale, where 0 = “never” or 0% of lessons used the textbook for that purpose, and 4 = used the textbook for that purpose in “nearly every lesson” or “more than 75%” of lessons, and averaged by school.
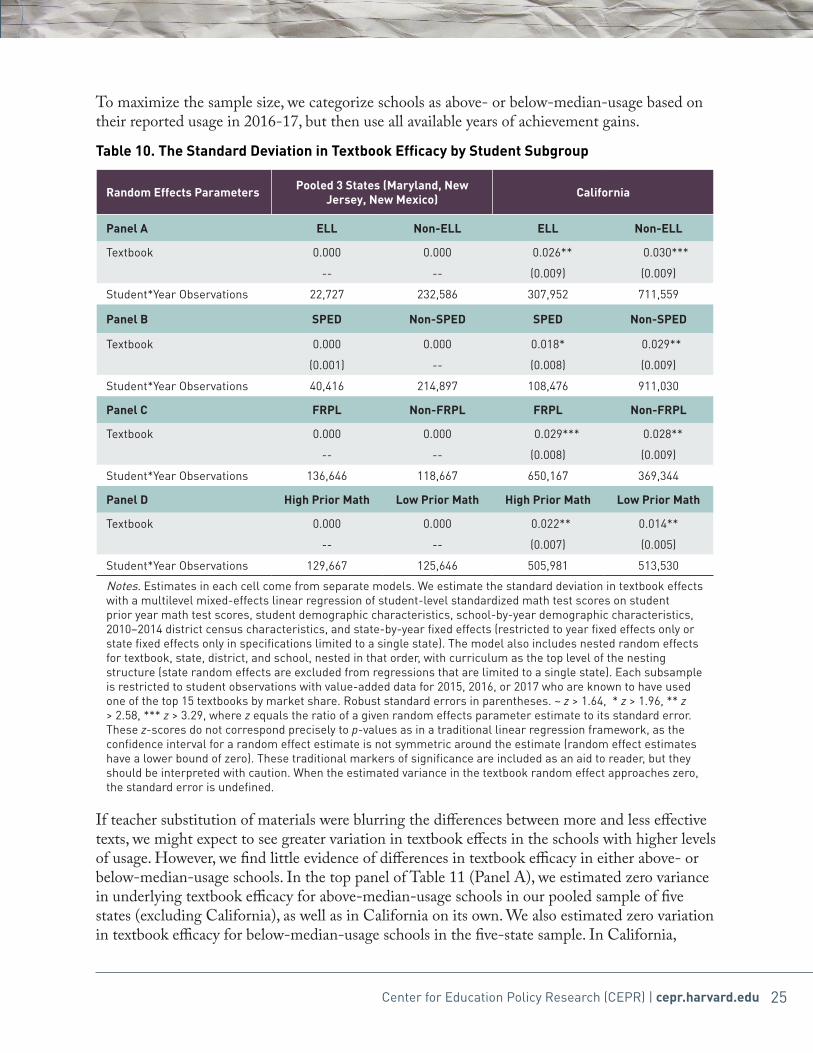
25Center for Education Policy Research (CEPR) | cepr.harvard.edu
To maximize the sample size, we categorize schools as above- or below-median-usage based on their reported usage in 2016-17, but then use all available years of achievement gains.
Table 10. The Standard Deviation in Textbook Efficacy by Student Subgroup
Random Effects Parameters Pooled 3 States (Maryland, New Jersey, New Mexico) California
Panel A ELL Non-ELL ELL Non-ELL
Textbook 0.000 0.000 0.026** 0.030***
-- -- (0.009) (0.009)
Student*Year Observations 22,727 232,586 307,952 711,559
Panel B SPED Non-SPED SPED Non-SPED
Textbook 0.000 0.000 0.018* 0.029**
(0.001) -- (0.008) (0.009)
Student*Year Observations 40,416 214,897 108,476 911,030
Panel C FRPL Non-FRPL FRPL Non-FRPL
Textbook 0.000 0.000 0.029*** 0.028**
-- -- (0.008) (0.009)
Student*Year Observations 136,646 118,667 650,167 369,344
Panel D High Prior Math Low Prior Math High Prior Math Low Prior Math
Textbook 0.000 0.000 0.022** 0.014**
-- -- (0.007) (0.005)
Student*Year Observations 129,667 125,646 505,981 513,530
Notes. Estimates in each cell come from separate models. We estimate the standard deviation in textbook effects with a multilevel mixed-effects linear regression of student-level standardized math test scores on student prior year math test scores, student demographic characteristics, school-by-year demographic characteristics, 2010–2014 district census characteristics, and state-by-year fixed effects (restricted to year fixed effects only or state fixed effects only in specifications limited to a single state). The model also includes nested random effects for textbook, state, district, and school, nested in that order, with curriculum as the top level of the nesting structure (state random effects are excluded from regressions that are limited to a single state). Each subsample is restricted to student observations with value-added data for 2015, 2016, or 2017 who are known to have used one of the top 15 textbooks by market share. Robust standard errors in parentheses. ~ z > 1.64, * z > 1.96, ** z > 2.58, *** z > 3.29, where z equals the ratio of a given random effects parameter estimate to its standard error. These z-scores do not correspond precisely to p-values as in a traditional linear regression framework, as the confidence interval for a random effect estimate is not symmetric around the estimate (random effect estimates have a lower bound of zero). These traditional markers of significance are included as an aid to reader, but they should be interpreted with caution. When the estimated variance in the textbook random effect approaches zero, the standard error is undefined.
If teacher substitution of materials were blurring the differences between more and less effective texts, we might expect to see greater variation in textbook effects in the schools with higher levels of usage. However, we find little evidence of differences in textbook efficacy in either above- or below-median-usage schools. In the top panel of Table 11 (Panel A), we estimated zero variance in underlying textbook efficacy for above-median-usage schools in our pooled sample of five states (excluding California), as well as in California on its own. We also estimated zero variation in textbook efficacy for below-median-usage schools in the five-state sample. In California,

26 Learning by the Book | RESEARCH REPORT
the estimate for below-median-usage schools in California is 0.037 SD (but not statistically distinguishable from zero).
Variation in Textbook Efficacy by Years Since AdoptionIt could be that the variation in textbook efficacy is muted during the first year following adoption, as teachers incorporate the new material in their lessons. Schools may have to use a given text for more than one year before the efficacy differences emerge. Therefore, in the second panel of Table 11 (Panel B), we broke schools into two subgroups based on whether the school was in its first year of usage or not. Here, we could leverage our full school-survey sample, and not be limited to the schools with teacher surveys. In the five-state sample (excluding California), there was no difference in the underlying variation in textbook efficacy, whether schools were in their first year of use or in their second or higher year of use. In California, however, we do see evidence that the SD in textbook efficacy is larger in the schools using a text for two or more years (0.035 SD, compared to 0 SD for those schools using a textbook for one year). In other words, the non-zero estimate of textbook efficacy in California is coming from the schools that had been using the text for more than one year.
Variation in Textbook Efficacy by Days of Textbook-Aligned Professional DevelopmentTo get the most out of high-quality curriculum materials, districts or schools may have to provide more training and support for teachers (for a review of this large body of research, see O’Donnell, 2008). Therefore, in the third panel of Table 11 (Panel C), we disaggregated results for schools where teachers reported that they received higher than median levels of professional development aligned to their textbook versus schools where teachers reported lower-than-median levels of support.27 The median amount of textbook-aligned professional development reported by teachers was three days over the course of teachers’ careers. Thus, in the above-median-support schools, the median number of days of textbook-aligned professional development was 6; in the below-median-support schools, it was 1.5 days. Despite their differing levels of support, we found no difference in textbook efficacy within either of these two sets of schools, either in our pooled sample of five states (excluding California) or in California on its own.
Textbook Efficacy among Pre- and Post-CCSS TextsWith the advent of the CCSS, publishers had a single set of standards around which to write their texts. Of course, texts may still vary in quality and usability. However, we would have expected more uniformity and less variation in the standards covered by the CCSS editions than in pre-CCSS editions.28 Before the CCSS, when states each had their own standards, publishers had an incentive to broaden their coverage to contain nearly every states’ standards in a given grade. Every textbook was “a mile wide and an inch deep” to accommodate multiple state standards (to paraphrase Schmidt et al., 2001; Schmidt, McKnight, & Raizen, 1997), but on any given standard some textbooks may have gone deeper than others. One of the goals of the CCSS was to allow textbook publishers to focus on a
27 In our teacher survey, we asked about the number of days of textbook-aligned professional development in the most recent year of our textbook data (2016–17), as well as over the course of teachers’ entire careers; for this analysis, we focus on the latter item, as support provided in prior years should impact teachers’ implementation of a textbook in the current year.
28 It was beyond the scope of this paper to assess the content of different texts, which requires a strict set of procedures (see Polikoff, 2015).
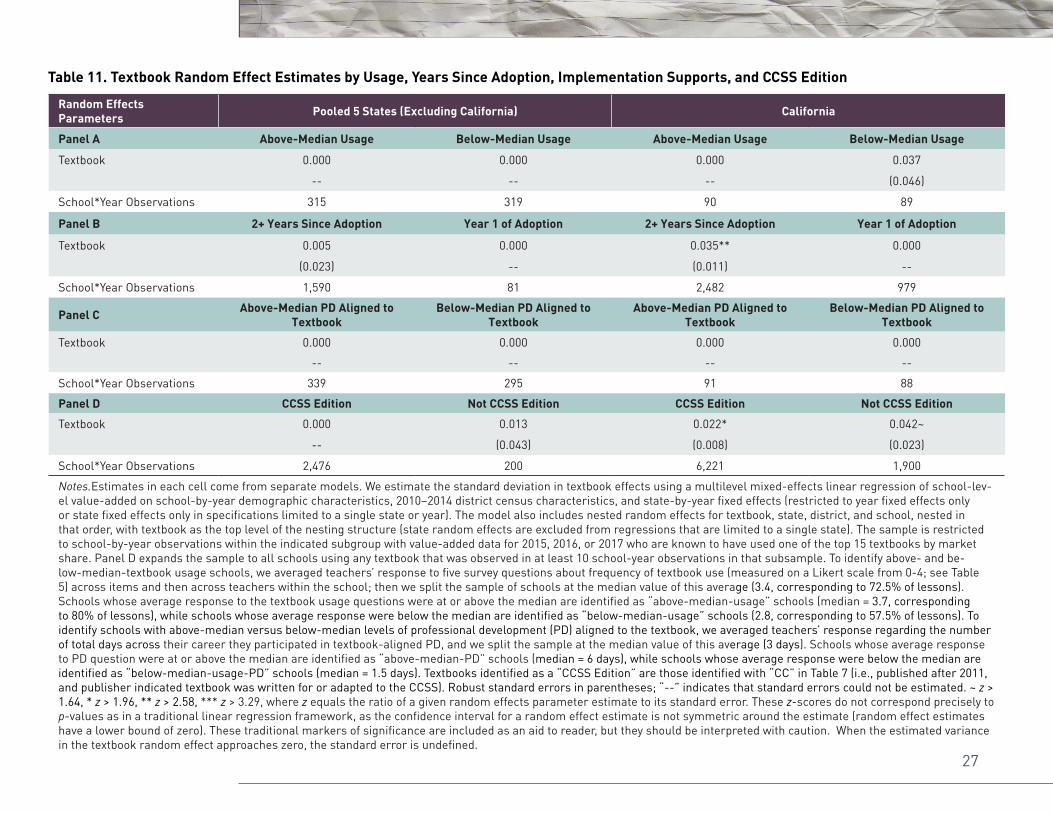
27
Table 11. Textbook Random Effect Estimates by Usage, Years Since Adoption, Implementation Supports, and CCSS Edition
Random Effects Parameters Pooled 5 States (Excluding California) California
Panel A Above-Median Usage Below-Median Usage Above-Median Usage Below-Median Usage
Textbook 0.000 0.000 0.000 0.037
-- -- -- (0.046)
School*Year Observations 315 319 90 89
Panel B 2+ Years Since Adoption Year 1 of Adoption 2+ Years Since Adoption Year 1 of Adoption
Textbook 0.005 0.000 0.035** 0.000
(0.023) -- (0.011) --
School*Year Observations 1,590 81 2,482 979
Panel C Above-Median PD Aligned to Textbook
Below-Median PD Aligned to Textbook
Above-Median PD Aligned to Textbook
Below-Median PD Aligned to Textbook
Textbook 0.000 0.000 0.000 0.000
-- -- -- --
School*Year Observations 339 295 91 88
Panel D CCSS Edition Not CCSS Edition CCSS Edition Not CCSS Edition
Textbook 0.000 0.013 0.022* 0.042~
-- (0.043) (0.008) (0.023)
School*Year Observations 2,476 200 6,221 1,900
Notes.Estimates in each cell come from separate models. We estimate the standard deviation in textbook effects using a multilevel mixed-effects linear regression of school-lev-el value-added on school-by-year demographic characteristics, 2010–2014 district census characteristics, and state-by-year fixed effects (restricted to year fixed effects only or state fixed effects only in specifications limited to a single state or year). The model also includes nested random effects for textbook, state, district, and school, nested in that order, with textbook as the top level of the nesting structure (state random effects are excluded from regressions that are limited to a single state). The sample is restricted to school-by-year observations within the indicated subgroup with value-added data for 2015, 2016, or 2017 who are known to have used one of the top 15 textbooks by market share. Panel D expands the sample to all schools using any textbook that was observed in at least 10 school-year observations in that subsample. To identify above- and be-low-median-textbook usage schools, we averaged teachers’ response to five survey questions about frequency of textbook use (measured on a Likert scale from 0-4; see Table 5) across items and then across teachers within the school; then we split the sample of schools at the median value of this average (3.4, corresponding to 72.5% of lessons). Schools whose average response to the textbook usage questions were at or above the median are identified as “above-median-usage” schools (median = 3.7, corresponding to 80% of lessons), while schools whose average response were below the median are identified as “below-median-usage” schools (2.8, corresponding to 57.5% of lessons). To identify schools with above-median versus below-median levels of professional development (PD) aligned to the textbook, we averaged teachers’ response regarding the number of total days across their career they participated in textbook-aligned PD, and we split the sample at the median value of this average (3 days). Schools whose average response to PD question were at or above the median are identified as “above-median-PD” schools (median = 6 days), while schools whose average response were below the median are identified as “below-median-usage-PD” schools (median = 1.5 days). Textbooks identified as a “CCSS Edition” are those identified with “CC” in Table 7 (i.e., published after 2011, and publisher indicated textbook was written for or adapted to the CCSS). Robust standard errors in parentheses; “--” indicates that standard errors could not be estimated. ~ z > 1.64, * z > 1.96, ** z > 2.58, *** z > 3.29, where z equals the ratio of a given random effects parameter estimate to its standard error. These z-scores do not correspond precisely to p-values as in a traditional linear regression framework, as the confidence interval for a random effect estimate is not symmetric around the estimate (random effect estimates have a lower bound of zero). These traditional markers of significance are included as an aid to reader, but they should be interpreted with caution. When the estimated variance in the textbook random effect approaches zero, the standard error is undefined.

28 Learning by the Book | RESEARCH REPORT
shorter list of standards in more depth. Our failure to find a difference in textbook efficacy may simply mean that the policy goal was achieved: that textbooks differed less in their content and coverage—and in turn, in their efficacy—under the CCSS than they had previously.
Even after their states began administering CCSS-aligned assessments, a nontrivial share of schools was still using pre-CCSS editions. For instance, 37% of schools across our six states were using pre-CCSS editions in 2014–15, and 16% still were using pre-CCSS editions in the latest year of data available. Therefore, in the fourth panel of Table 11 (Panel D), we estimated the underlying variance in textbook efficacy separately for the samples of schools using pre- and post-CCSS editions. In California as well as in the remaining five states, the point estimate of the underlying variance in efficacy is higher among the pre-CCSS texts than among the CCSS editions: 0.042 SD versus 0.022 SD in California, for pre-CCSS editions and CCSS editions, respectively; and 0.012 SD versus 0 SD in the remaining five states. Although consistent with the hypothesis that the pre-CCSS texts differed more from each other than the post-CCSS texts, the differences are not large; nor are they statistically significantly different from each other.29
ADDITIONAL ROBUSTNESS CHECKSEven though we see little variation in textbook efficacy overall, we could be overlooking small differences between subsets of texts due to lack of statistical power. To investigate, we conducted a series of simulations in which we assigned one text an efficacy ranging from 0.02 to 0.10 student-level SD above the reference textbook, and with a market share ranging from 1% to 25% (see Appendix Table 1).30 We assigned all other texts an efficacy of zero. We then used equation
29 In early analyses, we also estimated the student achievement gains for schools that adopted a textbook rated by EdReports as mostly closely aligned to the CCSS. Based on rigorous review of textbook content by elementary math teachers, EdReports identified four textbooks that were most highly aligned with the CCSS: Bridges in Mathematics (CCSS edition), Engage NY/Eureka, My Math, and Ready Common Core. Two additional textbooks, Go Math and Math Expressions (CCSS edition), also were considered aligned to the CCSS at a slightly lower threshold. (Several other texts identified with “CC” in our tables did not meet EdReports’ threshold, and texts without “CC” were not reviewed at all because they were not meant to align to the CCSS.) In some models we estimated for this analysis, we saw a statistically significant 0.02 SD difference in student achievement for schools that used a textbook rated highly by EdReports, though this estimate was not robust to different model specifications.
30 To estimate statistical power, we generated 100 simulations for each combination of market share (1%, 5%, 10%, 20% and 25%) and single-text effect size (0.02, 0.03, 0.05, 0.10, 0.15 SD). In each run, we stripped 2,676 school*year observations of their textbook data and randomly assigned one of 15 fake curricula within district*textbook clusters (that is, all schools within a given district that were observed using a given textbook were assigned a common fake textbook in each simulation for all years they appear in the data). Once schools were assigned their fake textbook in a given run, to replicate real textbook adoption behavior, 6% of schools were chosen to switch to a new textbook in Year 2, and an additional 6% of schools were chosen to switch to a new textbook in Year 3. Schools that switched to a new text in Year 2 kept that text in Year 3 unless they were randomly chosen to switch in both years. Of the fake textbooks schools were assigned, 14 of 15 were designed to have no effect on value-added in the simulation, so schools assigned one of these 14 textbooks kept their original value-added. For schools randomly assigned the single “effective” textbook, their value-added was increased by the amount in the “effect size” (see values in rows of Appendix Table 1). By design, this increase in value-added is attributable to the textbook a school “uses,” so the simulation assesses whether our random effects model is able to detect and correctly attribute systematic variation in value-added to a schools’ choice of textbook for larger and smaller textbook effects distributed over a larger or smaller share of the sample of schools. The market-share percentage indicates what percentage of the sample’s schools were assigned the “effective” textbook for a set of simulations. After schools were assigned fake textbooks, a subset was chosen to randomly switch textbooks, and the value-added of schools that end up with the “effective” textbook in a given year was increased by the effect size, we estimated the textbook random effect as described in Table 9. The random effect estimate for each simulated run was stored, and this process was repeated 100 times for

29Center for Education Policy Research (CEPR) | cepr.harvard.edu
(2) to estimate the standard deviation in underlying textbook efficacy. When a single text was 0.05 student-level SD more effective and had anything more than 5% of the market, we had more than an 80% chance of rejecting the null hypothesis of zero variance in textbook efficacy.31 However, it was when the single textbook was equal to or below 0.03 student-level SD more effective that we would have failed to reject zero variance in textbook efficacy more than 80% of the time. In other words, if there were a single text that generated an annual gain in student achievement 0.05 SD larger than the average text, our method was very likely to detect it and estimate a non-zero variance in textbook efficacy as long as it had more than 5% of the market. On the other hand, if that text commanded a smaller than 5% market share or a differential efficacy of 0.03 SD or less, our method would have been unlikely to reject the null hypothesis of zero variance in efficacy.
We also examined the robustness of results to different subsets of covariates (see Appendix Tables 2 and 3, for textbook effects estimated as a set of fixed and random effects, respectively). We found similar results in models that included different combinations of school- and district-level characteristics.
Finally, we conducted a placebo test to see if math textbooks had an “impact” on ELA achievement, which they should not. However, to do this, we needed to condition our estimates on the ELA textbook used. Otherwise, we might simply find that the districts that succeed in choosing more effective math textbooks were good at choosing ELA textbooks too. It is only conditional on the ELA textbook that the math textbook should be irrelevant for gains in students’ ELA test scores. In California, the only state where we had data on ELA textbooks, we found that math textbooks do appear to have a statistically significant relationship to ELA achievement, although it is small, implying a SD in underlying textbook efficacy of 0.017 (see Appendix Tables 2 and 3). This would imply that we may be overstating the differences in math textbook efficacy in California.
RECONCILING WITH THE PREVIOUS LITERATUREHow do we reconcile our results with the previous experimental and non-experimental literature, which suggested larger differences in student achievement gains between schools using different texts? There are several possibilities:
First, the literature on the efficacy of alternative curricula is still in its infancy. While we did not find evidence of large differences in achievement gains for schools using different texts, it could be that the inclusion of more years and more states would point to larger differences than we have seen. Since we completed our data collection, another year of achievement data has become available; new textbooks and curriculum materials also have entered the market. Given the potential value of the curriculum lever, we hope future research will continue to try to resolve the differences between our findings and the earlier research.
A second possibility is that our value-added methodology is biased. As a result, we could be
each combination of effect size and market share.
31 The one exception was when the text was 0.05 SD better and 5% of the market, in which case we rejected the null hypothesis 34% of the time.

30 Learning by the Book | RESEARCH REPORT
understating the differences in textbook efficacy. In contrast to the value-added methodology, the randomized trial would have ensured that schools using different texts were similar, both in terms of observed and unobserved characteristics. The studies by Koedel and colleagues, by using a longer time-span and focusing on changes in achievement associated with changes in textbook adoptions, may also better control for unmeasured differences between schools than our method does. But, if we were understating the efficacy of textbooks based on bias due to unmeasured school characteristics, it would be an unusual form of bias, in which low-growth schools were using better textbooks, and high-growth schools were using less effective textbooks. The bias due to unmeasured school characteristics would have had to be of equal and opposite magnitude to the textbook effects. Typically, we would have expected to see unmeasured traits exaggerating the efficacy of interventions, with more advantaged (or better-managed) schools compounding their advantage by purchasing more effective textbooks.
A third possibility is that the answer has changed since the earlier studies were completed. In the pre-CCSS era, when textbooks were covering a broader range of topics, textbooks may have differed more in their alignment with any specific test being used to measure efficacy. For instance, if a test included several items measuring students’ ability to add fractions with unlike denominators, then the textbooks that emphasized that standard may appear more effective than another text. Yet, on a different test, with fewer items measuring that standard, the textbook rankings may change. Even on the CCSS-aligned tests, we saw some evidence that this may have been true. In California, where we had a large sample of schools using pre-CCSS editions of textbooks, we did find more variation in student achievement gains for schools using these texts, compared to smaller variation for schools using a post-CCSS edition textbook. Also, in the Jaciw et al. (2016) randomized trial, the schools using the CCSS edition of Math in Focus outperformed on the Stanford Achievement Test but not on Nevada’s criterion-referenced test.32
A fourth possibility is that the answer has not changed over time, but is simply different in upper-elementary grades—where our study focused because of our need for prior achievement controls—than in lower-elementary grades—where much of the prior research was concentrated. The randomized trial conducted by Agodini et al. (2010) focused on first and second graders, and the non-experimental studies by Koedel and his co-authors focused primarily on third-grade achievement (Bhatt & Koedel, 2012; Bhatt, Koedel, & Lehmann, 2013; Koedel et al., 2017). The types of skills tested in early elementary grades (the number line, single-digit addition and subtraction, etc.) may be more sensitive to interventions of all types than the skills measured on the fourth- and fifth-grade assessments. Jaciw et al. (2016) did find modest textbook effects in third through fifth grade, but their analysis was limited to a single textbook, Math in Focus.
A fifth possibility is that the findings from the randomized trials are not generalizable. Although randomized trials may accurately reflect the causal effect of textbooks for the population studied, the population of schools that were willing to have their textbook randomly assigned may have been unusual. In the Agodini et al. (2010) experiment, the small percentage of districts (2.5%) that were willing to participate in such a study may have been particularly dissatisfied with the texts they were using and may have benefited more from the change than other districts would have. Similar to Agodini et al. (2010), Eddy et al. (2014) had to contact over 6,000 school
32 Agodini et al. (2010) used the ECLS-K math test, which is based on the standards used in the National Assessment of Educational Progress.

31Center for Education Policy Research (CEPR) | cepr.harvard.edu
districts and principals to recruit nine participating schools (<0.15% participation rate). Just as other non-experimental studies have found, we see evidence of differences in achievement for some textbooks when focusing solely on one individual state. However, no single text proved to be more or less effective across multiple states. The fact that Saxon Math was among the most effective texts in the randomized trial by Agodini et al. (2010), while being among the least effective texts in Bhatt & Koedel (2012) may reflect the same lack of generalizability.33
CONCLUSIONThe adoption of the Common Core State Standards led schools in many states to switch curricula. With so many districts transitioning to new curricula, the choice of textbook and curriculum has become much more salient. Contrary to prior research, we found little evidence of differences in average student achievement growth for elementary schools using different math textbooks in six states using CCSS-aligned assessments.
Some may interpret our findings as implying that curriculum choice does not matter. We believe that would be an overstatement. It is true that, at current levels of classroom implementation, we do not see that schools using different textbooks or curriculum materials differed in terms of average student achievement growth on the CCSS-aligned assessments. Yet, it is possible that, with greater supports for classroom implementation, the advantages of specific curricula would emerge and we would see larger differences.
Although the vast majority of teachers (93%) in our sample reported using the official textbook for some purpose in a majority of their classes, few teachers hewed closely to the text. Just 25% of teachers reported using the textbook in nearly all of their lessons and for multiple, essential purposes: “to create mathematical tasks and activities,” “to select examples to present in class”, “as a source of practice problems that students work on independently during class time,” and “as a source of problems for students to complete outside of class.” Similarly, teachers reported modest amounts of training in the use of their texts. The average teacher received just one day of training in the current year, and fewer than four days over their entire careers. Even in the schools with above-average levels of training, teachers reported receiving six days of training in their text over the course of their careers. Given districts’ investments in curricula, these do not seem like large expenditures of time or funding. It may be that we just did not see sufficiently intensive usage or training in our sample to detect the differences between texts.
33 A sixth possibility is that the randomized trial by Agodini et al., while being unbiased, was conflating the efficacy of certain textbooks with schools’ prior experience with the textbook. One-quarter of schools had been using Saxon Math in the year before the experiment. Saxon Math also was the textbook with the highest measured “efficacy” in that experiment. It could be that the estimate reflected not only the efficacy of the textbook, but also the fact that many schools had been using that textbook previously. Although the authors included a control for whether or not an individual teacher had used the text before, the final results did not include controls or interactions for wheth-er or not the school had been using the randomly assigned curriculum previously. An individual teacher new to Saxon Math working in a school that had been using Saxon Math previously may not be as disadvantaged as those in schools where no one had been using this text. This raises the question of construct validity: were the authors measuring the efficacy of Saxon Math or were they witnessing the advantage of not having to transition to a new curriculum?

32 Learning by the Book | RESEARCH REPORT
Other readers may continue to advocate for the importance of curriculum choice, despite our results, given the small share of teachers using the text exclusively, and given the low levels of text-specific training provided. However, those who want to hold on to the importance of curriculum need to be able to identify the level of support and training required for such curriculum changes to actually bear fruit in the classroom. It is possible that closer adherence to a high-quality curriculum would produce benefits, but we still need to answer several questions: (1) What levels of support are required to produce greater levels of adherence? (2) Do the desired student achievement benefits appear afterwards? (3) What are the costs associated with these supports, and are they justified given the observed effects?
Citing the earlier research, Chingos and Whitehurst (2012) posed a choice between “challenging, expensive, and time-consuming” efforts to improve teaching quality and the “relatively easy, inexpensive, and quick” choice of a higher-quality curriculum. While our findings certainly cast doubt on the proposition that there are quick and easy payoffs to curriculum changes, the bigger error may be in thinking of curriculum choice and teaching reforms as alternatives. It could be that in order to gain the benefits of either, districts must do both.

33Center for Education Policy Research (CEPR) | cepr.harvard.edu
REFERENCESAgodini, R., Harris, B., Thomas, M., Murphy, R., & Gallagher, L. (2010). Achievement effects
of four early elementary school math curricula: Findings for first and second graders. NCEE 2011-4001. National Center for Education Evaluation and Regional Assistance.
Angrist, J. D., Hull, P. D., Pathak, P. A., & Walters, C. R. (2017). Leveraging lotteries for school value-added: Testing and estimation. The Quarterly Journal of Economics, 132(2), 871–919.
Beck Evaluation & Testing Associates Inc. (2005). Progress in Mathematics 2006: Grade 1 Pre-Post Field Test Evaluation Study. New York: Sadlier-Oxford Division, William H. Sadlier, Inc.
Bhatt, R., & Koedel, C. (2012). Large-scale evaluations of curricular effectiveness: The case of elementary mathematics in Indiana. Educational Evaluation and Policy Analysis, 34(4), 391–412.
Bhatt, R., Koedel, C., & Lehmann, D. (2013). Is curriculum quality uniform? Evidence from Florida. Economics of Education Review, 34, 107–121.
Bianchini, J. A., & Kelly, G. J. (2003). Challenges of standards‐based reform: The example of California’s science content standards and textbook adoption process. Science Education, 87(3), 378–389.
Boser, U., Chingos, M., & Straus, C. (2015). The hidden value of curriculum reform: Do states and districts receive the most bang for their curriculum buck? Washington, DC: Center for American Progress.
Cameron, A. C., & Miller, D. L. (2015). A practitioner’s guide to cluster-robust inference. Journal of Human Resources, 50(2), 317–372.
Carrell, S., Kurlaender, M., Martorell, P., & Naven, M. (2018). The impacts of high school quality on postsecondary outcomes: Evidence from California. Working Paper. Davis, CA: California Education Lab, University of California, Davis.
Cavanaugh, S. (2015, June 9). N.Y. `open’ education effort draws users nationwide. Education Week. Retrieved from https://www.edweek.org/ew/articles/2015/06/10/ny-open-education-effort-draws-users-nationwide.html
Chingos, M. M., & Whitehurst, G. J. (2012). Choosing blindly: Instructional materials, teacher effectiveness, and the Common Core. Washington, D.C.: Brown Center on Education Policy at the Brookings Institution.
Deming, D. J. (2014). Using school choice lotteries to test measures of school effectiveness. American Economic Review, 104(5), 406–11.
Eddy, R. M., Hankel, N., Hunt, A., Goldman, A., & Murphy, K. (2014). Houghton Mifflin Harcourt GO Math! Efficacy study year one final report. La Verne, CA: Cobblestone Applied Research & Evaluation, Inc.

34 Learning by the Book | RESEARCH REPORT
Fryer, R.G., Jr. (2017). The production of human capital in developed countries: Evidence from 196 randomized field experiments. In Handbook of field experiments (Vol. 2, pp. 95–322). Amsterdam: North-Holland.
Gatti, G., & Giordano, K. (2010). Pearson Investigations in Numbers, data, & space efficacy study: Final report. Pittsburgh, PA: Gatti Evaluation, Inc.
Holden, K. L. (2016). Buy the book? Evidence on the effect of textbook funding on school-level achievement. American Economic Journal: Applied Economics, 100-127.
Hutt, E., & Polikoff, M. (Spring 2018). Reasonable expectations: A reply to Elmendorf and Shanske 2018. University of Illinois Law Review.
Jaciw, A. P., Hegseth, W. M., Lin, L., Toby, M., Newman, D., Ma, B., & Zacamy, J. (2016). Assessing impacts of Math in Focus, a “Singapore Math” program. Journal of Research on Educational Effectiveness, 9(4), 473–502.
Jackson, K., & Makarin, A. (2018). Can online off-the-shelf lessons improve student outcomes? Evidence from a field experiment. American Economic Journal: Economic Policy, 10(3), 226–254.
Kirst, M. W. (1982). How to improve schools without spending more money. The Phi Delta Kappan, 64(1), 6–8.
Koedel, C., Li, D., Polikoff, M. S., Hardaway, T., & Wrabel, S. L. (2017). Mathematics curriculum effects on student achievement in California. AERA Open, 3(1).
McFarland, J., Hussar, B., de Brey, C., Snyder, T., Wang, X., Wilkinson-Flicker, S., Gebrekristos, S., Zhang, J., Rathbun, A., Barmer, A., Bullock Mann, F., & Hinz, S. (2017). The condition of education 2017 (NCES 2017-144). U.S. Department of Education. Washington, DC: National Center for Education Statistics. Retrieved from https://nces.ed.gov/pubsearch/pubsinfo.asp?pubid=2017144
Opfer, V. D., Kaufman, J. H., & Thompson, L. E. (2016). Implementation of K–12 state standards for mathematics and English language arts and literacy. Santa Monica, CA: RAND.
O’Donnell, C. L. (2008). Defining, conceptualizing, and measuring fidelity of implementation and its relationship to outcomes in K–12 curriculum intervention research. Review of Educational Research, 78(1), 33–84.
Pellegrini, M., Inns, A., & Slavin, R. (2018, March 3). Effective programs in elementary mathematics: A best-evidence synthesis. Paper presented at the annual meeting of the Society for Research on Educational Effectiveness, Washington, DC.
Polikoff, M. S. (2015). How well aligned are textbooks to the common core standards in mathematics? American Educational Research Journal, 52(6), 1185–1211.
Polikoff, M. S. (2018). The challenges of curriculum materials as a reform lever. Brookings. Retrieved from https://www.brookings.edu/research/the-challenges-of-curriculum-materials-as-a-reform-lever/
35Center for Education Policy Research (CEPR) | cepr.harvard.edu
Polikoff, M. S., Campbell, S. E., Koedel, C., Le, Q. T., Haraway, T., & Gasparian, H. (2018). The formalized processes districts use to evaluate textbooks. University of Southern California Working Paper.
Pustejovsky, J. E., & Tipton, E. (2016). Small-sample methods for cluster-robust variance estimation and hypothesis testing in fixed effects models. Journal of Business & Economic Statistics, 672–683.
Sadler, D. R. (1989). Formative assessment and the design of instructional systems. Instructional Science, 18(2), 119–144.
Schmidt, W. H., McKnight, C. C., Houang, R. T., Wang, H. C., Wiley, D. E., Cogan, L. S., et al. (2001). Why schools matter: A cross-national comparison of curriculum and learning. San Francisco: Jossey-Bass.
Schmidt, W. H., McKnight, C. C., & Raizen, S. (1997). A splintered vision: An investigation of U.S. science and mathematics education. Dordrecht, NL: Kluwer.
Seeley, C. L. (2003). Mathematics textbook adoption in the United States. In G. M. A. Stanic & J. Kilpatrick (Eds.), A history of school mathematics. (Vol. 2, pp. 957–988). Reston, VA: National Council of Teachers of Mathematics.
Slavin, R. E., & Lake, C. (2008). Effective programs in elementary mathematics: A best-evidence synthesis. Review of Educational Research, 78(3), 427–515.
Strobel, A., Resendez, M., & DuBose, D. (2017). enVision Math2.0 Year 2 RCT Study Final Report. Thayne, WY: Strobel Consulting, LLC.
Tulley, M. A. (1985). A descriptive study of the intents of state-level textbook adoption processes. Educational Evaluation and Policy Analysis, 7(3), 289–308.
Whitehurst, G. J. (2009). Don’t forget curriculum. Washington, D.C.: Brookings Institution.

36 Learning by the Book | RESEARCH REPORT
APPENDIXAppendix Figure 1. Clustered versus Non-Clustered Standard Errors
0 20 40 60
Number of Districts Using a Given Textbook
Rat
io o
f Clu
ster
ed to
Non
-Clu
ster
ed S
E on
Tex
tboo
k FE
Est
imat
e
80 100 1200.0
0.2
0.4
0.6
0.8
1.0
1.2
1.4
1.6
1.8
2.0
Notes. The graph plots the ratio of clustered to non-clustered standard errors for each textbook fixed effect, against the number of districts observed using that textbook. Non-clustered estimates include nested random effects for district and school, with school nested in district. Clustered standard errors are clustered at the district level. The sample is restricted to school-by-year observations in Louisiana, Maryland, New Jersey, New Mexico, and Washington with value-added data for 2015, 2016, or 2017 who are known to have used one of the top 15 textbooks by market share.
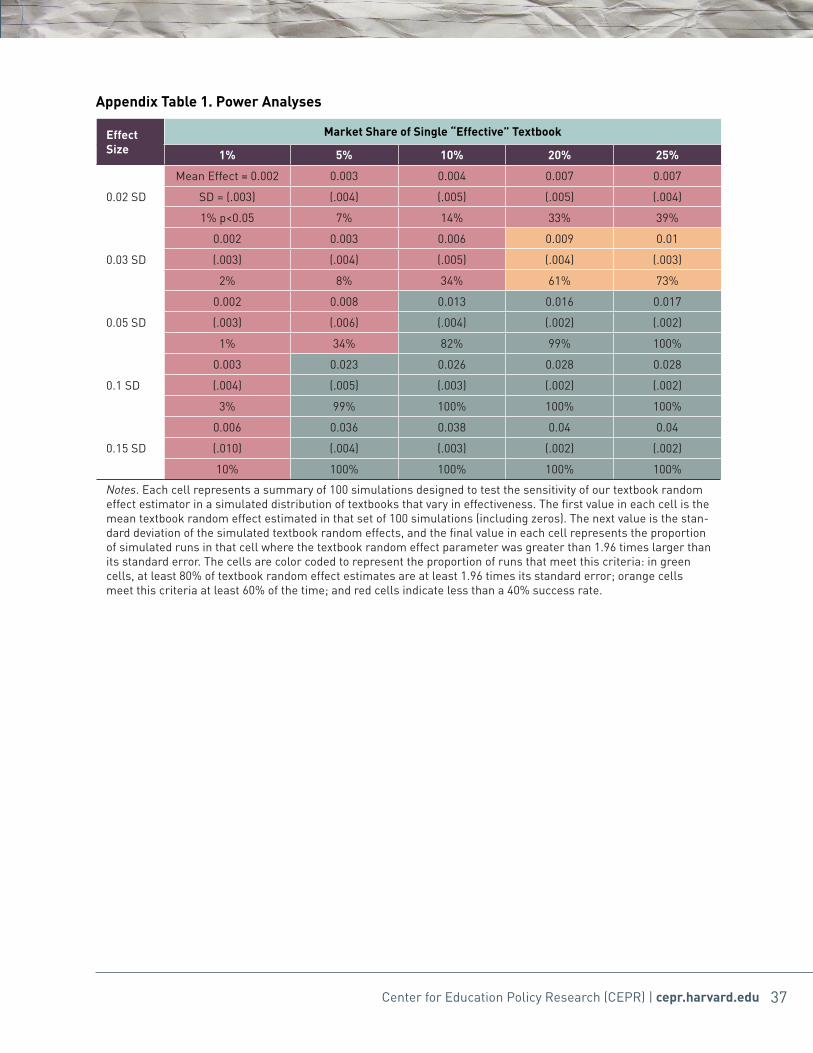
37Center for Education Policy Research (CEPR) | cepr.harvard.edu
Appendix Table 1. Power Analyses
Effect Size
Market Share of Single “Effective” Textbook
1% 5% 10% 20% 25%
Mean Effect = 0.002 0.003 0.004 0.007 0.007
0.02 SD SD = (.003) (.004) (.005) (.005) (.004)
1% p<0.05 7% 14% 33% 39%
0.002 0.003 0.006 0.009 0.01
0.03 SD (.003) (.004) (.005) (.004) (.003)
2% 8% 34% 61% 73%
0.002 0.008 0.013 0.016 0.017
0.05 SD (.003) (.006) (.004) (.002) (.002)
1% 34% 82% 99% 100%
0.003 0.023 0.026 0.028 0.028
0.1 SD (.004) (.005) (.003) (.002) (.002)
3% 99% 100% 100% 100%
0.006 0.036 0.038 0.04 0.04
0.15 SD (.010) (.004) (.003) (.002) (.002)
10% 100% 100% 100% 100%
Notes. Each cell represents a summary of 100 simulations designed to test the sensitivity of our textbook random effect estimator in a simulated distribution of textbooks that vary in effectiveness. The first value in each cell is the mean textbook random effect estimated in that set of 100 simulations (including zeros). The next value is the stan-dard deviation of the simulated textbook random effects, and the final value in each cell represents the proportion of simulated runs in that cell where the textbook random effect parameter was greater than 1.96 times larger than its standard error. The cells are color coded to represent the proportion of runs that meet this criteria: in green cells, at least 80% of textbook random effect estimates are at least 1.96 times its standard error; orange cells meet this criteria at least 60% of the time; and red cells indicate less than a 40% success rate.

38 Learning by the Book | RESEARCH REPORT
Appendix Table 2. Robustness of Textbook Fixed Effect Estimates
Textbooks
Pooled 6 States (School
and District Covariates,
Top 15 Textbooks)
Pooled 6 States (School
Covariates, Top 15
Textbooks)
Pooled 6 States (No Covariates,
Top 15 Textbooks)
California (ELA
Achievement as Outcome,
Controlling for ELA Textbooks)
(1) (2) (3) (4)
A. Minimum EdReports CCSS Alignment Rating: Meets Expectations
Bridges in Mathematics CC 0.010 0.013 0.019 -0.022
(0.018) (0.018) (0.020) (0.02)
Engage NY/Eureka CC -0.003 -0.008 -0.021~ -0.036**
(0.011) (0.011) (0.012) (0.014)
My Math CC 0.019~ 0.018 0.022* 0.025*
(0.010) (0.010) (0.011) (0.012)
Ready Common Core CC -0.020 -0.011 -0.020 -0.078
(0.039) (0.040) (0.040) (0.07)
B. Minimum EdReports CCSS Alignment Rating: Partially Meets Expectations
Go Math CC 0.001 -0.005 -0.007 -0.033**
(0.010) (0.100) (0.011) (0.013)
Math Expressions CC 0.039** 0.039** 0.043** -0.007
(0.013) (0.014) (0.015) (0.016)
C. Other CCSS Editions
Everyday Mathematics CC -0.009 -0.009 0.012 -0.068***
(0.012) (0.012) (0.013) (0.016)
Math in Focus CC 0.002 0.004 0.007 0.019
(0.017) (0.017) (0.018) (0.026)
Stepping Stones CC 0.010 0.011 -0.009 0.050
(0.031) (0.031) (0.032) (0.059)
D. Non-CCSS Editions
enVision -0.029** -0.032** -0.026* -0.036**
(0.010) (0.011) (0.011) (0.012)
Everyday Math 0.086*** 0.092*** 0.084*** 0.067***
(0.015) (0.015) (0.016) (0.018)
Houghton Mifflin Math -0.020 -0.022 -0.014 -0.023
(0.015) (0.016) (0.017) (0.016)
Math Connects 0.015 0.006 0.005 --
(0.028) (0.028) (0.028) --
Math Expressions -0.016 -0.016 0.001 0.037
(0.034) (0.034) (0.035) (0.078)
p-value from Test of Joint Significance 0.000 0.000 0.000 0.000
SD of Textbook Fixed Effects 0.029 0.031 0.029 0.045
School*Year Observations 10,797 10,797 10,797 8,121

39Center for Education Policy Research (CEPR) | cepr.harvard.edu
Notes. ~ p < .10, * p < .05, ** p < .01, *** p < .001. Estimates in each column come from separate models. In columns (1) to (3), we report textbook fixed effects from a multilevel mixed-effects linear regression of school value-added. We report coefficients for a set of binary indicators for each textbook. Section A presents estimates for the subset of textbooks that earned EdReports ratings of “Meets Expectations” in both components of its overall CCSS Alignment rating, “Focus and Coherence” and “Rigor and Mathematical Practices.” Section B presents estimates for textbooks that earned EdReports ratings of at least “Partially Meets Expectations” in both components of its Alignment rating. Section C presents estimates for textbooks written after 2011 that did not meet EdReports expectations in at least one component of Alignment. Section D presents estimates for textbooks written before 2011 and were not evaluated for alignment by EdReports. We also include school-by-year demographic characteristics, 2010–2014 district census characteristics, and state-by-year fixed effects (restricted to year fixed effects only or state fixed effects only in specifications limited to a single state or year) as indicated by the column headers. The omitted textbook category is enVision CC. The model also includes nested random effects for schools nested within districts. Estimates in column (4) replace school math value-added with school ELA value-added as the dependent variable, replace state-by-year fixed effects with year fixed effects, and add ELA textbook fixed effects as additional covariates. The sample is restricted to school-by-year observations with value-added data for 2015, 2016, or 2017. Robust standard errors in parentheses.
Appendix Table 2. Notes

40 Learning by the Book | RESEARCH REPORT
Appendix Table 3. Robustness of Textbook Random Effect Estimates
Random Effects Parameters Pooled 5 States (Excluding California) California Only
Panel A. School and District Covariates
Textbook 0.000 0.027**
-- (0.008)
School*Year Observations 2,676 8,121
Panel B. School Covariates
Textbook 0.000 0.033***
-- (0.009)
School*Year Observations 2,676 8,121
Panel C. No Covariates
Textbook 0.000 0.037***
-- (0.011)
School*Year Observations 2,676 8,121
Panel D. ELA Achievement as Outcome, Controlling for ELA Textbooks
Textbook N/A 0.017**
(0.006)
School*Year Observations 8,121
Notes. Estimates in each cell come from separate models. Random effects are estimated from a multilevel mixed-effects linear regression of school-level value-added on state-by-year fixed effects (restricted to year fixed effects only in specifications limited to a single state), and school-by-year demographic characteristics and/or 2010–2014 district census characteristics where indicated. The model also includes nested random effects for textbook, state, district, and school, nested in that order, with curriculum as the top level of the nesting structure (state random effects are excluded from regressions that are limited to a single state). The sample is restricted to school-by-year observations with value-added data for 2015, 2016, or 2017. Except for Panel D, the sample is further restricted to school-by-years who are known to have used one of the top 15 textbooks by market share. Estimates in Panel D extend the sample to all schools with known textbook data. Robust standard errors in parentheses; “--” indicates that standard errors could not be estimated. ~ z > 1.64, * z > 1.96, ** z > 2.58, *** z > 3.29, where z equals the ratio of a given random effects parameter estimate to its standard error. These z-scores do not correspond precisely to p-values as in a traditional linear regression framework, as the confidence interval for a random effect estimate is not symmetric around the estimate (random effect estimates have a lower bound of zero). These traditional markers of significance are included as an aid to reader, but they should be interpreted with caution. When the estimated variance in the textbook random effect approaches zero, the standard error is undefined.

Visit cepr.harvard.edu/curriculum for more info.