comparing initial large-scale fields from two hwrf runs with gfs analysis
DESCRIPTION
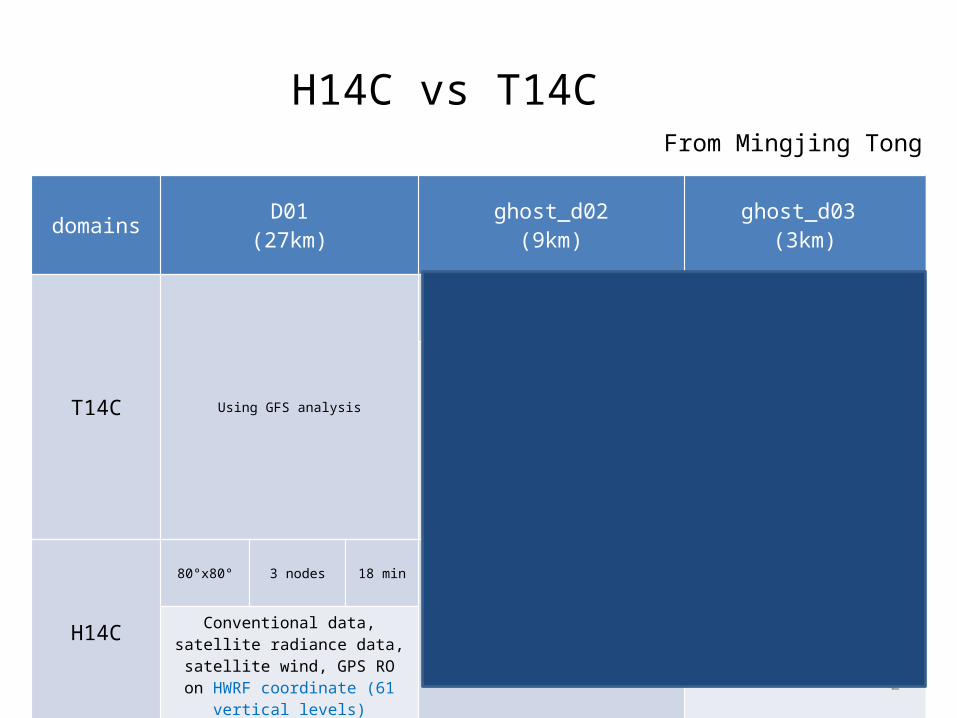
Comparing initial large-scale fields from two HWRF runs with GFS analysis. --Two HWRF configurations ❶ H14C : GSI is used on Domain 1 ❷ T14C: GSI is not used Domain 1. --GFS analysis 0.5X0.5 grib2 data are used. H14C vs T14C. From Mingjing Tong. Procedure - PowerPoint PPT PresentationTRANSCRIPT

1
Comparing initial large-scale fields from two HWRF runs with GFS analysis
--Two HWRF configurations
❶ H14C : GSI is used on Domain 1
❷ T14C: GSI is not used Domain 1
--GFS analysis 0.5X0.5 grib2 data are used
2
domains D01(27km)
ghost_d02(9km)
ghost_d03 (3km)
T14C Using GFS analysis
20°x20° 4 nodes 11 min 10°x10° 8 nodes 12 min
Conventional data, satellite radiance data, satellite wind, GPS RO, TDR data on GFS-HWRF blended coordinate (75
vertical levels)Turn on non-linear QC for
conventional data
Conventional data and TDR dataTurn on non-linear QC for
conventional data
H14C
80°x80° 3 nodes 18 min
N/A
15°x15° 10 nodes 24 min
Conventional data, satellite radiance data, satellite wind, GPS RO on
HWRF coordinate (61 vertical levels)Conventional data and TDR data
From Mingjing Tong
H14C vs T14C

3
Procedure
1. Get data of both HWRF runs from hpss for all cycles in EPAC and ATL in Aug of 2012 and 2013. Total 447 cycles.
2. Use “copygb” to map HWRF domain 1 to the same grid of GFS data (0.5X0.5), hr_grid="255 0 720 361 90000 000000 136 -90000 -500 500 500 0"
3. Calculate bias ( mean differences (HWRF – GFS), RMS difference for a given point. SPFH not available in HWRF but available in GFS. Calculated both for consistent comparison.

4
Distribution of the number of available data points
# of Cycles in Aug 2012: 296 = 77E + 219L# of Cycles in Aug 2013: 151 = 108E + 43LTotal: 447

5
HWRF analysis vs GFS analysis
HGT (850mb, 500mb) TMP (850mb, 500mb) RH (850mb, 500mb) SPFH (850mb, 500mb) Wind speed (850mb, 500mb) U (850mb, 500mb) V (850mb, 500mb)

6
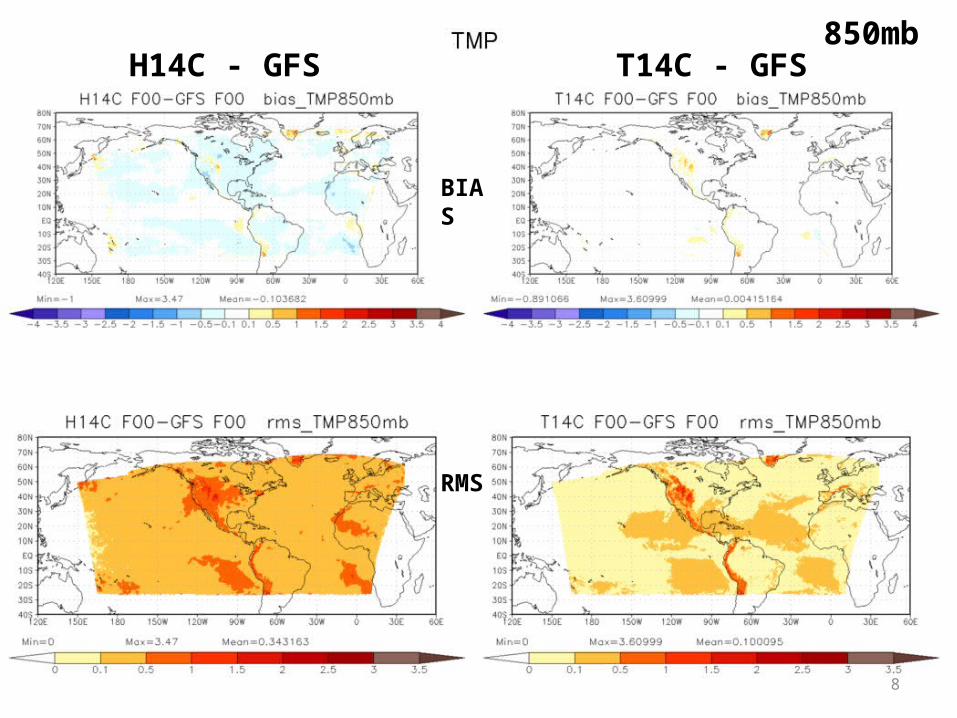
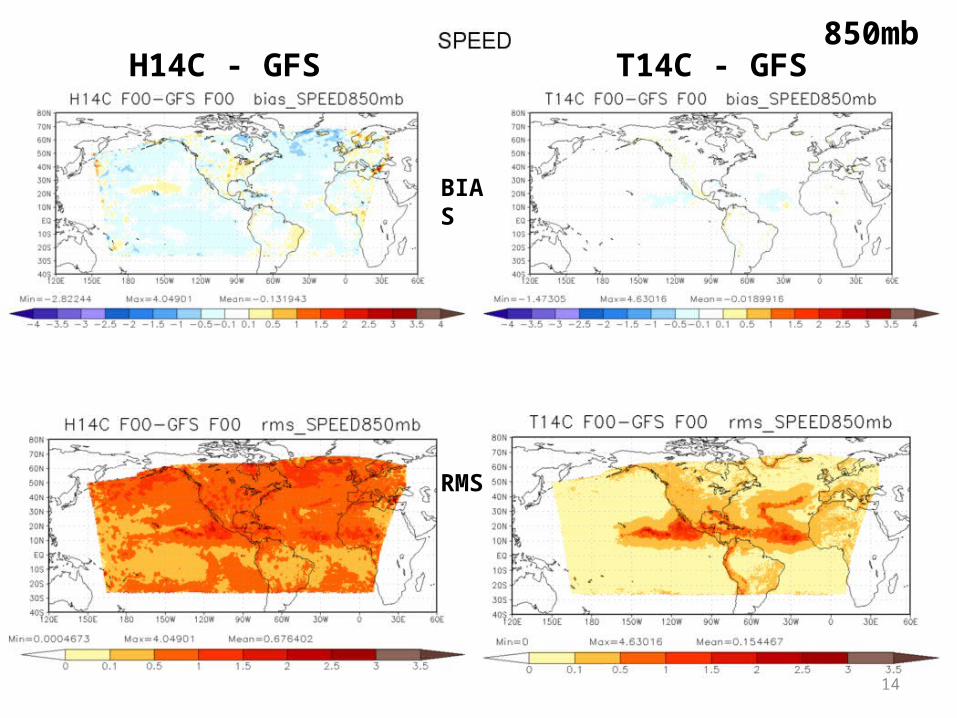
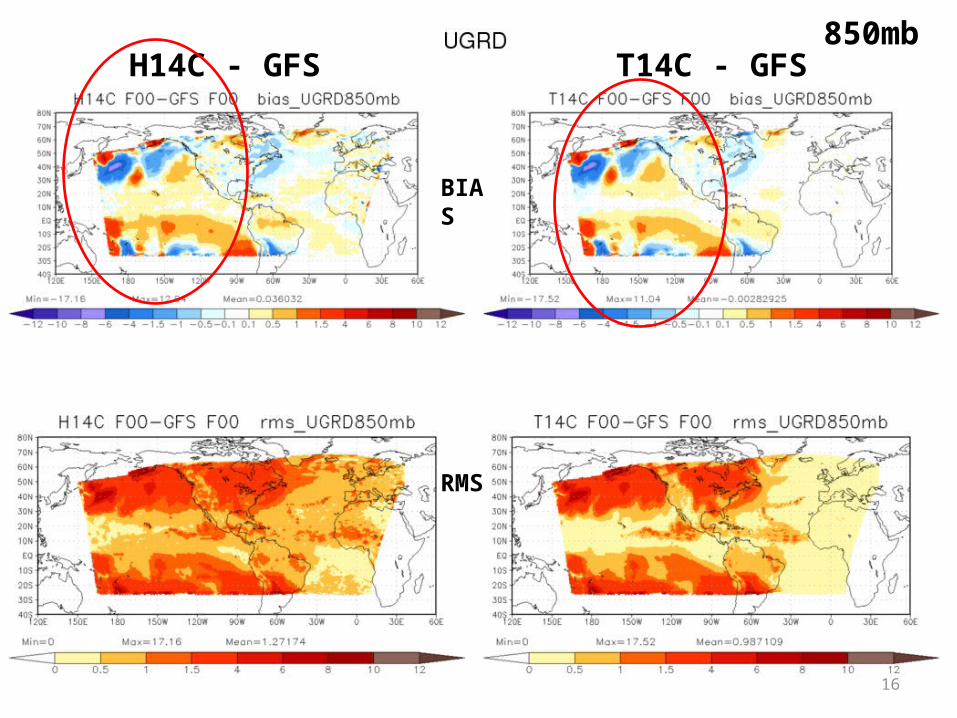
H14C – GFS T14C – GFS
BIAS
RMS
850mb
7
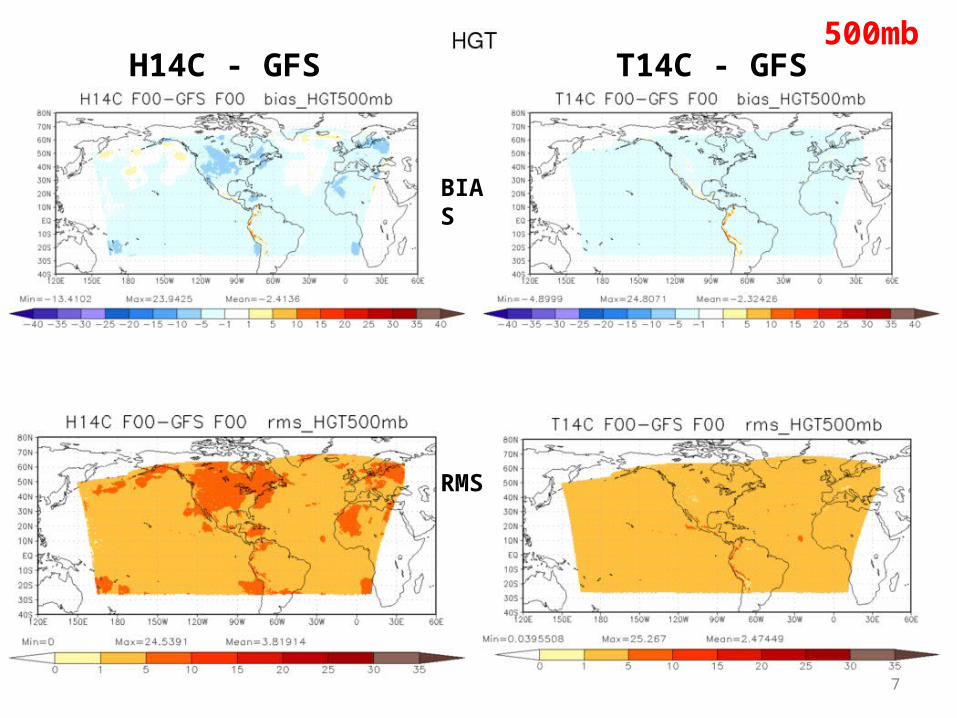
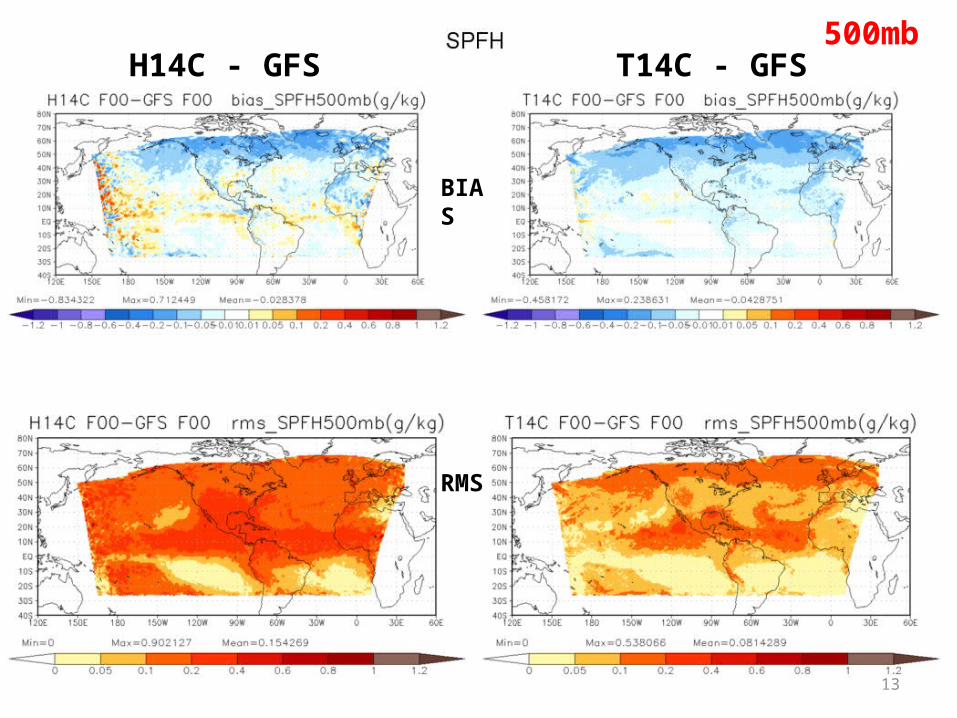
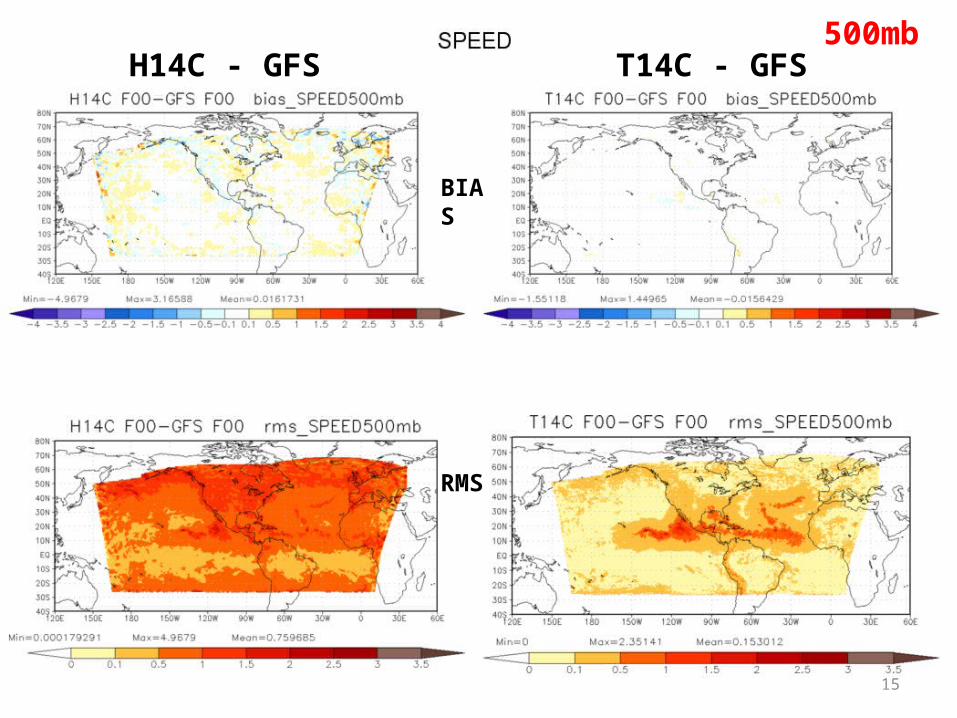
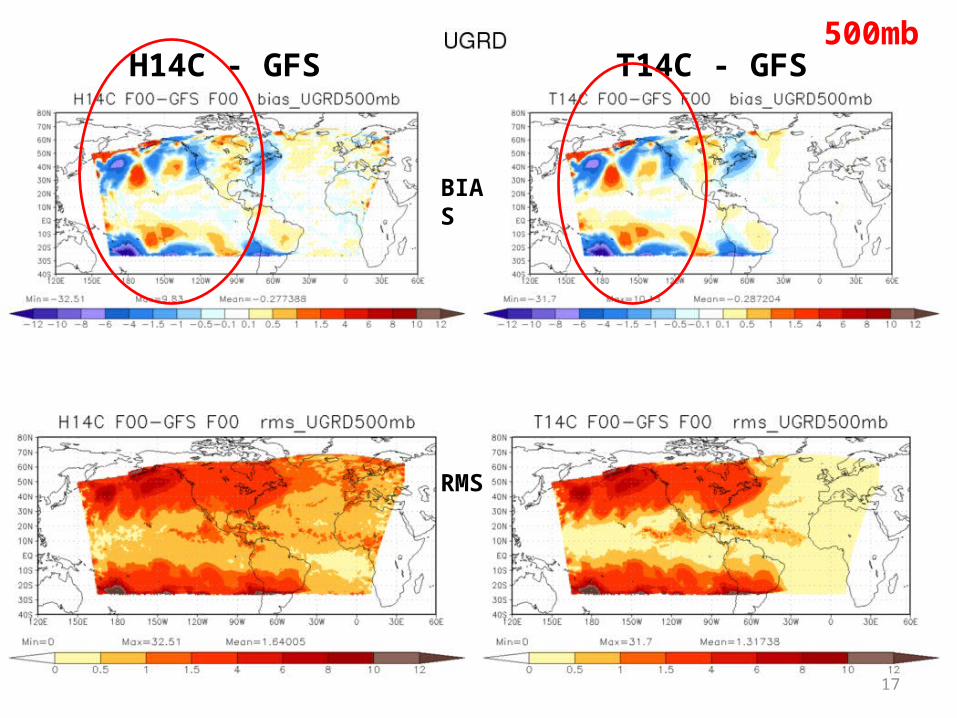
H14C - GFS T14C - GFS
BIAS
RMS
500mb
8
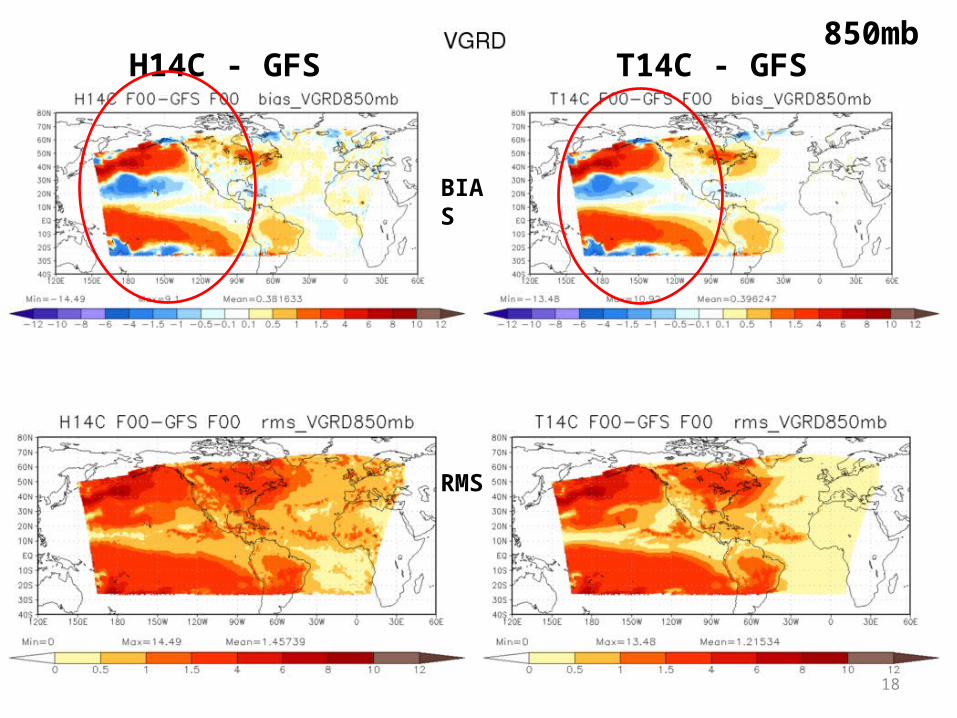
H14C - GFS T14C - GFS
BIAS
RMS
850mb

9
H14C - GFS T14C - GFS
BIAS
RMS
500mb

10
H14C - GFS T14C - GFS
BIAS
RMS
850mb

11
H14C - GFS T14C - GFS
BIAS
RMS
500mb
12
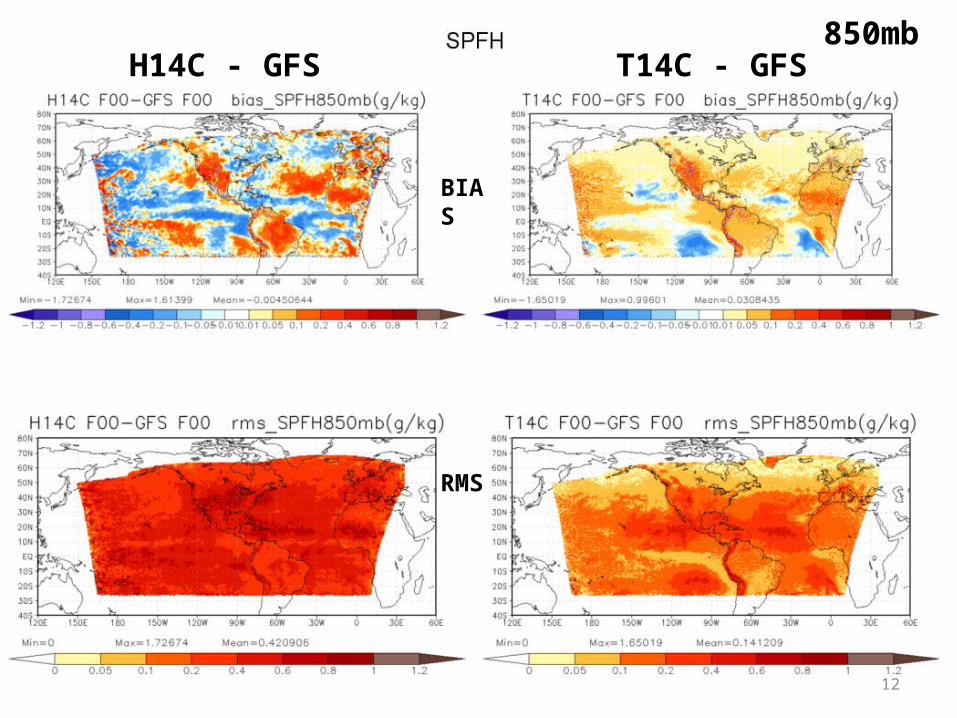
H14C - GFS T14C - GFS
BIAS
RMS
850mb
13
H14C - GFS T14C - GFS
BIAS
RMS
500mb
14
H14C - GFS T14C - GFS
BIAS
RMS
850mb
15
H14C - GFS T14C - GFS
BIAS
RMS
500mb
16
H14C - GFS T14C - GFS
BIAS
RMS
850mb
17
H14C - GFS T14C - GFS
BIAS
RMS
500mb
18
H14C - GFS T14C - GFS
BIAS
RMS
850mb

19
H14C - GFS T14C - GFS
BIAS
RMS
500mb
20
Why wind speed close, but wind components different ?
- Select one cycle to take a closer look

21
TMP
RH
HGT
T14C minus GFS analysis
Storm 04L 20132013080118 cycle 850mb Scalars
22
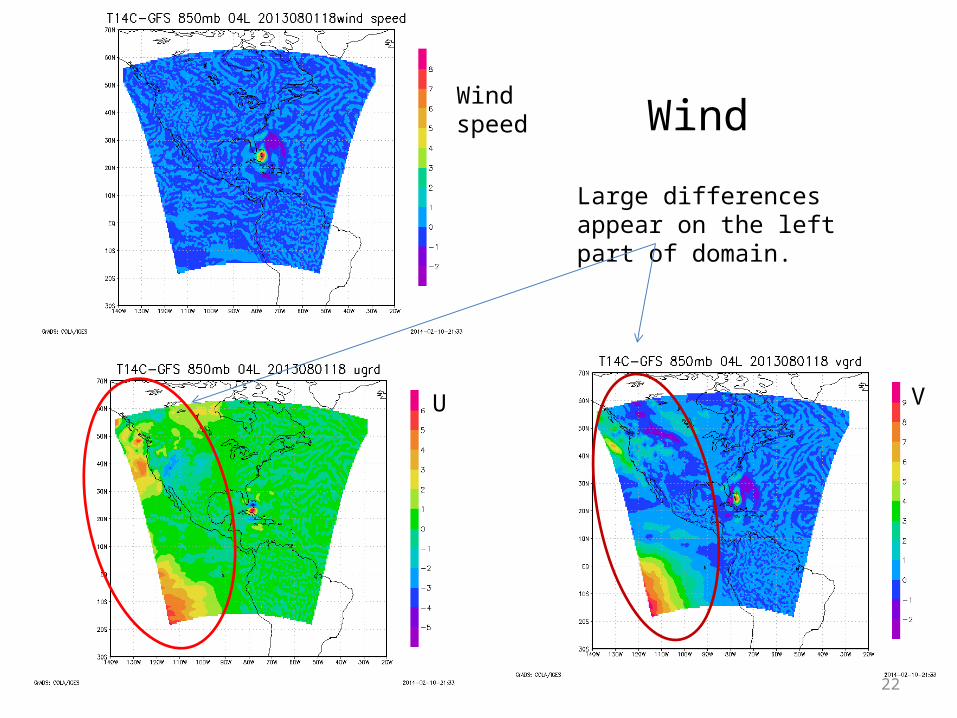
Wind speed
U V
Wind
Large differences appear on the left part of domain.
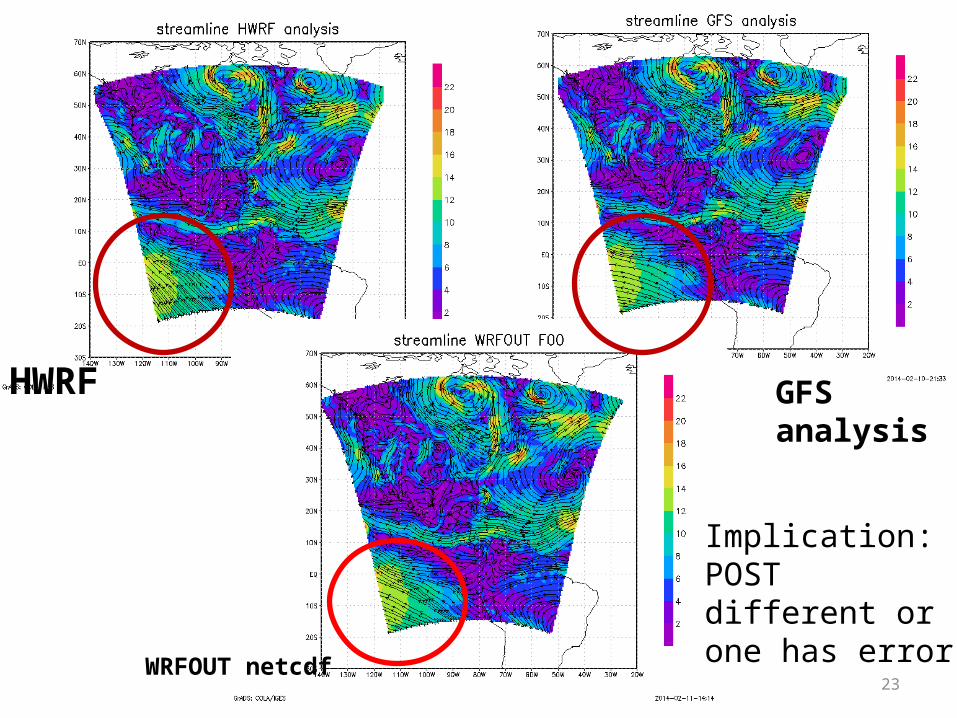
23
HWRF GFS analysis
WRFOUT netcdf
Implication:POST different or one has error

24
HWRF F72 vs GFS analysis
HGT (850mb) TMP RH SPFH Wind speed U V
25
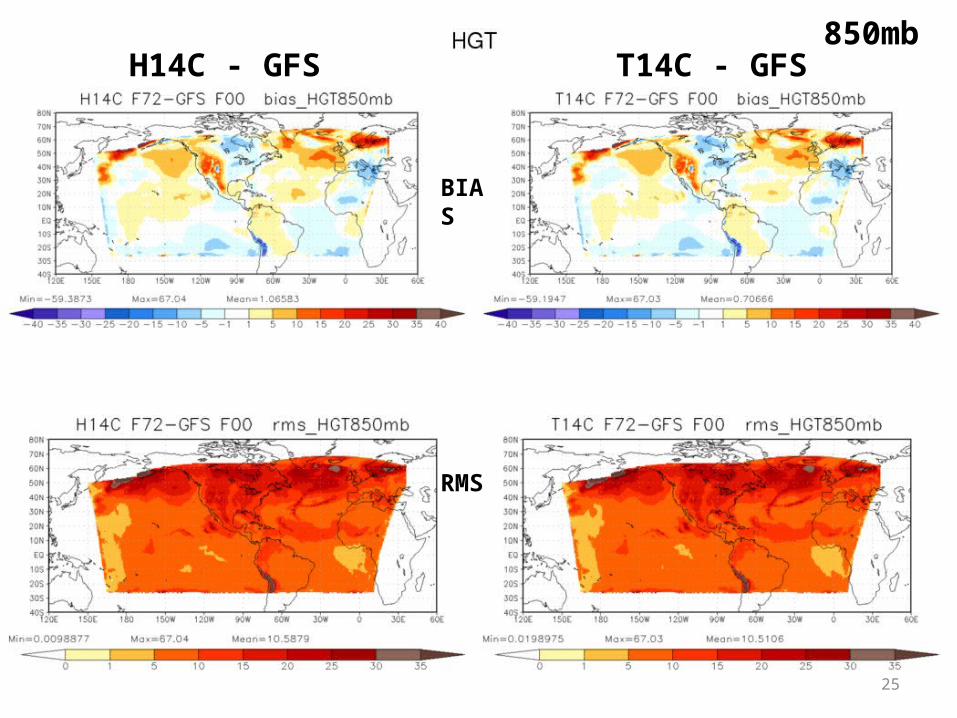
H14C - GFS T14C - GFS
BIAS
RMS
850mb

26
H14C - GFS T14C - GFS
BIAS
RMS
850mb

27
H14C - GFS T14C - GFS
BIAS
RMS
850mb

28
H14C - GFS T14C - GFS
BIAS
RMS
850mb

29
H14C - GFS T14C - GFS
BIAS
RMS
850mb

30
H14C - GFS T14C - GFS
BIAS
RMS
850mb
31
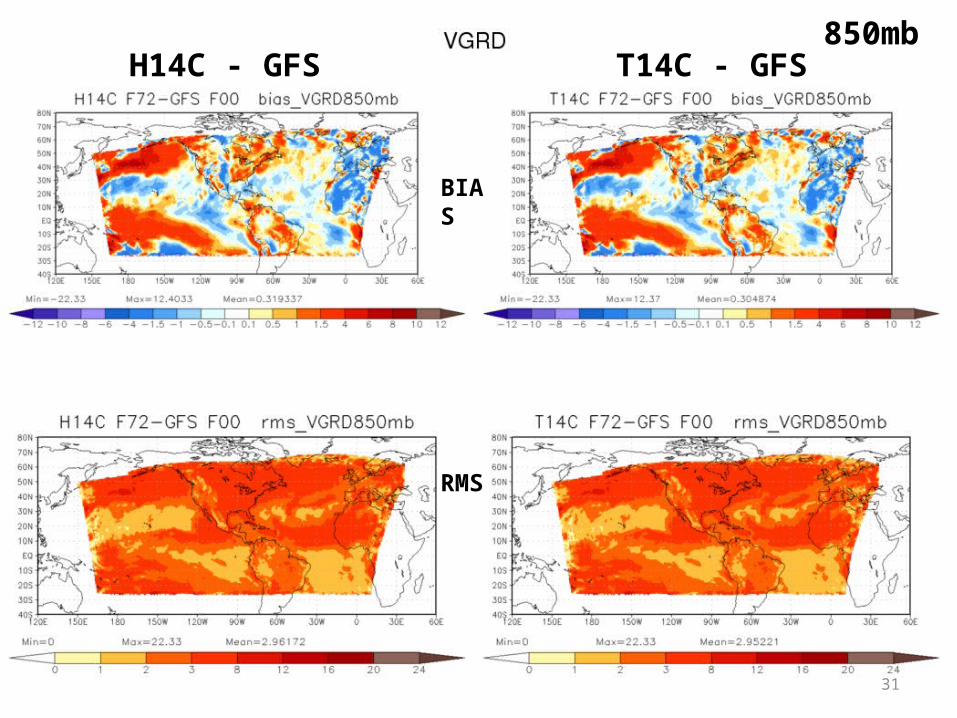
H14C - GFS T14C - GFS
BIAS
RMS
850mb

32
HWRF F72 vs GFS F72
HGT (850mb) TMP RH SPFH Wind Speed U V

33
H14C - GFS T14C - GFS
BIAS
RMS
850mb
34
H14C - GFS T14C - GFS
BIAS
RMS
850mb
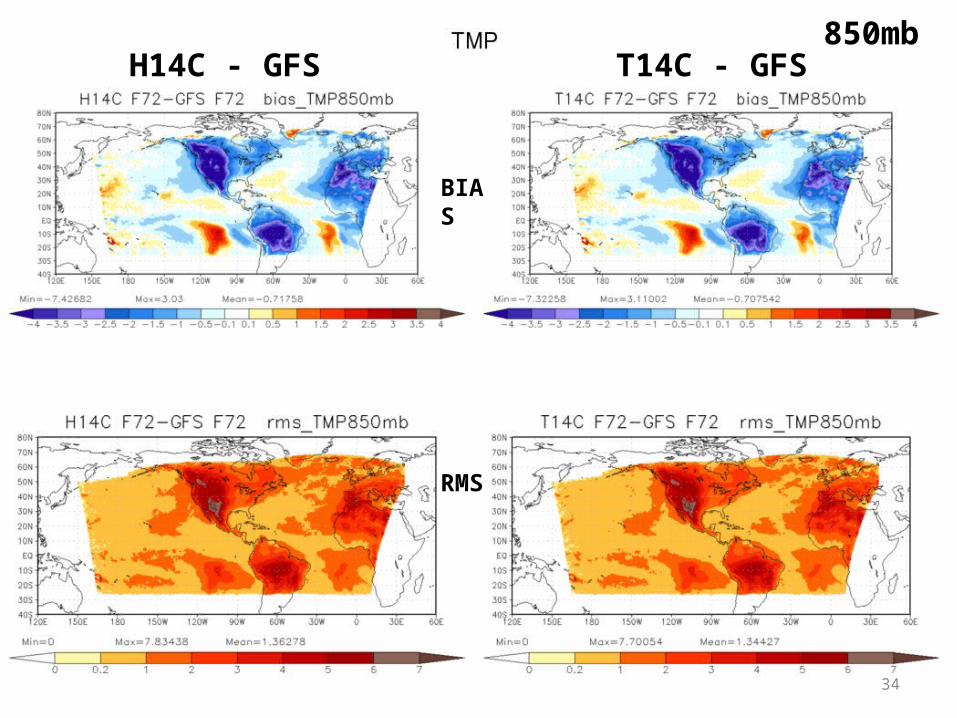
35
H14C - GFS T14C - GFS
BIAS
RMS
850mb
36
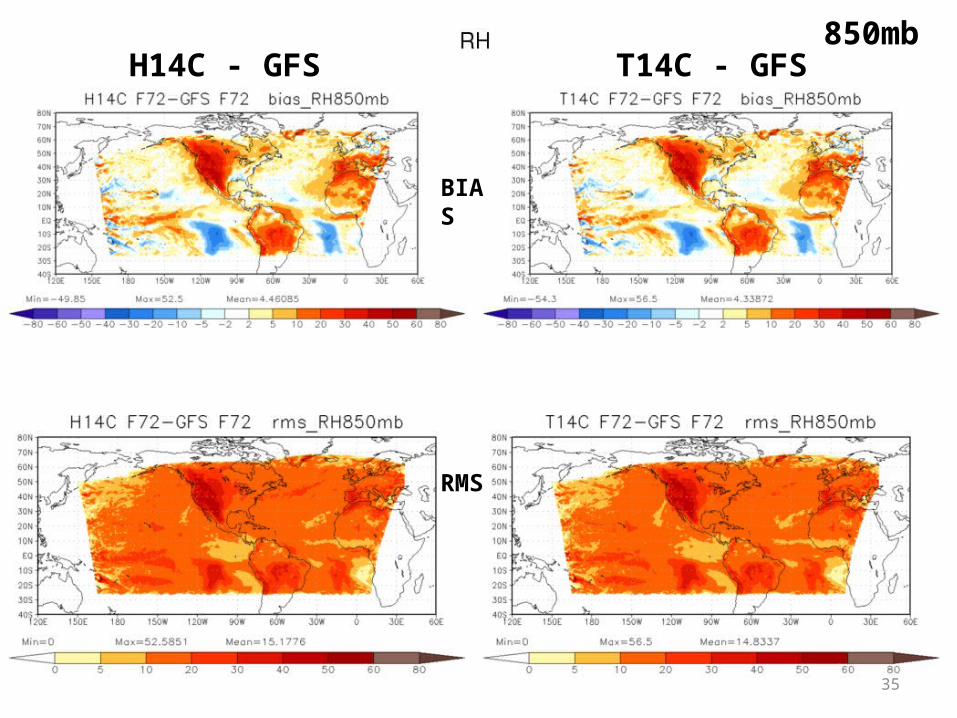
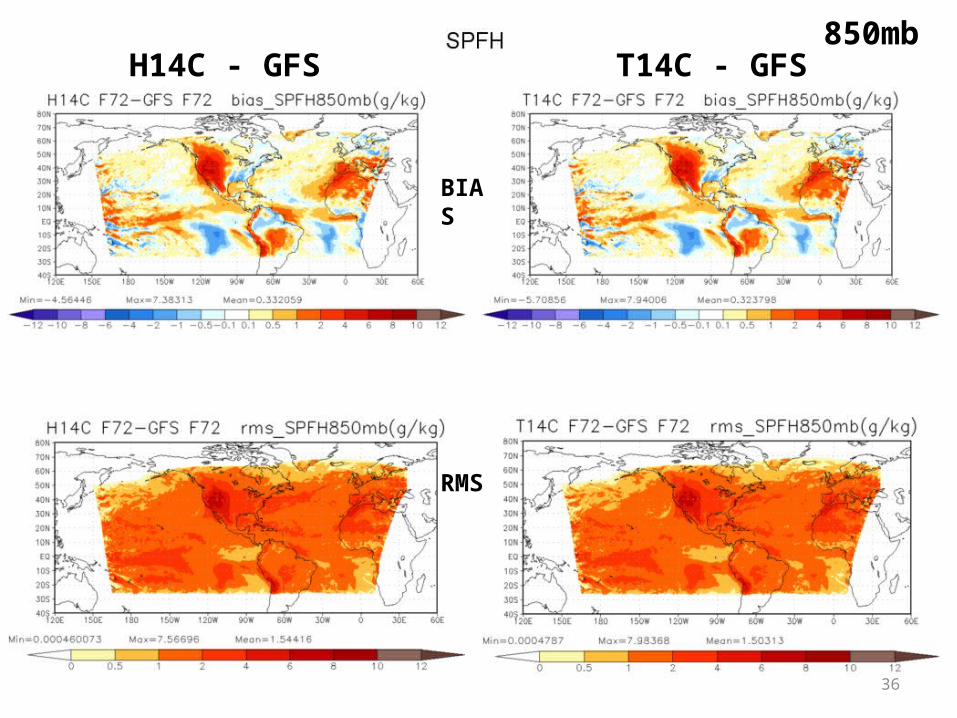
H14C - GFS T14C - GFS
BIAS
RMS
850mb
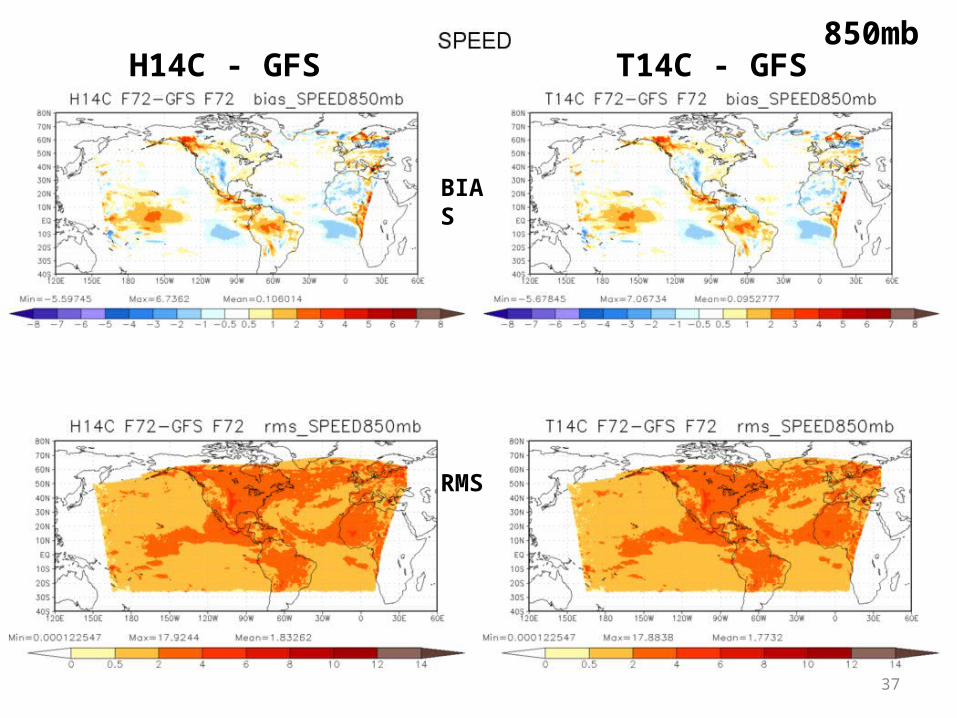
37
H14C - GFS T14C - GFS
BIAS
RMS
850mb
38
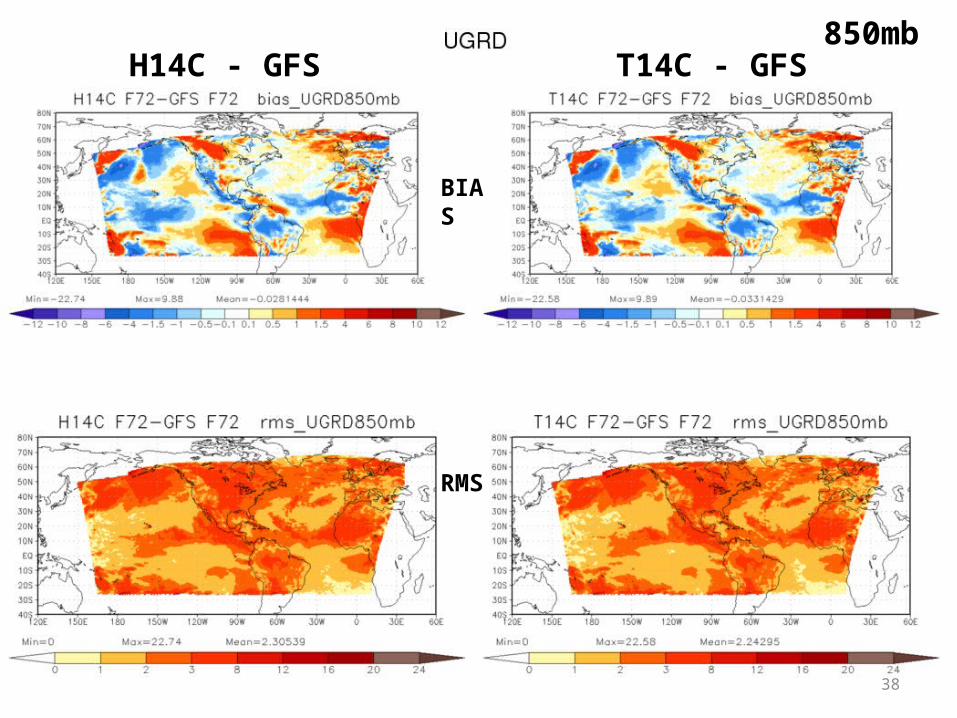
H14C - GFS T14C - GFS
BIAS
RMS
850mb
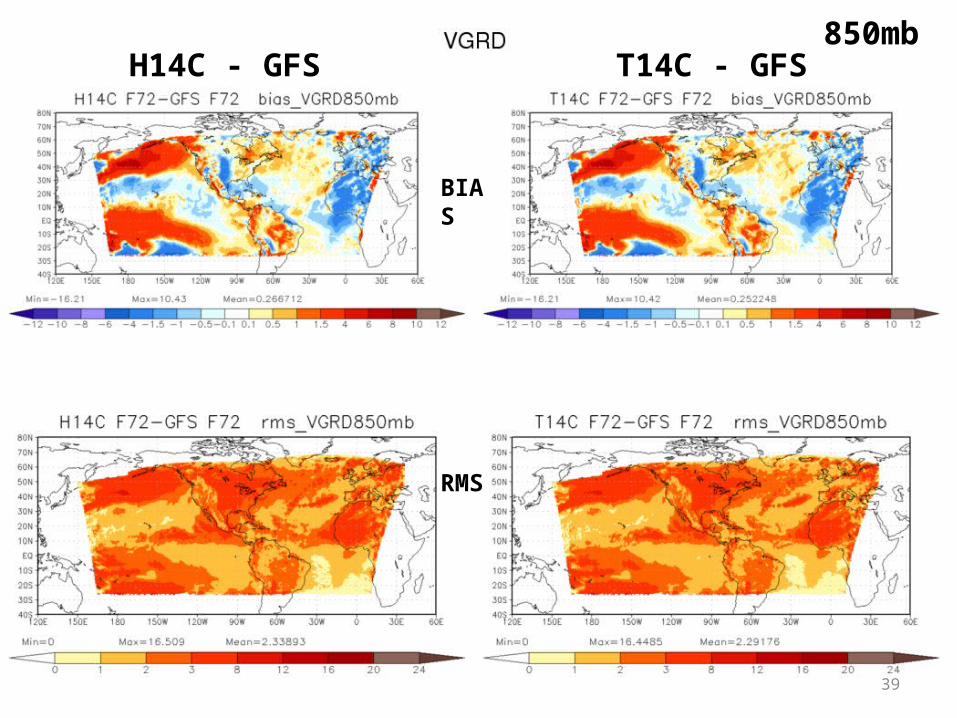
39
H14C - GFS T14C - GFS
BIAS
RMS
850mb
40
Summary1. HWRF analysis vs GFS analysis T14C (without GSI) is better than H14C (with GSI) in terms of scalar fields (HGT, TMP, RH, SPFH). U/V differences are large for both. POST is very likely the error source.
2. HWRF F72 vs GFS analysis Largest difference is temperature over land. Both colder/wetter than GFS analysis. Spatial patterns of other differences somewhat correlate with TMP. Difference between T14C and H14C after 72hr integration not obvious, with T14C slightly better.
3. HWRF F72 vs GFS F72 Very similar, except temperature over land. Seem that spatial patterns of other variables ~ tmp. Better LSM will make comparison better.

41

42
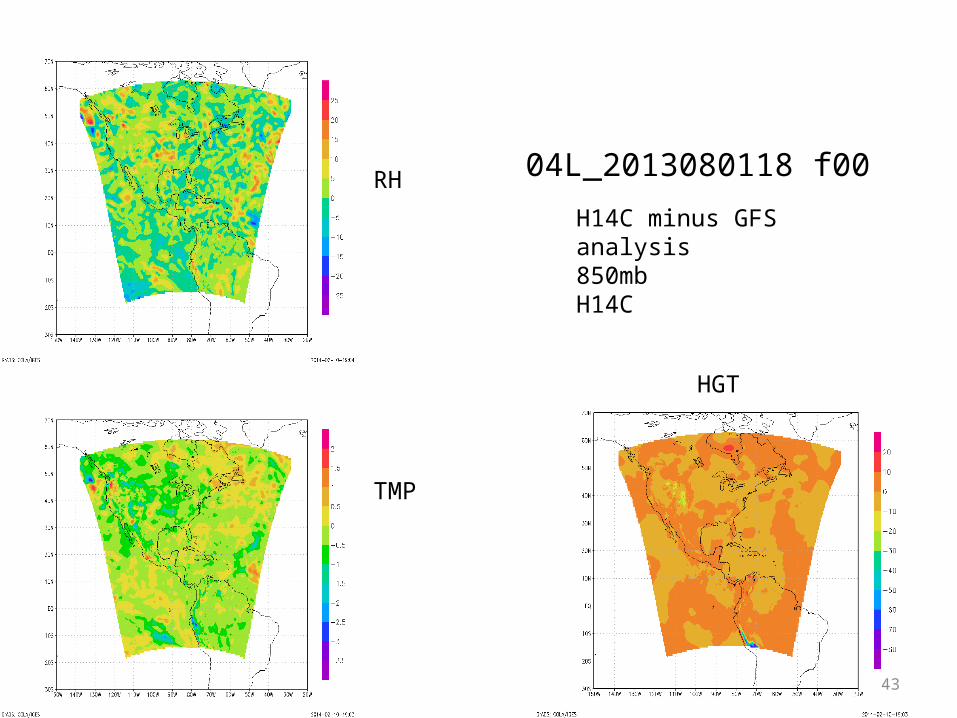
43
04L_2013080118 f00
TMP
HGT
RH
TMP
H14C minus GFS analysis850mbH14C

44
U V
Speed