comparing and combining eye gaze and interface actions · pdf filecomparing and combining eye...
TRANSCRIPT
adfa, p. 1, 2011.
© Springer-Verlag Berlin Heidelberg 2011
Comparing and Combining Eye Gaze and Interface
Actions for Determining User Learning with an
Interactive Simulation
Samad Kardan1 and Cristina Conati
1
1 Department of Computer Science, University of British Columbia
2366 Main Mall, Vancouver, BC, V6T1Z4, Canada
{skardan,conati}@cs.ubc.ca
Abstract. This paper presents an experimental evaluation of eye gaze data as a
source for modeling user’s learning in Interactive Simulations (IS). We com-
pare the performance of classifier user models trained only on gaze data vs.
models trained only on interface actions vs. models trained on the combination
of these two sources of user interaction data. Our long-term goal is to build user
models that can trigger adaptive support for students who do not learn well with
ISs, caused by the often unstructured and open-ended nature of these environ-
ments. The test-bed for our work is the CSP applet, an IS for Constraint Satis-
faction Problems (CSP). Our findings show that including gaze data as an addi-
tional source of information to the CSP applet’s user model significantly im-
proves model accuracy compared to using interface actions or gaze data alone.
Keywords: Eye tacking, Eye Movement Data, Interface Actions, Interactive
Simulations, User Classification, Clustering, Data Mining for User Modeling
1 Introduction
With increasing interest in using Interactive Simulations (IS) for education and train-
ing, it has become evident that not all students learn well from the rather unstructured
and open-ended form of interaction that these e-learning environments provide [1, 2].
The long-term goal of our research is to devise mechanisms to provide guidance dur-
ing interaction with an IS, personalized to the needs of each individual student. De-
tecting these needs, however, is challenging because there is still limited knowledge
of which behaviors are indicative of effective vs. non-effective interactions with an
IS. Our general approach is to discover these behaviors from data, using (i) clustering
to identify students who interact similarly with an IS, (ii) association rule mining to
extract the relevant behaviors from each cluster, and (iii) finding ways to map these
behaviors to learning performance. The resulting data is used to train a user model
that recognizes the salient behaviors when a new user interacts with the system, and
suggests interventions if those behaviors were labeled to be not conducive to learning.
In previous work, we showed the effectiveness of this approach when only interface
actions are used for clustering and classifying users [3]. We then started looking at the
potential of gaze data as an additional source of information for assessing how well a
user learns with an IS [4]. The results in [4] were encouraging, because they showed
that gaze data alone can help distinguish those users who learn from an IS and those
who do not. The results, however, related to the performance of a classifier that pre-
dicts user learning after seeing gaze data from a complete interaction session. Thus,
they do not tell us if and how soon during interaction, gaze data can be used to predict
learning performance, which is crucial to provide adaptive support as students work
with a simulation.
In this paper, we address this limitation by evaluating the over-time performance of
classifiers that rely only on gaze data to determine learning, i.e. the performance of
the classifier as a function of the gaze data available over time. We also thoroughly
investigate the relative value of gaze data for user modeling in ISs by comparing the
over-time performance of models trained on gaze data only vs. models trained on
interface actions only vs. models trained on both data sources. While these compari-
sons are similar in nature to those described in [5, 6], the main difference is that this
previous work focused on task-specific gaze patterns predefined a priori, while in our
work we analyze gaze data in a much more general and automatic way, using task-
independent gaze features and automatic clustering to discover the relevant patterns.
An additional contribution of this paper is an extension to the user modeling frame-
work described in [3] to improve the effectiveness of behavior clustering. The exten-
sion is a mechanism known as the hybrid approach to clustering that extends the typi-
cal clustering used in [3]. When information on user learning performance is available
for a given data set, the hybrid approach leverages this information to guide clustering
so that users are grouped in terms of both their distinguishing behaviors and their
learning performance. We show that on-line classifiers trained on the groupings gen-
erated by the hybrid approach are significantly more accurate than classifiers trained
on groupings defined solely based on learning gain.
In the rest of the paper, we first discuss related work. Next, we briefly describe the
CSP applet (the IS we have been using as a test-bed for our research). Then, we sum-
marize our user modeling framework, followed by a description of the various dimen-
sions of our evaluation (datasets, ways to generate the training sets, classifiers eva-
luated). Subsequently we report the results of the evaluation, and then present a
second method for combining eye gaze and interface action data (using ensemble
models) and its performance. Finally, we conclude with a discussion of future work.
2 Related work
Eye tracking has long been used in psychology for understanding cognition and per-
ception, but in recent years there has been increasing interest in leveraging eye-
tracking data also in HCI and in user modeling. Most of the existing work still uses
gaze data for off-line analysis of processes of interest, as it is traditionally done in
psychology. For instance, gaze data has been used to assess word relevance in a read-
ing task [7], to assess how well users process a given information visualization [8], to
understand how users attend to adaptive hints in an educational game [9], to evaluate
the impact of user differences on gaze patterns while processing a visualization [10],
and to analyze attention to an open learner model [11].
Some researchers, on the other hand, started to investigate gaze data as a source for
real-time modeling of users. Some examples of real-time use of gaze data include:
assessing user motivation during interaction with an intelligent tutoring system (ITS)
[12]; determining a variety of elements relevant to supporting users during visualiza-
tion processing [13]; and detecting and reacting to disengagement in a gaze-reactive
ITS [14]. Most closely related to our research on modeling users in ISs is the work by
Conati and Merten [5] and Amershi and Conati [6]. They found that tracking a task-
specific gaze pattern defined a priori helped modeling user learning with an IS for
mathematical functions. We extend this work by looking at a much broader range of
general eye tracking features that are either task independent or based solely on iden-
tifying the main interface components of the target IS. This is an important distinc-
tion, for two reasons: (i) pre-defining gaze patterns that indicate learning may not
always be possible, due to the often unstructured and open-ended nature of ISs; (ii)
task specific patterns likely do not transfer to a different IS. Additionally, while [6]
only evaluates the performance of a model that leverages both interface actions and
gaze data, our work specifically compares and combines eye gaze with interface ac-
tions to better evaluate the added value of gaze data for user modeling in ISs.
In the field of Educational Data Mining, clustering has been applied to different ap-
plications for discovering groups of similar users. Relevant to our work, in problem
solving tasks, clustering has been used to find better parameter settings for models
that assess student knowledge [15, 16]. Closer to our work, Shih and Koedinger em-
ployed clustering to discover student learning tactics and how these tactics relate to
learning in a problem solving environment [17]. The clustering is done on sequences
of student actions (namely, attempting to answer the problem and asking for help)
using Expectation Maximization and Hidden Markov Models. Here, we are investi-
gating student behaviors in ISs, where interactions tend to be open-ended and typical-
ly there are many valid actions available at each point which makes looking at se-
quences of user actions computationally expensive (see [3], for a detailed discussion).
Thus, we calculate features that summarize the interactions of each user, and then
cluster users based on these features to find users with similar behaviors. Then, we
extract the salient behaviors of each cluster which is orthogonal to clustering similar
sequences of actions from different users together as done in [17].
3 The AISpace CSP applet
This section describes the Constraint Satisfaction Problem (CSP) applet, which is the
IS we have been using as the test-bed for our research. The CSP applet, shown in Fig.
1, is one of a collection of interactive tools for learning artificial intelligence algo-
rithms, called AIspace [18]. Algorithm dynamics are demonstrated via interactive
visualizations on graphs by the use of color and highlighting, and graphical state
changes are reinforced through textual messages.
A CSP consists of a set of variables, variable domains, and a set of constraints on
legal variable-value assignments. Solving a CSP requires finding an assignment that
satisfies all constraints. The CSP applet simulates application of the Arc Consistency
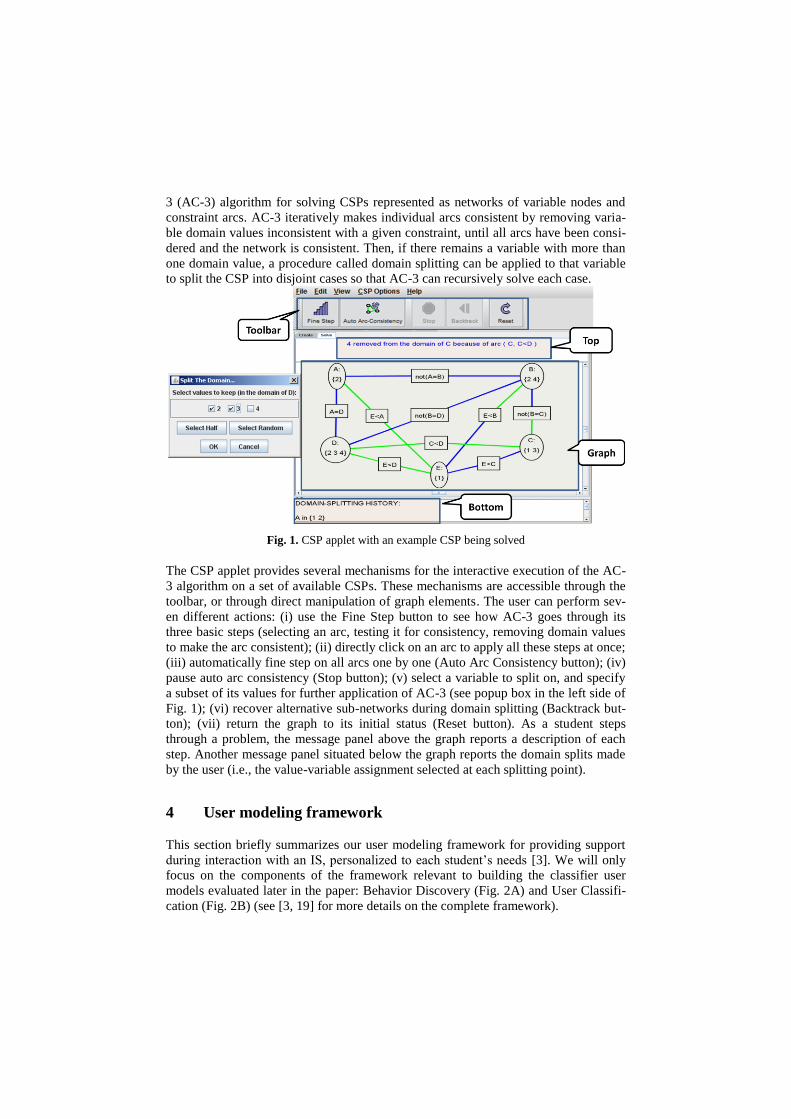
3 (AC-3) algorithm for solving CSPs represented as networks of variable nodes and
constraint arcs. AC-3 iteratively makes individual arcs consistent by removing varia-
ble domain values inconsistent with a given constraint, until all arcs have been consi-
dered and the network is consistent. Then, if there remains a variable with more than
one domain value, a procedure called domain splitting can be applied to that variable
to split the CSP into disjoint cases so that AC-3 can recursively solve each case.
Fig. 1. CSP applet with an example CSP being solved
The CSP applet provides several mechanisms for the interactive execution of the AC-
3 algorithm on a set of available CSPs. These mechanisms are accessible through the
toolbar, or through direct manipulation of graph elements. The user can perform sev-
en different actions: (i) use the Fine Step button to see how AC-3 goes through its
three basic steps (selecting an arc, testing it for consistency, removing domain values
to make the arc consistent); (ii) directly click on an arc to apply all these steps at once;
(iii) automatically fine step on all arcs one by one (Auto Arc Consistency button); (iv)
pause auto arc consistency (Stop button); (v) select a variable to split on, and specify
a subset of its values for further application of AC-3 (see popup box in the left side of
Fig. 1); (vi) recover alternative sub-networks during domain splitting (Backtrack but-
ton); (vii) return the graph to its initial status (Reset button). As a student steps
through a problem, the message panel above the graph reports a description of each
step. Another message panel situated below the graph reports the domain splits made
by the user (i.e., the value-variable assignment selected at each splitting point).
4 User modeling framework
This section briefly summarizes our user modeling framework for providing support
during interaction with an IS, personalized to each student’s needs [3]. We will only
focus on the components of the framework relevant to building the classifier user
models evaluated later in the paper: Behavior Discovery (Fig. 2A) and User Classifi-
cation (Fig. 2B) (see [3, 19] for more details on the complete framework).
In Behavior Discovery (Fig. 2A) user interaction data is first processed into feature
vectors representing each user. Then, these vectors are clustered in order to (i) identi-
fy users with similar interaction behaviors, and (ii) determine which interaction beha-
viors are effective or ineffective for learning. The distinctive interaction behaviors in
each cluster are identified via association rule mining [20]. This process extracts the
common behavior patterns in terms of Class Association Rules (CAR) in the form of
X c, where X is a set of feature-value pairs and c is the predicted class label for the
data points where X applies. We use the Hotspot algorithm from the Weka datamin-
ing toolkit [21] for association rule mining, with an added initial parameter optimiza-
tion step (see [3] for details). In order to associate behaviors to learning performance,
it is first necessary to establish how the user groups generated by clustering relate to
learning. This can be done in different ways, depending on whether information on
the users’ learning performance is available or not:
─ If learning performance measures are not available, we face a problem of unsuper-
vised learning. In this case, clustering is done using k-means with a modified initia-
lization step (see [3] for more details on this technique and why it was selected). It
is then left to the judgment of a human expert to evaluate how each cluster and as-
sociated behaviors may relate to learning. Since we have access to a learning per-
formance measure, this case is not considered in this paper.
─ If learning performance measures are available, one possible approach is to gener-
ate the clusters solely based on interaction data, and then assign a label for each
cluster by comparing the average learning performance of the users in that cluster
with the performance of the users in the other clusters. This is the approach we
successfully adopted in [3] to support on-line classification of CSP applet users in-
to high and low learners (called the old approach from now on). It is possible,
however, that clustering solely based on behaviors do not generate groups with a
clear (i.e., statistically significant) difference in learning performance, making it
difficult to assign labels to the clusters automatically. To tackle this situation, we
propose a solution that leverages user performance data to guide the clustering
process, thus creating a hybrid approach (described in details in section 5.2).
Fig. 2. Behavior Discovery and User Classification in the user modeling framework
In User Classification (Fig. 2B), the labeled clusters and the corresponding Class
Association Rules extracted in Behavior Discovery are used as training data to build
an on-line classifier student model (rule-based classifier from now on). As new users
interact with the system, they are classified in real-time into one of the clusters gener-
ated by Behavior Discovery, based on a membership score that summarizes how well
(i.e. higher is better) the user’s behaviors match the discovered behavior patterns (i.e.,
association rules) for each cluster. This score is the normalized sum of weights of the
satisfied rules over all the rules for each cluster as described in [3].
5 Evaluation Dimensions
The interaction data used as features by a classifier user model to perform on-line user
classification can include a variety of sources. As we discussed in the introduction, in
this paper we want to compare using features based on interface actions vs. eye gaze
data vs. a combination of the two (see section 5.1). We also want to evaluate the ef-
fectiveness of each of the two major components of our classifier user model: (1)
using the hybrid approach (described in section 5.2) to generate the training set for the
classifiers (i.e. groups of users with labels that describe their learning performance)
compared to a conventional approach; 2) using a rule-based classifier for learning vs.
other available classifiers (see section 5.3). Thus, we have three dimensions in our
evaluation: feature set, approach for training set generation, and type of classifier. In
the rest of this section, we describe each of these three evaluation dimensions.
5.1 Different feature sets for classification
We calculated three sets of features for each user. The data was collected from a user
study with 45 computer science students. Each participant: (i) studied a textbook
chapter on the AC-3 algorithm; (ii) wrote a pre-test on the concepts covered in the
chapter; (iii) used the CSP applet to study two CSPs, while her gaze was tracked with
a Tobii T120 eye-tracker; (iv) took a post-test analogous to the pre-test [4].
The first set of features consists of statistical measures that summarize a user’s inter-
face actions (ACTION dataset from now on). We calculated usage frequency for each
action, as well as mean and standard deviation of time interval between actions (simi-
lar to [3]) for a total of 12,308 actions. As described in section 3, there are 7 actions
available on the interface resulting in 21 features (none were highly correlated).
The second set of features captures user’s attention patterns using gaze information
collected by the eye-tracker (EYE dataset from now on), namely fixations (i.e., main-
taining eye gaze at one point on the screen) and saccades (i.e., a quick movement of
gaze from one fixation point to another). As was done in [4], the features were de-
rived by computing a variety of statistics (sum (total), average, standard deviation and
rate) as appropriate, for the measures shown in Table 1. These measures were taken
both over the full CSP applet window as well as over four Areas of Interest (AOI)
defining salient visual elements of the applet (Toolbar, Top, Graph and Bottom shown
in Fig. 1). In addition to the features above, following [4], the proportion of transi-
tions between different AOI pairs was also calculated. Unlike the ACTION dataset, of
the initial 67 features in the EYE dataset, we found and removed 16 features that were
highly correlated (r > 0.7), reducing the final number of eye-related features to 51.
Finally, the third set of features (ACTION+EYE dataset) is obtained by combining
the two feature sets described above. For each user, the ACTION and EYE feature
vectors are concatenated to form a new vector with 72 features. This process generat-
ed a dataset with 45 datapoints (participants) with 72 dimensions (features).
Given these three datasets, we want to test the following hypothesis:
H1: Combining both eye tracking and interface action data significantly enhances the
performance of the resulting user model, as opposed to using either eye tracking or
interface actions data alone.
Table 1. Description of basic eye tracking measures
Measure Description
Fixation rate Rate of eye fixations per milliseconds
Number of Fixations Number of eye fixations detected during an interval of interest
Fixation Duration Time duration of an individual fixation
Saccade Length Distance between the two fixations delimiting the saccade
Relative Saccade Angles The angle between the two consecutive saccades
Absolute Saccade Angles The angle between a saccade and the horizontal axis
Transitions between AOIs Transition of user’s gaze between two Areas of Interest
5.2 Different approaches for training set generation
As mentioned earlier, the first step in our approach for building a classifier user model
is to identify groups of users that interact similarly with the learning environment and
then label these groups based on the learning performance of their members, in order
to provide the training set for the classifier. As pointed out in section 4, our old ap-
proach for generating this training set relied on clustering users solely based on their
interactions. However, without a clear (i.e., statistically significant) difference in av-
erage learning performance of different clusters, it is difficult to assign labels to the
clusters found. We encountered this problem when using clustering on the EYE data-
set. The only requirement for interpretability of the clusters in our approach is that
there should be a significant difference between the average learning performances of
members in different clusters, as measured by an appropriate statistical test. In other
words, since we know the users in each cluster behave similarly, just knowing that the
members of a cluster achieve significantly higher/lower average performance than
other clusters, is enough to interpret salient behaviors observed in that cluster as ef-
fective/ineffective. Based on this requirement, we propose the hybrid approach first
introduced in section 4. The hybrid approach finds the best cluster set (in terms of
sum of within-cluster distances) with a significant difference in learning performance.
The measure of learning performance used in this paper is Proportional Learning Gain
(PLG), i.e., the ratio of the difference between post-test and pre-test, over the maxi-
mum possible gain; described in percentage ratio.
When determining the optimal number of clusters with the hybrid approach using the
three different feature sets described in section 5.1 (ACTION, EYE and
ACTION+EYE), we found that two clusters was always the optimal number of user
groups, but with slightly different composition. We use Fleiss' kappa (a measure of
agreement between more than two raters) for comparing the three different sets of
user labels thus generated and found high agreement (kappa = 0.701). This kappa
value shows that the two groups detected using each feature set share the same core of
users (supporting the relevance of using clustering to detect these groups), with few
users that are labeled differently when using different sources of data (showing that
there are non-overlapping information captured by each source). For illustration, the

size and performance measures associated with the two clusters generated by the hy-
brid approach applied to the ACTION+EYE dataset is shown in Table 2, where LLG
stands for Low Learning Gain and HLG stands for High Learning Gain. The differ-
ence in PLG is significant (p = 0.017 < 0.05) with a medium effect size (d = 0.625).
When the performance measure of interest for classification is available (in our case,
PLG), the conventional method for creating a training set of labeled classes is to di-
vide the performance spectrum into different ranges and putting users within each
range into one group. Thus, in our evaluation we want to compare our hybrid ap-
proach for generating the training set against the standard approach that relies solely
on PLG1. We generate what we call the PLG-based training set by dividing users into
two groups based on the median of the PLG measure (45.83). Table 2 reports the size
and PLG measures for the corresponding groups.
Table 2. Descriptive statistics of the training sets generated via different methods
Hybrid on ACTION+EYE PLG-based
HLG Number of users 19 22
Average (std. dev.) 53.29 (SD = 22.79) 68.27 (SD = 12.39)
LLG Number of users 26 23
Average (std. dev.) 32.45 (SD = 39.33) 15.40 (SD = 30.29)
When grouping users together, the hybrid approach relies on both PLG as well as the
similarity in user interaction data as opposed to only relying on PLG. Thus, we argue
that it can generate better performing user models since the user models can only rely
on user interaction data when classifying users. This is the second hypothesis we will
test in our evaluation:
H2: The hybrid approach for training set generation outperforms the conventional
PLG-based approach in terms of user model performance.
5.3 Different types of classifiers
Our goal is to evaluate the rule-based classifier generated by our user modeling
framework. Thus, we compare its performance with a battery of ten different classifi-
ers available in the Weka toolkit on the EYE, ACTION and ACTION+EYE datasets.
These classifiers are C4.5, Support Vector Machine, Linear Ridge Regression, Binary
Logistic Regression, Multilayer Perceptron, as well as Random Subspace and Ada-
Boost with different base classifiers. We tested the 10 Weka classifiers on each of the
three datasets, and report the results for the classifier with the highest performance,
which we will simply refer to as the Weka classifier. The third hypothesis tested in
this study is the following:
H3: The rule-based classifier will have better performance compared to the best Weka
classifier on each dataset.
1 Note that, the hybrid approach is an improvement over the old approach used in [3], to ad-
dress cases when the latter approach fails to find clusters with significant learning difference
(e.g., the EYE dataset). In other cases, e.g. the dataset used in [3], both approaches produce
the same cluster set; therefore, a comparison between these two approaches is not necessary.
6 Results and discussion
In this section, we present the evaluation results across each of the three dimensions
described in the previous section. We compare the performance of the rule-based and
Weka classifiers described in the previous section in terms of their average over-time
accuracy in classifying new users as high or low learners. This means that, over equal
time intervals, the interaction features for a new user are calculated cumulatively from
the start of the interaction, and the classifier is asked to provide a label for this. In [3],
classifier accuracy was calculated after each user action, because only actions were
used as data sources. Here, however, we have two different data sources, which pro-
vide information at different rates (typically length of a fixation is much shorter than
the time between two interface actions). Thus, we compute current accuracy of the
classifier at intervals of 30 seconds, i.e., long enough for observing at least one user
action and a fair number of fixations. Then, to be able to combine accuracy data
across users (with different interaction durations), we retrieve current accuracy after
every one percent of user interaction, calculating 100 accuracy points for each user.
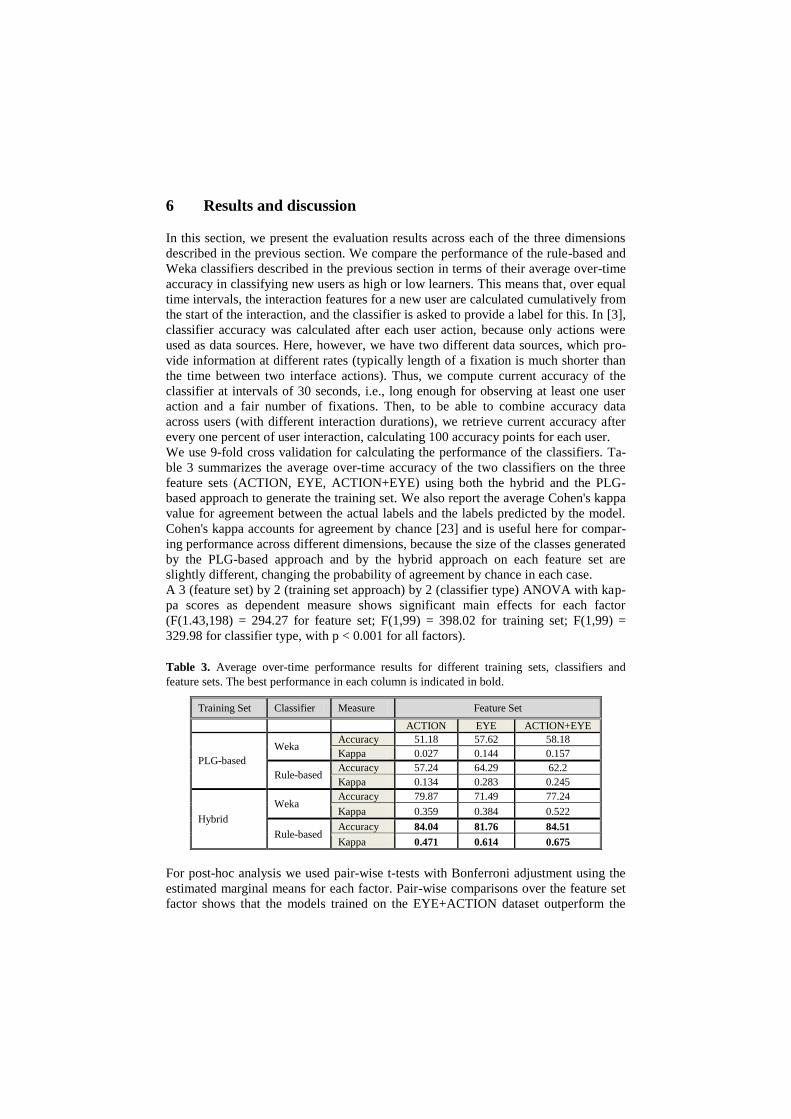
We use 9-fold cross validation for calculating the performance of the classifiers. Ta-
ble 3 summarizes the average over-time accuracy of the two classifiers on the three
feature sets (ACTION, EYE, ACTION+EYE) using both the hybrid and the PLG-
based approach to generate the training set. We also report the average Cohen's kappa
value for agreement between the actual labels and the labels predicted by the model.
Cohen's kappa accounts for agreement by chance [23] and is useful here for compar-
ing performance across different dimensions, because the size of the classes generated
by the PLG-based approach and by the hybrid approach on each feature set are
slightly different, changing the probability of agreement by chance in each case.
A 3 (feature set) by 2 (training set approach) by 2 (classifier type) ANOVA with kap-
pa scores as dependent measure shows significant main effects for each factor
(F(1.43,198) = 294.27 for feature set; F(1,99) = 398.02 for training set; F(1,99) =
329.98 for classifier type, with p < 0.001 for all factors).
Table 3. Average over-time performance results for different training sets, classifiers and
feature sets. The best performance in each column is indicated in bold.
Training Set Classifier Measure Feature Set
ACTION EYE ACTION+EYE
PLG-based
Weka Accuracy 51.18 57.62 58.18
Kappa 0.027 0.144 0.157
Rule-based Accuracy 57.24 64.29 62.2
Kappa 0.134 0.283 0.245
Hybrid
Weka Accuracy 79.87 71.49 77.24
Kappa 0.359 0.384 0.522
Rule-based Accuracy 84.04 81.76 84.51
Kappa 0.471 0.614 0.675
For post-hoc analysis we used pair-wise t-tests with Bonferroni adjustment using the
estimated marginal means for each factor. Pair-wise comparisons over the feature set
factor shows that the models trained on the EYE+ACTION dataset outperform the
models trained either on EYE or ACTION feature sets (p < 0.001), thus supporting
H1. Pair-wise comparisons over the training set factor shows that the hybrid approach
outperforms the PLG-based approach (p < 0.001), thus supporting H2. Finally, pair-
wise comparisons over the classifier type factor shows that the rule-based classifier
significantly outperforms the Weka classifier (p < 0.001), thus supporting H3. The
findings show that we were able to extend our user modeling framework with an ef-
fective training set generation approach (H2), and the updated framework is able to
build models that employ interface actions and eye gaze data effectively (H3), rein-
forcing the validity of our findings regarding the added value of eye gaze data (H1).
7 Ensemble model for combining EYE and ACTION features
The superior performance generated by the feature set that combines gaze and action
information indicates that there is an advantage in leveraging both data sources. Thus,
we decided to investigate whether we could further this advantage by using a more
sophisticated approach to combine gaze and action information. In particular, for each
combination of training set (hybrid and PLG-based) and classifier type (rule-based vs.
Weka) we created an ensemble classifier [24] that classifies a new user by using ma-
jority voting among the three following classifiers on the ACTION+EYE dataset: one
trained using only the action-based features subset, one trained using the eye-based
features subset, and one trained over the complete ACTION + EYE feature set. This
ensemble model benefits from the added information captured by the eye gaze data (if
any) by being able to correctly classify the user in some of the cases where the clas-
sifier trained solely on the action-based features fails. Moreover, in some cases where
combining the features in the way that it is done in previous section on the
ACTION+EYE dataset, is introducing some noise in the dataset, thus diluting the
information value gained, the classifiers trained on eye-based subset and action-based
subset will not be affected and will be able to capture characteristics of each user as
detected by each data source. Therefore, we hypothesize that:
H4: Each ensemble model outperforms the individual model equivalent to it (i.e., the
model with the same classifier type and training set generation approach).
Table 4 shows the performance results for the ensemble models (measured by kappa
scores). In order to evaluate the performance of the ensemble models vs. the individu-
al models described in previous section, we performed a 2 (model type) by 2 (training
set approach) by 2 (classifier type) ANOVA with kappa scores for the ACTION+EYE
dataset as dependent measure. Here, we are only interested in testing to see whether
there is a main effect for the model type factor (i.e., individual vs. ensemble). The
analysis shows a significant main effect for the model type factor (F(1,99) = 165.420,
with p < 0.001). Post-hoc analysis using pair-wise t-tests with Bonferroni adjustment
shows that the ensemble models significantly (p < 0.001) outperform their individual
model counterparts thus supporting H4. Particularly, we are interested in the best
performing individual model (rule-based model trained using hybrid training set) and
its ensemble equivalent, where in addition to improved average over-time perfor-
mance (86.56% vs. 84.51%), the ensemble model exhibits a more balanced perfor-
mance across the HLG and LLG classes as well (85.33% and 87.52% for the ensem-
ble vs. 79% and 88.54% for the individual model respectively).
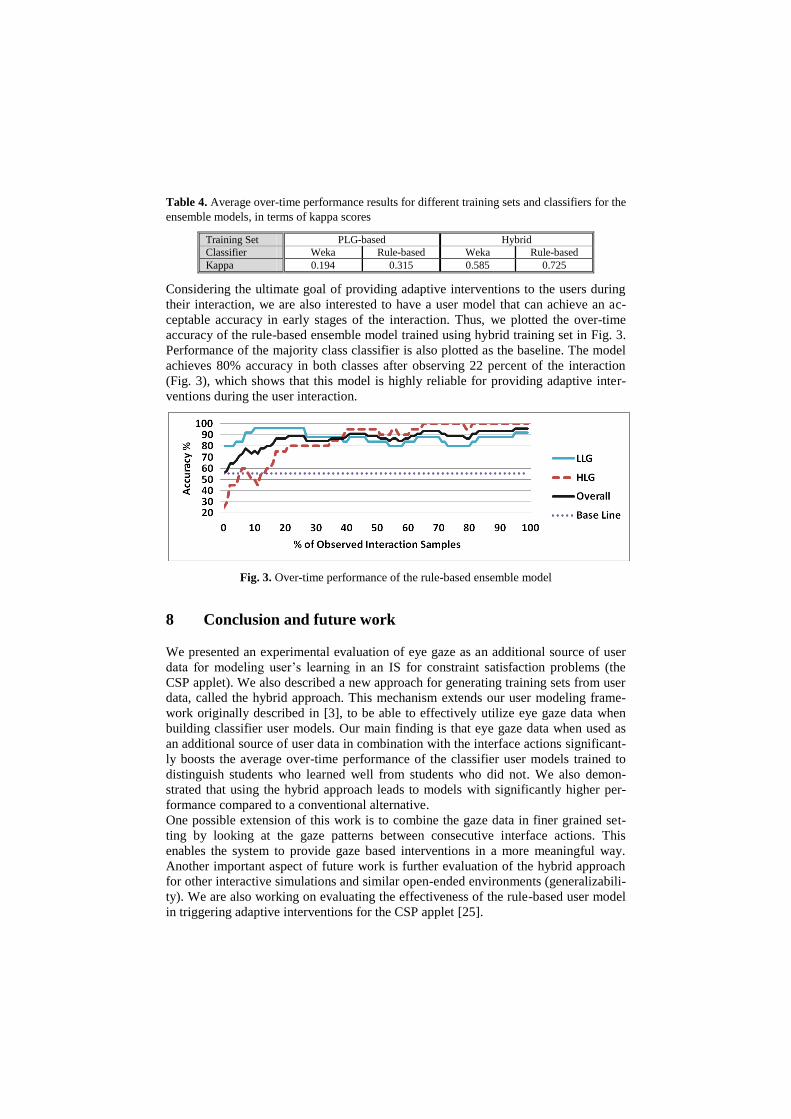
Table 4. Average over-time performance results for different training sets and classifiers for the
ensemble models, in terms of kappa scores
Training Set PLG-based Hybrid
Classifier Weka Rule-based Weka Rule-based
Kappa 0.194 0.315 0.585 0.725
Considering the ultimate goal of providing adaptive interventions to the users during
their interaction, we are also interested to have a user model that can achieve an ac-
ceptable accuracy in early stages of the interaction. Thus, we plotted the over-time
accuracy of the rule-based ensemble model trained using hybrid training set in Fig. 3.
Performance of the majority class classifier is also plotted as the baseline. The model
achieves 80% accuracy in both classes after observing 22 percent of the interaction
(Fig. 3), which shows that this model is highly reliable for providing adaptive inter-
ventions during the user interaction.
Fig. 3. Over-time performance of the rule-based ensemble model
8 Conclusion and future work
We presented an experimental evaluation of eye gaze as an additional source of user
data for modeling user’s learning in an IS for constraint satisfaction problems (the
CSP applet). We also described a new approach for generating training sets from user
data, called the hybrid approach. This mechanism extends our user modeling frame-
work originally described in [3], to be able to effectively utilize eye gaze data when
building classifier user models. Our main finding is that eye gaze data when used as
an additional source of user data in combination with the interface actions significant-
ly boosts the average over-time performance of the classifier user models trained to
distinguish students who learned well from students who did not. We also demon-
strated that using the hybrid approach leads to models with significantly higher per-
formance compared to a conventional alternative.
One possible extension of this work is to combine the gaze data in finer grained set-
ting by looking at the gaze patterns between consecutive interface actions. This
enables the system to provide gaze based interventions in a more meaningful way.
Another important aspect of future work is further evaluation of the hybrid approach
for other interactive simulations and similar open-ended environments (generalizabili-
ty). We are also working on evaluating the effectiveness of the rule-based user model
in triggering adaptive interventions for the CSP applet [25].

9 References
1. Shute, V.J.: A comparison of learning environments: All that glitters. Computers as cogni-
tive tools. pp. 47–73. Hillsdale, NJ, England: Lawrence Erlbaum Associates, Inc (1993).
2. Holzinger, A., Kickmeier-Rust, M.D., Wassertheurer, S., Hessinger, M.: Learning perfor-
mance with interactive simulations in medical education: Lessons learned from results of
learning complex physiological models with the HAEMOdynamics SIMulator. Computers
& Education. 52, 292–301 (2009).
3. Kardan, S., Conati, C.: A Framework for Capturing Distinguishing User Interaction Beha-
viours in Novel Interfaces. Proc. of the 4th Int. Conf. on Educational Data Mining. pp. 159-
168. , Eindhoven, the Netherlands (2011).
4. Kardan, S., Conati, C.: Exploring Gaze Data for Determining User Learning with an Interac-
tive Simulation. In: Masthoff, J., Mobasher, B., Desmarais, M., and Nkambou, R. (eds.) Us-
er Modeling, Adaptation, and Personalization. pp. 126–138. Springer Berlin / Heidelberg
(2012).
5. Conati, C., Merten, C.: Eye-tracking for user modeling in exploratory learning environ-
ments: An empirical evaluation. Knowledge-Based Systems. 20, 557–574 (2007).
6. Amershi, S., Conati, C.: Combining Unsupervised and Supervised Classification to Build
User Models for Exploratory Learning Environments. Journal of Educational Data Mining.
18–71 (2009).
7. Loboda, T.D., Brusilovsky, P., Brunstein, J.: Inferring word relevance from eye-movements
of readers. Proc. of the 16th int. conf. on Intelligent user interfaces. pp. 175–184. ACM,
New York, NY, USA (2011).
8. Loboda, T.D., Brusilovsky, P.: User-adaptive explanatory program visualization: evaluation
and insights from eye movements. User Modeling and User-Adapted Interaction. 20, 191–
226 (2010).
9. Muir, M., Conati, C.: An Analysis of Attention to Student – Adaptive Hints in an Educa-
tional Game. In: Cerri, S.A., Clancey, W.J., Papadourakis, G., and Panourgia, K. (eds.) In-
telligent Tutoring Systems. pp. 112–122. Springer Berlin Heidelberg (2012).
10. Toker, D., Conati, C., Steichen, B., Carenini, G.: Individual User Characteristics and Infor-
mation Visualization: Connecting the Dots through Eye Tracking. Proc. of the ACM
SIGCHI Conference on Human Factors in Computing Systems (CHI 2013), Paris, France,
2013. (to appear).
11. Mathews, M., Mitrovic, A., Lin, B., Holland, J., Churcher, N.: Do Your Eyes Give It Away?
Using Eye Tracking Data to Understand Students’ Attitudes towards Open Student Model
Representations. In: Cerri, S.A., Clancey, W.J., Papadourakis, G., and Panourgia, K. (eds.)
Intelligent Tutoring Systems. pp. 422–427. Springer Berlin Heidelberg (2012).
12. Qu, L., Johnson, W.L.: Detecting the Learner’s Motivational States in An Interactive Learn-
ing Environment. Proceedings of the 2005 conference on Artificial Intelligence in Educa-
tion: Supporting Learning through Intelligent and Socially Informed Technology. pp. 547–
554. IOS Press, Amsterdam, The Netherlands, The Netherlands (2005).
13. Steichen, B., Carenini, G., Conati, C.: User-Adaptive Information Visualization - Using eye
gaze data to infer visualization tasks and user cognitive abilities. Proceedings of the Interna-
tional Conference on Intelligent User Interfaces (IUI 2013). (to appear).
14. D’Mello, S., Olney, A., Williams, C., Hays, P.: Gaze tutor: A gaze-reactive intelligent tutor-
ing system. Int. J. Hum.-Comput. Stud. 70, 377–398 (2012).
15. Trivedi, S., Pardos, Z., Heffernan, N.: Clustering students to generate an ensemble to im-
prove standard test score predictions. Artificial Intelligence in Education. pp. 377–384
(2011).

16. Gong, Y., Beck, J.E., Ruiz, C.: Modeling Multiple Distributions of Student Performances to
Improve Predictive Accuracy. In: Masthoff, J., Mobasher, B., Desmarais, M.C., and Nkam-
bou, R. (eds.) User Modeling, Adaptation, and Personalization. pp. 102–113. Springer Ber-
lin Heidelberg (2012).
17. Shih, B., Koedinger, K.R., Scheines, R.: Unsupervised Discovery of Student Strategies. Pro-
ceedings of the 3rd International Conference on Educational Data Mining. pp. 201–210
(2010).
18. Amershi, S., Carenini, G., Conati, C., Mackworth, A.K., Poole, D.: Pedagogy and usability
in interactive algorithm visualizations: Designing and evaluating CIspace. Interacting with
Computers. 20, 64–96 (2008).
19. Kardan, S.: Data mining for adding adaptive interventions to exploratory and open-ended
environments. User Modeling, Adaptation, and Personalization. 365–368 (2012).
20. Zhang, C., Zhang, S.: Association rule mining: models and algorithms. Springer-Verlag,
Berlin, Heidelberg (2002).
21. Hall, M., Frank, E., Holmes, G., Pfahringer, B., Reutemann, P., Witten, I.H.: The WEKA
data mining software: an update. ACM SIGKDD Explorations Newsletter. 11, 10–18
(2009).
22. Thabtah, F.: A Review of Associative Classification Mining. The Knowledge Engineering
Review. 22, 37–65 (2007).
23. Ben-David, A.: About the relationship between ROC curves and Cohen’s kappa. Eng. Appl.
Artif. Intell. 21, 874–882 (2008).
24. Baker, R., Pardos, Z., Gowda, S., Nooraei, B., Heffernan, N.: Ensembling predictions of
student knowledge within intelligent tutoring systems. User Modeling, Adaption and Perso-
nalization. pp. 13–24 (2011).
25. Kardan, S., Conati, C.: Providing Adaptive Support in an Exploratory Learning Environ-
ment by Mining User Interaction Data. Proceedings of the 5th International Workshop on
Intelligent Support for Exploratory Environments (ISEE 2012), in conjunction with the 11th
International Conference on Intelligent Tutoring Systems (ITS 2012). , Chania - Greece
(2012).