comparing and aligning process representations · copromotor: dr. h. leopold. people are afraid to...
TRANSCRIPT

Comparing and Aligning Process Representations
Han van der Aa
November 5, 2017

SIKS Dissertation Series No. 2018-01The research reported in this thesis has been carried out under the auspices of SIKS,the Dutch Research School for Information and Knowledge Systems.
Promotiecommissie:prof.dr. Frank van Harmelen (Vrije Universiteit Amsterdam)prof.dr.ir. Wil van der Aalst (Eindhoven University of Technology)prof.dr. Matthias Weidlich (Humboldt University of Berlin, Germany)prof.dr. Barbara Weber (Technical University of Denmark, Denmark)prof.dr. Manfred Reichert (University of Ulm, Germany)
Copyright©2018, Han van der AaAll rights reserved unless otherwise stated.Typeset in LATEX by the author

VRIJE UNIVERSITEIT
Comparing and Aligning Process Representations
ACADEMISCH PROEFSCHRIFT
ter verkrijging van de graad van Doctor aande Vrije Universiteit Amsterdam,op gezag van de rector magnificus
prof.dr. V. Subramaniam,in het openbaar te verdedigen
ten overstaan van de promotiecommissievan de Faculteit der Betawetenschappenop vrijdag 26 januari 2018 om 11.45 uur
in de aula van de universiteit,De Boelelaan 1105
door
Johannes Hendrikus van der Aa
geboren te Sint-Oedenrode

promotor: prof.dr.ir. H.A. Reijerscopromotor: dr. H. Leopold

People are afraid to merge on freeways in Los Angeles
— Brett Easton Ellis (Less Than Zero)

Abstract
Processes within organizations can be highly complex chains of inter-related steps,involving numerous stakeholders and information systems. Due to this complexity,having access to the right information is vital to the proper execution and effectivemanagement of an organization’s business processes. A major challenge in this regardis that information on a single process is often spread out over numerous models, doc-uments, and systems. This phenomenon results from efforts to provide a variety ofprocess stakeholders with the information that is relevant to them, in a suitable format.However, this disintegration of process information also has considerable disadvan-tages for organizations. In particular, it can lead to severe maintenance issues, reducedexecution efficiency, and negative effects on the quality of process results. Against thisbackground, this doctoral thesis focuses on the spread of process information in orga-nizations and, in particular, on the mitigation of the negative aspects associated withthis phenomenon. The main contributions of this thesis are five techniques that focuson the alignment and comparison of process information from different informationalartifacts. Each of these techniques tackles a specific scenario involving multiple infor-mational artifacts that contain process information in different representation formats.Among others, we present automated techniques for the detection of inconsistenciesbetween process models and textual process descriptions, the alignment of processperformance measurements to process models, conformance-checking in the contextof uncertainty, and the matching of process models through the analysis of event-loginformation. We demonstrate the efficacy and usefulness of these techniques throughquantitative evaluations involving data obtained from real-world settings. Altogether,the presented work provides important contributions for the analysis, comparison, andalignment of process information in various representation formats through the devel-opment of novel concepts and techniques. The contributions, furthermore, provide ameans for organizations to improve the efficiency and quality of their processes.
iii


Samenvatting
Bedrijfsprocessen kunnen heel ingewikkeld in elkaar zitten, omdat zij vaak bestaan uitcomplexe ketens van onderling samenhangende stappen, waarbij bovendien een grootaantal belanghebbenden betrokken is en ook nog allerlei IT systemen een rol spelen.Door deze complexiteit is het voor de uitvoering en het onderhoud van bedrijfspro-cessen van cruciaal belang dat bij elke stap de juiste informatie over deze processenbeschikbaar is. Een belangrijke complicatie in dit kader is dat informatie over eenenkel proces vaak verspreid is over tal van modellen, documenten en systemen. Dezeverspreiding ontstaat doordat organisaties trachten om de verschillende belanghebben-den binnen een proces te voorzien van alleen die informatie die van specifiek belang isvoor hen. Deze opsplitsing van procesinformatie heeft voor een organisatie echter ookaanzienlijke nadelen. Het kan namelijk leiden tot ernstige onderhoudsproblemen, ver-mindering van efficiency en het kan een negatieve invloed hebben op de kwaliteit van deuiteindelijke resultaten. Om bij te dragen aan een oplossing voor deze negatieve gevol-gen, richt dit proefschrift zich op het verminderen van de problemen die voortkomenuit de verspreiding van procesinformatie. De belangrijkste bijdragen in het proefschriftzijn vijf technieken die zich focussen op het verbinden en vergelijken van procesinfor-matie uit verschillende bronnen. Ieder van deze technieken biedt een oplossing vooreen specifiek scenario waarbij meerdere informatiebronnen in verschillende vormenbetrokken zijn. Zo presenteren we onder andere automatische technieken voor het op-sporen van tegenstrijdigheden tussen procesmodellen en tekstuele documenten, voorhet controleren van de naleving van dubbelzinnige procesomschrijvingen en voor hetvergelijken van processen op basis van informatie uit IT systemen. We tonen het nuten de bruikbaarheid van deze technieken aan door middel van kwantitatieve evaluatiesdie zijn gebaseerd op gegevens van bestaande bedrijfsprocessen. Samengevat biedt ditproefschrift een aantal wetenschappelijke bijdragen voor het analyseren, vergelijkenen verbinden van procesinformatie uit verschillende bronnen. Deze bijdragen wordengevormd door de introductie van nieuwe theoretische concepten en de ontwikkelingvan technische oplossingen. Bovendien biedt dit werk een basis voor organisaties voorhet verbeteren van hun efficientie en de kwaliteit van hun processen.
v


Contents
1 Introduction 11.1 Motivation . . . . . . . . . . . . . . . . . . . . . . . . . . . . . . . . 11.2 Contributions . . . . . . . . . . . . . . . . . . . . . . . . . . . . . . 21.3 Methodological Background . . . . . . . . . . . . . . . . . . . . . . 61.4 Publications . . . . . . . . . . . . . . . . . . . . . . . . . . . . . . . 91.5 Thesis Outline . . . . . . . . . . . . . . . . . . . . . . . . . . . . . . 11
2 Background 132.1 Process Information in Organizations . . . . . . . . . . . . . . . . . . 132.2 Core Definitions . . . . . . . . . . . . . . . . . . . . . . . . . . . . . 232.3 Natural Language Processing . . . . . . . . . . . . . . . . . . . . . . 262.4 Matching . . . . . . . . . . . . . . . . . . . . . . . . . . . . . . . . 35
3 Comparing Process Models to Textual Process Descriptions 453.1 Problem Illustration . . . . . . . . . . . . . . . . . . . . . . . . . . . 463.2 Inconsistency-Detection Approach . . . . . . . . . . . . . . . . . . . 473.3 Evaluation . . . . . . . . . . . . . . . . . . . . . . . . . . . . . . . . 563.4 Limitations . . . . . . . . . . . . . . . . . . . . . . . . . . . . . . . 633.5 Related Work . . . . . . . . . . . . . . . . . . . . . . . . . . . . . . 643.6 Summary . . . . . . . . . . . . . . . . . . . . . . . . . . . . . . . . 65
4 Conformance Checking based on Uncertain Event-Activity Mappings 674.1 Problem Illustration . . . . . . . . . . . . . . . . . . . . . . . . . . . 684.2 Conformance-Checking Technique . . . . . . . . . . . . . . . . . . . 694.3 Evaluation . . . . . . . . . . . . . . . . . . . . . . . . . . . . . . . . 734.4 Limitations . . . . . . . . . . . . . . . . . . . . . . . . . . . . . . . 764.5 Related Work . . . . . . . . . . . . . . . . . . . . . . . . . . . . . . 774.6 Summary . . . . . . . . . . . . . . . . . . . . . . . . . . . . . . . . 78
vii

viii
5 Dealing with Ambiguity in Textual Process Descriptions 795.1 Problem Illustration . . . . . . . . . . . . . . . . . . . . . . . . . . . 805.2 Capturing Ambiguity Using Behavioral Spaces . . . . . . . . . . . . 815.3 Conformance Checking using Behavioral Spaces . . . . . . . . . . . 905.4 Pruning Behavioral Spaces based on Information Gain . . . . . . . . 915.5 Evaluation . . . . . . . . . . . . . . . . . . . . . . . . . . . . . . . . 935.6 Limitations . . . . . . . . . . . . . . . . . . . . . . . . . . . . . . . 1005.7 Related Work . . . . . . . . . . . . . . . . . . . . . . . . . . . . . . 1015.8 Summary . . . . . . . . . . . . . . . . . . . . . . . . . . . . . . . . 102
6 Transforming and Aligning Process Performance Indicators 1036.1 Problem Illustration . . . . . . . . . . . . . . . . . . . . . . . . . . . 1046.2 Template-Based PPI Definitions . . . . . . . . . . . . . . . . . . . . 1066.3 Transformation Approach . . . . . . . . . . . . . . . . . . . . . . . . 1116.4 Evaluation . . . . . . . . . . . . . . . . . . . . . . . . . . . . . . . . 1186.5 Limitations . . . . . . . . . . . . . . . . . . . . . . . . . . . . . . . 1236.6 Related Work . . . . . . . . . . . . . . . . . . . . . . . . . . . . . . 1236.7 Summary . . . . . . . . . . . . . . . . . . . . . . . . . . . . . . . . 124
7 Process Model Matching using Event-Log Information 1257.1 Problem Illustration . . . . . . . . . . . . . . . . . . . . . . . . . . . 1257.2 Event Log-Based Matching . . . . . . . . . . . . . . . . . . . . . . . 1277.3 Evaluation . . . . . . . . . . . . . . . . . . . . . . . . . . . . . . . . 1327.4 Limitations . . . . . . . . . . . . . . . . . . . . . . . . . . . . . . . 1377.5 Related Work . . . . . . . . . . . . . . . . . . . . . . . . . . . . . . 1387.6 Summary . . . . . . . . . . . . . . . . . . . . . . . . . . . . . . . . 138
8 Conclusion 1398.1 Summary of Results . . . . . . . . . . . . . . . . . . . . . . . . . . . 1398.2 Implications . . . . . . . . . . . . . . . . . . . . . . . . . . . . . . . 1418.3 Future Research . . . . . . . . . . . . . . . . . . . . . . . . . . . . . 144
Bibliography 147
List of Figures
2.1 Overview of a generic alignment task . . . . . . . . . . . . . . . . . 142.2 Hierarchy between data, information, and knowledge . . . . . . . . . 152.3 Main constructs in Task-Technology Fit theory . . . . . . . . . . . . 172.4 Loan application process with fragmented process information . . . . 192.5 Exemplary process model of a loan application process . . . . . . . . 242.6 Example of a parse tree. . . . . . . . . . . . . . . . . . . . . . . . . . 302.7 Two process models and their correspondences . . . . . . . . . . . . 36
3.1 A textual and a model-based description of a bicycle manufacturingprocess . . . . . . . . . . . . . . . . . . . . . . . . . . . . . . . . . 46
3.2 Overview of the proposed approach. . . . . . . . . . . . . . . . . . . 473.3 Simplified parse tree for sentence s8. . . . . . . . . . . . . . . . . . . 503.4 Correspondences disallowed by ordering constraints . . . . . . . . . . 523.5 Precision-recall graph for the detection of missing activities (activity
level) . . . . . . . . . . . . . . . . . . . . . . . . . . . . . . . . . . 603.6 Precision-recall graph for the detection of model-text pairs with miss-
ing activities (process level) . . . . . . . . . . . . . . . . . . . . . . . 60
4.1 Process model for a simplified order handling process . . . . . . . . . 684.2 Overview of the evaluation setup . . . . . . . . . . . . . . . . . . . . 744.3 Evaluation results for deterministic conformance checking . . . . . . 75
5.1 Exemplary description of a claims handling process. . . . . . . . . . 805.2 Steps involved to construct a behavioral space from a textual description 825.3 A behavioral space as a collection of m process interpretations . . . . 885.4 Visualization of three sets of conforming traces for cases with scope
ambiguity . . . . . . . . . . . . . . . . . . . . . . . . . . . . . . . . 97
ix

x LIST OF FIGURES
5.5 Comparison of uncertainty resolution using max. IG and random se-lection . . . . . . . . . . . . . . . . . . . . . . . . . . . . . . . . . . 99
6.1 Process model for an order handling process . . . . . . . . . . . . . . 1046.2 Semantic concepts in a PPI definition . . . . . . . . . . . . . . . . . 1076.3 Overview of the proposed transformation approach . . . . . . . . . . 1116.4 Fragment of a semantic prior P(Θ) . . . . . . . . . . . . . . . . . . . 113
7.1 Two process models and their correspondences . . . . . . . . . . . . 1267.2 Recall scores for top-k results . . . . . . . . . . . . . . . . . . . . . . 136

List of Tables
1.1 Overview of the techniques presented in this thesis . . . . . . . . . . 3
2.1 Informational artifacts for a purchasing approval process . . . . . . . 202.2 Activity identifiers for the process model depicted in Figure 2.5 . . . . 242.3 Excerpt of an exemplary event log . . . . . . . . . . . . . . . . . . . 252.4 Overview of the Penn Treebank tagset . . . . . . . . . . . . . . . . . 282.5 Possible tags for an exemplary sentence, with correct tags in bold . . . 292.6 Exemplary Stanford dependencies . . . . . . . . . . . . . . . . . . . 322.7 Comparison of syntactic and semantic similarity scores . . . . . . . . 402.8 Overview of semantic word relations . . . . . . . . . . . . . . . . . . 40
3.1 Main Stanford Dependencies used for anaphora resolution . . . . . . 493.2 Examplary similarity matrices with correspondences in bold . . . . . 553.3 Fragment of the similarity matrix for the running example . . . . . . 563.4 Overview of the test collection . . . . . . . . . . . . . . . . . . . . . 573.5 Predictor performance evaluation results . . . . . . . . . . . . . . . . 613.6 Highest F1-measures for different configurations and predictors. . . . 62
5.1 Activities in the running example . . . . . . . . . . . . . . . . . . . . 825.2 Exemplary outcomes of behavioral statement parsing . . . . . . . . . 835.3 Parallel indicators used in [99] and their classification . . . . . . . . . 865.4 Overview of the test collection . . . . . . . . . . . . . . . . . . . . . 945.5 Evaluation results . . . . . . . . . . . . . . . . . . . . . . . . . . . . 96
6.1 PPIs for the order handling example . . . . . . . . . . . . . . . . . . 1046.2 Example of a structured notation for PPI2 . . . . . . . . . . . . . . . 1056.3 PPI templates and examples . . . . . . . . . . . . . . . . . . . . . . 1076.4 Domains associated with template slots . . . . . . . . . . . . . . . . 109
xi

xii LIST OF TABLES
6.5 Tag set used for semantic annotation . . . . . . . . . . . . . . . . . . 1126.6 Domain value resolution for PPI2 . . . . . . . . . . . . . . . . . . . 1156.7 Overview of the test collection . . . . . . . . . . . . . . . . . . . . . 1196.8 Evaluation results . . . . . . . . . . . . . . . . . . . . . . . . . . . . 121
7.1 Characteristics of the test collection . . . . . . . . . . . . . . . . . . 1337.2 Evaluation results . . . . . . . . . . . . . . . . . . . . . . . . . . . . 135

Acronyms
BPM Business Process Management
BPMN Business Process Model and Notation
CFG Context-Free Grammar
EPC Event-driven Process Chain
FLM First-Line Matcher
IDF Inverse Document Frequency
IG Information Gain
IS Information Systems
IT Information Technology
LSH Locality Sensitive Hashing
HMM Hidden Markov Model
MWBM Maximum Weighted Bipartite-graph Match
NLP Natural Language Processing
ORE Ontobuilder Research Environment
PCFG Probabilistic Context-Free Grammar
PPI Process Performance Indicator
SCOR Supply Chain Operations Reference
SLM Second-Line Matcher
7PMG Seven Process Modeling Guidelines
TTF Task-Technology Fit
xiii


1Introduction
This chapter provides an introduction to this doctoral thesis. In Section 1.1, we moti-vate the need for the alignment and comparison of process information in organizations.Section 1.2 introduces the main contributions of our research. Section 1.3 describesthe methodological background for the research presented in this thesis. Section 1.4presents the publications that followed from this research. Finally, Section 1.5 providesan overview of the remaining chapters of the thesis.
1.1 MotivationBusiness Process Management (BPM) is the art and science of analyzing how work isperformed in an organization with the aim to ensure consistent outcomes and to takeadvantage of improvement opportunities [87]. The focal point of any BPM initiativeis formed by one or more business processes. A business process refers to a set ofrelated activities, which transform some input into an output that is valuable to a cus-tomer [121]. Such processes exist in every organization, from hospitals to financialinstitutions, and from family businesses to global enterprises.
Processes within organizations can be highly complex chains of inter-related steps,involving numerous stakeholders and information systems [17]. Due to this complex-ity, having access to the right information is vital to the proper execution and effectivemanagement of an organization’s business processes [55]. Specifically, access to in-formation on processes contributes to their efficient execution [139], their complianceto rules and regulations [31], and to their enhancement and redesign [134]. A majorthreat to this information need is that the information on a single process, also referredto as process information, is often spread out over numerous models, documents, andsystems. We shall refer to this condition as the fragmentation of process information.
This fragmentation occurs because organizations typically use multiple informa-tional artifacts to provide process information to stakeholders with different informa-tional needs or preferences [55, 93]. However, the use of multiple informational ar-tifacts also poses considerable challenges to organizations. First, the fragmentation
1

2 1.2. CONTRIBUTIONS
of process information can increase the effort required to access desired or necessaryinformation. In particular, users may have to browse through numerous systems anddocuments to find the information they need [189, p.4]. Such cases can compromisethe efficiency and effectiveness of process execution and decision making [55]. Second,fragmentation can result in the provision of incorrect process information to users. Thisproblem can occur when different artifacts contradict each other, for instance when theartifacts have been developed independently [224]. The information captured in arti-facts may also lose their validity over time if artifacts are not updated to reflect processchanges [280]. When users execute a process based on invalid information, they mayperform the process in an incorrect manner, resulting in business process noncompli-ance [30]. Such noncompliant acts can have severe consequences for organizations,including reduced productivity [35], a loss of control over processes [239], and evenfinancial penalties imposed by authorities [173].
Despite the severity of these issues, there is only limited support for organiza-tions to effectively deal with the negative effects of the fragmentation of process in-formation. This lack of support exists despite the widespread recognition in researchfor the need to align process information from particular kinds of informational arti-facts. In particular, a plethora of approaches have been developed that automaticallyalign information between process models, so-called process model matching tech-niques (cf. [32, 58, 277]). Matching techniques also exist that address the need to aligninformation between different event logs [178], or between event logs and process mod-els [37, 39]. There is also support for scenarios beyond the alignment of information.For instance, several querying techniques exist that support users to search collectionsof process models. Other approaches exist that determine the consistency betweenprocess models [279] or that maintain consistency by propagating changes from onemodel to another [280].
A key problem is that these aforementioned approaches only focus on specific ap-plication scenarios. They typically address situations that involve highly-structuredprocess information in the form of process models and event logs. Process informationin less-structured formats, such as natural language documents, is largely ignored byexisting work. Consequently, there is a considerable gap between the way in whichorganizations capture information on their processes and the support that exists forthis situation. As a result of this research gap, organizations still struggle with conse-quences caused by the fragmentation of process information.
1.2 Contributions
This thesis focuses on the automated analysis of process information contained in vari-ous representation formats. As a foundation, we provide insights into the way in whichorganizations capture information on their processes and the problems that result fromthis. The main contributions of this thesis revolve around the definition of five tech-niques that focus on the comparison and alignment of process information in differentinformational artifacts. The techniques that we develop enable organizations to executeand maintain their process information more efficiently and to ensure that processes areexecuted according to their specification.

CHAPTER 1. INTRODUCTION 3
Table 1.1: Overview of the techniques presented in this thesis
Purpose Illustration
1. Check consistency between aprocess model and a textual pro-cess description.
Process modelTextual processdescription
Consistency check
2. Check conformance betweenan event log and a process modelbased on uncertain event-activitymappings. Event log
Conformance check
Process model
3. Check conformance betweenan event log and a textual processdescription. Considers ambiguityin the textual description. Textual process
description
Event log
Conformance check
4. Transform unstructured naturallanguage descriptions into mea-surable Process Performance In-dicators (PPIs). Process model PPI description
Alignment & transformation
5. Align process models basedon information from associatedevent logs.
Event log
Process model
Event log
Process model
Alignment
As depicted in Table 1.1, each technique addresses a specific scenario involvingmultiple informational artifacts in different representation formats. With these tech-niques we focus on three main types of representation formats: process models, eventlogs, and natural language texts. The choice for these formats is justified by their roleas de facto standards to capture a wide range of process information. Specifically, pro-cess models represent the most common means to capture design-time information onthe flow of business processes in a structured manner [87, p.16]. Furthermore, eventlogs are the default way to capture run-time information on processes, as recorded dur-ing their actual execution [13, p.8]. Finally, natural language texts are widely-used asan all-purpose format to capture a broad variety of unstructured or semi-structured pro-cess information, such as process descriptions, work instructions, and guidelines [190],but also information on other process perspectives, such as Process Performance Indi-

4 1.2. CONTRIBUTIONS
cators (PPIs) [236].The five techniques presented in this thesis provide a near-complete coverage of
the combinations of the three considered representation formats. Specifically, we fo-cus on scenarios involving alignments from model-to-model, log-to-log, model-to-text,log-to-model, and log-to-text1. Note that, given the lack of established application sce-narios, we do not cover a scenario involving the comparison of process informationfrom two natural language texts. Within the combinations covered by the techniques,our choice for the specific use cases is motivated by their practical relevance and by thegap that exists between prior research and the novelty of the conceptual developmentsrequired to address them. For example, the alignment between an event log and pro-cess model primarily focuses on conformance checking (cf. [15, 24, 282]), whereas inmodel-to-model scenarios the focus is most often on the establishment of alignments,so-called matching (cf. [79, 277, 284]).
The insights about the use of process information in organizations and the presentedalignment techniques lead to several scientific contributions for the analysis, compari-son, and alignment of process information, especially in the context of semi-structuredrepresentation formats. We identify one contribution that stems from the insights ob-tained about the fragmentation of process information, whereas five other contributionsfollow from the alignment techniques. Specifically, the six main contributions of thisthesis are as follows:
1. An overview of the causes and consequences of process-information fragmenta-tion. Organizations maintain a variety of process-information artifacts in orderto provide different process stakeholders with the information they require. Thisfragmentation can have clear advantages, but also poses considerable threats tothe efficient maintenance and execution of processes. As part of Chapter 2, weprovide insights into the reasons why multiple artifacts are required for a singleprocess and which effects this can have on organizations. These insights canbe highly useful for organizations in their efforts to mitigate the negative conse-quences associated with the fragmentation of process information. Furthermore,they provide important guidance to researchers to develop means that supportorganizations.
2. Inconsistency detection between process models and textual process descrip-tions. Many organizations maintain textual process descriptions alongside graph-ical process models. Although this makes process information accessible to var-ious stakeholders, there is a clear risk that model and text become misalignedwhen changes are not applied to both descriptions consistently. For organizationswith hundreds of different processes, the effort required to manually identify andclear up such conflicts is considerable. We address this problem in Chapter 3with a technique that automatically identifies inconsistencies between a processmodel and a corresponding textual description. The techniques builds on ap-proaches for linguistic analysis that are tailored to extract relevant process in-formation from textual descriptions. Furthermore, our technique uses specificmetrics, so-called predictors, to quantify the likelihood that the two representa-tion formats contain inconsistencies.
1Note that the fifth technique in the table covers both model-to-model and log-to-log alignment.

CHAPTER 1. INTRODUCTION 5
3. Behavioral spaces as a means to capture behavioral uncertainty in processes.The use of semi-structured and unstructured representation formats for processinformation, such as natural language texts, is widespread throughout organi-zations. Nevertheless, these formats are typically exempt from considerationby automated analysis techniques. A main reason for this is that these formatsdepend on the use of natural language to convey the behavior of a process. Be-cause natural language is inherently ambiguous, it is often impossible to deter-mine with certainty which process behavior is exactly described. Rather, thereare numerous potential interpretations of the described process behavior. In or-der to be able to reason about properties such as conformance in the context ofuncertain behavior, we introduce the concept of a behavioral space as a meansto capture all potential interpretations of behavioral uncertainty. In this thesis,we leverage this concept in two ways. In Chapter 4, we use behavioral spacesto capture behavioral uncertainty caused by unclear relations between differentinformational artifacts. In Chapter 5, we use the concept to capture uncertaintycaused by ambiguous textual process descriptions.
4. Conformance checking in the context of behavioral uncertainty. By capturingbehavioral uncertainty in processes using behavioral spaces, automated analysistechniques can be used that are otherwise not applicable or may produce incor-rect results. In this thesis we demonstrate the usefulness of behavioral spaces byapplying them in the context of conformance checking. Conformance checkingaims to determine if observed behavior, as recorded by IT systems, conforms toa particular process specification that denotes the allowed behavior. By using be-havioral spaces for this task, we can obtain conformance-checking results in sit-uations where traditional conformance-checking techniques yield untrustworthyresults. The results obtained by our techniques are probabilistic, differentiatingbetween conforming, nonconforming, and potentially conforming behavior. Weapply our conformance-checking technique in Chapters 4 and 5.
5. Transformation of natural language descriptions into measurable Process Per-formance Indicators (PPIs). Monitoring process performance is an importantmeans for organizations to identify opportunities to improve their operations.The definition of suitable PPIs represents a crucial task in this regard. BecausePPIs need to be in line with strategic business objectives, the formulation ofPPIs is a managerial concern. Managers typically start out to provide relevantindicators in the form of natural language PPI descriptions. Therefore, consider-able time and effort have to be invested to transform these descriptions into PPIdefinitions that can be automatically monitored. To overcome these problemsassociated with manual performed transformations, Chapter 6 presents a tech-nique that automates this task. The technique builds on a conceptualization ofthe way in which unstructured natural language descriptions convey the semanticcomponents required to define PPIs.
6. Process model matching based on event-log information. Process model match-ing provides the basis for many process analysis techniques, such as inconsis-tency detection and process querying. So-called matchers aim to automaticallyidentify correspondences between activities in two process models. The numer-ous techniques that have been developed for this purpose all share a focus on

6 1.3. METHODOLOGICAL BACKGROUND
process-level information. Therefore, they do not exploit process informationcontained in event logs associated with the models, which can be helpful for theidentification of model correspondences. Chapter 7 shows the potential of usingevent-log information in process model matching. The matchers we introducebuild on six conceptual notions that indicate similarity between event classes.
1.3 Methodological Background
The research presented in this thesis is conducted in the context of the InformationSystems (IS) research discipline. IS research aims to further knowledge that aids inthe productive application of Information Technology (IT) to organizations [129]. Itis a strongly interdisciplinary field of study that applies theories from social sciences,economics, and computer science. IS research involves two complementary paradigms:behavioral science and design science (cf. [117, 122, 209]).
Behavioral science is concerned with the development and justification of theoriesthat explain or predict phenomena surrounding the analysis, design, implementation,management, and use of information systems [122]. Such theories ultimately informresearchers and practitioners of the interactions among people, technology, and organi-zations that must be managed if an information system is to achieve its stated purpose:improving the effectiveness and efficiency of an organization. Design science is funda-mentally a problem-solving paradigm that has its roots in engineering and the sciencesof the artificial [252]. It seeks to create innovations that define the ideas, practices,technical capabilities, and products through which the analysis, design, implementa-tion, management, and use of information systems can be effectively and efficiently ac-complished [76, 261]. In particular, design science can be used to addresses problemsthat are characterized as wicked, which means that they do not have a definitive formu-lation [122]. Because of this wickedness, solutions to such design-science problemscannot be assessed by truth, but rather by utility. Therefore, Simon [252] advocates toaccept satisficing solutions by designing and creating useful artifacts. In summary, itcan be said that the goal of behavioral-science research is truth and the goal of design-science research is utility [122].
The research design of this thesis combines both paradigms, following the argu-ment by Hevner et al. [122] that design and behavioral science are complementary:“truth informs design and utility informs theory.” In this context, Hevner et al. suggesta set of seven guidelines for effective information systems research that are particularlyapplicable to works with a design-science focus. We use these guidelines as a basis todiscuss in how far this thesis meets information systems research standards:Guideline 1: Design as an artifact. The goal of design-science research in IS is thecreation of purposeful IT artifacts that address important organizational problems. Theartifact must be described effectively, enabling its implementation and application inan appropriate domain. An artifact can be a construct, model, method, or an instantia-tion [122].
In this thesis we address organizational problems caused by the spread of processinformation over various informational artifacts. Our contributions include novel con-ceptualizations of behavioral uncertainty and event-class similarity, which play key

CHAPTER 1. INTRODUCTION 7
roles in specific application scenarios. Furthermore, we provide five methods, alsoreferred to as techniques, that allow organizations to more effectively deal with frag-mented process information. For instance, one of the techniques allows organizationsto automatically identify inconsistencies between textual process descriptions and pro-cess models. Thereby, the method supports organizations in their maintenance of pro-cess information, helping to ensure that all processes are executed correctly and effi-ciently. For each of these methods, we also present an instantiation (i.e., an implemen-tation) in the form a Java prototype in order to demonstrate the method’s applicability.
Guideline 2: Problem relevance. The relevance of design-science research is de-termined by addressing problems that are of value to a constituent community. For ISresearch, this community consists of practitioners who plan, manage, design, imple-ment, operate, and evaluate information systems and the technologies that enable theirdevelopment and implementation [122].
The general relevance of the research presented in this thesis stems from the wide-spread adoption of BPM in organizations (see e.g., [221, 254, 256]). Therefore, BPMresearch is of value to the community of BPM practitioners and the organizations inwhich BPM practices are applied. On a more specific level, the relevance of each ofthe problems that we address with our research was identified in existing literature orfollowed directly from the limitations of state-of-the-art solutions to effectively addressthe respective problems. For example, Chapter 4 presents a method for conformancechecking in the context of uncertain mappings between event logs and process models.The relevance of this technique stems from the importance of conformance checkingto ensure that processes are executed according to their specification [16, 21, 239], incombination with the inherent inability of mapping techniques to identify a single,correct mapping [40].
Guideline 3: Design evaluation. The utility, quality, and efficacy of a designartifact must be rigorously demonstrated via well-executed evaluation methods. Thebusiness environment establishes the requirements upon which the evaluation of arti-facts should be based. The evaluation of a designed IT artifact requires the definitionof appropriate metrics and the gathering and analysis of appropriate data [122].
We evaluate all research contributions in this thesis based on data collections thatwere obtained from industrial and academic partners, i.e., so-called real-life data. Foreach contribution, we employ metrics that quantify the usefulness of the developed ar-tifact for characteristics relevant to the specific problem addressed by the artifact. Forexample, to evaluate our technique for inconsistency detection between textual pro-cess descriptions and process models, we employ the well-known precision and recallmetrics from the information-retrieval field [179, p.142]. In this context, precisionquantifies the fraction of predictions made by the method that correspond to actualinconsistencies, whereas recall provides the fraction of actual inconsistencies that aresuccessfully identified by the method.
Guideline 4: Research contribution. Design-science research must provide anovel, significant, and general contribution to the knowledge base. This requirementexcludes so-called routine design, which is characterized by the application of existingknowledge and best-practices. Rather, scientific design requires the application of inno-vative methods to address unresolved problems or to improve existing solutions [122].
The research contributions of this thesis all meet this criteria by either address-

8 1.3. METHODOLOGICAL BACKGROUND
ing previously unresolved problems or by providing a considerable improvement overexisting solutions. In particular, this thesis presents several techniques which are thefirst to address certain problems. For instance, we present the first approaches for theautomated comparison of textual process descriptions to process models and the trans-formation of natural language PPI descriptions. Furthermore, we present conformance-checking methods that build on a novel conceptualization of process uncertainty thatconsiderably improves their practical applicability over existing methods. Lastly, ourtechnique for process model matching can obtain results that existing techniques areunable to achieve, because our method analyzes event-log information, which is ig-nored by others.
Guideline 5: Research rigor. Design-science research requires the application ofrigorous methods in both the construction and evaluation of designed artifacts. In thiscontext, rigor is derived from the effective use of the knowledge base, i.e., theoreticalfoundations and research methodologies. Success is predicated on the researcher’sskilled selection of appropriate techniques to develop or construct an artifact and theselection of appropriate means to evaluate it [122].
In the creation of our design artifacts, we made effective use of research from var-ious research streams, including process model analysis, Natural Language Process-ing (NLP), process model matching, and machine learning. For example, both of ourconformance-checking techniques build on existing conformance-checking approachesused in process analysis [281], whereas our techniques that analyze textual process de-scriptions build on a state-of-the-art technique presented in [99]. Furthermore, weformalize the designed artifacts such that readers can successfully reconstruct theirfunctionality.
Guideline 6: Design as a search process. Problem solving in design sciencecan be defined as utilizing suitable means to reach desired ends while respecting lawsimposed by the environment [252]. It is an inherently iterative process that consists of agenerate/test cycle. Given the wickedness of most IS problems, it may not be possibleto describe all means, ends, and laws relevant to a problem [269]. Hence, design-science research often aims for a satisfactory solution without the need to consider allpossible solutions [252].
To varying degrees, all our research contributions deal with the analysis of naturallanguage in process-information artifacts. Due to the variability of natural language,it is not possible define all aspects (e.g., laws) of the problems. This leads to a the-oretically indefinite number of ways to address the problems on which our researchfocuses. Therefore, rather than undertaking the impossible task of searching throughall possibilities, we aim to construct a satisfactory solution to each of the consideredresearch problems. For example, due to variability of natural language, it is impossibleto define an approach that can perfectly analyze every conceivable textual process de-scription. As a result, our method for the detection of inconsistencies between textualdescriptions and process models may not be able to identify every single inconsistency,but rather strives for the accurate identification of the vast majority of inconsistencies.We justify the satisfactory nature of our solutions by comparing the evaluation resultsof the solutions to state-of-the-art techniques or other relevant benchmarks.
Guideline 7: Communication of research. Design-science research must be pre-sented both to technology-oriented as well as management-oriented audiences [122].

CHAPTER 1. INTRODUCTION 9
Technology-oriented audiences need sufficient detail to enable the implementation ofdescribed artifacts and their use within an appropriate organizational context. Manage-ment-oriented audiences need sufficient detail to determine if organizational resourcesshould be committed to obtain and use the artifact within their specific organizationalcontext. Zmud [294] furthermore suggests that the emphasis for management-orientedaudiences should be on the importance of the problem, as well as the novelty and ef-fectiveness of the solution.
Each of the contributions presented in this thesis has been published in peer-re-viewed academic journals and/or international conferences (see Section 1.4). Further-more, we provide prototypical open source implementations for each of the designedartifacts. Hence, the presented techniques are readily available to interested researchersand practitioners.
The discussion of the design-science research guidelines in relation to the workpresented in this thesis illustrates that our research contributions fulfill internationallyestablished research standards. Further, the discussion shows that the presented re-search makes a significant contribution to the body of knowledge of the IS discipline.
1.4 PublicationsThis doctoral thesis is a monograph that presents research on the comparison andalignment of process information in various representation formats. Parts of this re-search have also appeared in peer-reviewed, scientific outlets, which has currentlyled to the publication of 2 journal articles and 7 conference papers. In comparisonto these publications, this doctoral thesis presents the conducted research in a moreextensive and integrated manner. Furthermore, Chapter 5 contains considerable con-ceptual extensions and additional evaluations in comparison to the form in which theconformance-checking approach has currently been published. The following list pro-vides an overview of the publications stemming from the research in this doctoral the-sis:
The spread of process information in organizations:
• Van der Aa, H., Leopold, H., Mannhardt, F., Reijers, H.A.: On the fragmenta-tion of process information: Challenges, solutions, and outlook. In: InternationalConference on Enterprise, Business-Process and Information Systems Modeling,pp. 3–18. Springer (2015)
• Van der Aa, H., Leopold, H., van de Weerd, I., Reijers, H.A.: Causes and conse-quences of fragmented process information: Insights from a case study. In: 23rdAmericas Conference on Information Systems, AMCIS (2017)
Comparing process models to textual process descriptions:
• Van der Aa, H., Leopold, H., Reijers, H.A.: Detecting inconsistencies betweenprocess models and textual descriptions. In: International Conference on Busi-ness Process Management, pp. 90–105. Springer (2015)

10 1.4. PUBLICATIONS
• Van der Aa, H., Leopold, H., Reijers, H.A.: Comparing textual descriptions toprocess models: The automatic detection of inconsistencies. Information Sys-tems 64, 447–460 (2017)
Reasoning in the presence of behavioral uncertainty:
• Van der Aa, H., Leopold, H., Reijers, H.A.: Dealing with behavioral ambiguityin textual process descriptions. In: International Conference on Business ProcessManagement. pp. 271–288. Springer (2016)
• Van der Aa, H., Leopold, H., Reijers, H.A.: Checking process compliance on thebasis of uncertain event-to-activity mappings. In: International Conference onAdvanced Information Systems Engineering. pp. 79–93. Springer (2017)
Aligning and transforming natural language PPIs:
• Van der Aa, H., Del-Rıo-Ortega, A., Resinas, M., Leopold, H., Ruiz-Cortes,A., Mendling, J., Reijers, H.A.: Narrowing the business-IT gap in process per-formance measurement. In: International Conference on Advanced InformationSystems Engineering. pp. 543–557. Springer (2016)
• Van der Aa, H., Leopold, H., del Rio-Ortega, A., Resinas, M., Reijers, H.A.:Transforming unstructured natural language descriptions into measurable pro-cess performance indicators using hidden markov models. Information Systems71, 27–39 (2017)
Process model matching based on event-log information:
• Van der Aa, H., Gal, A., Leopold, H., Reijers, H.A., Sagi, T., Shraga, R.: Instance-based process matching using event-log information. In: International Confer-ence on Advanced Information Systems Engineering. pp. 283–297. Springer(2017)
The author of this doctoral thesis has also contributed to several research projectsbeyond the scope of the monograph. These projects have currently led to the publica-tion of 2 journal articles, 4 conference papers, and 1 workshop paper. These publica-tions focus on, among others, the composition of workflow activities, business processnoncompliance, process querying, evaluation of process model matching, and the pre-diction of deviations in logistics chains. The following list provides an overview of thepublications:
Other publications:
• Van der Aa, H., Reijers, H.A., Vanderfeesten, I.: Composing workflow activitieson the basis of data-flow structures. In: International Conference on BusinessProcess Management, pp. 275–282. Springer (2013)

CHAPTER 1. INTRODUCTION 11
• Van der Aa, H., Leopold, H., Batoulis, K., Weske, M., Reijers, H.A.: Integratedprocess and decision modeling for data-driven processes. In: Business ProcessManagement Workshops. pp. 405–417. Springer (2015)
• Van der Aa, H., Reijers, H.A., Vanderfeesten, I.: Designing like a pro: The au-tomated composition of workflow activities. Computers in industry 75, 162–177(2016)
• Andrade, E., van der Aa, H., Leopold, H., Alter, S., Reijers, H.A.: Factors leadingto business process noncompliance and its positive and negative effects: Empir-ical insights from a case study. In: 22nd Americas Conference on InformationSystems, AMCIS (2016)
• Di Ciccio, C., Van der Aa, H., Cabanillas, C., Mendling, J., Prescher, J.: Detect-ing flight trajectory anomalies and predicting diversions in freight transportation.Decision Support Systems 88, 1–17 (2016)
• Kuss, E., Leopold, H., Van der Aa, H., Stuckenschmidt, H., Reijers, H.A.: Prob-abilistic evaluation of process model matching techniques. In: Conceptual Mod-eling: 35th International Conference, ER 2016, Gifu, Japan, November 14-17,2016, Proceedings 35. pp. 279–292. Springer (2016)
• Leopold, H., van der Aa, H., Pittke, F., Raffel, M., Mendling, J., Reijers, H.A.:Integrating textual and model-based process descriptions for comprehensive pro-cess search. In: International Conference on Enterprise, Business-Process andInformation Systems Modeling. pp. 51–65. Springer (2016)
1.5 Thesis OutlineThe remainder of this thesis is divided into the following seven chapters:
• Chapter 2: Background. This chapter provides background information essentialto the alignment and comparison of process information contained in differentinformational artifacts. The chapter focuses on three relevant aspects: (i) processinformation in organizations, (ii) NLP tasks and techniques, and (iii) applicationscenarios and techniques of matching.• Chapter 3: Comparing Process Models to Textual Process Descriptions. This
chapter presents our technique for the automated detection of inconsistenciesbetween process models and textual process descriptions. In particular, our tech-nique identifies two types of inconsistencies: (i) process model activities thatare not contained the accompanying textual description and (ii) conflicting or-ders between process model activities and process steps described in the text. Aquantitative evaluation with 53 real-world model-text pairs demonstrates that ourfour-step approach accurately identifies these inconsistencies.• Chapter 4: Conformance Checking based on Uncertain Event-Activity Map-
pings. This chapter presents a conformance-checking technique that can be usedin the presence of uncertain event-to-activity mappings. Our technique provides

12 1.5. THESIS OUTLINE
conformance-checking results without the need to select a single, possibly incor-rect mapping to base conformance checks on. We achieve this by consideringthe entire spectrum of possible mappings generated by event-to-activity map-ping techniques. As a result, our conformance-checking technique avoids therisk of drawing incorrect conclusions about conformance. A quantitative eval-uation based on a large collection of real-world process models demonstratesthat our technique can be used to obtain results in a vast number of cases wheretraditional conformance-checking techniques fail to do so.• Chapter 5: Dealing with Ambiguity in Textual Process Descriptions. This chap-
ter presents our method which checks the conformance of observed process be-havior against ambiguous textual descriptions. The method builds behavioralspaces as a means to capture all possible interpretations of a textual process de-scription in a systematic manner. By using behavioral spaces for conformancechecking, we avoid the need to impose assumptions on the correct interpretationsof ambiguous natural language texts. Therefore, conformance checks based onbehavioral spaces avoid the risks associated with the assumption-based selec-tion of interpretations. We use a quantitative evaluation with a set of 47 textualprocess descriptions to demonstrate the usefulness of behavioral spaces for con-formance checking in the context of real-world textual descriptions.• Chapter 6: Transforming and Aligning Process Performance Indicators. This
chapter presents our approach for the automated transformation of natural lan-guage descriptions into measurable PPIs. The proposed approach first trans-forms an unstructured natural language description into a structured format. Inthis step, it extracts information on concepts relevant to the calculation of a PPIfrom the natural language description. Secondly, our approach aligns the pro-cess concepts contained in the description with the corresponding elements of aprocess model. To this end, it establishes links between a PPI description andthe implementation of the process. As a result, the approach delivers structuredand aligned PPI descriptions that can be directly used for automated monitor-ing of process performance. We use a quantitative evaluation with a set of 129PPI descriptions obtained from practice to demonstrate that our approach worksaccurately.• Chapter 7: Process Model Matching using Event-Log Information. This chapter
presents techniques for process model matching based on event-log informa-tion. We present six different matchers to quantify process similarity based onevent logs. A quantitative evaluation with real-world data shows that by justconsidering the information specific to event logs, our matchers can identify aconsiderable number of correspondences between event classes. By combin-ing our instance-based matching techniques with traditional, model-based tech-niques users can strive to obtain matching results that cannot be obtained byusing either of these techniques alone.• Chapter 8: Conclusion. This chapter concludes the doctoral thesis. In this chap-
ter, we summarize the main results presented throughout the thesis. Furthermore,we reflect on the implications of these results for research and practice, as wellas on directions for future research that stem from the presented work.

2Background
This chapter discusses background essential to the alignment of process informationcontained in different informational artifacts. The chapter consists of three parts, eachof which focuses on an aspect relevant to any alignment task, as visualized in Fig-ure 2.1. The input to an alignment task is formed by two informational artifacts relatedto a business process. Section 2.1 reflects on these input artifacts by discussing the roleand presence of process information in organizations, whereas Section 2.2 providesformal definitions for the main types of informational artifacts contained in this thesis.
In the first step of an alignment task, relevant process information is extracted fromthe informational artifacts. A major part of the process information considered inthis thesis is described in the form of natural language. Therefore, Section 2.3 dis-cusses Natural Language Processing (NLP) techniques that form the foundation forthis information-extraction step. Afterwards, the information extracted from the twoartifacts must be related to each other in order to obtain the alignments that form thebasis for various analysis techniques, such as the detection of inconsistencies betweenthe artifacts and process querying. So-called matching techniques aim to automaticallyestablish such alignments. Therefore, Section 2.4 presents an overview of the relevantaspects of matching.
2.1 Process Information in Organizations
This section gives an overview of the role and presence of process information in orga-nizations. Section 2.1.1 introduces the discipline of BPM, which provides the contextfor the use of process information. Section 2.1.2 then defines the notion of processinformation and discusses its importance throughout the various phases of a BPM life-cycle. Afterwards, Section 2.1.3 describes the task of capturing process informationin the form of informational artifacts and the associated causes of process-informationfragmentation. Finally, Section 2.1.4 concludes this overview by considering the neg-ative impact that the fragmentation of process information can have on organizations.
13

14 2.1. PROCESS INFORMATION IN ORGANIZATIONS
Extract process information
Align extracted information
Informationalartifact A
Informationalartifact B
Alignment result
Figure 2.1: Overview of a generic alignment task
2.1.1 Business Process ManagementBusiness Process Management (BPM) aims for the efficient coordination of business-related activities within and between organizations [186, p.5]. BPM represents one ofthe core concepts that enables organizations to flexibly react to constantly changingbusiness environments [162, p.1]. The focal point and core concept of BPM, as wellas of this thesis, is a business process. A multitude of definitions for this concept havebeen provided in literature. A seminal definition by Hammer and Champy [121, p.38]characterizes a business process as a collection of activities, transforming an input intoan output that is valuable for a customer. This definition pinpoints two key conceptspresent in most definitions: a collection of activities (or process steps) and an outputthat provides value to a customer. Regarding the collection of activities in a businessprocess, other definitions provide a more strict view. Davenport and Short describe thiscollection as a “set of logically related-tasks” [71], Dumas et al. [87, p.5] as a “chain ofevents, activities, and decisions,” while Van der Aalst and Van Hee [18] emphasize thatthe order of activities is determined by pre-defined conditions. Hammer and Champy’sdefinition also states that the output should provide value to a customer. This customercan either be external or internal to the organization [87, p.4]. Furthermore, Becker andKugeler [46] stress that this goal is directed by the business objectives and environmentof an organization. Without a loss of generality, we here adopt the definition by Dumaset al. because it emphasizes the core aspects of business processes that are relevant tothis thesis.
Definition 2.1 (Business Process). A business process is a collection of inter-relatedevents, activities and decision points that involve a number of actors and objects, andthat collectively lead to an outcome that is of value to at least one customer [87, p.5].
Despite the widespread use of the term Business Process Management, there is noagreement on its meaning. Rather, there are certain activities with respect to businessprocesses that are commonly gathered under this name [229, p.11]. Notably: the de-sign, analysis, modeling, implementation and control of business processes [18, 75,247]. Since this thesis focuses on process information from various sources and for abroad variety of BPM purposes, we adopt the definition of BPM proposed by Van derAalst et al. [17]:

CHAPTER 2. BACKGROUND 15
Definition 2.2 (Business Process Management (BPM)). BPM supports business pro-cesses using methods, techniques, and software to design, enact, control, and analyzeoperational processes involving humans, organizations, applications, documents andother sources of information [17].
In the next section, we describe and define process information as informationspecifically related to BPM activities.
2.1.2 Process InformationTo be able to reflect on the role of process information in BPM, we need to define whatthe term process information refers to. To do so, we first need to investigate the notionof information itself. In IT or IS contexts, information is typically defined by distin-guishing it from knowledge and data [27]. There are different views on this distinction.What they share is the idea that the three form a hierarchy, such as depicted in Fig-ure 2.2. For example, Vance [267] defines information as data that has been interpretedin the context of a meaningful framework, whereas knowledge is information that hasbeen authenticated and thought to be true. Maglitta [177] characterizes data as rawnumbers and facts, information as processed data, and knowledge as information thathas been made actionable.
Data Raw numbers and facts
Information Processed data
Knowledge Personalized information
Figure 2.2: Hierarchy between data, information, and knowledge (adapted from [59])
The key characteristic that distinguishes knowledge from information throughoutthe definitions is that knowledge is information that exists in the mind of individu-als [27]. It is personalized information, which may or not be unique or correct. As Fa-hey and Prusak [91] suggest, “knowledge does not exist independently of the knower.”This implies that according to a strict definition, knowledge cannot exist in documents,systems, or other artifacts. Information is converted to knowledge once it is processedin the mind of individuals and knowledge becomes information once it is articulatedand presented in the form of text, graphics, or other forms [27].
The typical characteristic used to distinguish data from information is that the lat-ter has undergone some form of processing. However, as Alavi and Leidner [27] point

16 2.1. PROCESS INFORMATION IN ORGANIZATIONS
out, the presumption of a strict hierarchy between these two rarely survives a thoroughevaluation. Whether something is data or information can depend on the particularneed of a user. For instance, a timetable for a train can be regarded as raw data bysome, but may very well provide information instead of data to a user who is interestedin learning which train to take for a trip. Because of this fuzzy boundary, we adopt abroad view on what we consider process information in this thesis. Specifically, weconsider anything that has a process-orientation, which has been captured in a doc-ument, system, or through other means, as information. This includes, for example,event-log information that has been automatically recorded and stored. However, thisview on information excludes raw numbers without a known relation to a process or itsactivities. Instead, we regard those as data.
Building on this notion of information, we characterize process information as in-formation that is relevant to BPM activities. Michelberger et al. [190] present a defini-tion of process information that captures this:
Definition 2.3 (Process information). Process information refers to data that has beenprocessed to support process users in the modeling, execution, monitoring, optimiza-tion, and design of processes, so that it has a meaning and value with respect to theprocess users’ activities [190].
There is no established taxonomy of informational artifacts that suits this or otherdefinitions of process information. However, it is clear from literature that process in-formation encompasses a broad variety of types and formats. Michelberger et al. [190]consider process information to include textual process descriptions, working guide-lines, graphical process models, operational instructions, forms, checklists, lessonslearned, and best practices. Other types of process information relevant to this the-sis are (definitions of) PPIs [233] and event logs [13]. One way to understand why thisbroad range of process-information artifacts exists is to reflect on why and how processinformation is captured by organizations. This is considered in Section 2.1.3.
2.1.3 Capturing Process InformationFollowing Browning [55] and Figl and Recker [93], we can draw a parallel betweenthe task of capturing process information, in any format, and the task of modeling abusiness process. This parallel is useful because key principles of modeling are alsoapplicable to other means of capturing process information, such as textual descrip-tions and checklists. Before investigating the principles of modeling, it is importantto recognize that these apply to the task of capturing information manually, as well asautomatically. Automatically capturing process information occurs, for instance whenrecording event-log information or generating a process model from an event log. Thekey difference here is that when manually capturing information, decisions on whatinformation to capture and how to do so are made while modeling (akin to run-timedecisions). When automatically capturing information similar decisions have to bemade. However, by contrast, the decisions are then made when selecting or designingthe technique that performs the capturing (i.e., design-time decisions).
Different definitions for the concept of a model are proposed in literature. Sta-chowiak [258, p.131] defines a model as a simplifying mapping from reality that serves

CHAPTER 2. BACKGROUND 17
Task requirements (purpose)
Technology characteristics (content and arrangement)
Task-Technology Fit (TTF) Task performance
Figure 2.3: Main constructs in Task-Technology Fit (TTF) theory
a specific purpose. Steiger [259] defines it as an abstract representation of reality thatis built, verified, analyzed, and manipulated to support a particular purpose, even ifthat purpose is merely to increase understanding of a situation. What these and otherdefinitions share are two crucial, related characteristics: (i) a model is a simplificationof reality and (ii) a model has a specific purpose. The combination of these charac-teristics results in the maxim by Box [50] that “all models are wrong, but some areuseful.” Models are “wrong”, because they do not fully represent reality, but ratherselectively abstract key information. Therefore, a model provides a simplification ofreality tailored to the needs of a specific purpose.
To be able to reflect on the purpose of a model in detail, Browning [55] drawsan insightful parallel between the usefulness of a model for a particular purpose andTask-Technology Fit (TTF) theory. TTF theory, introduced by Goodhue and Thom-son [113], argues that a technology (i.e., a means to accomplish a task) will improve auser’s performance if it matches the task’s requirements well. In a BPM context, thismeans that a model of a process is more useful if it provides the right information in asuitable manner. Therefore, the informational content and representation format of aninformational artifact must be in line with the artifact’s intended purpose. This can alsobe seen in Figure 2.3, where the characteristics of a technology are defined accordingto its content and arrangement (i.e., its representation format).
Informational content
To accommodate for the information needs of various stakeholders involved in theBPM lifecycle, process-information artifacts often differ in terms of their informationalcontent. These differences can be described according to two main dimensions: theprovided level of detail and the perspective taken on a process.
First, informational artifacts vary in the level of detail that they provide to users. Forinstance, process owners and process analysts typically require an overview of an entireprocess [87, p.24]. Artifacts such as process models are well-suited for this purpose,because they can provide a high-level view on a process by describing it from start toend. For other stakeholders, most notably process participants, it is more importantto understand how to perform certain tasks, than to understand the whole process. Forthese stakeholders, work instructions are more useful, because they provide detailedinformation on the execution of specific tasks [94].
Second, informational artifacts provide information regarding different process per-

18 2.1. PROCESS INFORMATION IN ORGANIZATIONS
spectives. A typical distinction can here be made between the technical and operationalperspectives [280]. For example, a process model designed to support process imple-mentation will emphasize technical details, such as the applications that should becalled and the IT systems to be accessed. By contrast, a process model that takes anoperational perspective will focus on the tasks that must be performed and, for instance,who should perform these. The difference between models that cover these perspec-tives is representative of the well-known Business-IT-Gap (cf. [149, 174]). As anotherexample, process owners can be mainly concerned with aspects related to the perfor-mance perspective of processes [233], rather than operational or technical perspectives.
Representation Formats
A variety of representation formats can be used to capture process information in in-formational artifacts [287], including process models [72], natural language descrip-tions [212], spreadsheets [152], and checklists [230]. The representation format usedto provide process information to users should be well-suited for its particular purpose.This suitability depends on two main factors. A format should convey its informationalcontent in a useful manner and the intended users should be able to work with theutilized format well.
Representation formats emphasize different aspects of business processes. Thismeans that the choice for a certain representation format depends on the intended fo-cus of an informational artifact. For instance, natural language text can be very use-ful to provide process participants with detailed insights on how to perform complextasks [39]. However, for a process participant who needs to be sure that all neces-sary steps are performed, a checklist is more useful. This latter format is more suit-able because it emphasizes the information that is of primary importance for that pur-pose. Furthermore, process models have been found to be better suited to expresscomplex execution logic of a process in a more comprehensive manner than naturallanguage [186, p.23].
It is also important that users of an informational artifact are able to work well withan employed representation format. The ability of users to do so can depend on theirfamiliarity and preferences with respect to different formats. Research by Figl andRecker [93] shows that people prefer different process representation formats depend-ing on the application purpose and on the cognitive style of the user. For example, someparticipants were found to prefer textual descriptions over process models, whereasothers preferred models over text for the same purpose. The influence of user prefer-ences on the choice for model or text-based process representations is also recognizedby Recker et al. [228] and Chakraborty et al. [60].
Fragmentation
The need for the availability of artifacts with different informational contents and rep-resentation formats means that often multiple artifacts are required to provide infor-mation on a single business process. Figure 2.4 depicts a classical example of thissituation. The figure shows three informational artifacts that capture information ona loan application process: (1) a process model, (2) a natural language work instruc-

CHAPTER 2. BACKGROUND 19
Cre
dit o
ffice
Receive loan application
Checkapplication
completeness
Performcredit check
Sendloan offer
Invite forinterview
Perform credit check
To perform this activity, a junior loan officer will evaluate the income and the credit history of the applicant. An applicant wil l be immediately rejected for a loan in case he has a credit score below…
q Application is completeq Basic credit check
passedq Applicant interviewedq Loan offer sent
Loan-assessment process checklist
(1)
(2) (3)
Figure 2.4: Loan application process with fragmented process information
tion, and (3) a checklist. This fragmentation has clear advantages because it allowsan organization to provide users with the process information that is most relevant tothem, in a suitable format. For instance, a process participant who performs a creditcheck in the loan application process can use the textual work instruction (2) to obtainall information relevant to the execution of this particular task. By contrast, a differentparticipant can use the checklist (3) as a means to ensure that all necessary steps havebeen performed when assessing a loan application, before sending the loan offer to theapplicant. However, despite these advantages of having various informational artifacts,the spread of process information can also pose considerable threats to the efficient ex-ecution and management of an organization’s processes. We reflect on this in the nextsection.
2.1.4 The Problem of Fragmented Process InformationThe fragmentation of process information over different informational artifacts canpose considerable problems to organizations. To understand the possible severity ofthese issues, it is important to grasp how fragmented process information can be inpractice. For this purpose, we first illustrate this based on our observations during acase study described in [10]. In this case study, we investigated the existence and useof informational artifacts related to 23 processes of the procurement department of amajor manufacturing company.
We found that process information was highly fragmented for some of the inves-tigated processes. One of the most severe instances was observed for a purchasingapproval process. We found more than 100 informational artifacts related to this singlebusiness process. Table 2.1 provides an overview of these artifacts, which we subdi-vided according to their information types and representation formats. Aside from thefragmentation in the form of this large number of informational artifacts, it is also im-portant to note that these artifacts were spread out over various information systems.
1The organization used this format for materials in training settings.2An informational artifact that contains both high-level and low-level process information, combining
contents from textual process descriptions with work instructions.

20 2.1. PROCESS INFORMATION IN ORGANIZATIONS
Table 2.1: Informational artifacts for a purchasing approval process (from [10])
Information type Representation Format Quantity
Process model EPC 1
Process descriptionText document 5Slide set1 1
Work instruction
Text document 30+
Spreadsheet 2Slide set 30+
Video1 15E-learning module1 1
Hybrid documentation2 Text document 20+
E-learning module 1
This latter problem occurs when process information is managed separately from thebusiness processes themselves [190]. Process information is, for example, stored inshared drives, databases, enterprise portals, content management systems, and enter-prise information systems [189, p.4].
Given a situation such as described above, the fragmentation of process informa-tion threatens the effective management and execution of an organization’s businessprocesses. We identify three main kinds of problems that occur due to fragmentation:(i) maintenance issues, (ii) efficiency issues, and (iii) business process noncompliance.
Maintenance Issues
Adapting business processes in order to respond to changing business needs is at thevery heart of BPM [285]. Therefore, keeping process information in sync with contin-uous process improvement efforts is a highly important task [124]. This maintenancetask is severely affected by the fragmentation of process information. Clearly, whenmore artifacts are affected by a process change, more effort is required to update allartifacts. However, the total effort can far exceed the time spent on actually updatinginformation in the artifacts. If there is no traceability between process information con-tained in different artifacts, then considerable time must be invested to determine whichinformation and which artifacts should be changed. In our case study, we found that therequired efforts to maintain process information were very high. As one intervieweeremarked: “Sometimes a small change can mean tremendous effort.”
The amount of time and effort required to maintain process information repre-sents a considerable problem in itself. However, it is crucial to recognize that orga-nizations can only spend limited resources on maintenance, or any BPM activities ingeneral [87, p.33]. Therefore, organizations may not be able to allocate sufficient re-sources to keep all process information in sync with reality. This comes with the highlyproblematic consequence that information can become outdated. In our case study, oneof the interviewees described a recent clean-up effort in which 120 obsolete documents,

CHAPTER 2. BACKGROUND 21
related to a handful of processes, were identified. When users execute processes basedon such outdated information, this can lead to efficiency issues as well as businessprocess noncompliance, as we discuss next.
Efficiency Issues
The fragmentation of process information can negatively affect the execution efficiencyof processes. This can occur for two general reasons.
First, fragmentation can affect efficiency because it makes it hard for users to findthe information that they need to perform their tasks in a process [55]. Because usersmay not have an overview of available process information [190], they may need tobrowse through numerous documents and systems before they find what they need.Such identification of information relevant to a specific work context has been recog-nized to be highly time-consuming and complex [238]. The time and effort requiredfor this thus reduces the efficiency of the processes in which the user is involved. Thisconsequence stands in sharp contrast to one of the major reasons why process infor-mation is fragmented. Namely, fragmentation occurs in order to provide users with theinformation that they need. However, this benefit is only achieved if users can actuallyfind the right information in the first place.
Second, the execution efficiency of processes can be reduced because process par-ticipants do not have the right information that they need [35]. This can occur whenthe quality of process information is insufficient [191], such as when participants ac-cess outdated or otherwise incorrect processes. Furthermore, it can also happen thatrelevant process information has simply not been documented. For instance, in ourcase study, we observed cases where the authors of process descriptions chose not todescribe certain steps that they perceived as trivial or irrelevant, but are in fact im-portant to the users of the information. For instance, an interviewee—who overseesa process that provides reports (in the form of spreadsheets) related to strategic deci-sions—described the following: “some process steps are not included [in the textualprocess descriptions], because they seemed natural to the designer. This leads to prob-lems when working with the spreadsheets.” Due to these issues, the interviewee spentthe majority of her days cleaning up errors in these reports. In another case, a procure-ment manager acknowledged that he heavily relies on undocumented knowledge whenperforming his tasks. As a result, when he is absent, his replacement fails to performcertain tasks that should actually be performed on a daily basis.
These issues caused by the fragmentation of process information result in situa-tions where considerable more time, effort, and, therefore, costs are required for theexecution of an organization’s processes than necessary.
Business Process Noncompliance
Business process noncompliance can be defined as any behavior that does not conformto the intended specification of a process [30]. Noncompliant actions can occur in var-ious forms, such as the accidental omission of tasks, performing tasks incorrectly, orperforming tasks without the proper authorization [263]. In the context of process-information fragmentation, noncompliant actions occur for the same reason as some

22 2.1. PROCESS INFORMATION IN ORGANIZATIONS
of the instances which lead to inefficient process execution: users execute processesbased on incorrect or outdated process information [31]. In these cases, the use ofincorrect process information negatively affects the outcome of the process. Theseeffects of noncompliance can be severe, including a loss of control over business pro-cesses [239], reduced quality of process outcomes [31], or financial penalties imposedby authorities [173].
In our case study, we observed several instances of noncompliance caused by ac-cess to incorrect process information. In the above, we described a situation where aprocess owner spent considerable time correcting mistakes in spreadsheets-based re-ports, resulting from the incorrect execution of a reporting process. However, not allmistakes were caught in this way. As a result, management still received incorrect re-ports on strategic decisions made by the purchasing department. In another case, anemployee used an outdated process specification while creating purchase orders. Thisultimately led to extra costs incurred by the organization to clear up these problemswith the supplier.
Problem Mitigation
The aforementioned problems demonstrate that the fragmentation of process informa-tion can have severe effects for organizations. From increased time spent on the exe-cution and maintenance of processes, to noncompliance issues affecting the outcomeof processes. There are two general directions that can help organizations to mitigatethese problems: (i) reduce the extent of the fragmentation and (ii) maintain and usefragmented information more efficiently.
The extent of process-information fragmentation can be reduced by removing ob-solete or redundant informational artifacts. Informational artifacts that do not have adistinct purpose from others should be discarded. In our case study, clean-up efforts re-vealed the existence of numerous outdated documents, as well as documents that werenever actually used. Organizations can also take measures to prevent this situation byestablishing guidelines for the documentation of process information. Such guidelinescan, for instance, aim to standardize the content and structure of informational artifacts.General guidelines can, for instance, be found for process models in the form of theSeven Process Modeling Guidelines (7PMG) [187] and for use case descriptions [212].A great additional benefit of standardization is that this makes process information eas-ier to retrieve, which improves maintenance and execution efficiency. Nevertheless, itis important to realize that, even in spite of such organizational measures, the frag-mentation of process information cannot be wholly avoided. Process stakeholders useinformational artifacts for various purposes, which justifies the need for informationalartifacts with different contents and representation formats. This calls for means tosupport this situation.
Technology can play an important role to support organizations to more efficientlymaintain and use fragmented process information. Research has proposed conceptssuch as data warehouses as general solutions to provide users with information invarious representation formats (see e.g., [62]). However, the use of data warehousescomes with great implementation efforts, requiring an overhaul of all existing process-information artifacts. For this reason, techniques that provide support to deal with the

CHAPTER 2. BACKGROUND 23
current way in which processes are documented can be highly valuable. Existing tech-niques, among others, focus on the propagation of process changes [280], the detectionof inconsistencies between process models [43, 123, 266], and the integration of in-formation from different artifacts [157, 178]. A limitation is that this existing researchfocuses primarily on highly-structured process information in the form of process mod-els and event logs. Process information in less-structured formats, such as naturallanguage documents, is largely ignored by existing work. This leaves a considerableresearch gap, which we aim to address in this thesis.
2.2 Core Definitions
The main process-information artifacts that we consider in the remainder of this thesisare process models, event logs, textual process descriptions, and textual descriptions ofPPIs. The latter two artifacts comprise unstructured natural language text, for which noformal definition can be provided. We formally define the former two artifacts, processmodels and event logs, in the remainder of this section.
2.2.1 Process ModelsProcess models can be created using a variety of modeling languages, such as Petri nets,Event-driven Process Chains (EPCs), and the Business Process Model and Notation(BPMN). The contributions of this thesis that take process models into account areindependent of the specific notation used to define a process model. Therefore, wedefine process models using a generic definition adapted from Smirnov et al. [255],given in Definition 2.4.
Definition 2.4 (Process Model). A process model is a tuple M = (A, E,G,N, F, t),where:• A is a finite set of activities,• E is a finite set of events,• G is a finite set of gateways,• N = A ∪ E ∪G is a finite set of nodes,• F ⊆ N × N is the flow relation, such that (N, F) is a connected graph,• t : G → {and, xor} is a mapping that associates each gateway with a type.
Figure 2.5 depicts an exemplary process model conforming to this definition. Roun-ded rectangles denote activities from set A, such as “Check document completeness”.Circles denote events from set E, such as “Application received”. Furthermore, thearrows are used to depict the flow relation F that exist between nodes from the setN = A ∪ E ∪ G. Gateways from set G, which represent routing points in the flowF, are depicted by diamond shapes. The diamond shapes that contain a plus symbolindicate concurrent streams of action. This means that, in the provided example, the“Check document completeness” and “Evaluate credit score” activities can be executedat the same time or in an arbitrary order. Finally, diamond shapes containing a crossrepresent decision points. In Figure 2.5 either “Decide on high-value loan” or “Decideon low-value loan” can be executed for a case going through the process, but not both.
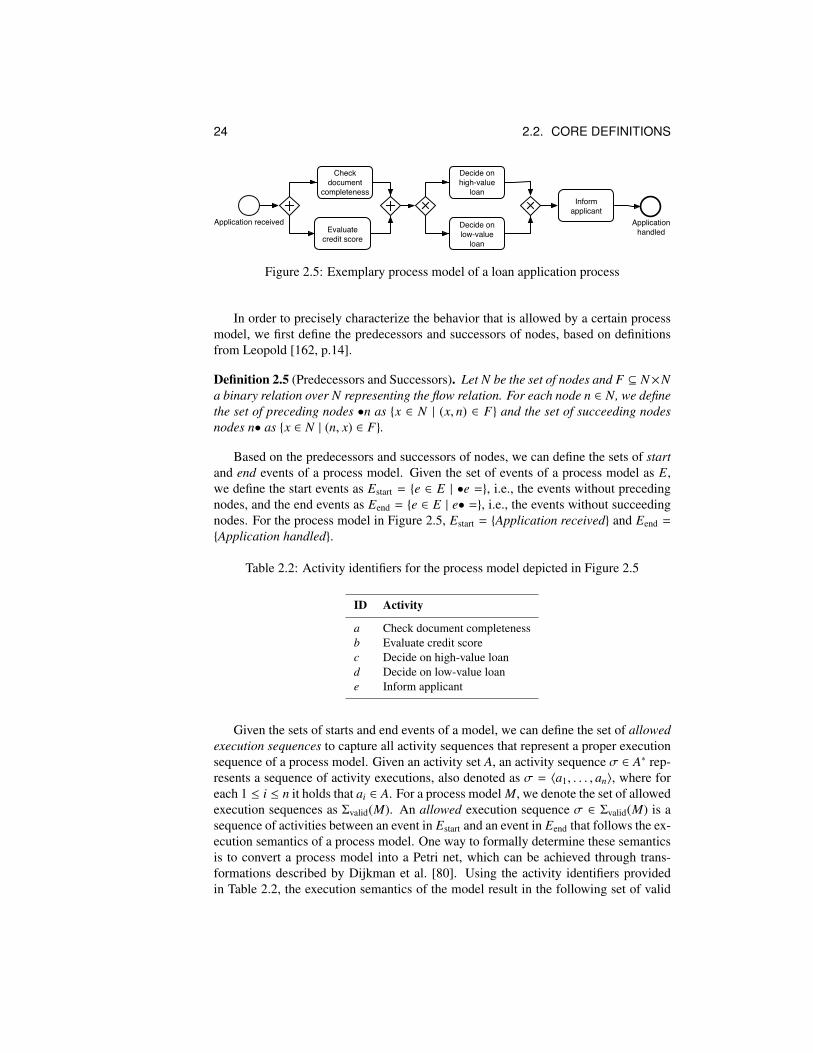
24 2.2. CORE DEFINITIONS
Application receivedEvaluate
credit score
Decide on high-value
loanInform
applicantApplication
handledDecide on low-value
loan
Check document
completeness
Figure 2.5: Exemplary process model of a loan application process
In order to precisely characterize the behavior that is allowed by a certain processmodel, we first define the predecessors and successors of nodes, based on definitionsfrom Leopold [162, p.14].
Definition 2.5 (Predecessors and Successors). Let N be the set of nodes and F ⊆ N×Na binary relation over N representing the flow relation. For each node n ∈ N, we definethe set of preceding nodes •n as {x ∈ N | (x, n) ∈ F} and the set of succeeding nodesnodes n• as {x ∈ N | (n, x) ∈ F}.
Based on the predecessors and successors of nodes, we can define the sets of startand end events of a process model. Given the set of events of a process model as E,we define the start events as Estart = {e ∈ E | •e =}, i.e., the events without precedingnodes, and the end events as Eend = {e ∈ E | e• =}, i.e., the events without succeedingnodes. For the process model in Figure 2.5, Estart = {Application received} and Eend =
{Application handled}.
Table 2.2: Activity identifiers for the process model depicted in Figure 2.5
ID Activity
a Check document completenessb Evaluate credit scorec Decide on high-value loand Decide on low-value loane Inform applicant
Given the sets of starts and end events of a model, we can define the set of allowedexecution sequences to capture all activity sequences that represent a proper executionsequence of a process model. Given an activity set A, an activity sequence σ ∈ A∗ rep-resents a sequence of activity executions, also denoted as σ = 〈a1, . . . , an〉, where foreach 1 ≤ i ≤ n it holds that ai ∈ A. For a process model M, we denote the set of allowedexecution sequences as Σvalid(M). An allowed execution sequence σ ∈ Σvalid(M) is asequence of activities between an event in Estart and an event in Eend that follows the ex-ecution semantics of a process model. One way to formally determine these semanticsis to convert a process model into a Petri net, which can be achieved through trans-formations described by Dijkman et al. [80]. Using the activity identifiers providedin Table 2.2, the execution semantics of the model result in the following set of valid

CHAPTER 2. BACKGROUND 25
sequences for the model depicted in Figure 2.5: Σvalid(M) = {〈a, b, c, e〉, 〈b, a, c, e〉,〈a, b, d, e〉, 〈b, a, d, e〉}.
2.2.2 Event LogsEvent logs are process-information artifacts that contain events recorded by systemsthroughout the execution of a business process. These events represent run-time infor-mation of how a process was actually executed. Table 2.3 shows a fragment of suchan event log. The table shows events related to the loan application process depictedin Figure 2.5. This section presents the formal definitions of events and event logsthat are of relevance to the remainder of this thesis. These definitions are based on thedefinitions provided by Van der Aalst [13, pp. 98–105].
Table 2.3: Excerpt of an exemplary event log
Properties
Case id Event id Timestamp Activity Resource . . .
1 129301 03-08-2017:11.02 Check doc. completeness Claudio . . .129302 04-08-2017:15.24 Evaluate credit score Adela . . .129303 07-08-2017:12.34 Decide on high value loan Ermeson . . .129304 07-08-2017:13.30 Inform applicant Jeroen . . .
2 578401 09-10-2017:09.30 Check completeness Franzi . . .578402 10-10-2017:15.24 Evaluate score Jennifer . . .578403 11-10-2017:10:15. Decide on low value loan Giuseppe . . .578404 11-10-2017:15.48 Inform applicant Justine . . .
. . . . . . . . . . . . . . . . . .
Table 2.3 illustrates that each event is associated with various properties, also re-ferred to as attributes. Definition 2.6 captures this.
Definition 2.6 (Event, Attribute). Let E be the event universe, i.e., the set of all possibleevent identifiers. Events may be characterized by various attributes, e.g., an eventmay have a timestamp, correspond to an activity, and be executed by a particularresource. Let AN be a set of attribute names. For any event e ∈ E and attribute namen ∈ AN : #n(e) is the value of attribute n for event e. If event e does not have anattribute named n, then #n(e) = ⊥.
A number of standard attributes are generally assumed for events, although events arenot required to have values for any of these [13, p.101]:
• #activity(e) is the activity associated to event e;• #timestamp(e) is the timestamp of event e;• #resource(e) is the resource associated to event e.• #trans(e) is the transaction type associated to event e, such as schedule, start, and
complete.

26 2.3. NATURAL LANGUAGE PROCESSING
Table 2.3 illustrates the majority of these attributes. For instance, the event inthe first row, with Event id 129301, corresponds to the “Check doc. completeness”activity, has the timestamp 03-09-2017:11.02 and the resource executing the activitywas Claudio. Although, for brevity, not depicted in the table, events can also have atrans attribute to capture the transaction type of an event. For example, the type startcan be used to denote the moment at which the execution of an activity began, whereascomplete can denote the moment at which the execution finished. These transactionalstatuses are particularly important when measuring process performance in the formof, for instance, processing times and waiting times.
Next, we define event classifiers as a means to group events together that sharea common attribute. In many cases, events are grouped either based on their activityname, e.g., to create a set of events that all correspond to the “Create credit score” activ-ity. However, events can also be classified based on (combinations of) other attributes,such the combination of the #activity and #trans attributes. Throughout this thesis, withoutloss of generality, we shall classify events based on the #activity attribute, as captured inthe following definition of event classes:
Definition 2.7 (Event Class). For any event e ∈ E , e = #activity(e) is the event class ofthe event e.
Aside from the standard attributes, events can be associated with activity-specificattributes. For instance, an event associated with the “Evaluate credit score” activitywill, most likely, be associated with an attribute that indicates the credit score thatresults from the conducted evaluation. By contrast, events corresponding to differentactivities will be associated with other specific attributes.
An event log consists of cases and cases consist of events. The events for a case arerepresented in the form of a trace, i.e., a sequence of unique events. Moreover, cases,like events, can have attributes.
Definition 2.8 (Case). Let C be the case universe, i.e., the set of all possible caseidentifiers. Cases, like events, have attributes. For any case c ∈ C and attribute namen ∈ AN : #n(c) is the value of attribute n for case c, where #n(c) = ⊥ indicates thatc has no attribute named n. Each case has a special attribute trace: #trace(c) ∈ E ∗.c = #trace(c) is a shorthand for referring to the trace of a case.
Definition 2.9 (Trace). A trace is a finite sequence of events σ ∈ E ∗ such that eachevent appears only once, i.e., for 1 ≤ i < j ≤ |σ| : σ(i) , σ( j).
Definition 2.10 (Event log). An event log is a set of cases L ⊆ C such that each eventappears at most once in the entire log, i.e., for any c1, c2 ∈ L such that c1 , c2 :δset(c1) ∩ δset(c2) = ∅.
Finally, we shall use E(L) to refer to the set of event classes of an event log L,defined as E(L) = {#activity(e) | c ∈ L ∧ e ∈ c}.
2.3 Natural Language ProcessingNatural Language Processing (NLP) is the scientific study of natural languages froma computational perspective [153]. Natural languages are the languages that people
CHAPTER 2. BACKGROUND 27
speak, which have evolved over time and are hard to pin down with explicit rules [48,p.ix]. Research in NLP is highly interdisciplinary, involving concepts from the fields ofcomputer science, linguistics, logic, and psychology [132]. NLP techniques are usedin various application domains, including machine translation [143, 205], question an-swering [288, 290], text classification [130, 201], and information extraction [82, 184].In this thesis, NLP is used for tasks that are related to this last domain: the extraction ofinformation. Specifically, we use NLP techniques to extract process information fromnatural language texts. For instance, given the sentence “Whenever a new order is re-ceived, an engineer first checks if the required parts are available”, we can build onNLP techniques to determine (i) which process steps are described, (ii) who performsthese steps, and (iii) which ordering relations exist between them.
In this section, we first describe the three main NLP tasks that are relevant to thisthesis. For the description of these tasks, our main goal is to clarify their usefulness,i.e., what can be achieved with them. Therefore, we put less emphasis on the technicalaspects of approaches and implementations. Section 2.3.1 discusses part-of-speechtagging, which assigns a role to words in a sentence. Then, Section 2.3.2 considersparsing techniques, which identify the grammatical structure of sentences. Afterwards,Section 2.3.3 considers reference resolution in natural language texts. Following thediscussion of the three main NLP tasks, Section 2.3.4 discusses the problem of naturallanguage ambiguity, which plays an important role in this thesis. Finally, Section 2.3.5concludes this part with a discussion of existing works that apply NLP techniques in aBPM context.
2.3.1 Part-of-Speech TaggingPart-of-speech tagging, or simply tagging, is the task of assigning a part of speech, i.e.,a tag indicating a word category, to each word in a natural language text [135]. Thistask provides important information for information-extraction purposes because itsoutput provides insights into the role of words and their neighbors. For instance, whenextracting process information, it is particularly important to understand if a multi-purpose term such as “order” corresponds to a verb or a noun in a particular sentence.
Part-of-speech taggers take as input a natural language text, most often a singlesentence, and, as output, return a part-of-speech tag for each word in the text. Asa basis for these taggers, various tagsets are available. These sets of part-of-speechtags are strongly language-dependent because tags reflect the word classes used by alanguage. For English, a seminal tagset is the one consisting of 87 tags used to annotatethe Brown corpus [98]. Popular tagsets that evolved from the Brown tagset are the 61-tag C5 set [106] and the 45-tag Penn Treebank set [181]. We here reflect in more depthon the latter, because it is used by the taggers that are part of the NLP tools employedin this thesis. Table 2.4 provides an overview of this set.
The following shows an example of the output provided by a tagger using the PennTreebank tagset for the sentence “An order can arrive at the department.”:
An/DT order/NN can/MD arrive/VB at/IN the/DT department/NN ./.
It is straightforward for human readers to interpret this sentence and provide the
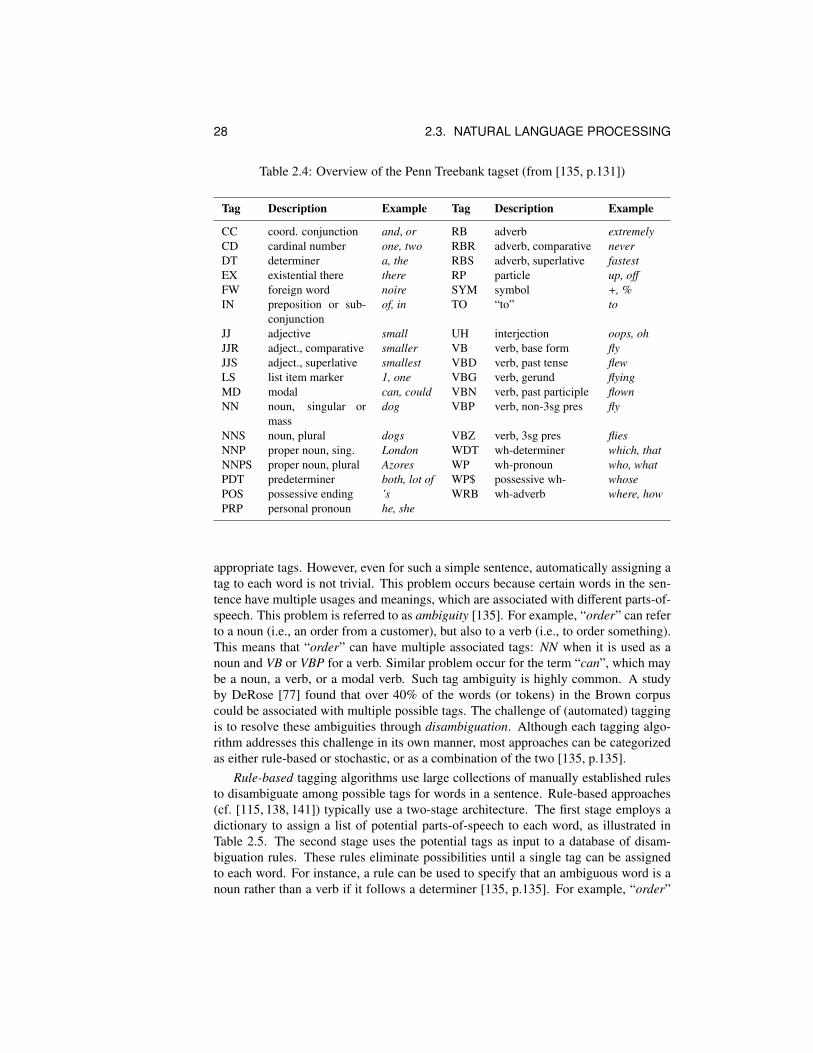
28 2.3. NATURAL LANGUAGE PROCESSING
Table 2.4: Overview of the Penn Treebank tagset (from [135, p.131])
Tag Description Example Tag Description Example
CC coord. conjunction and, or RB adverb extremelyCD cardinal number one, two RBR adverb, comparative neverDT determiner a, the RBS adverb, superlative fastestEX existential there there RP particle up, off
FW foreign word noire SYM symbol +, %IN preposition or sub-
conjunctionof, in TO “to” to
JJ adjective small UH interjection oops, ohJJR adject., comparative smaller VB verb, base form flyJJS adject., superlative smallest VBD verb, past tense flewLS list item marker 1, one VBG verb, gerund flyingMD modal can, could VBN verb, past participle flownNN noun, singular or
massdog VBP verb, non-3sg pres fly
NNS noun, plural dogs VBZ verb, 3sg pres fliesNNP proper noun, sing. London WDT wh-determiner which, thatNNPS proper noun, plural Azores WP wh-pronoun who, whatPDT predeterminer both, lot of WP$ possessive wh- whosePOS possessive ending ’s WRB wh-adverb where, howPRP personal pronoun he, she
appropriate tags. However, even for such a simple sentence, automatically assigning atag to each word is not trivial. This problem occurs because certain words in the sen-tence have multiple usages and meanings, which are associated with different parts-of-speech. This problem is referred to as ambiguity [135]. For example, “order” can referto a noun (i.e., an order from a customer), but also to a verb (i.e., to order something).This means that “order” can have multiple associated tags: NN when it is used as anoun and VB or VBP for a verb. Similar problem occur for the term “can”, which maybe a noun, a verb, or a modal verb. Such tag ambiguity is highly common. A studyby DeRose [77] found that over 40% of the words (or tokens) in the Brown corpuscould be associated with multiple possible tags. The challenge of (automated) taggingis to resolve these ambiguities through disambiguation. Although each tagging algo-rithm addresses this challenge in its own manner, most approaches can be categorizedas either rule-based or stochastic, or as a combination of the two [135, p.135].
Rule-based tagging algorithms use large collections of manually established rulesto disambiguate among possible tags for words in a sentence. Rule-based approaches(cf. [115, 138, 141]) typically use a two-stage architecture. The first stage employs adictionary to assign a list of potential parts-of-speech to each word, as illustrated inTable 2.5. The second stage uses the potential tags as input to a database of disam-biguation rules. These rules eliminate possibilities until a single tag can be assignedto each word. For instance, a rule can be used to specify that an ambiguous word is anoun rather than a verb if it follows a determiner [135, p.135]. For example, “order”

CHAPTER 2. BACKGROUND 29
Table 2.5: Possible tags for an exemplary sentence, with correct tags in bold
Word Possible Tags Word Possible Tags
An DT at INorder NN, VB, VBP the DTcan NN, VB, VBP, MD department NNarrive VB, VBP
is tagged with NN when it precedes a determiner such as “an”, i.e., an/DT order/NN.The interested reader is referred to [138] for detailed insights into modern rule-basedapproaches.
Stochastic taggers disambiguate among potential tags by using an annotated train-ing corpus to determine the probability of a given word having a given tag in a givencontext [135, p.135]. An important conceptual difference to rule-based taggers is thatstochastic taggers learn methods for disambiguation, rather than depend on manuallyestablished rules. For example, given a tagged corpus, a stochastic parser can infer thatthe term “order” has a high (or possibly even 1.0) probability of receiving a NN tagwhen it appears directly after a determinant (DT) or an adjective (JJ). The parser willlearn this, because it can count the number of times that such a sequence occurs. Theearliest stochastic tagger was defined by Bahl and Mercer [36]. Several stochastic ap-proaches followed up on this in the next decades (cf. [65, 69, 77]). A widely employedalgorithm for stochastic tagging is the Hidden Markov Model (HMM) [196]. HMMsuse Bayesian inference to determine the most probable sequence of tags for the wordsin a sentence.
Compared to rule-based taggers, HMM-based taggers have the great advantage thatthey assign tags by considering an entire sentence, rather than just looking at a wordand its neighbors in isolation.
Both rule-based and stochastic tagging approaches have their own merits and down-sides. A clear downside of rule-based taggers is that the construction and maintenanceof a hand-crafted rule set is a highly time-consuming and labor-intensive task [136].Furthermore, these approaches do not consider words in the context of an entire sen-tence, which can be necessary in certain case. Compared to rule-based taggers, HMM-based taggers have the great advantage that they assign tags by considering an entiresentence, rather than just looking at a word and its neighbors in isolation. However,a downside of stochastic taggers is that they require a large amount of training datato achieve high levels of accuracy. Furthermore, these approaches do not use anyprior linguistic knowledge that might improve their accuracy. Recognizing these dif-ferences, several hybrid tagging approaches have been developed that combine aspectsof rule-based and stochastic tagging. For example, works by Brill [53] and Brants [51]combine rule-based linguistic knowledge with stochastic methods that support context-dependent disambiguation.
In this thesis, we employ taggers, specifically HMMs, as part of our approach PPI-transformation approach described in Chapter 6.

30 2.3. NATURAL LANGUAGE PROCESSING
2.3.2 Sentence ParsingNatural language parsing, or simply parsing, is the task of assigning a grammaticalstructure to an input string. The difference to tagging is that parsing primarily focuseson the relations that exist among words, whereas tagging focuses on the role of individ-ual words. A so-called parser takes as input a natural language text, most commonlya single sentence, and as output provides a structured representation of the grammat-ical relations for the words within this sentence. In this section we describe parsingaccording to two such representations: parse trees and dependency grammars.
Parse Trees
Parse trees are a commonly employed means to represent the grammatical structureof a sentence. The use of a tree to represent grammatical structure is based on thenotion of constituency. Constituency states that groups of words can behave as a singleunit or phrase, i.e., a constituent [135, p.385]. For instance, noun phrases can often beregarded as single units from a grammatical viewpoint. In these cases, it does not matterif a noun phrase consists of a single word, such as “they”, or of a larger group of words,such as “the parts required for a customized bike”; in both cases, the grammaticalrelation of the noun phrase to surroundings words remains the same. For instance, forboth noun phrases, a verb has to follow using the third person-plural form, e.g., “theyarrive” and “the parts required for a customized bike arrive.” A parse tree capturesconstituents in a hierarchical manner, such as visualized in Figure 2.6.
order A
NP VP
S
DT NN
can
MD VP
VB PP
arrive IN
department
NP
NN MD
the
at
Figure 2.6: Example of a parse tree.
The way in which a parse tree can be structured is defined by so-called produc-tion rules. The most commonly used mathematical foundation for this purpose is theContext-Free Grammar (CFG), as originally formalized by Backus [34] and Chom-sky [64]. A production rule in a CFG expresses the way in which the symbols of alanguage can be grouped and ordered together. For example, the following rule ex-

CHAPTER 2. BACKGROUND 31
presses that a sentence can consist of a noun phrase (NP) followed by a verb phrase(VP):
S → NP VP
In turn, the following rules specify that a noun phrase can be composed of either apronoun (e.g., “he” or “they”), a proper-noun (e.g., a name), or of a determiner (Det)followed by a Nominal, where a Nominal refers to a constituency of one or more Nouns:
NP→ Det Nominal
NP→ Proper-Noun
NP→ Noun | NominalNoun
The goal of parsing is to automatically identify the most likely parse tree for agiven sentence. This task can be viewed as a search through the space of possible parsetrees to find the correct grammatical structure. Similar to part-of-speech tagging, it isimportant to disambiguate among the different meanings or different grammatical rolesthat words can have. In order to resolve these ambiguities, many parsers are basedon probabilistic models of syntax, such as the Probabilistic Context-Free Grammar(PCFG) [127, p.237]. These models extend regular CFGs with information on thelikelihood with which certain rules occur. As a basis for the parsing task, two sets ofconstraints guide the search process: one set contains the rules of the PCFG and theother is based on the input sentence. Both of these sets pose constraints on the finaloutput of the parser. For example, constraints based on the input sentence define theleaves of the parse tree to be constructed. These two sets of constraints give rise to twosearch strategies: top-down and bottom-up search [88]. Top-down parsers search for aparse tree by trying to build from the root node S down to the leaves. These parsersthus start from the grammatical constraints of the CFG. By contrast, bottom-up parserssearch for a parse tree by building up from the words of the input sentence [118, 183].We refer the interested reader to e.g., [135, p.428] for a detailed explanation of bothsearch strategies.
In this thesis, we employ parsing techniques in the approaches presented in Chap-ters 3 and 5. There, we use parse trees to extract phrases that correspond to relevantprocess concepts from textual process descriptions. For this task, we employ the PCFGparser included in the Stanford Parser [140].
Dependency Grammars
Dependency grammars provide an alternative means to represent the grammatical struc-ture of sentences. These grammars capture the grammatical relationships among thewords in a sentence using dependency relations. A typed dependency relation describesa relation of a certain type that exists between two words. For example, the relationdobj(receive, goods) denotes the direct object of a verb, i.e., “goods” is the object of theverb “receive”. A commonly employed dependency grammar is defined by Marneffe etal. [74]; the dependencies in this grammar are referred to as the Stanford Dependencies.Table 2.6 presents some of the most common dependency relations in this grammar.

32 2.3. NATURAL LANGUAGE PROCESSING
Table 2.6: Exemplary Stanford dependencies (from [74])
Dependency Description Example
nsubj Nominal subject nsubj(arrive, order)dobj Direct object dobj(receive, goods)det Determiner det(the, department)amod Adjectival modifier amod(order, new)nmod Nominal modifier nmod(arrive, company)case Case-marking case(arrive, at)
To obtain the grammatical dependencies for a sentence, it is possible to exploit theclose relation that exists between the dependencies and the structure of parse trees.Due to this relation, Stanford dependencies can be automatically derived from a parsetree [73,289]. As such, developments in parsing algorithms can be utilized to generategrammatical dependencies with high accuracy. Alternatively, dependency parsers ex-ist that directly compute grammatical dependencies from a sentence [170, 260]. Whiledependency parsers for English are less accurate than methods that derive dependencyrelations from parse trees, their application can be beneficial for other languages [73].In particular, dependency parsers can handle languages with relatively free word order-ing, such as Czech. In these cases, a phrase-structure grammar requires an abundanceof rules to capture all word orders, whereas the use of grammatical dependencies avoidsthis problem [135, p.415].
In this thesis, we use grammatical dependencies in the approaches presented inChapters 3 and 5. We use dependencies next to parse trees, because dependenciesare more convenient for the extraction of word-pairs, such as verbs and their subjects.For this purpose, we use the Stanford Dependencies implementation provided by theStanford Parser [140].
2.3.3 Reference ResolutionReference resolution is the task of determining what entities are referred to by linguisticexpressions [135, p.695]. We illustrate the importance of references in natural languagetexts by considering the following passage:
“John von Neumann was one of the founding fathers of computing. The Hungarian-born mathematician invented the merge sort algorithm in 1945. He also made majorcontributions to the fields of mathematics, physics, economics, and statistics.”
To properly interpret this passage, it is paramount to recognize that all three under-lined phrases refer to same entity: John von Neumann. Reference resolution is the taskthat aims to achieve this. Here, we discuss two cases of this task: anaphora resolutionand coreference resolution.
Anaphora resolution is the task of finding the antecedent of a single pronoun, e.g.,he or it. For example, identifying that “he” refers to John von Neumann. Anaphora

CHAPTER 2. BACKGROUND 33
resolution approaches take as input a natural language text, often comprising morethan one sentence, and as output return the most likely antecedent for each pronounin the text. A variety of approaches exist for this purpose, such as the seminal Hobbsalgorithm [125], and more advanced techniques that followed up on this [107, 160].Common among these approaches is that they check the agreement of certain featuresbetween the pronoun and potential antecedents. For instance, an important feature isthe numerical agreement between pronoun and a candidate. A singular pronoun, e.g.,“he”, will not be used to refer to a plural entity such as “managers”. Other typicalfeatures are the textual distance between pronoun and antecedent, and grammaticalroles [135, p.701]. By analyzing a set of features, anaphora resolution approaches aimto identify the most likely candidate for an anaphoric reference.
Coreference resolution is the task of finding expressions in a text that refer to thesame entity, i.e., finding expressions that corefer. This task encompasses the subtaskof anaphora resolution. A set of coreferring expressions is called a coreference chain.For instance, the set {“John von Neumann”, “The Hungarian-born mathematician”,“he”} forms a single chain in the aforementioned passage. Coreference resolutionpresents a highly complex challenge, for which numerous techniques have been de-veloped. These techniques employ machine learning methods, such as HMMs [257]and decision trees [185], but also exploit external knowledge sources, such as encyclo-pedic entries and dedicated corpora [217,268]. Despite great advancements in the usedtechniques, the accuracy of resolution approaches still strongly depends on the contextand on the availability of relevant information in corpora [220].
Reference resolution plays an important role in the approaches that focus on theanalysis of textual process descriptions, Chapters 3 and 5. These texts typically con-tain numerous coreferences that must be resolved to properly understand the relationsbetween described process steps.
2.3.4 Natural Language AmbiguityAmbiguity is a pervasive problem in natural language comprehension [231]. As a re-sult of this, the challenge that most NLP tasks face can be viewed as the need to re-solve ambiguity, so-called disambiguitation [135, p.4]. In fact, disambiguation playsan important role in all of the previously considered NLP tasks: tagging, parsing, andreference resolution. In many cases, NLP techniques can successfully resolve ambigu-ity, especially when it occurs at the word-level. For example, given the sentence “Anorder is received,” disambiguation techniques used in both taggers and parsers willcorrectly identify that “order” represents a noun rather than a verb in this sentence.Disambiguation can be highly challenging, especially in the context of coreferenceresolution. However, it is important to differentiate between ambiguity that can betheoretically resolved, i.e., given sufficiently advanced techniques, and true ambiguitythat cannot be resolved without further contextual information, neither by automatedapproaches nor by humans.
To illustrate true ambiguity, consider the sentence “The boy saw a man on the hillwith a telescope.” This sentence can have numerous plausible interpretations. Theseinterpretations vary, among others, on who is on the hill (“the boy” or “a man”) andon the possessor or the location of the telescope (“I”, “a man”, or it is “on the hill”).

34 2.3. NATURAL LANGUAGE PROCESSING
For example, the boy can be using a telescope to see the man who is standing on thehill or the boy can be standing on the hill and see a man who has a telescope. Withoutfurther contextual knowledge, it is not possible to disambiguate among these differentinterpretations As a result, NLP techniques typically return what they consider to bethe most likely interpretation, but there is no guarantee that this interpretation capturesthe correct meaning of the sentence.
Natural language ambiguity plays an important role in this thesis. As described inthe previous section, the resolution of references, a key example of disambiguation, isnecessary for the interpretation of textual process descriptions. Furthermore, in Chap-ter 5 we pay particular attention to the impact that true ambiguity has on the analysisof process descriptions from a compliance-checking perspective.
2.3.5 Applications in Business Process Management
A variety of works exist that apply NLP in the context of BPM. To provide an overview,we here subdivide the discussion into research that focuses on text inside process mod-els and research that analyzes natural language outside of process models, captured inexternal text documents.
Approaches that analyze language inside process models focus on the labels ofprocess model elements, mostly activity and event labels. Such techniques serve vari-ous purposes. A number of approaches aim to improve the quality of process models.These approaches analyze the quality and consistency of activity labels in a model, forexample by detecting and/or correcting inconsistent use of terminology [148] or viola-tions of labeling conventions [45,164,271]. Others aim to improve modeling quality bydetecting common modeling errors [120] or ambiguously labeled activities [213, 214].Some approaches add information to a process model by annotating model elementswith semantic or ontological information [49, 97, 165]. Lastly, there are approachesthat distill information by analyzing the labels of activities in a process model repos-itory. Mostly, such techniques focus on the detection of service candidates, whichcorrespond to process patterns that occur repeatedly throughout process models in acollection [100, 142, 168, 207].
Approaches that analyze process-related text documents primarily focus on the elic-itation of process models from natural language texts. Several approaches have beendeveloped for this purpose in recent years. These approaches elicit process modelsfrom different kinds of texts. Some focus on specific text types, such as the genera-tion of models from use cases [253], group stories [111], or methodological descrip-tions [90], while others take general textual process descriptions as input [99, 108].These techniques combine extensive use of NLP tools with specifically tailored anal-ysis techniques, in order to extract process-related information from natural languagetexts. Despite the use of state-of-the-art NLP tools, the existing approaches have beenfound to produce inaccurate models, which require extensive manual revision [250].
The research presented in this thesis builds on several of the aforementioned ap-proaches. Most prominently, in Chapter 5 we build on existing work on the generationof process models from natural language texts.

CHAPTER 2. BACKGROUND 35
2.4 MatchingThe automated techniques presented in this thesis focus on the comparison and integra-tion of process information contained in different artifacts. These techniques share areliance on the identification of correspondences between process concepts containedin the different artifacts. For example, correspondences between parts of a text andcomponents of a process model are required in order to determine if a textual pro-cess description describes a process in the same way as a process model. In recentyears, a plethora of so-called matching techniques have been developed that set out toautomatically identify such inter-artifact relations [109]. Matching techniques are de-veloped and applied in various fields, including schema matching and ontology align-ment. Schema matching takes two database schemas as input and produces a mappingbetween elements of the schemas that correspond semantically to each other [224].These mappings, also referred to as alignments, play a central role in applications,such as schema integration [44, 206], data warehousing [47], and semantic query pro-cessing [272]. Ontology alignment concerns the identification of correspondences be-tween the elements of two ontologies [203]. Ontologies are abstract models that ex-plicitly define concepts, their properties, and their inter-relations for a specific domain(cf. [119, 264]). Uses of ontology alignments include instance translation [68], on-tology extension [85], and ontology merging [204]. The usefulness of matching hasalso been recognized in the context of BPM, most prominently in the form of processmodel matching techniques, which establish alignments between activities from dif-ferent process models. These are, among others, used to detect differences betweenmodels [156], for the harmonization of process model variants [157], process query-ing [131], and to automatically propagate process changes [280]. Other techniquesfocus on the alignment of other process-information artifacts, such as techniques thatalign event classes from event logs to process model activities [37, 251].
In the remainder of this section, we elaborate on the matching task and matchingtechniques. We first illustrate the goal of matching in Section 2.4.1, by consideringa process model matching scenario. Then, Section 2.4.2 provides definitions relevantto the matching task. In Section 2.4.3, we discuss measures to compute textual sim-ilarity, which represent a core component of nearly all matching techniques. Lastly,Section 2.4.4 presents a reflection on existing techniques for matching in a BPM con-text.
2.4.1 Matching ExampleIn this section, we discuss the goal of matching based on a process model matchingscenario. Given two process models with their respective sets of activities A1 and A2,the goal of process model matching is to identify the activities (or sets of activities)from A1 and A2 that represent similar behavior. We illustrate this using the processmodels depicted in Figure 2.7.
This figure depicts two process models, both describing admission processes ofuniversities, and their highlighted correspondences. Some of the correspondences inFigure 2.7 are evident. For example, both process models contain an activity with thelabel “Send decision letter,” which shows that these activities represent similar process

36 2.4. MATCHING
Receive application
Uni
vers
ity 1
U
nive
rsity
2
Check documents
Assess applicant
Invite for interview
Send decision letter
Receive form
Check if form is
complete
Check if bachelor is sufficient
Send decision letter
Invite for aptitude test
Figure 2.7: Two process models and their correspondences (adapted from [155])
steps. The correspondence between “Receive application” and “Receive form” is alsoclear, even though their activity labels are not completely identical. However, other cor-respondences are less straightforward. The activity “Check documents” in the modelof University 1 corresponds to two activities in the other model, “Check if form is com-plete” and “Check if bachelor is sufficient”. This example illustrates that the cardinalityof correspondences does not have to be one-to-one, but can also be one-to-many andeven many-to-many. In this particular case, the one-to-many relation illustrates that the“Check documents” activity encompasses the “Check if form is complete” and “Checkif bachelor is sufficient” activities from the second model.
Furthermore, upon closer inspection, it becomes clear that these correspondencesare highly specific to the context in which they appear, i.e., in the context of universityadmission processes. For example, in other contexts, the correspondences between“Check documents”, on the one hand, and “Check if form is complete” and “Check ifbachelor is sufficient”, on the other, are likely to not exist.
2.4.2 The Matching Task
The goal of matching is to automatically identify correspondences between concepts intwo informational artifacts. We formally define this matching task based upon notionsfrom [103]. Let C1 and C2 be two sets of concepts to be aligned, e.g., two sets of pro-cess model activities for process model matching scenarios. A matching task createsan n × n′ similarity matrix M(C1,C2) over C1 × C2. Each Mi, j in the matrix repre-sents a degree of similarity, usually a real number in [0, 1], between the i-th conceptin C1 and the j-th concept in C2. To perform the matching task, matching techniquestypically perform several sequential steps, in which different classes of matchers are ap-plied. An important distinction exists between so-called First-Line Matchers (FLMs)and Second-Line Matchers (SLMs) [104].

CHAPTER 2. BACKGROUND 37
A FLM establishes a similarity matrix by analyzing the concepts contained in theartifacts C1 and C2. For any pair of concepts c1 ∈ C1 and c2 ∈ C2, an FLM produces ascore [0,1] that quantifies the similarity between c1 and c2 by considering certain sim-ilarity characteristics. Most FLMs focus on the labels associated with c1 and c2, suchas the activity labels in Figure 2.7. In the context of processes, other useful input forFLMs include behavioral and structural relations between process concepts. In con-trast to FLMs, SLMs ignore any information contained in the informational artifacts.Instead, they establish a similarity matrix from an input of one or more other similaritymatrices. Two commonly used categories of SLMs are ensemble matchers and deci-sion makers. Ensemble matchers combine the values of multiple similarity matricesinto one. For example, an ensemble matcher can be used to combine the results of anFLM that analyzes labels and another FLM that considers behavioral relations betweenprocess concepts. Decision makers are SLMs that take a non-binary similarity matrix(with values in the range [0,1]), as created by a FLM or an ensemble matcher, andconvert it into a binary matrix (with values in {0, 1}). For example, a decision makercan be used to select only those correspondences with a similarity score above a certainthreshold. The decision maker turns these scores into 1, whereas correspondences witha lower similarity score receive a 0. Decision makers are typically used to provide thefinal output of the matching task, i.e., to select the correspondences that are includedin the alignment provide by the matching technique.
In the next section, we discuss measures used by FLMs to quantify similarity be-tween text fragments, e.g., between activity labels. We specifically highlight thesemeasures because they represent a crucial component of most matching techniquesand because we employ them in the matching techniques presented in this thesis.
2.4.3 Similarity Measures
Textual contents are an important source of information to determine the similaritybetween concepts in a matching task. For example, for process model matching, simi-larity of activity labels is a vital component of most matching techniques. Labels thatare syntactically similar (e.g., “receive application”, “receive online application”) orsemantically similar (e.g., “deliver products”, “send order”) are good indicators thattheir corresponding activities describe similar process behavior. A plethora of similar-ity measures exist that can be used to compute the degree of similarity between two textfragments. Below, we first discuss certain normalization steps that can be applied ontext fragments in order to improve the usefulness of such measures. Then, followingAlgergawy et al. [28] we separately consider the streams of syntactic and semantic sim-ilarity measures. Without a loss of generality, we illustrate the concepts and measuresthroughout this section with example fragments in the form of process model activitylabels.
Normalization
In order to make text fragments more comparable, they are typically first normalized.This normalization phase can consist of several steps, including:

38 2.4. MATCHING
• Tokenization: A fragment is split into a set of tokens, each corresponding to asingle word or term. Typically, tokenization can be performed by consideringwhitespace characters contained in the texts, e.g., “deliver goods”→ {“deliver”,“goods”}. However, in other cases different delimiters may be required for tok-enization, such as punctuation or uppercase characters, e.g., “deliverGoods” →{“deliver”, “goods”}.• Expansion: Abbreviations and acronyms are expanded, e.g., “PO”→{“purchase”,
“order”}. Various approaches exist that address this task, for instance by ex-tracting information on abbreviations from corpora of textual documents, seee.g., [200, 293].• Stemming: Suffixes from words are removed in order to transform differing terms
to the same form, e.g., connected, connecting, and connection are all stemmed tothe term connect. The most commonly applied stemming algorithm is Porter’salgorithm [219].• Lemmatization: All terms are transformed into their grammatical base forms.
Lemmatization can be performed using standard NLP tools, such as the StanfordCoreNLP [180]. An important advantage compared to stemming is that lemma-tization can handle more complex transformations, such as irregular verbs. Forinstance, sing, sang, and sung are all mapped to the common lemma sing. Adownside is that lemmatization is taxonomy-based; it can only be applied toterms that are included in a taxonomy or dictionary. By contrast, stemming isrule-based, which means that it can also be applied to unknown words.• Stop-word removal: Common words that are of little value when considering
textual similarity are removed from consideration [179]. Typical words to beremoved are closed class terms, such as prepositions (“the”, “an”) and conjunc-tions (“and”, “or”).
As a result of the normalization phase, activity labels are split into sets of tokensfrom which information that can obscure the effective computation of similarity hasbeen removed. For example, by combining normalization steps, given two activity la-bels “Receive the purchase order” and “PO receipt”, we can obtain equal sets of tokensfor each label: {“receive”, “purchase”, “order”}. Due to this normalization, any simi-larity measure will now recognize the similarity between these activities, whereas thismight not have been the case for the non-normalized labels. Note that the discussednormalization steps abstract from certain details that might be relevant to the compu-tation of similarity in particular use cases. For instance, tokenization abstracts fromthe order in which terms occur in a label by producing a set of tokens. While this ab-straction is valuable in most use cases, such as the previous example, it is imaginablethat term order is relevant in other alignment scenarios. Similarly, certain stop-wordsthat are generally removed in normalization steps (such as “and” and“or”) might berelevant to the computation of similarity in specific cases. Therefore, it is important toconsider which normalization steps are suitable to the specific use case for which theyare applied.
Given two sets of tokens ω1 and ω2 resulting from a normalization phase, the nextstep to compute label similarity is to determine the similarity between individual terms,i.e., sim(t1, t2) for t1 ∈ ω1 and t2 ∈ ω2. For this purpose, both syntactic and semanticsimilarity measures can be used.

CHAPTER 2. BACKGROUND 39
Syntactic Similarity Measures
Syntactic similarity measures compute the degree of similarity between two tokens bycomparing their character sequences. A plethora of measures have been developedfor this purpose, see e.g., Cohen et al. [66] and Navarro [202] for overviews. Two ofthe most commonly employed measures are the Levenshtein distance and the N-gramdistance:
• Levenshtein distance: Given two tokens t1 and t2, the Levenshtein distance, alsoreferred to as the edit distance, is given by the minimum number of single-character operations (i.e., insertion, deletion, and substitution of a character)required to transform t1 into t2 [291]. The following equation formalizes this:
simedit(t1, t2) = 1 −editDistance(t1, t2)
max(|t1|, |t2|)(2.1)
In Equation 2.1, editDistance(t1, t2) denotes the minimum cost of edit operationsnecessary for the transformation between t1 and t2. This computation can includevarying costs for the different operations.
• N-gram distance: An n-gram is a slice of n characters of a longer string [70].Typical values for n are 2, where the slices are referred to as di-grams, and 3,referred to as tri-grams. For example, the term “order” consists of the followingbi-grams: { o, or, rd, de, er, r }. The n-gram distance between two to-kens t1 and t2 quantifies the fraction of overlapping n-grams. The main benefit ofn-gram-based similarity is that it is resistant to a wide variety of textual errors.This follows because the decomposition of the string means that any errors (e.g.,typographical errors) affect only a limited number of the decomposed parts [57].The n-gram distance between two tokens t1 and t2 is defined as:
simn-gram(t1, t2) =2 × |n-gram(t1) ∩ n-gram(t2)||n-gram(t1)| + |n-gram(t2)|
(2.2)
Syntactic similarity measures have been widely employed in various matching con-texts. A clear advantage of syntactic measures such as the Levenshtein distance is thatthey can be applied without any external sources. This makes them language- anddomain-independent [70]. Furthermore, they are able to recognize similarity in spiteof typographical errors [57]. Table 2.7 illustrates this. The syntactic similarity (simedit)between agreement and argeement is high, despite the obvious error in the latter term.However, syntactic similarity measures also have their limitations. In particular, syn-tactic measures may assign high similar scores to terms with a highly dissimilar mean-ing. For example, the Levenshtein distance between “contact” and “contract” is min-imal, resulting in a high similarity score. Such a similarity assessment can produceproblematic results in process model matching, where the goal is to identify activitiesthat refer to a semantically similar process step. Also, Table 2.7 shows that syntacticsimilarity measures cannot identify words with similar meanings, such as contract andagreement. Semantic similarity measures aim to overcome these issues.

40 2.4. MATCHING
Table 2.7: Comparison of syntactic and semantic similarity scores
t1 t2 simedit simlin
agreement argeement 0.88 n/acontract contact 0.88 0.10contract agreement 0.11 0.96
Semantic Similarity Measures
Semantic similarity measures consider word similarity based on the meaning of words,rather than their syntactic contents. For example, the words “contract” and “agree-ment” have a high semantic similarity, because they both describe an exchange ofpromises. Semantic similarity measures are based on NLP techniques and typicallystrongly rely on the use of external sources, such as text corpora or lexicons [28].Following Agirre et al. [26], we distinguish two major streams of semantic measures:WordNet-based measures and distributional similarity measures.
WordNet-based measures, also referred to as taxonomy-based, consider similarityfrom the perspective of the semantic relations that can exist between words. For thesemeasures, the most important relations to consider are synonymy, homonymy, hyper-nomy, and meronomy. Table 2.8 provides an overview of these. For example, thesynonymy relation indicates that two words have the same meaning, whereas the hy-ponomy relation indicates that one word is more specific than another. Each semanticrelation can be derived from a taxonomy of terms. The most commonly employed tax-onomy for this purpose is based on WordNet. WordNet is a lexical database for the En-glish language that organizes words into sets of synonyms, so-called synsets [194,195].From the relations that exist between these synsets, a taxonomy can be established thatcaptures the semantic relations depicted in Table 2.8. The Lin similarity represents animplementation of a WordNet-based similarity measure:
Table 2.8: Overview of semantic word relations
Relation Description Example
Synonymy Words have the same or similar mean-ing
bill & invoice
Homonymy A word with multiple different mean-ings
application → computer programor written request
Hypernomy Words have a hierarchical (type-of ) re-lation between their meanings
vehicle & car
Meronymy Words have a part-of relation betweentheir meanings
wheel & car
• Lin similarity: Lin [169] proposes a theoretical notion of semantic similaritybased on the informational content of the common ancestor of two terms in a

CHAPTER 2. BACKGROUND 41
taxonomy. Lin similarity operationalizes this similarity theorem as follows:
simLin(t1, t2) =2 × log P(anc(t1, t2))log P(t1) + log P(t2)
(2.3)
In Equation 2.3, anc(t1, t2) represents the synset that is the closest ancestor of t1and t2 in the taxonomy and log P(t) denotes the occurrence probability of wordsin the synset containing token t. In this way, Lin similarity considers the meaningof terms, as well as their commonality.
Distributional similarity measures are based on the statistical analysis of co-occurren-ces of terms in large text collections. Specifically, given two terms t1 and t2, thesemeasures consider how similar the words that surround t1 and t2 are to each other.The underlying intuition is that words with a similar meaning occur in similar con-texts [193]. The great advantage of second order measures is that they do not relyon manually established lexical resources such as WordNet, which are unavailable fornumerous domains and languages [145]. Due to this independence, second order simi-larity measures can be trained to deal with context-specific terms [128]. This is particu-larly relevant in the business settings where process model matching is mostly applied,because processes in these settings often use domain-specific terms.
Several methods provide distributional similarity measures, such as methods pro-posed by Landauer et al. [159], commonly known as Latent Semantic Analysis, Grefen-stette [116], Dorow and Widdows [84], and Rapp [226]. Here, we describe a similaritymeasure proposed by Kolb [145, 146] in more detail:
• DISCO: The DISCO similarity measure distinguishes itself from other distribu-tional similarity measures because it takes the distance between a word and itsneighboring words into account. In particular, it computes the distribution basedon weighted word vectors, which take into account the co-occurrence of words,as well as their relative position. Intuitively, this measure finds the words thatshare a maximum number of common co-occurrences. For brevity, we here omitthe depiction of the extensive equations required for this computation.
In this thesis, we employ both Lin and Disco similarity to compute the semanticsimilarity between process concepts. Furthermore, we combine this with the use of theLevenshtein distance for terms that are not recognized by our semantic measures, e.g.,agreement—argeement.
Token-Set Similarity
The previously considered syntactic and semantic similarity measures can be used tocompute a similarity score between individual tokens. Several methods exist that usethese token-similarity scores to compute a degree of similarity between two sets oftokens ω1 and ω2. One method is to take the average of the highest similarity score foreach token in one set against all tokens in the other [176], as given by the followingequation:

42 2.4. MATCHING
simavg(ω1, ω2) =
∑t1∈ω1
[maxt2∈ω2
sim(t1, t2)] +∑
t2∈ω2
[maxt1∈ω1
sim(t1, t2)]
|ω1| + |ω2|(2.4)
When determining token-set similarity, it can also be useful to take the specificityof terms into account, aside from just the similarity of terms. Term specificity refersto the discriminatory power of terms in a given context. The underlying intuition isthat terms that occur often in a particular context (e.g., in a particular business pro-cess) are less useful for the identification of similarity than relatively rare terms. Toillustrate this, consider an activity labeled “deliver order” in an order handling process.The term order is most likely to occur in many activities in this process, which makesit hardly helpful when determining the similarity between activities. By contrast, theterm deliver is likely more rare in this context, which make it a much better similarityindicator. A widely employed metric to compute term specificity is the Inverse Docu-ment Frequency (IDF), which assigns a low weight to common terms and a high weightto infrequently occurring terms. The IDF for a token t in a collection of process modelactivities A is given by Equation 2.5. In this equation, we use l(a) to refer to the labelof activity a.
id f (t, A) = log|A|
|a ∈ A : t ∈ l(a)|(2.5)
Mihalcea et al. [192] propose a measure that combines similarity scores with termspecificity, given by Equation 2.6.
simmih(ω1, ω2) =
∑t∈ω1
[maxt′∈ω2
sim(t, t′)] × id f (t)
2 ×∑
t∈ω1
id f (t)+
∑t∈ω2
[maxt′∈ω1
sim(t, t′)] × id f (t)
2 ×∑
t∈ω2
id f (t)(2.6)
The consideration of term specificity is highly important in process contexts, wherecertain terms with little discriminatory power are often repeated throughout the descrip-tion of model of a process. Therefore, we employ the measure provided by Equation 2.6for similarity computations for the computation of alignment throughout this thesis.
2.4.4 Matching in Business Process ManagementMatching has received considerable attention in the context of BPM, resulting in thedevelopment of a plethora of matching techniques. The vast majority of these areprocess model matching techniques.
Nearly all process model matching techniques include one or more FLMs that fo-cus on label similarity. A considerable number consider label similarity purely froma syntactic perspective, cf. [79, 172, 284]. These approaches typically use distance-based measures like the Levenshtein distance. Other matching techniques focus onthe semantic similarity between activity labels, such as Lin similarity [167, 215, 249].Although label similarity measures represent important components to most matchingtechniques, the dependencies that exist between process model activities also provide

CHAPTER 2. BACKGROUND 43
useful insights for the matching task [133]. Therefore, behavioral or structural char-acteristics are often also taken into account by matchers. The underlying idea of suchconsiderations is that activities which share structural properties are likely to be similar.For instance, if two activities both occur at the start of their respective process models,they are more likely to be similar than if one activity occurs at the start and one atthe end of the process. Process model matching techniques such as [79, 133, 171] takesuch properties into account. Typically, these techniques combine structural similaritymeasures with measures for label similarity in order to improve the produced matchingquality.
The importance of process model matching has been emphasized through the Pro-cess Model Matching Contests held in 2013 and 2015 [32, 58]. In these contests, vari-ous matching techniques were applied on the same data collections in order to comparetheir performance. The results show that the performance of matching techniques canbe improved. For certain data collections, the best performing techniques manage toidentify less than half of the actual correspondences correctly. Furthermore, it is inter-esting to observe that the performance of matchers varies greatly across different datacollections. This indicates that the characteristics of process models have a significanteffect on the performance of different matchers. Weidlich et al. [283] provide means toquantify such characteristics with the aim to predict the success of matching techniqueson specific matching problems.
Throughout this thesis, we build on insights and techniques of various matchingapproaches. In Chapters 3 and 6 we use semantic similarity measures and other match-ing techniques to establish relations between process model elements and process in-formation extracted from natural language. Chapter 4 builds on techniques that es-tablish alignments between event classes of event logs and process model activities.Finally, Chapter 7 presents a new process model matching technique that establishesalignments by considering event-log information, rather than information contained inprocess models.


3Comparing Process Models to Textual Process
Descriptions
Organizational stakeholders involved in business processes have different preferencesregarding the representation format used to visualize process information. As consid-ered in Section 2.1.3, a user’s cognitive style, their experience, and their purpose allinfluence the suitability of a particular format. As a result, some stakeholders and ap-plications scenarios are better served by process information represented in the form ofprocess models, whereas, in other cases, textual process descriptions are more suitable.For this reason, organizations have recognized the value of maintaining textual processdescriptions alongside process models [166]. However, as shown in Section 2.1.4, theusage of two representation formats for the same process also comes with the risk ofhaving to deal with inconsistencies between them. As a result of such inconsistencies,users may execute processes based on incorrect information. This can lead to inefficientprocess execution [35] as well as compliance issues [31]. Therefore, it is crucial that or-ganizations keep their process descriptions in sync [124]. However, the effort requiredto identify and clear up conflicts for an entire process repository, potentially consistingof hundreds or even thousands of processes [237], is hardly manageable in a manualway. Against this background, this chapter introduces an approach that automaticallydetects inconsistencies between process models and textual process descriptions. Inthis way, the approach supports organizations by reducing the effort required to clearup any inconsistencies.
In the remainder of this chapter, Section 3.1 illustrates the problem and the chal-lenges associated with the detection of inconsistencies between model and text. Sec-tion 3.2 presents our proposed inconsistency-detection approach. Specifically, our ap-proach identifies two types of inconsistencies related to the control-flow of a process.First, it identifies process steps that are contained in the model but not in the textualdescription, i.e., missing activities. Second, our approach detects cases where a processmodel and a textual description describe process steps in a different, conflicting order.Section 3.3 demonstrates the usefulness of our approach through a quantitative evalua-
45

46 3.1. PROBLEM ILLUSTRATION
tion. The evaluation results show that our approach is indeed able to effectively identifyinconsistencies in a collection of model-text pairs obtained from practice. Section 3.4provides a reflection on the limitations of our approach and the evaluation. Section 3.5considers streams of related research. Finally, we summarize the chapter in Section 3.6.
3.1 Problem IllustrationTo illustrate the challenges that are associated with the detection of inconsistenciesbetween textual and model-based process descriptions, consider the model-text pairshown in Figure 3.1. It includes a textual and a model-based description of a bicy-cle manufacturing process. The left-hand side provides a textual description of theprocess, which comprises eleven sentences. On the right-hand side, a correspondingmodel-based description can be seen, expressed using BPMN. The model containsnine activities, which are depicted using boxes with rounded edges. The diamondshapes that contain a plus symbol indicate concurrent streams of action; the diamondshapes containing a cross represent decision points, i.e., choices in the process. Lastly,the gray shades suggest correspondences between the sentences and the activities ofthe process model.
x
Receive order
Inform S&E department
No
Yes
Backorder part
Reserve part
Prepare for assembling
Assemble bicycle
Available in-house?
No
Yes Any part left
unchecked?
Yes
No
Select unchecked
part
Ship bicycle to customer
Enter details into ERP system
Accept order?
(1) A small company manufactures customized bicycles.
(2) Whenever the sales department receives an order, a new process instance is created.
(3) A member of the sales department can then reject or accept the order for a customized bike.
(4) If the order is accepted, the order details are entered into the ERP system.
(5) Then, the storehouse and the engineering department (S&E) are informed.
(6) The storehouse immediately processes the part list of the order.
(7) If a part is available, it is reserved.
(8) If it is not available, it is back-ordered.
(9) This procedure is repeated for each item on the part list.
(10) In the meantime, the engineering department prepares everything for the assembling of the ordered bicycle.
(11) If the storehouse has successfully reserved or back-ordered every item of the part list and the preparation activity has finished, the engineering department assembles the bicycle.
Figure 3.1: A textual and a model-based description of a bicycle manufacturing process
An in-depth look at the example reveals that many connections between the twoartifacts are evident. For example, there is little doubt that sentence (7) describes the“reserve part” activity or that sentence (8) describes the “back-order part” activity.However, there are also clear inconsistencies between the two process representations.For instance, there is no sentence that relates to the “ship bicycle to customer” activity,i.e., that activity is missing from the textual description. Likewise, we can observe

CHAPTER 3. COMPARING PROCESS MODELS TO TEXT 47
that sentences (4) and (5) occur in a different order than their corresponding modelactivities. In other cases it is less straightforward to decide on the consistency—orlack thereof—between the representations. For example, sentence (9) indicates thata certain procedure of the process must be repeated for every part in the order. Thetextual description does not indicate that any action is associated with this repetition.By contrast, the process model does describe an explicit action for this repetition, inthe form of the “select unchecked part” activity. Whether or not sentence (9) actuallydescribes an action, and thus should be considered an inconsistency, seems to be openfor debate. Nevertheless, it is important to recognize that such ambiguous cases, whichare already difficult to resolve for human readers, pose even greater challenges to anautomated technique.
This problem illustration shows that an appropriate inconsistency-detection tech-nique must be able to (i) recognize structural as well behavioral process aspects in anatural language text and (ii) align this information with process model activities. Inthe next section, we describe an approach that achieves this by building on NLP andmatching techniques.
3.2 Inconsistency-Detection Approach
Figure 3.2 depicts the main steps of our automated approach to detection inconsisten-cies between process models and textual descriptions. The approach takes a processmodel and an accompanying textual description as inputs. In the first step, the approachsubjects the textual description to a linguistic analysis. This preprocessing step focuseson the extraction of core process information from the description’s sentences. Nextfollows the creation of an alignment between process model activities and the prepro-cessed sentences. For this alignment task we combine semantic similarity scores with aconsideration of the ordering relations that exist between the process steps in the modeland text. In the third and final step, the approach predicts inconsistencies based on theestablished alignments. For this purpose, we introduce predictors that evaluate qualitycharacteristics of the obtained correspondences. The final result of the approach is a setof predicted inconsistencies, both at a process level, as well as at a more fine-granularactivity level. Sections 3.2.1 through 3.2.3 describe the individual steps of the approachin detail.
Textual processdescription
Model-based processdescription
1. Linguisticanalysis
2. Activity-sentence alignment
3. Inconsistency detection
Predictedinconsistencies
Figure 3.2: Overview of the proposed approach.

48 3.2. INCONSISTENCY-DETECTION APPROACH
3.2.1 Linguistic Analysis
To be able to create an accurate activity-sentence alignment for a model-text pair, wefirst subject the textual process description to a linguistic analysis. The goal of this stepis to preprocess the sentences in order to extract the most relevant process informationcontained in a sentence. As a result, we exclude details that may negatively affect theability of our approach to accurately determine the similarity between a sentence andan activity. The linguistic-analysis step consists of two parts: (i) anaphora resolutionand (ii) main clause extraction. We illustrate their application on sentence s8 from therunning example: s8 =“If it is not available, it is back-ordered.”
Anaphora Resolution
Anaphoric references, as introduced in Section 2.3.3, represent a considerable problemwhen analyzing textual process descriptions. These references are problematic becausethey obscure process information that is relevant to the establishment of alignments.As an example, consider the aforementioned sentence s8 and the “back-order part”activity, referred to as a5. The sentence and the activity both describe the act of back-ordering a part. A part thus represents the business object of the action. However,s8 does not explicitly describe this. The sentence instead uses the pronoun “it” torefer to the term “part” contained in the previous sentence. The anaphoric referencethus obscures information that is important to determine the similarity between s8 anda5, namely that both actions are applied to the same business object. To overcomethis problem, we apply an anaphora-resolution technique that resolves these backwardreferences.
To resolve anaphoric references, our approach first identifies the objects containedin a sentence. We identify these objects by considering a number of Stanford Depen-dencies [74]. These dependencies, which were introduced in Section 2.3.2, denotegrammatical relations between words [74]. Table 3.1 depicts the main dependenciesused for the purpose of anaphora resolution. To identify the main term (i.e., the noun)of business objects in a sentence, the most important relations to consider are directobjects and nominal subjects. For instance, in sentence s2, the relation dobj(receives,order) indicates that “order” is the object being “received”. Nominal subjects sim-ilarly identify business objects in passive sentences, as seen in sentence s7. There,nsubj(reserved, part) shows that the object “part” is “reserved”. Since business ob-jects can comprise multiple terms, e.g., “the part list”, we also take word specifiersinto consideration. Common specifiers include adjectival modifiers (e.g., “small”,“customized”), possession modifiers (e.g., “customer’s”, “his”), and compounds (e.g.,“sales department”). By considering these word specifiers, we can also extract com-plex business objects such as “the customer’s customized bicycle.”
Once the business objects of a sentence have been identified, we check if all objectsin the sentence are anaphoric references. This is the case when all objects identifiedin the sentence are pronouns or determiners. For these sentences, we resolve the ref-erences by replacing the pronouns with the objects from the preceding sentence. Forinstance, in sentence s8, we replace the two occurrences of “it” with the business objectof sentence s7: “a part”. As a result, we resolve the anaphoric references and obtain
CHAPTER 3. COMPARING PROCESS MODELS TO TEXT 49
Table 3.1: Main Stanford Dependencies used for anaphora resolution
Purpose Description Example
Objectidentification
Direct object dobj(receive, goods)Nominal subject nsubj(reserved, part)
Word specifiersAdjectival mod. amod(bicycle, customized)Possessive mod. poss(bicycle, customer’s)Compound nn(department, sales)
the following adapted sentence:s′8 = “If a part is not available, a part is back-ordered.”
Main Clause Extraction
Sentences in a textual description describe actions that are performed in a process,the process flow, and also provide additional information. To accurately align them toprocess model activities, it is important to identify those parts of sentences that specif-ically relate to actions, while excluding unrelated information from consideration. Inthis context, the most problematic cases are sentences where a conditional statementcontains terms similar to those used in activity labels. The dependent clause of sen-tence s11 provides such an example: “If the storehouse has successfully reserved orback-ordered every item of the part list and the preparation activity has finished [...]”This clause contains the same terms as the “reserve part” and “back-order part” ac-tivities. Still, it is clear that these activities are actually described elsewhere in thetextual description. The conditional statement rather describes the requirement thatthese activities must have been previously completed. The inclusion of such termsin a conditional clause can indicate a strong similarity between sentence s11 and the“reserve part” and “back-order part” activities, which can reduce the quality of thegenerated alignment. Therefore, to mitigate the impact of conditional statements onthe calculation of activity-sentence similarity, we extract the main clauses from suchsentences.
In order to differentiate between conditional statements and main clauses, we useparse trees generated by the Stanford Parser [140]. Parse trees represent conditionalstatements as subordinate clauses, denoted as SBAR, starting with a specific term, suchas e.g., “if ”, “once”, or “in case”. Figure 3.3 illustrates this for the sentence s8. Weomit these subordinate clauses from consideration by extracting the remainder of suchsentences. For instance, for s8 we exclude “If it is not available” and extract the mainclause.
By combining anaphora resolution and main clause extraction, our linguistic anal-ysis retains the following preprocessed sentence for the example: s′8 = “a part is back-ordered.” This preprocessed sentence now emphasizes the process information relevantto the determination of similarity because it includes the proper business object “part”,rather than the pronoun “it”. Furthermore, we omitted the precondition “If it is notavailable”, which is not relevant when determining the similarity between s8 and the

50 3.2. INCONSISTENCY-DETECTION APPROACH
it is not If it is back-ordered available
NP VP
SBAR
S
VP NP IN
S
dependent clause main clause
Figure 3.3: Simplified parse tree for sentence s8.
contents of the activity labels in the process model. Therefore, the preprocessed sen-tences provide a suitable input for the alignment task, as described in the next section.
3.2.2 Activity-Sentence AlignmentThis section describes how we obtain an optimal alignment between the activities of aprocess model and the sentences of a textual description. In this context, an alignment∼ consists of a number of pair-wise correspondences between the activities from a setA and sentences from a set S . Each correspondence relates a single activity a ∈ A to asentence s ∈ S , denoted as a ∼ s.
We here establish an alignment that maximizes the sum of the semantic similarityscores of its correspondences, while respecting certain ordering constraints imposed bythe order of activities and sentences. Next, we describe the computation of semanticsimilarity and the ordering constraints in more detail.
Semantic Similarity
When establishing alignments, it is crucial to determine if a sentence s and an activitya refer to the same stream of action. To accurately assess this, we have to take the vari-ability of natural language expressions from the sentences into account [22]. Therefore,we first normalize the textual contents of a sentence before determining their semanticsimilarity.
Normalization. We first perform a number of normalization steps in order to make anactivity label and sentence more comparable. In particular, we perform tokenization,stop-word removal, and lemmatization, which are described in detail in Section 2.4.3.Tokenization splits a text or an activity label into a set of tokens, each correspond-ing to a single term, e.g., “a part is back-ordered” is split into the set {“a”, “part”,“is”, “back-ordered”}. With stop-word removal we omit determiners, prepositions, andconjunctions from consideration, because these are of little value when determiningsimilarity. As a result, we retain the token set: {“part”, “is”, “back-ordered”}. Fi-

CHAPTER 3. COMPARING PROCESS MODELS TO TEXT 51
nally, lemmatization transforms all remaining terms into their grammatical base forms.For instance, it transforms “is” into “be” and “back-ordered” into “back-order.” Incombination with our linguistic analysis step, our normalization step turns the originalsentence “If it is not available, it is back-ordered”, into the set of tokens ωs = {“part”,“be”, “back-order”}.
Similarity computation. To quantify the similarity between the token sets that resultfrom the normalization step, we use the similarity measure proposed by Mihalcea etal. [192]. This similarity measure combines Lin similarity and IDF, as previouslyintroduced in Section 2.4.3. The use of Lin similarity allows us to identify semanticallysimilar terms, such as “part” and “component.” The IDF is used to assign a higherweight to terms that are relatively rare in the process descriptions, while it assigns alow weight to common terms. Consider, for instance, the term “part” in the runningexample. A brief look at the model and the text reveals that this term occurs in a largenumber of sentences and activities and, hence, has only little discriminative power.By contrast, the term “receive” only occurs in sentence s2 and in activity a1. Thus,this term is relatively likely to indicate that s2 and a1 describe the same process step,whereas this is not the case for the occurrence of “part” in, e.g., sentence s6 and theactivity “back-order part”. Equation 3.1 provides the equation used to quantify thesimilarity between the token sets ωa and ωs, which, respectively, denote the set oftokens that stem from the normalization of an activity label and of a sentence.
sim(ωa, ωs) =
∑t∈ωa
[maxt′∈ωs
Lin(t, t′)] × id f (t)
2 ×∑
t∈ωa
id f (t)+
∑t∈ωs
[maxt′∈ωa
Lin(t, t′)] × id f (t)
2 ×∑
t∈ωs
id f (t)(3.1)
Equation 3.1 provides a value between 0 and 1, where a higher value indicates thatthe (token sets of the) activity and sentence are more similar to each other.
Ordering Constraints
We impose constraints in our approach to ensure that the generated alignments respectthe ordering relations included in a process model and a textual description. The con-sideration of these ordering constraints improves the ability of our approach to identifythe correct correspondences between activities and sentences. Furthermore, they arevital to the identification of inconsistencies in the form of conflicting orders.
The order of process model activities can be extracted from the flow relation Fof a process model. To represent the relations between activities, we use the weakorder relation � ⊆ A × A. Because the presence of loops in a process model canaffect the restrictiveness of a weak order relation, we compute this relation over allvalid execution sequences from Σvalid that do not contain loops, i.e., those sequencesthat do not contain any repeated activities. Formally, we consider the following set ofsequences: Σnl = {σ ∈ Σvalid | 1 ≤ i < j ≤ |σ| : σ(i) , σ( j)}. Then, given two activitiesak, al ∈ A, a weak order relation ak � al defines that al cannot occur before ak whenexecuting the process, i.e., there is no trace in Σnl for which al occurs before ak. Thisrelation accounts for choices and parallelism that commonly occur in process models.

52 3.2. INCONSISTENCY-DETECTION APPROACH
Extracting the inter-relations of actions in a textual process description is morecomplex. The inherent ambiguity of natural language makes it particularly difficult toextract the inter-relations of actions. An example of this is observed in sentence s10of the running example. The phrase “In the meantime, the engineering departmentprepares [...]” can be interpreted in different ways. This results in multiple, potentialpoints for the engineering department to start performing its tasks. Existing approachesfor the analysis of textual process descriptions have been shown to provide suboptimalresults when extracting such relations [29]. Therefore, we here take a conservativeapproach when imposing ordering restrictions. In particular, we recognize that textualdescriptions generally describe actions in a chronological order [248]. For this reason,our rationale is to only allow for the generation of alignments that respect a chronolog-ical description. We capture this by introducing the strict order relation ⊆ S × Sto formally denote the order of the sentences in S . The expression si s j states thatsentence si precedes sentence s j in the textual description.
s4 — If the order is accepted, the order details are entered into the ERP system. Inform S&E department
(a2)
Enter details into ERP system
(a3)s5 — Then, the storehouse and the engineering department (S&E) are informed.
Figure 3.4: Correspondences disallowed by ordering constraints
Given the relations � ⊆ A × A and ⊆ S × S , we then define a constraint thatavoids the creation of conflicting correspondences. Specifically, we require that twocorrespondences ak ∼ si and al ∼ s j cannot both be included in an alignment ∼ ifak � al and s j si. Intuitively, this restriction avoids the alignment of an activity ak
to a sentence si, if an action al that occurs after ak is aligned to a sentence before si.Figure 3.4 depicts an example of this. Because of the ordering relations in this example,a correspondence s4 ∼ a3 cannot be included in an alignment that also contains s5 ∼ a2.
Finding the Optimal Alignment
Given the semantic similarity scores and the ordering constraints, our approach finds anoptimal alignment ∼ ⊆ S × A which maximizes the sum of the similarity scores, whilerespecting the ordering constraints. Our approach establishes alignments in which ev-ery activity is aligned to exactly one sentence. This means that multiple process modelactivities can be aligned to the same sentence, but not the other way around.
Because of the choices and parallelism allowed by process models, finding the op-timal alignment is not straightforward. Different combinations of activity executionorders must be considered as a possible solution in which the activities are containedin the textual process description. This can result in a huge number of possible align-ments. Therefore, this optimization problem calls for an efficient solving approach.To find the optimal alignment ∼, we adopt a best-first search algorithm similar tothose used in machine translation problems [135]. Instead of aligning one language

CHAPTER 3. COMPARING PROCESS MODELS TO TEXT 53
to another, we here align the activities of A with sentences of S . Intuitively, the best-first search algorithm traverses a search space of partial hypotheses, which consists ofactivity-sentence alignments between A and S . The algorithm explores the search spaceby expanding the partial hypothesis with the highest possible score. Because the ap-proach exempts unpromising hypotheses from further expansion, the explored searchspace is greatly reduced compared to a more naive approach. Since the algorithmmerely affects computational efficiency—not the resulting optimal alignment—we ab-stract from further details and refer the interested reader to [135, 276] for a detaileddescription. We use the obtained optimal alignment ∼ as input for the final step of theapproach: the inconsistency-detection step.
3.2.3 Inconsistency DetectionThis section describes the detection of inconsistencies through the analysis of the opti-mal alignments established in the previous step of our approach. For this analysis, weintroduce so-called predictors. These predictors are metrics, designed to correlate withcharacteristics of the generated alignments that differ between consistent and inconsis-tent model-text pairs. In this section, we first introduce the general notion and desiredproperties of predictors for the detection of inconsistencies. Then, we describe two setsof proposed predictors: one with predictors that detect missing activities, the other todetect conflicting orders between model and text.
Detection using Predictors
Given an optimal alignment ∼, we use predictors to quantify the probability that ∼contains incorrect correspondences. This notion of a predictor is inspired by similarones used to analyze alignments in the context of schema and process model match-ing [103, 283]. The core premise underlying the predictors is that the similarity scoresin the optimal alignments have different characteristics for consistent and inconsistentmodel-text pairs. In a consistent pair, every activity is aligned to a sentence with a highsimilarity score in the optimal alignment, while this is not the case for inconsistentmodel-text pairs.
Our proposed predictors adhere to desired structural properties of matching pre-dictors: generalization and tunability [241]. Generalization refers to the applicabilityof predictors to tasks of different granularity levels. In the context of this work, weachieve this by defining predictors that can detect inconsistencies at two levels of gran-ularity: the activity level and the process level. Tunability refers to the ability to tunepredictors such that they put more emphasis on particular quality aspects of the results.The proposed predictors meet this requirement by allowing users to alternate betweenhigher precision or higher recall.
Missing Activities
In a model-text pair where all the activities in A are also described by the set of sen-tences S , we expect that each activity a ∈ A is aligned to a sentence s ∈ S with ahigh similarity score sim(a, s). However, if an activity a is not described in a textual

54 3.2. INCONSISTENCY-DETECTION APPROACH
description, i.e., a is a missing activity, then a will not be aligned to a sentence with ahigh similarity score. To distinguish between high and low similarity scores, we canevaluate a similarity score according to three dimensions: (i) by its absolute value, (ii)by its value relative to the similarity scores of the activity with other sentences, i.e., ahorizontal comparison, and (iii) by its value relative to the similarity scores of otheractivities, i.e., a vertical comparison. We introduce predictors to operationalize each ofthese perspectives. Each predictor presented here can be applied on an activity level todetect individual missing activities and on a process level to identify model-text pairsthat contain one or more missing activities.
For our first predictor, we consider the absolute similarity score of the correspon-dence contained in an optimal alignment ∼. A similarity score quantifies the likelihoodthat an activity a and sentence s describe the same part of a process. So, a higher valueimplies that activity a is less likely to be missing. By contrast, a low similarity scoreindicates that the sentence is not as similar to an activity. Therefore, such an activityis more likely to be missing from the textual description. To capture this property, weintroduce a predictor p-sim. We apply this predictor at activity level and the processlevel as follows:
• p-sim(a): the likelihood that activity a represents a missing activity, given as thesimilarity score between activity a and the sentence s to which the activity isaligned in the optimal alignment, i.e., sim(a, s) for a ∼ s ∈ ∼;
• p-sim(∼): the likelihood that a model-text pair contains one or more missingactivities, given by the lowest similarity score sim(a, s) contained in the optimalalignment ∼, i.e. min{sim(a, s) | a ∼ s ∈ ∼}.
A second property that influences the confidence to be placed in a correspondencea ∼ s relates to the difference between sim(a, s) and the similarity between a andother sentences in S . The similarity between an activity and a sentence is influencedby factors such as terminology and the amount of additional details that a sentenceprovides for a given action. Such factors can lead to considerable differences in thesimilarity scores between correct activity-sentence correspondences. To take thesedifferences into account, we define predictors that consider a similarity score relativeto other scores. The underlying notion is commonly applied in schema matching in theform of a dominates property (see e.g., [103, 273]).
The predictor we introduce for this purpose builds on the premise that an activity ais more likely to be described by a sentence s if sim(a, s) is higher than the similarityscore of a to other sentences in S . The left-hand similarity matrix in Table 3.2 illustratesthis. Both activities a2 and a3 are aligned to sentences with a score of 0.5. For a2 it isclear that its corresponding sentence s2 is the most similar in the textual description.However, this clarity is missing for a3 because two others sentences are just as similarto a3 as its corresponding sentence s3. This implies that s3 is not more similar to a thanthese other sentences, which reduces the likelihood that the sentence actually describesthe same process step as a. Thus, despite their equal similarity scores, a3 is more likelyto be a missing activity than a2. To capture this, we define the predictor diff-S:
• diff-S(a): the difference between sim(a, s) for a ∼ s ∈ ∼ and the average similar-ity score of a to sentences in S ;

CHAPTER 3. COMPARING PROCESS MODELS TO TEXT 55
• diff-S(∼): the lowest value diff-S(a) for any activity in a ∈ A,i.e., min{diff-S(a) | a ∈ A}.
Table 3.2: Examplary similarity matrices with correspondences in bold
s1 s2 s3 s4
a1 0.6 0.3 0.2 0.0a2 0.2 0.5 0.1 0.1a3 0.2 0.5 0.5 0.5
s1 s2 s3 s4
a4 0.9 0.3 0.2 0.0a5 0.2 0.4 0.9 0.1a6 0.2 0.5 0.5 0.5
Third, we compare the similarity score of a correspondence to the similarity scoresof the other correspondences included in ∼. Like diff-S, this property considers sim(a, s)relative to other scores in the similarity matrix in order to capture the differences thatcan exist among the similarity scores of correct correspondences. However, we hereperform a vertical rather than a horizontal comparison. The premise underlying thisproperty is that a correspondence a ∼ s is less likely to represent a correct correspon-dence if its similarity score is much lower than other similarity scores contained inthe optimal alignment ∼. This is illustrated in the two similarity matrices presentedin Table 3.2. The correspondences in the left-hand matrix have an average similarityscore of 0.53. For the right-hand matrix, this average score is 0.77. A score of 0.50is thus close to the average score of the left-hand matrix. By contrast, this same scoreis much further below the average score of the right-hand matrix. Therefore, the cor-respondence a6 ∼ s3 from the right-hand matrix is much less similar than the averagesimilarity of the correspondences. This makes a6 more likely to be inconsistent than a3from the left-hand matrix, despite their equal similarity scores. We operationalize thischaracteristic with the predictor diff-A:
• diff-A(a): the difference between sim(a, s) for a ∼ s ∈ ∼ and the average similar-ity scores of the correspondences in ∼;
• diff-A(∼): the lowest value diff-A(a) for any activity in A, i.e., min{diff-A(a) |a ∈ A}.
The predictors p-sim, diff-S, and diff-A each predict inconsistencies in the form ofmissing activities by quantifying a property that allows us to distinguish between highand low similarity scores.
Conflicting Orders
Inconsistencies in the form of conflicting orders occur when a process model and anaccompanying textual description describe the steps of a process in different orders.For instance, the running example shows that the process model activity “Inform S& E departments” precedes “Enter details into ERP system,” whereas the textual de-scription describes these steps in the opposite order. The ordering constraints that weimpose on alignments bar our approach from including correspondences between ac-tivities and sentences when their orders do not match. As a result, it cannot happenthat both of these activities will be aligned to the sentences that actually describe them,

56 3.3. EVALUATION
no matter how high the similarity scores are. Therefore, when conflicting orders existbetween model and text, we can expect to observe large differences between the sim-ilarity scores contained in an optimal alignment and the similarity scores that wouldhave been obtained without ordering constraints.
Table 3.3: Fragment of the similarity matrix for the running example
s2 s3 s4 s5 s6
a2 0.1 0.2 0.2 0.7 0.2a3 0.1 0.1 0.9 0.2 0.1
To illustrate this, consider the similarity matrix in Table 3.3, where a2 refers to“Inform S & E departments” and a3 to “Enter details into ERP system”. The similarityscore sim(a2, s5) is high (0.7), because both a2 and s4 describe the same process step.The similarity score for sim(a3, s4) is also high (0.9), for the same reason. However,since a2 precedes a3 in the model (a2 ≤ a3) and s4 precedes s5 in the textual description(s4 < s5), a2 ∼ s5 and a3 ∼ s4 cannot both be contained in ∼ without violating theimposed constraints. Therefore, the approach can only align a2 to s3, despite its lowersimilarity score. As a result, the similarity score of the correspondence involving a3 ismuch lower (0.2) than it would have been if ordering constraints had not been imposed(0.7). This difference of 0.5 in the similarity score for a single activity is an importantindicator that there are ordering conflicts in the model-text pair.
We capture this difference between consistent and inconsistent model-text pairsin the max-constrained predictor. This predictor quantifies the maximum differencethat exists between the aligned and potential score for a single activity in a model-textpair. In this way, it captures the largest similarity difference caused by the orderingrestrictions. We operationalize this as follows:
• max-constrained(∼): the maximal difference between the potential and alignedsimilarity scores for an activity a ∈ A.
The predictors defined for the detection of missing activities and conflicting orderseach quantify conceptual notions that differ between the similarity scores of consistentversus inconsistent model-text pairs. In Section 3.3, we present a quantitative eval-uation that demonstrates how well our approach is able to detect inconsistencies inpractice.
3.3 Evaluation
This section presents a quantitative evaluation that demonstrates the ability of our ap-proach to identify inconsistencies in model-text pairs. We made the prototypical im-plementation used for this evaluation publicly available.1
We manually annotated the inconsistencies in a collection of 53 model-text pairsobtained from practice. This annotation is referred to as the gold standard against
1Download from: www.hanvanderaa.com/downloads/modeltextcomparison

CHAPTER 3. COMPARING PROCESS MODELS TO TEXT 57
which we compare the results of our approach. Section 3.3.1 describes our test collec-tion in detail. Next, we describe the setup of our evaluation in Section 3.3.2. After-wards, we present the evaluation results in Section 3.3.3 and discuss the strengths andweaknesses of our approach in 3.3.4.
3.3.1 Test Collection
To evaluate our approach, we use a collection of 53 model-text pairs that originatefrom different sources, including academia, textbooks, industry, and public sector or-ganizations. The majority of the model-text pairs was introduced in [99] to evaluatean approach for the generation of process models from textual process descriptions.We extended this collection with 7 processes obtained from a new industrial source.Table 3.4 presents the main characteristics of the model-text pairs contained in the testcollection. The process models are heterogeneous with regard to several dimensions,such as size and complexity. Also, the corresponding textual descriptions vary in sev-eral aspects. For instance, they describe the processes from different perspectives (firstand third person) and differ in terms of how explicitly and unambiguously they referto the process model content. Finally, it is important to note that the ratio of sentencesper activity (S/A) differs considerably throughout the collection. Some sources use asingle sentence on average per activity, while other sources use up to 7 sentences. Thisincreased ratio follows from the presence of more informational sentences and detailson how certain process steps must be executed. Due to these varying characteristics,we believe that the collection is well-suited to achieve a high external validity of theresults.
Table 3.4: Overview of the test collection
ID Source Type MT MTm Am MTo A S S/A
1 HU Berlin Academic 4 1 1 0 9.0 10.3 1.12 TU Berlin Academic 2 2 2 0 22.5 34.0 1.53 QUT Academic 8 0 0 0 6.1 7.1 1.24 TU Eindhoven Academic 1 1 2 0 18.0 40.0 2.25 VU Amsterdam Industry 7 1 2 0 4.3 30.1 7.06 Vendor Tutorials Industry 3 2 3 2 5.3 7.0 1.37 inubit AG Industry 4 1 1 1 9.0 11.5 1.38 BPM Practitioners Industry 1 0 0 0 4.0 7.0 1.89 BPMN Practice Handbook Textbook 3 2 2 1 5.0 4.7 0.9
10 BPMN Guide Textbook 6 5 7 0 7.0 7.0 2.211 Federal Network Agency Public Sector 14 4 6 0 8.0 6.4 0.8
Total – 53 19 26 4 7.6 12.0 1.6
Legend: MT = Model-text pairs, MTm = Model-text pairs with missing activities, Am = Totalmissing activities, MTo = Model-text pairs with conflicting orders, A = Activities per model(avg.), S = Sentences per text (avg.), S/A = Sentences per activity (avg.)
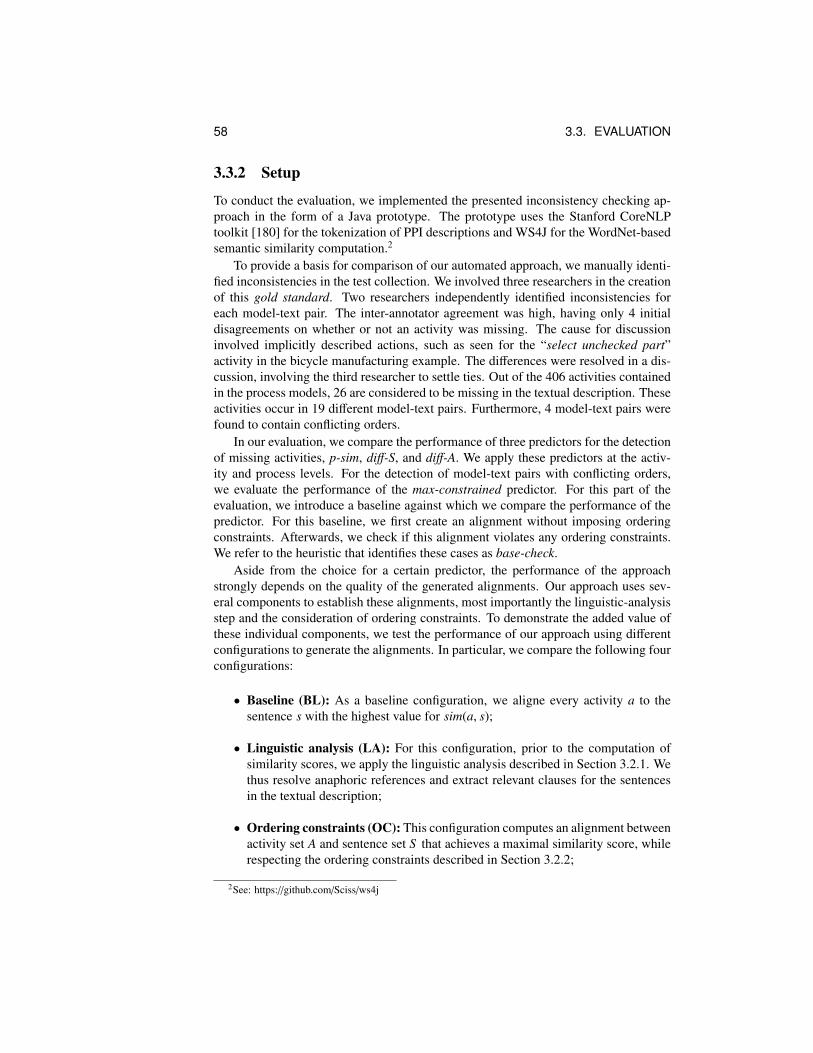
58 3.3. EVALUATION
3.3.2 Setup
To conduct the evaluation, we implemented the presented inconsistency checking ap-proach in the form of a Java prototype. The prototype uses the Stanford CoreNLPtoolkit [180] for the tokenization of PPI descriptions and WS4J for the WordNet-basedsemantic similarity computation.2
To provide a basis for comparison of our automated approach, we manually identi-fied inconsistencies in the test collection. We involved three researchers in the creationof this gold standard. Two researchers independently identified inconsistencies foreach model-text pair. The inter-annotator agreement was high, having only 4 initialdisagreements on whether or not an activity was missing. The cause for discussioninvolved implicitly described actions, such as seen for the “select unchecked part”activity in the bicycle manufacturing example. The differences were resolved in a dis-cussion, involving the third researcher to settle ties. Out of the 406 activities containedin the process models, 26 are considered to be missing in the textual description. Theseactivities occur in 19 different model-text pairs. Furthermore, 4 model-text pairs werefound to contain conflicting orders.
In our evaluation, we compare the performance of three predictors for the detectionof missing activities, p-sim, diff-S, and diff-A. We apply these predictors at the activ-ity and process levels. For the detection of model-text pairs with conflicting orders,we evaluate the performance of the max-constrained predictor. For this part of theevaluation, we introduce a baseline against which we compare the performance of thepredictor. For this baseline, we first create an alignment without imposing orderingconstraints. Afterwards, we check if this alignment violates any ordering constraints.We refer to the heuristic that identifies these cases as base-check.
Aside from the choice for a certain predictor, the performance of the approachstrongly depends on the quality of the generated alignments. Our approach uses sev-eral components to establish these alignments, most importantly the linguistic-analysisstep and the consideration of ordering constraints. To demonstrate the added value ofthese individual components, we test the performance of our approach using differentconfigurations to generate the alignments. In particular, we compare the following fourconfigurations:
• Baseline (BL): As a baseline configuration, we aligne every activity a to thesentence s with the highest value for sim(a, s);
• Linguistic analysis (LA): For this configuration, prior to the computation ofsimilarity scores, we apply the linguistic analysis described in Section 3.2.1. Wethus resolve anaphoric references and extract relevant clauses for the sentencesin the textual description;
• Ordering constraints (OC): This configuration computes an alignment betweenactivity set A and sentence set S that achieves a maximal similarity score, whilerespecting the ordering constraints described in Section 3.2.2;
2See: https://github.com/Sciss/ws4j

CHAPTER 3. COMPARING PROCESS MODELS TO TEXT 59
• Linguistic analysis + ordering constraints (LA + OC): This configurationapplies the full alignment approach. We perform the linguistic analysis step andimpose ordering constraints on the establishment of the optimal alignment.
We quantify the performance of our approach with standard information retrievalmetrics. More specifically, we calculate precision, recall, and F1-score by comparingthe generated results against the manually created gold standard. Precision describesthe fraction of predictions that are correct. Recall represents the fraction of all incon-sistencies that are identified by our approach. We define these metrics in the context ofthis work as given by Equations 3.2 and 3.3.
pre =|EI ∩ Eρ|
|Eρ|(3.2) rec =
|EI ∩ Eρ|
|EI |(3.3) F1 =
2 ∗ pre ∗ recpre + rec
(3.4)
Here, we use Eρ to denote the entities, i.e., the set of model-text pairs or activi-ties, that are predicted to be inconsistent with a prediction score in the range [0, ρ]. Ahigher value for ρ thus increases the number of entities that are included in Eρ, i.e., thatare predicted to be inconsistent. EI denotes the set of model-text pairs or activities thatcontain a certain type of inconsistency. Finally, we also report the F1-score, which pro-vides the harmonic mean between precision and recall, as formalized by Equation 3.4.
3.3.3 ResultsThis section presents the results of the quantitative evaluation. We first asses the abil-ity of the predictors to detect inconsistencies. Then, we consider how the individualcomponents of the alignment approach contribute to the quality of the obtained results.
Predictor Performance
We computed precision and recall scores for increased values of the predictor score ρfor each of the predictors. The precision-recall graphs of Figures 3.5 and 3.6, respec-tively, depict the performance of the approach for the detection of missing activitiesat the activity level and the process level. Both graphs illustrate a trade-off betweenprecision and recall. The reason for a trade-off to exist is that increasing the recallrequires the consideration of lower confidence values. As a result, some activities areerroneously classified as missing, which negatively affects precision. The maximumresults achieved by the predictors are presented in Table 3.5. This table also displaysthe predictor values that achieve the maximum F1-score, which we here refer to as theoptimal predictor values.Missing Activities. The precision-recall graph of Figure 3.5 shows that our approachis able to detect missing activities with a good accuracy. The approach reaches a maxi-mum F1-score of 0.44 for the p-sim predictor. At this point, 17 missing activities havebeen detected (recall = 0.58) with a precision of 0.36. These results should be consid-ered in light of the relatively low fraction of the total activities that are missing (0.07).The graph shows that beyond a recall of 0.15, p-sim consistently outperforms the other

60 3.3. EVALUATION
0.0
0.1
0.2
0.3
0.4
0.5
0.6
0.7
0.8
0.9
1.0
0.0 0.1 0.2 0.3 0.4 0.5 0.6 0.7 0.8 0.9 1.0
Prec
isio
n
Recall
p-sim diff-A diff-S
Figure 3.5: Precision-recall graph for the detection of missing activities (activity level)
predictors. The diff-A predictor reaches a maximum precision of 0.67 and a maximumF1-score of 0.37. The predictor diff-S has the lowest performance, with a maximumprecision of 0.33 and F1-score of 0.21.
The precision-recall graph of Figure 3.6 shows that the approach performs even bet-ter at the process level, particularly using the p-sim predictor. This predictor correctlyidentifies more than 40% of the model-text pairs with missing activities with perfectprecision. For increasing recall values, the approach maintains a high precision. Thehighest obtained F1-score of 0.83 is reached when all incorrect model-text pairs havebeen detected (i.e., recall = 1.00), with a precision of 0.70. The diff-A and diff-S pre-
0.0
0.1
0.2
0.3
0.4
0.5
0.6
0.7
0.8
0.9
1.0
0.0 0.1 0.2 0.3 0.4 0.5 0.6 0.7 0.8 0.9 1.0
Prec
isio
n
Recall
p-sim diff-A diff-S
Figure 3.6: Precision-recall graph for the detection of model-text pairs with missingactivities (process level)

CHAPTER 3. COMPARING PROCESS MODELS TO TEXT 61
Table 3.5: Predictor performance evaluation results
Predictor Maximumprecision
MaximumF1-score
Optimal predictorvalue
p-sim(a) 0.39 0.44 0.74diff-A(a) 0.67 0.37 1.18diff-S(a) 0.33 0.21 0.92
p-sim(∼) 1.00 0.83 0.74diff-A(∼) 1.00 0.69 0.52diff-S(∼) 1.00 0.58 0.47
base-check(∼) 0.16 0.28 –max-constrained(∼) 1.00 0.73 0.18
dictors display lower prediction accuracy, they reach maximal F1-scores of 0.69 and0.58, respectively.
Conflicting Orders. Lastly, we evaluated the usefulness of the max-constrained metricfor the detection of model-text pairs with conflicting orders. We compare its perfor-mance to the baseline metric base-check. Note that we here omit the depiction of aprecision-recall graph because there are only four cases with inconsistent orders in thetest collection. The max-constrained predictor identifies these four cases with highaccuracy. The predictor reaches a maximum precision of 1.00 and successfully iden-tifies all inconsistent model-text pairs with a precision score of 0.57. This results ina maximum F1-score of 0.73. Furthermore, we can observe that the max-constrainedpredictor greatly outperforms the baseline metric. The reason for this is that base-checkyields a considerable amount of false positives, resulting in a precision of 0.16 and amaximum F1-score of 0.28.
Alignment Configurations
The presented results demonstrate that our approach is able to detect inconsistencieswith high accuracy by using the full configuration for the creation of alignments. Ta-ble 3.6 presents the performance of the approach for different configurations of thealignment approach. For the sake of brevity, we depict the highest F1-score achievedby each predictor for a given configuration.3
The results clearly illustrate that each of the individual components of the alignmentapproach contribute positively to the prediction accuracy, since the scores of LA andOC are higher than the baseline scores reached by BL. The linguistic analysis improvesthe performance for all use cases and predictors. Notably, it increases the maximumperformance for the detection of missing activities with 45%, from 0.22 to 0.32. Theperformance for the detection of model-text pairs with missing activities is similarly
3Note that the BL and LA configurations cannot detect inconsistent orders, since these configurations donot incorporate the ordering restrictions required to identify these.

62 3.3. EVALUATION
Table 3.6: Highest F1-measures for different configurations and predictors.
Predictor BL LA OC LA + OC
p-sim(a) 0.22 0.32 0.23 0.44diff-A(a) 0.20 0.29 0.21 0.35diff-S(a) 0.15 0.18 0.15 0.23
p-sim(∼) 0.62 0.72 0.66 0.83diff-A(∼) 0.61 0.64 0.61 0.69diff-S(∼) 0.54 0.58 0.55 0.58
max-constrained(∼) – – 0.50 0.73
increased from a maximum of 0.63 to 0.72. Though the inclusion of ordering con-straints consistently improves the results in comparison to the baseline configuration,it does not yield gains as large as the linguistic analysis. For instance, the detection ofmodel-text pairs with missing activities is improved from 0.63 to 0.66. However, theusefulness of the constraints becomes particularly apparent when they are used in com-bination with the linguistic analysis (LA +OC). Then, the results are improved from0.32 to 0.44 and from 0.72 to 0.83 for the detection of missing activities at the activitylevel and process level, respectively.
3.3.4 Discussion
The evaluation results show that our approach successfully identifies inconsistenciesbetween model-text pairs. Especially at the process level, the approach detects erro-neous model-text pairs with a high prediction accuracy. The lower performance scoresfor inconsistency detection at the activity level can be attributed to two causes. First, itis inherently easier to detect that inconsistencies exist in a model-text pair than to iden-tify exactly where these occur. Second, the difference occurs because the approach cre-ates an alignment optimized for the entire process. Therefore, for inconsistent model-text pairs, it can happen that a missing activity also impacts the alignments of otheractivities in the process. As a result of such a shift, sometimes the wrong activities arepredicted to be missing. This leads to lower precision at the activity level, while theprediction accuracy at the process level remains unaffected.
The results for the different predictors demonstrate that predictors considering theabsolute similarity values (p-sim) outperform others at the activity and process lev-els. This implies that the absolute similarity value of an activity-sentence pair has thestrongest correlation with inconsistencies from the considered factors. However, theperformance of the other predictors indicates that the consideration of relative similar-ity also has its merits. This applies in particular to the diff-A metric, which comparesan activity’s similarity score to the other scores included in an optimal alignment. Thispredictor also achieves a high predictive accuracy.
The performance of the max-constrained predictor shows that the approach can ac-curately identify model-text pairs with conflicting orders between the process steps de-

CHAPTER 3. COMPARING PROCESS MODELS TO TEXT 63
scribed in the process model and those in the textual description. The max-constrainedpredictor was, furthermore, shown to greatly outperform the base-check baseline. Thebase-check predicts a large number of false positives, because it does not distinguishbetween small and large differences in similarity scores. The underlying cause is that,for various cases in the test collection, not all activities should be aligned to the sen-tence with the highest semantic similarity score. Instead, such activities are generallyaligned to sentences with a slightly lower score (e.g., a score of 0.55 versus a scoreof 0.60). The base-check is not able to differentiate such cases from cases that trulycontain conflicting orders. However, because true conflicting orders are characterizedby much larger differences in similarity scores, the max-constrained predictor doessuccessfully make this differentiation.
The obtained evaluation results have several implications for the application of theproposed approach in practice. The results reveal that both the linguistic analysis andordering constraints consistently improve the accuracy with which inconsistencies aredetected. This implies that the full configuration (BL + LA) should be used to gen-erate alignments between model and text. The comparison of the different predictorsfurthermore demonstrates that the p-sim and max-constrained predictors achieve thebest results on our heterogeneous data collection. As such, the evaluation shows thatthese predictors should be selected for application in practical settings. Finally, it is im-portant to note the trade-off between activity-level and process-level predictors for thedetection of missing activities. The former provide more fine-granular results, whilethe latter predictors achieve a higher predictive accuracy. Since clearing up inconsis-tencies will always involve manual effort, it is, therefore, worthwhile to consider theusage of process-level predictors to identify those model-text pairs in a collection thatare most likely to contain inconsistencies.
3.4 Limitations
The evaluation demonstrates that our inconsistency-detection approach achieves pro-mising results. However, these results need to be considered against the backgroundof some limitations. In particular, we identify limitations related to the approach andlimitations related to the evaluation.
The main limitation related to the approach is that the alignments we establish arenot always fully correct. Three aspects of the approach play a role here. First, theemployed NLP techniques, such as the Stanford Parser and the anaphora resolutiontechnique, are not fully accurate. This means that the linguistic analysis step does notalways yield the results that are necessary to properly compute the similarity betweena sentence and an activity. Second, the employed semantic similarity metric is not al-ways able to identify semantic relationships between words that are only semanticallysimilar in a particular context. For instance, given the context of a loan applicationprocess, our approach is likely to not identify a relation between a “check applicant’shistory” activity and a sentence that describes this as “determine if the applicant hashad payment issues.” This problem occurs because the link between “history” and“payment issues” only exists in particular contexts. Third, our approach does not takediscourse statements such as “after” or “before” into account. Instead, we use a con-

64 3.5. RELATED WORK
servative approach that only considers the order in the text, because existing techniquesthat analyze discourse statements have been shown to produce inaccuracies [250]. Asa result of these limitations, our approach may identify wrong alignments. Therefore,the proposed approach remains a prediction approach that is intended as a means tosupport users. In this way, our approach greatly helps organizations to quickly detectinconsistencies between textual and model-based descriptions of their processes.
As for limitations related to the evaluation, we would like to point out that the pre-sented quantitative results are bound to the specifics of the model-text pairs used in theevaluation. Still, we tried to compose a data set that is as heterogeneous as possible bycollecting model-text pairs from a broad variety of external sources. This set includedonly four model-text pairs with conflicting orders. This should be taken into accountwhen interpreting the results related to this type of inconsistency. Inconsistencies inthe form of missing activities were better represented in the data collection, with 26occurrences. Thus, for this type of inconsistency we are confident that our evaluationindeed shows a realistic picture of the performance of our approach in practice.
3.5 Related Work
The work presented in this chapter relates to two main streams of research: matchingand transformations between conceptual models and natural language texts.
With respect to matching, Section 2.4 presents an extensive overview of this taskand the numerous techniques that address it. In the context of the work presented inthis chapter, it is important to recognize that none of those existing techniques focus onthe alignment between process models and textual process descriptions. Therefore, ex-isting approaches cannot be applied to detect inconsistencies between process modelsand textual process descriptions. Work by Sanchez et al. [245] forms an exception tothis, although it should be noted that their approach represents a follow-up to ours.Asan interesting extension, the approach from [245] also considers the resource and dataperspectives when establishing alignments between model and text.
Research on the transformation between conceptual models and natural languagetexts is concerned with transforming a given representation into the other. Prior workhas addressed both directions, model-to-text as well as text-to-model. Transformationsof conceptual models into textual descriptions typically aim at making the informationcaptured by the model available to a wider audience. Among others, such techniqueshave been defined for UML diagrams [188], object models [161], and process mod-els [166]. Techniques transforming text into models usually aim at providing supportfor model creation. Text-to-model transformation techniques also cover a variety ofconceptual models, including UML class diagrams [42] and entity-relationship mod-els [110]. Several approaches specifically focus on the elicitation of process modelsfrom different types of text documents, such as group stories [111], use case specifica-tions [253], and process descriptions [99].
Despite the empirically demonstrated usefulness of the discussed transformationtechniques, they do not help to address the challenges associated with the detection ofinconsistencies between process models and texts. Techniques for transforming mod-els into texts focus on verbalizing the information from the model. Hence, they do not

CHAPTER 3. COMPARING PROCESS MODELS TO TEXT 65
provide any means to align the information from a given model-text pair. Techniquesfor transforming process descriptions into models do address the problem of inferringstructural and behavioral process information from a natural language text. However,these approaches have been found to produce incomplete or inaccurate models thatrequire extensive manual revision [250]. This makes them unsuitable to support theautomatic detection of inconsistencies between textual and model-based process de-scriptions.
3.6 SummaryIn this chapter, we presented an approach to automatically detect inconsistencies be-tween textual and model-based process descriptions. Our approach first combines lin-guistic analysis, semantic similarity measures, and the consideration of ordering rela-tions to obtain an alignment between the activities of a process model and the sentencesof a textual process description. Afterwards, the approach analyzes the establishedalignments in order to detect process model activities that are missing from the associ-ated textual process descriptions, as well as ordering conflicts that exists between thetwo representation formats. This analysis is performed by using a set of predictorsthat quantify particular characteristics that differ between the alignments of consistentand inconsistent model-text pairs. A quantitative evaluation with a collection of 53real-world processes shows that our approach can indeed successfully identify incon-sistencies in model-text pairs. We observed that our approach identifies all model-textpairs with conflicting orders with a precision of 0.57. This means that users only haveto investigate 7 of the 53 model-text pairs in order to resolve all consistencies of thiskind. For the 19 textual processes with missing activities, our approach achieves evenhigher levels of accuracy. The approach identifies all instances with a precision of0.70. Since these results considerably exceed the baseline results against which wecompared our approach, our evaluation demonstrates that our tailored NLP techniquesas well as ordering restrictions positively contribute to the predictive accuracy of theapproach. Therefore, our proposed inconsistency-detection approach can be used byorganizations to quickly identify inconsistencies in their process repositories. As a re-sult, our approach supports organizations to maintain and improve the quality of theirprocess documentation in an efficient manner.


4Conformance Checking based on Uncertain
Event-Activity Mappings
Conformance-checking techniques enable organizations to automatically determinekwhether business processes are executed according to their specifications. Particu-larly, they check if observed behavior, as recorded in an IT system and representedin the form of event logs, conforms to the allowed process behavior, typically cap-tured in a process model [24]. The importance of conformance checking has beenrecognized in various contexts, such as legal compliance [239] and auditing [21]. Dueto this importance, numerous conformance-checking techniques have been developed(cf. [15, 24, 199, 225]). A crucial requirement for all these techniques is that the eventscontained in an event log can be related to the activities of a process model [14]. With-out knowing the relations between events and model activities, it is not possible todetermine if the behavior within a trace conforms to the behavior specified by a pro-cess model. Despite this dependence on the existence of a, so-called, event-to-activitymapping, establishing these mappings is a highly complex task. In particular, mappingtechniques face considerable challenges caused by, among others, cryptic event names,non-conforming behavior, and noise [37]. As a result, automated mapping techniquesoften cannot provide a certain solution to the mapping problem. Due to this uncer-tainty, the goal of mapping techniques becomes choosing the best mapping from anumber of potential ones [175]. Hence, there is always the risk that the selected map-ping is wrong, i.e., that the selected mapping does not correctly capture the relationsbetween traces and a process model. In the context of conformance checking, selectingan incorrect mapping is particularly harmful. If the selected mapping is incorrect, theresults obtained through conformance checking can become incorrect as well. There-fore, conformance-checking results based on a selected, potential mapping cannot betrusted. To overcome this issue, this chapter presents a conformance-checking tech-nique that can be applied in spite of an uncertain mapping of events onto activities.Our technique assesses the conformance of a trace by considering the entire spectrumof potential mappings, rather than focusing on a single one. At the basis of our tech-
67

68 4.1. PROBLEM ILLUSTRATION
nique stands the novel concept of a behavioral space as a means to capture multipleinterpretations of uncertain process behavior in a structured manner. By employing be-havioral spaces, our conformance-checking technique avoids the risks associated withthe selection of an incorrect mapping.
In the remainder of this chapter, Section 4.1 motivates the problem of conformancechecking in the context of uncertain event-to-activity mappings. Section 4.2 describesour conformance-checking technique. Section 4.3 presents a quantitative evaluationof the usefulness of our technique. Section 4.4 discusses the limitations of the tech-nique and its evaluation. Section 4.5 considers streams of related research. Finally,Section 4.6 summarizes the chapter.
4.1 Problem Illustration
In this section, we illustrate the problem of conformance checking in the context ofmapping uncertainty. In this setting, the goal of conformance checking is to determineif behavior captured in event log traces is allowed by the behavior specified in theform of a process model. A trace captures an execution sequence of events. Theseevents correspond to the actual behavior of a process, because they are extracted frominformation systems that record the execution of process steps. By contrast, processmodels are used in conformance-checking scenarios to specify the allowed behaviorof a process. A crucial prerequisite for conformance checking is that the events intraces can be related to the activities of a process model. For example, given a traceσ = 〈e1, e2, e3, e4, e5〉 and the process model M depicted in Figure 4.1, the events in σmust be mapped to activities in model M. Otherwise, it is impossible to understandwhich activities have occurred in reality and, thus, whether or not σ conforms to M.caise paper
Order received
Checkavailability
(a1)
Retrieveproduct fromwarehouse
(a2)
Manufacturerequestedproduct
(a3)
Sendinvoice
(a6)
Packproduct
(a4)
Shipproduct
(a5)
Order handled
productavailable
productnot available
(a1)
(a2)
(a3)
(a4) (a5)
(a6)
Figure 4.1: Process model for a simplified order handling process
Unfortunately, establishing a correct mapping between events and activities hasproven to be a considerable challenge. Existing techniques addressing this task can atbest indicate potential mappings and their likelihoods, instead of providing a definitesolution [40, 41]. The reason why mapping techniques fail to provide definite solu-tions is that the information they can take into account when constructing mappingsoften does not suffice to identify relations with certainty. As an example, consider anevent with the label “product obtained”. By considering this label, it is not possible todetermine with certainty whether this event corresponds to activity a2 (“retrieve prod-uct from warehouse”) or to activity a3 (“manufacture requested product”). Both ofthese activities obtain a product, but in a different way. Even more problematic are the

CHAPTER 4. CONFORMANCE CHECKING WITH MAPPING UNCERTAINTY 69
commonly observed event labels with cryptic database field names such as CDHDRor I SM E [41]. In these cases, not even advanced linguistic analysis tools are able toidentify reliable mappings.
The inability of techniques to reliably establish event-to-activity mappings leads tomapping uncertainty. As a result, mapping techniques generally construct a numberof potential mappings without being able to determine with certainty which mappingis correct. Since existing conformance-checking techniques require a single event-to-activity mapping, mostly the mapping with the highest likelihood is selected as a basisfor conformance checks. However, there is always the risk that this selected mapping isincorrect and that, consequently, conformance-checking results based on the selectedmapping are incorrect as well.
The main issue of mapping uncertainty is that existing conformance-checking tech-niques can only be applied on a single, certain event-to-activity mapping. Therefore, incase of mapping uncertainty, these techniques require the selection of a single mappingfrom the set of potential mappings. However, this comes with the considerable risk thatthe selected mapping is incorrect and that, consequently, conformance-checking resultsbased on the selected mapping are incorrect as well. To illustrate the risks of selectinga single, possibly incorrect, mapping, let ∼1 and ∼2 be two equally likely mappingsbetween the trace σ and the process model M. Further assume that the mapping ∼1corresponds to the activity sequence π1(σ) = 〈a1, a2, a4, a5, a6〉 and the mapping ∼2 toπ2(σ2) = 〈a1, a2, a3, a5, a6〉. The activity sequence σ1 conforms to model M, whereasσ2 does not, because it executes both activities a2 and a3, while it also skips executionof the mandatory activity a4. Because the conformance of these two activity sequencesdiffers for this scenario, the assessment of whether or not σ conforms to the processmodel M depends on the selection of a mapping relation. If ∼1 is chosen, conformance-checking techniques will determine that σ conforms to M, whereas the opposite holdsif ∼2 is selected. Therefore, the conformance of σ fully depends on the ability to selecta correct mapping in a situation where it is inherently uncertain what that mapping is.
The previous example illustrates that conformance-checking results based on theselection of a single, potentially incorrect mapping are not trustworthy. To provide acomprehensive solution to this problem, this chapter introduces a conformance-checkingtechnique that takes the entire set of potential mappings into account. Therefore, weeliminate the need to select a single, possibly incorrect mapping.
4.2 Conformance-Checking Technique
This section describes the conceptual basis of our conformance-checking technique.It takes as input a trace, a process model, and an uncertain event-to-activity mapping.Note that the question of how to obtain an uncertain mapping, which consists of a num-ber of potential event-to-activity mappings, is not the focus of this chapter. Potentialmappings can be obtained using one or more mapping techniques, such as [38,40,251].In the remainder, Section 4.2.1 first describes the notion of a behavioral space, whichwe use to capture the impact of mapping uncertainty on the process behavior describedby traceσ. Then, Section 4.2.2 introduces the conformance-checking metrics that buildon the obtained behavioral spaces.

70 4.2. CONFORMANCE-CHECKING TECHNIQUE
4.2.1 Capturing Mapping Uncertainty using Behavioral SpacesMapping uncertainty results from multiple views on which behavior, in terms of pro-cess model activities, is described by a single trace. This uncertainty manifests itselfthrough the existence of multiple possible event-to-activity mappings. A single event-to-activity mapping captures relations between events in a trace σ and the activities ina process model M, as defined in Definition 4.1.
Definition 4.1 (Event-to-Activity Mapping). Let σ = 〈e1, . . . , en〉 be a trace with aset of events Eσ and M a process model with an activity set A. An event-to-activitymapping is a surjective relation ∼ ⊂ Eσ × A. Elements of the relation are referred toas correspondences, where a correspondence e ∼ a ∈ (Eσ × A) denotes a mappingrelation between an event e and an activity a.
In Definition 4.1, the relation ∼ is defined as surjective, because we assume thateach event in a trace σ is always mapped to an activity. Furthermore, this impliesthat a 1:N relation can exist between events and activities. This cardinality capturesthe notion that events are typically more fine granular than activities [278]. As anillustration, consider a trace σ = 〈e1, e2, e3, e4, e5, e6〉 and a mapping {e1 ∼ a1, e2 ∼
a2, e3 ∼ a2, e4 ∼ a4, e5 ∼ a5, e6 ∼ a6}. This mapping indicates that the trace σ,consisting of six events, corresponds to a sequence of five activities: 〈a1, a2, a4, a5, a6〉.
Mapping uncertainty leads to the existence of multiple potential event-to-activitymappings. Here, we capture this spectrum in the form of an uncertain event-to-activitymapping EA(σ,M), as defined in Definition 4.2.
Definition 4.2 (Uncertain Event-to-Activity Mapping). Let σ = 〈e1, . . . , en〉 be a traceand M a process model with an activity set A. An uncertain event-to-activity mappingis a tuple EA(σ,M) = (M, φ), with:
• M: a set of event-to-activity mappings between σ and M;• φ : M → [0, 1]: a function that assigns a probability to each event-to-activity
mappingM(σ,M) ∈ M, such that the sum of the probabilities for all mappingsinM is equal to 1.
In this definition, each mappingM(σ,M) ∈ M represents a potential way to mapthe events in σ to the activities in A. The probability function φ assigns a probabilitypi to each mapping M(σ,M) ∈ M. These probabilities generally follow from theconfidence of an event-to-activity mapping technique. For instance, a technique basedon semantic similarity scores, such as [40], can quantify the probability as the productof the similarity scores associated with each correspondence in the mapping. In thisway, mappings with a higher semantic similarity receive a higher probability than theones with a lower score. If no probabilities are available, the most straightforwardsolution is to assign an equal probability p = 1 / |M| to each mapping.
Given such an uncertain event-to-activity mapping EA(σ,M), we define the notionof a probabilistic behavioral space as a means to capture all process model behaviorconveyed by trace σ according to the mapping EA(σ,M), i.e., the sequences of processmodel activities that follow from the different possible mappings. We shall refer tosuch a sequence of process model activities as a trace translation of trace σ, because it

CHAPTER 4. CONFORMANCE CHECKING WITH MAPPING UNCERTAINTY 71
represents a translation of the trace’s events into process model activities. We denote atrace translation of σ with π(σ).
Definition 4.3 (Trace Translation). Let σ = 〈e1, . . . , en〉 be a trace, M a process modelwith an activity set A, andM(σ,M) an event-to-activity mapping between σ and pro-cess model M. A trace translation π(σ) represents a sequence of activities 〈a1, . . . , am〉
according to the mappingM(σ,M).
Since an uncertain mapping EA(σ,M) consists of multiple event-to-activity map-pings, a mapping EA(σ,M) results in different trace translations for σ. For instancein Section 4.1, we described an example where a single trace had two trace transla-tions, π1(σ) = 〈a1, a2, a4, a5, a6〉 and π2(σ2) = 〈a1, a2, a3, a5, a6〉, which resulted fromtwo possible mappings. Together, the translations of a trace represent the spectrum ofprocess behavior potentially conveyed by trace σ, i.e., the behavioral space of a trace.Since each mapping can be associated with a probability, we include a probabilisticcomponent in our definition of a behavioral space, as captured in Definition 4.4.
Definition 4.4 (Probabilistic Behavioral Space). Let σ = 〈e1, . . . , en〉 be a trace, Ma process model with an activity set A, and EA(σ,M) an uncertain event-to-activitymapping between σ and the activity set of process model M. We define a probabilisticbehavioral space as a tuple PBS σ = (Π(σ), φ), with:
• Π(σ): the set of trace translations of trace σ over the activity set A as given bythe event-to-activity mappings in EA(σ,M);• φ : Π(σ)→ [0, 1]: a function that assigns a probability to each trace translation
in Π(σ), such that the sum of the probabilities assigned to the trace translationsis equal to 1.
The set Π(σ) comprises the set of potential trace translations of trace σ over theactivity set A, where each translation σi ∈ Π(σ) is based on a mappingM(σ,M) con-tained in EA(σ,M). This set, together with the probabilities provided by the functionφ, provides the basis for the probabilistic conformance metric described next.
4.2.2 Using Behavioral Spaces for Conformance CheckingIn this section, we demonstrate how to perform conformance checks by using behav-ioral spaces. To perform our conformance checks, we introduce a conformance metricthat quantifies the conformance of a behavioral space PBS σ to a process model M.The metric combines the conformance assessments for individual trace translationswith probabilistic information. Specifically, it determines for each trace translationπ ∈ Π(σ) in a behavioral space whether it is conforming or not.
The goal of conformance checking is to determine if observed behavior in a trace σis allowed by the behavioral specification of a process model M. Since uncertain event-to-activity mappings lead to multiple views on the process model behavior describedby a trace (i.e., its trace translations), all these views need to be checked against themodel M. In this section, we demonstrate how to perform a conformance check givena probabilistic behavioral space in order to obtain insightful conformance results anddiagnostic information.
72 4.2. CONFORMANCE-CHECKING TECHNIQUE
To perform conformance checks, we introduce a metric that quantifies the confor-mance of a behavioral space PBS (σ) to a process model M. The metric combinesconformance assessments for individual trace translations with probabilistic informa-tion. The metric determines for each trace translation π(σ) ∈ Π(σ) in a behavioralspace whether it conforms to M or not. In this way, the ProbCon f metric defined inDefinition 4.5 represents the likelihood that σ conforms to model M.
Definition 4.5 (Behavioral Space Conformance). Let σ be a trace with a probabilisticbehavioral space PBS (σ) = (Π(σ), φ) and M a process model with an activity set Aand its set of valid execution sequences Σvalid(M). Then we define:
• ΠM(σ) = Π(σ)∩Σvalid(M) as the set of trace translations in Π(σ) conforming toprocess model M;• ProbCon f (σ,M) ∈ [0, 1] : as the behavioral space conformance of trace σ to
process model M, given as the sum of all probabilities φ(π(σ)) for each π(σ) ∈ΠM(σ).
Because of the probabilistic nature of the ProbCon f metric, the metric yields re-sults that differ from the results obtained by traditional conformance-checking tech-niques. In traditional conformance-checking scenarios, i.e., without mapping uncer-tainty, a trace either conforms or does not conform to (a fragment of) a process model.By contrast, when using our technique, traces are either conforming, non-conforming,or potentially conforming. Potentially conforming traces are those traces for whichsome trace translations conform to a process model, whereas others do not. The con-formance of these traces is associated with a certain probability 0 < p < 1. Take, for in-stance, the process model from the running example and a trace σ1 = 〈e1, e2, e3, e4, e5〉
with two trace translations σ1(σ1) and σ2(σ1):
π1(σ1) = 〈a1, a2, a4, a5, a6〉 with probability 0.7π2(σ1) = 〈a1, a2, a3, a5, a6〉 with probability 0.3
While trace translation π1(σ1) conforms to M, this does not apply for π2(σ1). This lat-ter translation skips the execution of the mandatory activity F. This leads to a conflictbetween the conformance of the different translations of σ1 with respect to M. There-fore, the trace σ1 is said to be potentially conforming to M with a probability of 0.7,i.e., ProbCon f (σ1,M) = 0.7. This shows that, even though we cannot make certainstatements about the conformance of σ1 to M, we do know that σ1 is is more likely toconform than not. Furthermore, we also know the mapping conditions under which σ1is conforming or non-conforming. Namely, σ1 conforms to M if the correspondencee3 ∼ a4 holds, whereas the trace is non-conforming if e3 ∼ a3 is true. This type ofdiagnostic information is very useful because it provides insights into which aspectsof an uncertain mapping lead to uncertainty in the conformance-checking results forobserved behavior.
It is important to note that the ProbCon f metric, despite its probabilistic natureand the presence of mapping uncertainty, can often still produce non-probabilistic (i.e.,deterministic) conformance-checking results. To illustrate this, consider the traces σ2and σ3 with the following associated trace translations:

CHAPTER 4. CONFORMANCE CHECKING WITH MAPPING UNCERTAINTY 73
π1(σ2) = 〈a1, a2, a4, a6, a5〉 π1(σ3) = 〈a1, a2, a3, a6, a5〉
π2(σ2) = 〈a1, a3, a4, a6, a5〉 π2(σ3) = 〈a1, a3, a2, a6, a5〉
For trace σ2, mapping uncertainty has resulted in two trace translations that differwith respect to their second activity: a2 for π1(σ2) and a3 for π2(σ2). Despite this un-certainty, we can still with certainty state that σ2 conforms to process model M. Thereason is that both trace translations conform to M, since M allows for the executionof either activity a2 or a3. As a result, ProbCon f (σ2,M) = 1.0, thus yielding a de-terministic result. In a similar fashion, we can be sure that trace σ3 does not conformto M despite of its two different translations. Translations π1(σ3) and π2(σ3) executeactivities a2 and a3 in two different orders. However, since model M only accepts theexecution of one and not both of these activities, neither of the translations conform toM, leading to the deterministic outcome ProbCon f (σ3,M) = 0.0.
The previous example illustrates that our conformance-checking technique canbe used to determine conformance with certainty in situations where traditional con-formance-checking techniques would not be able to make trustworthy conformanceassessments. In Section 4.3, we demonstrate the usefulness of this property in practicalsettings.
4.3 EvaluationIn this section, we present an evaluation that we conducted to demonstrate the capabil-ities of the proposed conformance-checking technique for uncertain event-to-activitymappings. The goal of this evaluation is to assess how the impact of mapping un-certainty on the conformance-checking task can be reduced by using our technique.To achieve this, we compare results obtained through our technique against resultsobtained by using a traditional conformance-checking technique. We apply these tech-niques on a collection of real-world process models and accompanying event logs.Specifically, we compare for how many traces in these event logs the two techniquescan provide conformance-checking results with certainty.
In the remainder, Section 4.3.1 introduces the test collection used for the evaluationin detail. Section 4.3.2 describes the setup of our evaluation. Finally, Section 4.3.3presents the evaluation results.
4.3.1 Test CollectionTo perform the evaluation, we use a collection of real-world business process mod-els from the BIT process library, first analyzed in an academic context by Fahland etal. [92]. The BIT process library consists of 886 process models from various indus-tries, including the financial services and telecommunication domains. The same col-lection that has been used to test several event-to-activity mapping approaches [37,41],which motivates our choice for it. Hence, we believe that results obtained by using thiscollection present a realistic view on the applicability of the event-to-activity mappingapproach against which we compare our conformance-checking technique. Further-more, due to the size of the collection and its broad coverage of real-world process
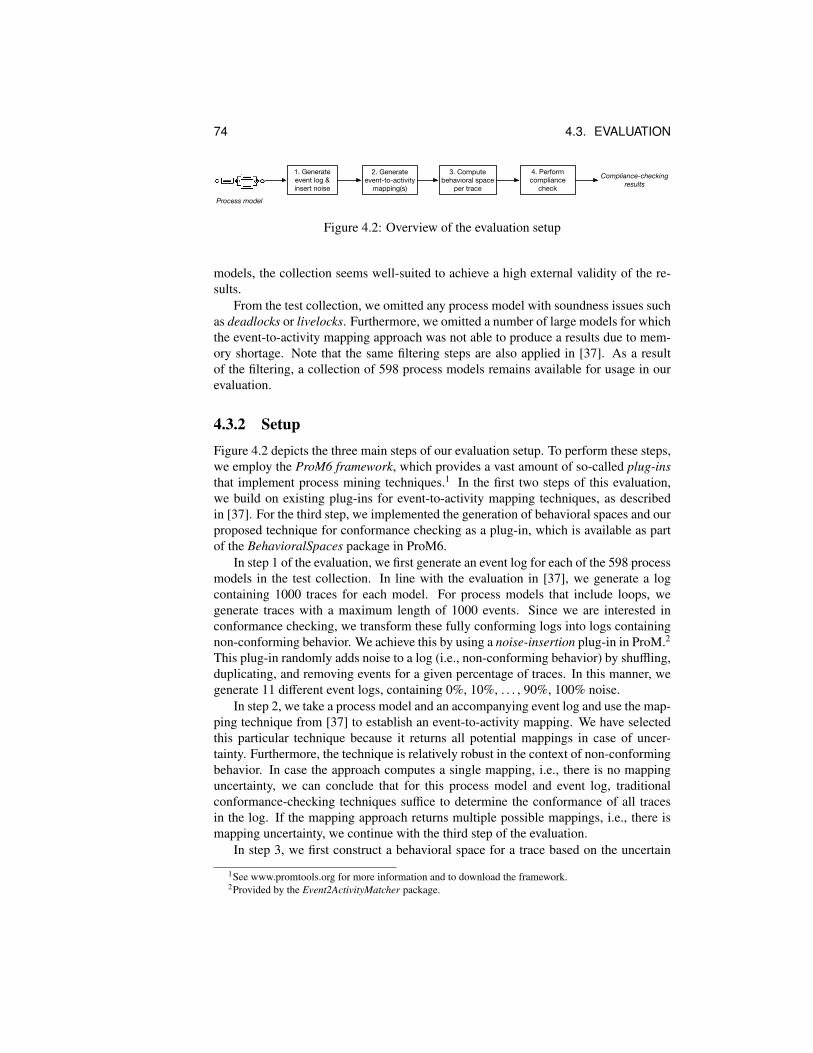
74 4.3. EVALUATION
Process model
1. Generate event log & insert noise
2. Generate event-to-activity
mapping(s)
4. Perform compliance
check
Compliance-checkingresults
3. Compute behavioral space
per trace
Figure 4.2: Overview of the evaluation setup
models, the collection seems well-suited to achieve a high external validity of the re-sults.
From the test collection, we omitted any process model with soundness issues suchas deadlocks or livelocks. Furthermore, we omitted a number of large models for whichthe event-to-activity mapping approach was not able to produce a results due to mem-ory shortage. Note that the same filtering steps are also applied in [37]. As a resultof the filtering, a collection of 598 process models remains available for usage in ourevaluation.
4.3.2 SetupFigure 4.2 depicts the three main steps of our evaluation setup. To perform these steps,we employ the ProM6 framework, which provides a vast amount of so-called plug-insthat implement process mining techniques.1 In the first two steps of this evaluation,we build on existing plug-ins for event-to-activity mapping techniques, as describedin [37]. For the third step, we implemented the generation of behavioral spaces and ourproposed technique for conformance checking as a plug-in, which is available as partof the BehavioralSpaces package in ProM6.
In step 1 of the evaluation, we first generate an event log for each of the 598 processmodels in the test collection. In line with the evaluation in [37], we generate a logcontaining 1000 traces for each model. For process models that include loops, wegenerate traces with a maximum length of 1000 events. Since we are interested inconformance checking, we transform these fully conforming logs into logs containingnon-conforming behavior. We achieve this by using a noise-insertion plug-in in ProM.2
This plug-in randomly adds noise to a log (i.e., non-conforming behavior) by shuffling,duplicating, and removing events for a given percentage of traces. In this manner, wegenerate 11 different event logs, containing 0%, 10%, . . . , 90%, 100% noise.
In step 2, we take a process model and an accompanying event log and use the map-ping technique from [37] to establish an event-to-activity mapping. We have selectedthis particular technique because it returns all potential mappings in case of uncer-tainty. Furthermore, the technique is relatively robust in the context of non-conformingbehavior. In case the approach computes a single mapping, i.e., there is no mappinguncertainty, we can conclude that for this process model and event log, traditionalconformance-checking techniques suffice to determine the conformance of all tracesin the log. If the mapping approach returns multiple possible mappings, i.e., there ismapping uncertainty, we continue with the third step of the evaluation.
In step 3, we first construct a behavioral space for a trace based on the uncertain
1See www.promtools.org for more information and to download the framework.2Provided by the Event2ActivityMatcher package.

CHAPTER 4. CONFORMANCE CHECKING WITH MAPPING UNCERTAINTY 75
0%
10%
20%
30%
40%
50%
60%
70%
80%
90%
100%
0% 10% 20% 30% 40% 50% 60% 70% 80% 90% 100%
Det
erm
inis
tic c
onf.
resu
lts
Traces with noise
Behavioral space-based conformance Traditional conformance-checking
Figure 4.3: Evaluation results for deterministic conformance checking
event-to-activity mapping EA established in the previous step. We obtain a behav-ioral space by creating a trace translation for each of the potential event-to-activitymappings included in EA, as described in Section 4.2.1. Afterwards, we perform aconformance check between the obtained behavioral space and the process model us-ing the approach described in Section 4.2.2. If this method returns a ProbCon f valueof 0.0 or 1.0 for the entire process model, we can conclude that our technique is ableto provide a non-probabilistic conformance-checking result for the trace. This meansthat we know whether or not σ conforms to the process model with certainty. For othervalues, also the consideration of behavioral spaces does not suffice to be sure about theconformance of σ. Nevertheless, our technique still obtains probabilistic results anddiagnostic information, whereas traditional conformance-checking techniques cannotprovide any trustworthy results for these cases.
4.3.3 Results
Figure 4.3 presents the results of our evaluation experiments. The figure illustrates forwhich percentage of traces deterministic conformance-checking results are obtained byour and traditional techniques.
For noise level 0, where all traces in the event logs conform to the process models,we observe that the mapping approach establishes a single event-to-activity mappingfor 71% of the models in the collection, which means that traditional techniques canprovide (deterministic) results for 71% of the traces. Because these logs do not con-tain non-conforming behavior, the inability to establish mapping for certain models iscaused by activities which are behaviorally identical to each other. Such cases can beseen for activities C and D of the running example. Because of these issues, traditional

76 4.4. LIMITATIONS
conformance-checking techniques cannot assess the conformance of 29% of the traces.However, by using behavioral spaces, we can still determine the conformance of a tracewhen mapping uncertainty is caused by such behavioral equivalent activities. Hence,by using our proposed conformance-checking technique, we can provide deterministicconformance-checking results for all traces.
For increasing noise levels, the ability of the mapping approach to establish a sin-gle event-to-activity mapping diminishes. For logs with 10% and 20% noisy traces theapproach can still establish a mapping for approximately 66% of the process models,as indicated by the 66% deterministic conformance results in Figure 4.3. However,this percentage sharply drops to 33% for event logs with 40% noise, followed by only21% certainty for noise levels above 60%. As a result of these steep drops, the abilityof traditional conformance-checking techniques to provide trustworthy conformance-checking results also sharply decreases. Although our behavioral space-based tech-nique can also provide less deterministic results when the level of noise increases, thisdecrease is considerably less severe than for the benchmark. For instance, at 30%noise, our technique can still provide deterministic results for 83%, whereas traditionaltechniques can only provide such results for 55% of the cases. For the highest noiselevels, our technique can still provide deterministic results for approximately 30% ofthe traces, which means that the technique outperforms the benchmark by close to 50%.
In summary, traditional conformance-checking techniques become less and lessuseful. For high noise levels, they can provide results for as little as 21% of the traces.Although the deterministic results obtainable through conformance checking with be-havioral spaces is also affected by the increased levels of noise, the impact is muchsmaller. Therefore, we can conclude that in practical scenarios our conformance-checking technique is much wider applicable than traditional conformance-checkingtechniques. Furthermore, a crucial aspect in favor of our conformance-checking tech-nique is that even in cases where also our technique cannot provide deterministicconformance-checking results, our technique still provides trustworthy conformance-checking information in the form of probabilistic results and diagnostic insights.
4.4 Limitations
The evaluation demonstrates that our conformance-checking technique can be used toobtain trustworthy results where traditional conformance-checking approaches fail todo so. However, these results need to be reflected against the background of some lim-itations. In particular, we identify limitations related to the utilized mapping technique,the conformance-checking technique, and limitations related to the evaluation.
Our proposed technique has to be considered in light of the limitation that the ob-tained conformance-checking results are dependent on the quality of the generatedevent-to-activity mappings. Most importantly, its results can be negatively affectedif the correct mapping is not included in the set of potential mappings generated by anyapproach. Still, by applying our technique, we eliminate the need to select a mappingfrom the set of potential techniques. Hence, our technique significantly reduces thepossibility of drawing incorrect conclusions.
A point of consideration regarding our conformance-checking technique is that we
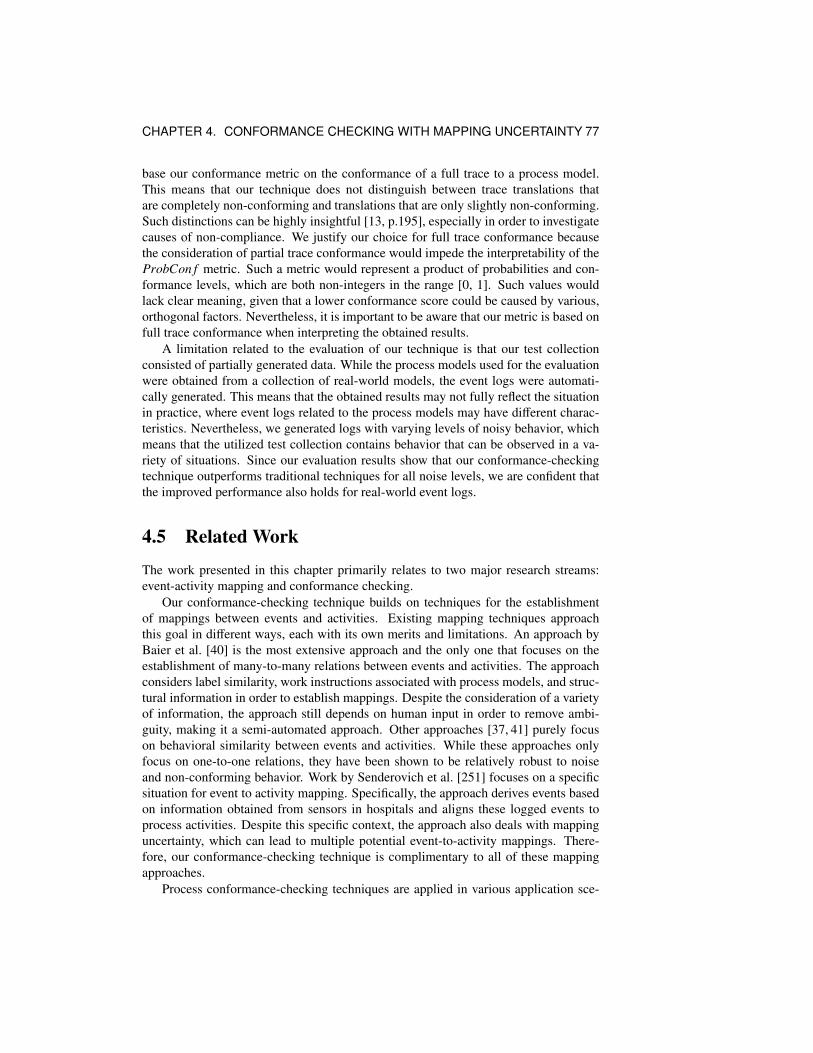
CHAPTER 4. CONFORMANCE CHECKING WITH MAPPING UNCERTAINTY 77
base our conformance metric on the conformance of a full trace to a process model.This means that our technique does not distinguish between trace translations thatare completely non-conforming and translations that are only slightly non-conforming.Such distinctions can be highly insightful [13, p.195], especially in order to investigatecauses of non-compliance. We justify our choice for full trace conformance becausethe consideration of partial trace conformance would impede the interpretability of theProbCon f metric. Such a metric would represent a product of probabilities and con-formance levels, which are both non-integers in the range [0, 1]. Such values wouldlack clear meaning, given that a lower conformance score could be caused by various,orthogonal factors. Nevertheless, it is important to be aware that our metric is based onfull trace conformance when interpreting the obtained results.
A limitation related to the evaluation of our technique is that our test collectionconsisted of partially generated data. While the process models used for the evaluationwere obtained from a collection of real-world models, the event logs were automati-cally generated. This means that the obtained results may not fully reflect the situationin practice, where event logs related to the process models may have different charac-teristics. Nevertheless, we generated logs with varying levels of noisy behavior, whichmeans that the utilized test collection contains behavior that can be observed in a va-riety of situations. Since our evaluation results show that our conformance-checkingtechnique outperforms traditional techniques for all noise levels, we are confident thatthe improved performance also holds for real-world event logs.
4.5 Related Work
The work presented in this chapter primarily relates to two major research streams:event-activity mapping and conformance checking.
Our conformance-checking technique builds on techniques for the establishmentof mappings between events and activities. Existing mapping techniques approachthis goal in different ways, each with its own merits and limitations. An approach byBaier et al. [40] is the most extensive approach and the only one that focuses on theestablishment of many-to-many relations between events and activities. The approachconsiders label similarity, work instructions associated with process models, and struc-tural information in order to establish mappings. Despite the consideration of a varietyof information, the approach still depends on human input in order to remove ambi-guity, making it a semi-automated approach. Other approaches [37, 41] purely focuson behavioral similarity between events and activities. While these approaches onlyfocus on one-to-one relations, they have been shown to be relatively robust to noiseand non-conforming behavior. Work by Senderovich et al. [251] focuses on a specificsituation for event to activity mapping. Specifically, the approach derives events basedon information obtained from sensors in hospitals and aligns these logged events toprocess activities. Despite this specific context, the approach also deals with mappinguncertainty, which can lead to multiple potential event-to-activity mappings. There-fore, our conformance-checking technique is complimentary to all of these mappingapproaches.
Process conformance-checking techniques are applied in various application sce-

78 4.6. SUMMARY
narios, including process querying [33], legal conformance [239], and auditing [21].A plethora of techniques exist for this purpose (cf. [15, 24, 199, 225]). In this chap-ter, we have used techniques that perform conformance checks based on behavioralprofile relations, introduced in [279]. These techniques are computationally highly ef-ficient, which makes them an ideal choice for conformance checking in the context ofthe potentially vast number of translations per trace. Other commonly used techniquesperform conformance checks based on so-called alignments. These techniques, intro-duced in [15, 24], provide different diagnostic information than conformance checksbased on behavioral profiles. Furthermore, the conformance checks can be consideredto be more accurate in certain situations, because behavioral profile relations abstractfrom some details of process behavior. However, these techniques are computation-ally much more demanding than the highly efficient conformance checks based onbehavioral profiles. For the purpose of efficiency, recent advances in decomposed con-formance checking present a promising direction [199]. Since the interpretations in abehavioral space generally have considerable overlaps, such techniques can be usefulin order to reduce the computation time required for conformance checking.
4.6 SummaryIn this chapter, we introduced a conformance-checking technique that can be used inthe presence of uncertain event-to-activity mappings. Our technique provides con-formance-checking results without the need to select a single, possibly incorrect map-ping to base conformance checks on. This is achieved by considering the entire spec-trum of possible mappings generated by event-to-activity mapping techniques and cap-turing this spectrum in a behavioral space. Our probabilistic conformance-checkingmetric then provides insights into the fraction of conforming mappings, as well as use-ful diagnostic information. Therefore, our conformance-checking technique avoids therisk of drawing incorrect conformance conclusions. A quantitative evaluation basedon a large collection of real-world process models demonstrated that our techniquecan be used to obtain results in a vast number of cases where traditional conformance-checking techniques fail to do so. In particular, our technique was able to providedeterministic results for up to 50% more cases than traditional techniques.

5Dealing with Ambiguity in Textual Process
Descriptions
The importance of automated conformance-checking has resulted in numerous con-formance-checking techniques (cf. [15,33,63,279]), including the technique presentedin Chapter 4. What these techniques have in common is that they rely on a structuredspecification of allowed behavior, mostly in the form of a process model. As a result,these techniques ignore the wealth of information that is contained in less structuredforms of process documentation, such as textual process descriptions [99]. An impor-tant reason for this can be found in the inherent ambiguity of natural language. Thisambiguity can lead to uncertainty about the exact specification of a process, whichposes a considerable challenge to conformance-checking techniques. In prior work,text-to-process model generation techniques have circumvented this problem by intro-ducing interpretation heuristics [99, 111, 253]. In this way, these techniques obtain asingle process-oriented interpretation of the text, in spite of the presence of ambiguoussentences. This interpretation, however, contains assumptions on the correct interpre-tation of essentially undecidable ambiguity issues. So, there is always the risk that thederived interpretation conflicts with the proper way to execute the process. As a result,the focus on a single, assumed interpretation can lead to incorrect and, thus, untrust-worthy conformance-checking results. To provide a rigorous solution for this problem,this chapter presents a conformance-checking technique that avoids the need to imposeassumptions on the correct interpretation of ambiguous textual process descriptions.To achieve this, we again build on the concept of behavioral spaces, as introduced inChapter 4, to capture the impact of behavioral ambiguity.
The remainder of this chapter is structured as follows. Section 5.1 illustrates theproblems caused by ambiguity in textual process descriptions. Section 5.2 describeshow the concept of a behavioral space can be used to capture ambiguity in textualprocess descriptions. The section, furthermore, presents a technique for the automatedgeneration of behavioral spaces for this purpose. Section 5.3 illustrates the use of thegenerated behavioral spaces for conformance checking. Section 5.4 introduces a semi-
79

80 5.1. PROBLEM ILLUSTRATION
After a claim is received, a claim officer reviews the request and records the claiminformation. The claim officer then validates the claim documents before writinga settlement recommendation. A senior officer then checks this recommendation.The senior officer can request further information from the claimant, or reject oraccept the claim. In the former case, the previous steps must be repeated once therequested information arrives. If a claim is rejected, the claim is archived and theprocess finishes. If a claim is accepted, the claim officer calculates the payableamount. Afterwards, the claims officer records the settlement information andarchives the claim. In the meantime, the financial department takes care of thepayment.
Figure 5.1: Exemplary description of a claims handling process.
automated pruning technique that can be used to improve the quality of conformance-checking results. Section 5.5 demonstrates the usefulness of behavioral spaces and ourproposed pruning technique through a quantitative evaluation using real-world data.Section 5.6 considers limitations of the proposed work and its evaluation. Section 5.7discusses streams of related work. Finally, we summarize the chapter in Section 5.8.
5.1 Problem Illustration
In this section, we illustrate the problem associated with conformance checking of pro-cess behavior against textual process descriptions. The key challenge in this contextis the ambiguity of natural language, as discussed in Section 2.3.4. Because confor-mance checking involves the comparison of observed versus allowed behavior, in thiscontext we are particularly concerned with ambiguity related to the allowed processbehavior described in a text. We shall refer to this as behavioral ambiguity. Behav-ioral ambiguity occurs when statements about the relations that exist between processsteps can be interpreted in different ways. We illustrate the problem of behavioral am-biguity through the simplified description of a claims handling process, as presentedin Figure 5.1. The description uses typical patterns to describe ordering relations, asobserved in process descriptions obtained from practice and research [99].
At first glance, the description from Figure 5.1 may appear to be clear. However,on closer inspection, it turns out that the description does not provide conclusive an-swers to several questions regarding the proper execution of the described process. Forinstance:
Q1. Is it allowed that the claims officer records the claim information before review-ing the request?
Q2. Does it suffice for the claim officer to rewrite the settlement recommendation incase additional information has been requested?
Q3. Can the financial department start paying the claimant while the settlement in-formation is still being recorded?

CHAPTER 5. DEALING WITH AMBIGUOUS TEXTUAL DESCRIPTIONS 81
Based on the information provided in the textual description, these questions arenot clearly decidable. This lack of decidability results from two forms of behavioralambiguity: type ambiguity and scope ambiguity. Type ambiguity occurs when a tex-tual description does not clearly specify the type of order relationship between twoactivities. For instance, the relation between the “review request” and “record claiminformation” activities in the first sentence is unclear. The term “and” simply does notallow us to determine whether these activities must be executed sequentially or whetherthey can be executed in an arbitrary order (Q1). Scope ambiguity occurs when state-ments in a textual description underspecify to which activity or activities they preciselyrefer. This type of ambiguity particularly relates to repetitions and parallelism. Forinstance, the statement “the previous steps must be repeated” does not clearly specifywhich activities must be performed again (Q2). Similarly, the expression “in the mean-time” does not define when the financial department can start performing its activities(Q3).
As a result of such ambiguous statements, there are different views on how to prop-erly carry out the described process. When deriving a single structured interpretationfrom a textual process description, as done by process model generation techniques(cf. [99, 111, 253]), there is always the risk that a derived interpretation conflicts withthe proper way to execute the process. The focus on a single interpretation can, there-fore, lead to wrong conclusions when reasoning about a business process. This can,for instance, result in a loss of efficiency by not allowing for parallel execution wherepossible (Q3). Furthermore, it can result in non-conformance with regulations, for ex-ample, by failing to impose necessary ordering restrictions (Q1) or by not repeating allof the required steps when dealing with the receipt of new claim information (Q2).
To avoid the problems associated with using an assumed interpretation, automatedreasoning techniques should take into account all reasonable interpretations of a textualprocess description. Therefore, we next describe a technique that achieves this byemploying the concept of behavioral spaces, as introduced in Chapter 4, in the contextof behavioral ambiguity in textual process descriptions.
5.2 Capturing Ambiguity Using Behavioral Spaces
This section describes how process behavior from ambiguous textual process descrip-tions can be captured using behavioral spaces. For this purpose, we describe an ap-proach that automatically generates a behavioral space from a textual process descrip-tion. As shown in Figure 5.2, this approach consists of three main steps. First, a textualprocess description T is parsed in order to identify and analyze the set of behavioralstatements S. Second, the proposed approach generates behavioral interpretations foreach statement in S. Third and lastly, the different statement interpretations are com-bined into a collection of process interpretations that, together, comprise a behavioralspace BS .
In the remainder of this section, we present the details on each of these three steps.Given the focus on behavioral ambiguity of this chapter, we mainly describe those as-pects of the generation procedure that are specific to the consideration of ambiguity.Existing text-to-process model generation approaches, cf. [99], already address most

82 5.2. CAPTURING AMBIGUITY USING BEHAVIORAL SPACES
1. Parse textual description
Textual processdescription
2. Compute interpretations per
statement
3. Generate behavioral
space
Behavioral space
Figure 5.2: Steps involved to construct a behavioral space from a textual description
challenges related to the parsing of textual descriptions (step 1) and related to the ex-traction of behavioral relations for unambiguous behavioral statements (part of step 2).When illustrating the steps of our approach, we use the activity identifiers denoted inTable 5.1 to refer to activities described in the running example.
Table 5.1: Activities in the running example
ID Activity ID Activity
a1 Receive claim a8 Reject claima2 Review request a9 Accept claima3 Record claim information a10 Receive requested informationa4 Validate documents a11 Calculate payable amounta5 Write settlement recommendation a12 Record settlement informationa6 Check recommendation a13 Archive claima7 Request further information a14 Arrange payment
5.2.1 Parsing Textual Process DescriptionsThe first step in the approach is to parse a textual process description T . The goal ofthis parsing step is to identify a set of behavioral statements S and to extract behav-ioral information from these statements. Each behavioral statement in a text describesa single type of relation that holds between a number of activities. Therefore, a sen-tence in a textual description can contain more than a single behavioral statement. Forexample, the sentence “After a claim is received, a claim officer reviews the requestand records the claim information”, contains two separate behavioral statements. Onestatement describes the strict order relation between “claim is received” and “reviewsthe request”. The other describes an ambiguous relation between “reviews the request”and “records the claim information”.
For each behavioral statement in S, the parsing step extracts the parts of the state-ment that refer to process concepts and their inter-relations. As such, the output of theparser consists of three semantic components that together comprise a behavioral rela-tion of the form: <source, relation type, target>, for each behavioral statement. Thesecomponents are a source reference, a relation type reference, and a target reference. Wespeak about references, rather than process concepts here, because textual descriptionsoften use different ways to refer to the same concept. For instance, “previous activity”provides a reference to some aforementioned activity; it is not a process concept itself.

CHAPTER 5. DEALING WITH AMBIGUOUS TEXTUAL DESCRIPTIONS 83
To clarify the parsing results obtained in this manner, we present the parsing resultsfor three statements in Table 5.2. We will use these examples in the remainder of thissection to further illustrate the algorithm that generates statement interpretations.
Table 5.2: Exemplary outcomes of behavioral statement parsing
ID Statement Source ref. Relation ref. Target ref.
ς1 After a claim is re-ceived, a claim officerreviews the request
claim is received(a1)
after reviews the request(a2)
ς2 a claim officer reviewsthe request and recordsthe claim information
reviews the request(a2)
and records the claiminformation (a3)
ς3 In the meantime, thefinancial departmenttakes care of thepayment
ε (not specified) meantime takes care of pay-ment (a14)
For this parsing step we can employ the parsers used by existing approaches forthe generation of process models from texts, i.e., text-to-model generators, such as theones described in Section 2.3.5. These approaches use a combination of standard NLPtools and heuristic-based techniques. NLP tools, such as the Stanford Parser [140], areused to identify the grammatical structure of sentences. This structure is important toextract the business object on which an action is being performed and to identify theactor who is performing the action. For example, the “claims officer” (actor) “reviews”(action) “the request” (business object). While the NLP tools mainly provide generaltechniques to analyze individual sentences and, thereby, extract activities, more tailoredtechniques are necessary to extract the ordering relations that exist between activities.For this purpose, model generation approaches employ heuristic-based techniques thatrecognize typical patterns used to express ordering relations. Such patterns includesequences like ”After activity i, do activity j” or choices like “If condition, then activityi, else activity j”. Since these techniques are extensively described in related work, wedo not elaborate on them. The interested reader may consult the work by Friedrich etal. [99] for a detailed description of a state-of-the-art parsing technique.
5.2.2 Computing Statement Interpretations
Behavioral ambiguity in a textual process description occurs when behavioral state-ments can be interpreted in different manners. We refer to these statements as ambigu-ous behavioral statements. These statements result in multiple, conflicting activity re-lations. For instance, the statement “a claim officer reviews the request and records theclaim information” results in two interpretations. It is unclear whether this statementimplies a strict order or an interleaving order between the two described activities.
In the remainder, we use the term statement interpretation to refer to the set ofbehavioral relations that are associated with a single interpretation of a behavioral

84 5.2. CAPTURING AMBIGUITY USING BEHAVIORAL SPACES
statement. Unambiguous behavioral statements result in a single statement interpre-tation, whereas ambiguous statements lead to multiple interpretations. Definition 5.1captures this notion. In this definition, we employ the behavioral profile relationsfrom [279] to capture relations between activities. This choice is based on two maincriteria. First, behavioral profile relations allow for an intuitive representation of theconcepts we introduce in the remainder of this chapter. Second, the relations can beused for computationally efficient conformance checks. This feature is important be-cause the computational complexity of conformance checks increases with the numberof interpretations of a textual process description.
The behavioral profile relations capture the ordering restrictions that are in effectbetween pairs of activities. Four different behavioral profile relations can exist for anactivity pair (ai, a j). The strict order relation ai a j is used to express that activity ai
cannot be executed after the execution of activity a j. The reverse strict order relationai
−1 a j indicates the opposite restriction, namely that ai cannot be executed afterthe execution of ai.1 The exclusiveness relation ai + a j denotes that either activity ai
or activity a j can be executed in a single process instance. Finally, the interleavingorder relation ai || a j states that ai and a j can be executed in an arbitrary order. Usingthe activity identifiers specified in Table 5.1, this results in the relation a1 a2 as arelation that holds between “receive claim” and “review request”.
Definition 5.1 (Statement Interpretations). Let ς be a behavioral statement in the setof behavioral statements S of a textual process description T , AT the set of activitiesdescribed in T , and R = { , −1,+, ||} the set of behavioral profile relations. Wedefine Γς as a set consisting of one or more statement interpretations for the statementς. Each statement interpretation γ ∈ Γς captures the behavioral relations that followa possible interpretation of ς, which is defined as a partial function γ : AT × AT 9 Rthat assigns a behavioral profile relation from R to a pair of activities from AT , if any.
In its second step, our approach constructs interpretations for each behavioral state-ment in S. Algorithm 1 formalizes this part. The algorithm takes as input a parsedbehavioral statement ς ∈ S, in which the semantic components have been identified.Then, it generates one or more statement interpretations, depending on the presenceand the type of ambiguity in ς. Given a statement ς ∈ S, we distinguish three cases forthis: (i) ς is unambiguous, (ii) ς contains type ambiguity, or (iii) ς contains scope am-biguity. For unambiguous statements, we obtain a single statement interpretation perbehavioral statement. For the two types of ambiguous statements, we obtain multipleinterpretations to reflect the various ways in which the statements can be interpreted.The following sections describe each of the three cases in detail.
Unambiguous Behavioral Statements
Generating a process interpretation for an unambiguous statement is relatively straight-forward: all references in the statement can be resolved in a single and unambiguousmanner. For these cases, we can generate a single statement interpretation by simplyusing the text-to-model generation approach to resolve the references and to construct
1Note that the reverse strict order relation ai −1 a j can only exist if and only if a j ai.

CHAPTER 5. DEALING WITH AMBIGUOUS TEXTUAL DESCRIPTIONS 85
Algorithm 1 Computing interpretations for a behavioral statement1: function computeStatementInterpretations(ParsedStatement ps)2: Set interpretations = new Set();3: if ps.isUnambiguous() then . Statement is not ambiguous4: Set sourceActivities = ps.getSourceActivities();5: Set targetActivities = ps.getTargetActivities();6: RelationType r = ps.getRelationType();7: interpretations.add(createInterpretation(sourceActivities, r, targetActivities);8: if ps.hasTypeAmbiguity() then . Relation type is ambiguous9: Set sourceActivities = ps.getSourceActivities();
10: Set targetActivities = ps.getTargetActivities();11: for RelationType r ∈ RelationTypes.get(ps.getRelationReference()) do12: interpretations.add(createInterpretation(sourceActivities, r, targetActivities);13: if ps.hasScopeAmbiguity() then . Scope of source reference is ambiguous14: Set targetActivities = ps.getTargetActivities();15: RelationType r = ps.getRelationType();16: Set sourceActivities1 = getPrecedingActivitiesWithSameResource(ps);17: interpretations.add(createInterpretation(sourceActivities1, r, targetActivities);18: Set sourceActivities2 = getPrecedingActivitiesWithSameObject(ps);19: interpretations.add(createInterpretation(sourceActivities2, r, targetActivities);20: Set sourceActivities3 = getActivitiesFromPrecedingControlFlowBlock(ps);21: interpretations.add(createInterpretation(sourceActivities3, r, targetActivities);22: return interpretations;
a behavioral relation. Algorithm 1 describes this creation of an interpretation for unam-biguous statements in lines 3–7. Since there is no ambiguity for any of the references,the employed text-to-model generation approach directly provides the set of source ac-tivities, target activities, and the relation type for the parsed statement. For example, instatement ς1, the generation approach used to parse the statement will correctly iden-tify that the “claim is received” activity a1 should precede the “reviews the request”activity a2, yielding the relation a1 a2.
Statements with Type Ambiguity
A behavioral statement with type ambiguity describes a relation among a specific setof activities, but does not clearly define the type of relationship. Such statements canbe identified because they have an ambiguous way to refer to the relation type, i.e. therelation reference is ambiguous. In line 8, Algorithm 1 checks if statement ς has typeambiguity by determining if the relation reference (relationRef ) is a known ambiguoustype indicator. In the context of this work, we focus on two ambiguous type indicators,namely the terms and and or. It is important to distinguish between cases where re-lationRef = “and” and cases where relationRef = “and, then” or similar. In the lattercases, the relation type is not ambiguous, since a sequential relation is clearly spec-ified. Although these statements with unclear relation types are ambiguous, we cangenerate a set of statement interpretations that accurately capture the different possibleinterpretations.

86 5.2. CAPTURING AMBIGUITY USING BEHAVIORAL SPACES
If a statement indeed suffers from type ambiguity, the algorithm continues by re-solving the unambiguous source and target activity references (lines 9–10). After-wards, the algorithm generates a single statement interpretation for each applicablerelation type (lines 11–12). For example, for statement ς2 from Table 5.2, we generateone statement interpretation that contains a sequential relation and one that contains aninterleaving order relation between activities a2 and a3.
Statements with Scope Ambiguity
Dealing with behavioral statements with scope ambiguity represents the most complexcase of the three. These statements describe the existence of a relation, but do not spec-ify between which activities this relationship holds. In practice, such ambiguity occurswith respect to the set of source activities to which a behavioral statement refers. Forexample, the statement ς3 “In the meantime, the financial department takes care of thepayment”, does not specify to what activities “meantime” refers. Consequently, thesource reference is empty (ε), as indicated in Table 5.2. Statements with scope ambi-guity typically occur in the context of parallelism and loops because such behavioralpatterns can be associated with textual references to groups of activities.
To automatically identify cases with scope ambiguity, we analyzed how existingtechniques for the generation of process models from textual descriptions handle par-allelism and loops. These techniques generally use heuristics to identify and analyzebehavioral statements in a text. They build on predefined sets of indicators that pin-point the different types of relations, e.g., “while” and “in the meantime” for parallelor interleaving order relations and “is repeated” for backward loops. Specifically, weanalyzed the set of indicators used by the state-of-the-art technique from [99]. In thisanalysis, we isolated a subset of the parallelism indicators employed by the techniquethat typically result in statements with scope ambiguity. These indicators are presentedin Table 5.3. What these indicators have in common is that their usage does not al-low for the specification of a scope of the statement, i.e., these indicators cannot beassociated with a source reference at all. Consider, for example, the sentence “In themeantime, the financial department takes care of the payment”. It is syntactically notpossible to specify to which set of activities a statement with in the meantime refers. Bycontrast, if we replace this construct with a non-ambiguous indicator, from the secondset in Table 5.3, this problem can be avoided. For example, the indicator “while” canbe used to specify the scope of the statement, e.g., “While the claim is being archived.”By observing the usage of such ambiguous indicators, we can identify statements withscope ambiguity (line 13 of Algorithm 1) and generate interpretations for them (lines14–21).
Table 5.3: Parallel indicators used in [99] and their classification
Class Contents
Unambiguous while, as well as, in parallel toAmbiguous meanwhile, concurrently, meantime, in the meantime

CHAPTER 5. DEALING WITH AMBIGUOUS TEXTUAL DESCRIPTIONS 87
Although statements with scope ambiguity are highly problematic since they referto an unknown set of activities, we can still identify a set of possible meanings forthem. In particular, we can utilize the knowledge that statements such as “the previoussteps” and “in the meantime” refer to distinct parts of a process. This means that theset of activities to which these statements refer cannot be any arbitrary combination ofactivities. The activities in the set must rather have a certain commonality, such as a setof activities that are all executed by the same person.
For this reason, we generate interpretations for statements with scope ambiguitybased on sets of activities that have a certain common attribute. In particular, givena textual process description, we can identify sets of subsequently described activitiesthat are (i) performed by the same resource, (ii) performed on or with the same (busi-ness) object, or (iii) are part of the same control-flow construct (e.g., a choice in theprocess). Based on this, we obtain different interpretations for the statement ς3. Inthis statement, “in the meantime” can refer to different moments when the financial de-partment can start taking care of the payment. This results in three possible statementinterpretations, each with a different commonality:
1. Common resource: While the claims officer, the last described resource, is per-forming its tasks, after a senior claims officer has accepted the claim, i.e., inparallel to {a11, a12, a13};
2. Common object: While activities are being performed on the last mentionedbusiness object (the claim), i.e., in parallel to {a13};
3. Last control-flow construct: While the last mentioned activity before the state-ment is being executed, i.e., in parallel to {a13}.
These three possibilities result in three sets of relations that can follow from thesame behavioral statement. Lines 14–21 describe the generation of a statement inter-pretation for each of the three sets of activities.
5.2.3 Generating a Behavioral SpaceUsing the interpretations of individual statements as a basis, we can construct viewson the full process behavior described in a textual description. We refer to a specificview as a process interpretation. A process interpretation for a text T follows fromthe selection of a single statement interpretation for each statement ς in the set ofbehavioral statements S. We define a process interpretation as given in Definition 5.2.
Definition 5.2 (Process Interpretation). Let T be a textual process description, AT theset of activities described in T , S the set of behavioral statements in T with Γs theset of statement interpretations of a statement ς ∈ S, and R = { , −1,+, ||} theset of behavioral profile relations. We then define a process interpretation as a tupleP = (I, BP), with:
• I: a complete set of interpretations consisting of a single statement interpreta-tion γ ∈ Γς for each statement ς ∈ S, formally the following constraint holds:∀ς ∈ S : |I ∩ Γς | = 1;• BP : AT × AT → R a function that assigns a behavioral profile relation from R
to each pair of activities from AT .

88 5.2. CAPTURING AMBIGUITY USING BEHAVIORAL SPACES
a1 a2 a3 . . . an
a1
a2
a3
...
an
+
f
f
f
||
+
||
...f
||
+
f . . .
||
||
...
+
a1 a2 a3 . . . an
a1
a2
a3
...
an
+
f
f
f
+
||
f
||
+
f
...
+. . .
Pm
P2
P1
Figure 5.3: A behavioral space as a collection of m process interpretations
Recognize that in Definition 5.2 any activity relation that follows from a functionγ ∈ I is part of BP, but that the reverse does not necessarily hold. BP defines acomplete behavioral profile based on the interpretations included in I, which includesrelations that follow from the transitivity of the strict order and interleaving order re-lations [255]. For instance let γ1 ∈ I be a statement interpretation that establishes therelation a b and let γ2 ∈ I be a statement interpretation that establishes b c.Then, BP will include the relation a c that follows due to transitivity2, even thoughthis relation is not part of any statement interpretation in I. Despite the overlap be-tween them, we include I alongside BP in Definition 5.2. This is done in order topreserve traceability between the obtained process behavior described by BP and thestatement interpretation in I that provided the foundation for BP. As such, we canuse this traceability to provide more useful diagnostic results when performing confor-mance checks.
A textual process description without ambiguity has exactly one process interpreta-tion. For a textual process description T with behavioral ambiguity, the set of processinterpretations in a behavioral space follows naturally as the set of possible combina-tions of statement interpretations for the ambiguous statements. For example, a textwith two ambiguous behavioral statements ςi and ς j with, respectively, two and threedifferent statement interpretations, will yield a set of 2 × 3 = 6 process interpretations.The concept of a behavioral space captures this spectrum of possible interpretationsfor a single process. Figure 5.3 visualizes this by depicting a three-dimensional viewon the behavioral relations that exist between the activities in an ambiguous textualdescription. Definition 5.3 provides the formal definition of a behavioral space.
Definition 5.3 (Behavioral Space). Let T be a textual process description and S theset of behavioral statements in T . We define a behavioral space BS as a set of processinterpretations of the textual process description T over the behavioral statements in
2Note that this only applies if no interpretation γ ∈ I denotes a (different) relation between activities aand c.

CHAPTER 5. DEALING WITH AMBIGUOUS TEXTUAL DESCRIPTIONS 89
S.
Algorithm 2 presents an algorithm to generate a behavioral space based on the state-ment interpretations obtained in the previous step of our approach. A behavioral spaceshould contain all possible combinations of statement interpretations for the behavioralstatements. Lines 3–14 in Algorithm 2 describe the creation of these combinations. Theunderlying idea is that all existing text interpretations, starting from an empty list (line3), are incrementally extended with a single statement interpretation (lines 8–11). Thisensures that each possible combination of statement interpretations is included in thelist. For example, as considered in the previous section, the claims handling processcontains three ambiguous statements with, respectively, two, three, and two possibleinterpretations. This results in a total number of 12 (2 × 3 × 2) possible combinationsof the statement interpretations and, thus, of 12 interpretations in BS . After all com-binations have been generated, we compute a full behavioral profile for each of theinterpretations and add them to the behavioral space (lines 15–17).
Algorithm 2 Generate a behavioral space from a textual process description1: function constructBehavioralSpace(Text text)2: BehavioralSpace behavioralSpace = new BehavioralSpace();3: List processInterpretations = new List();4: processInterpretations.add(new ProcessInterpretation());5: List newProcessInterpretations = new List();6: for Statement s ∈ text.getStatements() do7: List interpretations = computeStatementInterpretations(s);8: for Interpretation i ∈ interpretations do9: for ProcessInterpretation pi ∈ processInterpretations do
10: Interpretation newPI = pi.copy();11: newPI.add(i);12: newProcessInterpretations.add(newPI)13: interpretations = newInterpretations.copy();14: newInterpretations.clear();15: for ProcessInterpretation pi ∈ interpretations do16: computeFullBehavioralProfile(pi)17: if pi.getBehavioralProfile().isConsistent() then18: behavioralSpace.add(pi);19: return behavioralSpace;
To compute the complete behavioral profile for a process interpretation (line 16),we exploit the transitivity of the strict order and interleaving order relations [255]. Inthis way, we can obtain relations beyond those pair-wise relations that we extractedfrom a textual description. For example, if a text specifies that activity ai is followedby a j and a j is followed by ak, i.e. ai a j and a j ak, then ai is also followedby ak, i.e., ai ak. In lines 17 of the algorithm, we employ a technique definedby Smirnov et al. [255] to check the internal consistency of the obtained behavioralprofile. We only include mutually consistent process interpretations to the behavioralspace (line 18). For example, we exclude obviously incorrect interpretations in whichone statement interpretation yields the relation ai a j and another the relation ai +a j.

90 5.3. CONFORMANCE CHECKING USING BEHAVIORAL SPACES
Once the process interpretations have been obtained in this manner, the constructionof the behavioral space is complete. The generated behavioral space can be used toobtained trustworthy conformance-checking results, despite the presence of behavioralambiguity. Section 5.3 describes this.
5.3 Conformance Checking using Behavioral SpacesBy capturing behavioral ambiguity in a structured manner, behavioral spaces allow usto reason about process conformance without the need to arbitrarily settle ambiguity.In this section, we demonstrate this by showing how to perform a conformance checkof an execution trace versus a behavioral space generated from a textual process de-scription. This conformance check is highly similar to the one presented in Chapter 4,which performs a conformance check in the context of uncertain event-to-activity map-pings. The key difference between traditional conformance checking and conformancechecking using behavioral spaces lies in the potential outcomes of a check. In tradi-tional conformance checking, a trace is either conforming or it is non-conforming witha business process. Due to the behavioral ambiguity captured in behavioral spaces,a trace can be conforming or non-conforming, but also potentially conforming with abehavioral space. The latter outcome occurs for traces that conform to one or moreprocess interpretations in a behavioral space, but not with all of them.
To determine the level of conformance between a trace and a behavioral space, weconsider the number of process interpretations of a textual process description to whicha trace conforms. In particular, we quantify the support of a behavioral space BS fora trace σ as the ratio between the number of interpretations to which σ conforms andthe total number of interpretations in BS :
supp(σ, BS ) =|{P ∈ BS | con f (σ, P)}|
|BS |(5.1)
In Equation 5.1, we use con f (σ, P) to denote that a trace σ conforms to processinterpretation P. Given that a process interpretation is defined based on behavioralprofile relations, this conformance check involves the comparison of the behavioralprofile relations of trace σ to the behavioral profile relations of P. This is achievedbased on the conformance checking method described in [282]. The support metricsupp(σ, BS ) quantifies the fraction of interpretations in BS that allow for a trace σ tooccur. A support value of 1.0 indicates that a trace is without any doubt conformingwith the behavioral space, i.e., independent of the chosen interpretation. A support of0.0 shows that there is no interpretation under which a trace conforms to the behavioralspace. Therefore, it can be said with certainty that the trace is non-conforming withBS . Finally, any trace σ with a support value 0.0 < supp(σ, BS ) < 1.0 is potentiallyconforming with BS . This implies that there are certain interpretations of the textualdescription to which the trace conforms. To illustrate the usefulness of the supportmetric, consider the following three partial execution traces of the running example:
• σ1 = 〈a1, a2, a3, a4, a5〉
• σ2 = 〈a1, a3, a2, a4, a5〉
• σ3 = 〈a11, a14, a12, a13〉

CHAPTER 5. DEALING WITH AMBIGUOUS TEXTUAL DESCRIPTIONS 91
The difference between the traces σ1 and σ2 is that, in σ1, activity a2 occurs beforea3, whereas these are executed in reverse order in σ2, i.e., a2 a3 ∈ BPσ1 and a3 a2 ∈ BPσ2 . Furthermore, recall that the behavioral relation between these two activitiesis given by the ambiguous behavioral statement ς2. Depending on the interpretation ofς2, there either exists a strict order or an interleaving order relation between a2 and a3,i.e., R(a2, a3) = { , ||}. The relation a2 σ1 a3 from σ1 is subsumed by both possibleinterpretations included in the behavioral space, since sub( , ) and sub( , ||) areboth satisfied. Therefore, σ1 is conforming with all interpretations in BS and, thus, hasa support value of 1.0. For trace σ2 we observe a different situation. While a3 σ2 a2in trace σ2 is subsumed by relation a2 || a3, this relation is not subsumed by a2 a3.Therefore, σ2 does not conform to half of the process interpretations in BS . This resultsin supp(σ2, BS ) = 0.5.
Aside from providing information on the process interpretations with which a traceconforms, behavioral spaces allow us to obtain further diagnostic information from thisconformance check. In particular, we can gain insights into the conditions under whicha trace is conforming with a process description. For example, we can learn underwhich interpretations of the statement ς3, “In the meantime, the financial departmenttakes care of the payment”, traceσ3 is conforming. Inσ3, the financial department paysthe settlement amount (a14) before the claims officer records the settlement information(a12). This conforms to one of the two interpretations of statement ς3 and, therefore,results in a support value of 0.5. Furthermore, we know that this trace is conforming, ifand only if “in the meantime” means “while the claims officer is performing its tasks”and not “while the claims officer is archiving the claim”. Such diagnostic informationcan be useful when interpreting the support values for a trace or when aiming to resolvethe ambiguity contained in a textual description.
5.4 Pruning Behavioral Spaces based on InformationGain
This section demonstrates how the behavioral space of a textual process descriptioncan be reduced to provide more accurate conformance-checking results. We refer tothis act as pruning a behavioral space. In particular, we present a technique that sup-ports users in resolving behavioral ambiguity in an efficient manner. The techniqueidentifies those ambiguous behavioral statements in a textual description that have thebiggest impact on the ambiguity in a process. To achieve this, we define an informationgain metric. This metric quantifies the level of uncertainty in conformance-checkingresults caused by an ambiguous behavioral statement. It serves a similar purpose as theinformation gain metric used in the context of decision trees to quantify reductions ininformation entropy (cf. [222, 240]). Before introducing the information gain metric,we first consider how conformance-checking uncertainty can be reduced by resolvingambiguous statements and, thereby, pruning a behavioral space.

92 5.4. PRUNING BEHAVIORAL SPACES BASED ON INFORMATION GAIN
5.4.1 Conformance-Checking Uncertainty
In Section 5.3, we demonstrated that behavioral spaces allow for reasoning about con-formance without the need to resolve behavioral ambiguity. This is achieved by intro-ducing the notion of potential conformance, which captures situations where a traceis conforming to some process interpretations, but non-conforming to others. Such aclassification provides valuable information, especially in the context of the diagnosticinformation that can be associated with it, i.e., for which statement interpretations atrace is conforming or non-conforming. Still, such cases represent a form of unclar-ity in the conformance-checking results, because it is not known if a trace is actuallyconforming or not. We will refer to this state as conformance-checking uncertainty.
The accuracy of conformance-checking results can be improved by reducing thelevel of conformance-checking uncertainty. This can be achieved by resolving thecause of ambiguity in ambiguous statements. For instance, by replacing an ambiguoustype indicator such as “and” with either “and, then” or with “and, meanwhile”. In thesecases, there are less potentially conforming traces and more traces for which it can bestated with certainty that they are conforming or not. Behavioral spaces represent apowerful tool to support users in this endeavor. First, behavioral spaces support theimprovement of conformance checking accuracy by providing insights into the causes(i.e., the ambiguous statements) and the effects (i.e., the different interpretations) of be-havioral ambiguity. For instance, the behavioral space shows us that statement s2 fromthe running example is ambiguous. Therefore, it is clear that if a user decides to re-solve this ambiguity by selecting the correct interpretation of s2, we reduce the overallconformance-checking uncertainty. Second, behavioral spaces can support users evenfurther by letting them focus their resolution efforts on the ambiguous statements thatare the greatest causes of conformance-checking uncertainty. We achieve this with theinformation-gain metric that we introduce next.
5.4.2 Information Gain
We introduce Information Gain (IG) as a metric that describes how much conformance-checking uncertainty can be resolved by selecting a single interpretation for an ambigu-ous statement. A proper quantification for this gain is to consider for how many tracesthe interpretations of a single ambiguous statement disagree about their conformance.By resolving the ambiguity in statements of which the interpretations disagree aboutthe largest number of traces, a maximum of conformance-checking uncertainty can beremoved. We define IG for a set of statement interpretations Γς and a set of traces (orlog) L in Equation 5.2.
IG(Γ, L) = |⋃γ∈Γ
CL(γ) −⋂γ∈Γ
CL(γ)| (5.2)
In this equation, we use CL(γ) to refer to the set of traces from L that are conformingto the behavioral relations of γ. IG(Γ, L) specifies the size of the set of traces thatare conforming to at least one interpretation, but also non-conforming to at least oneinterpretation. This is computed by taking all traces that are allowed according to at

CHAPTER 5. DEALING WITH AMBIGUOUS TEXTUAL DESCRIPTIONS 93
least one interpretation in Γ, i.e., the union of all sets CL(γ) for γ ∈ Γ, minus thosetraces that are allowed by all interpretations in Γ, i.e., the intersection of these sets.
The metric IG can be applied in two different ways, depending on the availabil-ity of an event log. If an event log is not available, a log LG can be generated thatcontains all traces that are potentially conforming to the behavioral space BS . In thiscase, IG(Γ, LG) can be used to identify those phrases that lead to the biggest potentialreduction in ambiguity. However, if an event log LR related to the process is alreadyavailable, the information gain metric can be used to compute the information gain inthe context of truly observed behavior. In this case, IG(Γ, LR) represents the gain inambiguity specific to the event log LR.
To illustrate the usage of IG, consider the statements ς2 and ς3 used throughoutthis chapter (introduced in Table 5.2), on the one hand, and a log L with the following(partial) execution traces, on the other:
• σ1 = 〈a2, a3, a12, a13, a14〉
• σ2 = 〈a2, a3, a14, a12, a13〉
• σ3 = 〈a2, a3, a14, a12, a13〉
• σ4 = 〈a3, a2, a14, a13, a12〉
Recall that statement ς2 has two interpretations, with the following sets of behav-ioral relations: {a2 a3} and {a2 || a3}. It can be easily observed that these statementsdisagree about any trace in which a3 occurs before a2, i.e. of which the behavioralprofile contains a3 t a2. Trace σ4 is the only trace in L for which this is the case.Therefore, IG(Γs2 , L) = 1. To compute IG for statement ς3, it suffices to consider themost restrictive and most flexible interpretations of the statement. The most restrictiveinterpretation states that a14 can only be executed in parallel, i.e., possibly before, ac-tivity a13. By contrast, the most flexible interpretation of ς3 specifies that a14 is in aninterleaving order with a11, a12, and a13. This means that from log L, only trace σ1 isconforming to the former interpretation, whereas all four traces are conforming to thelatter interpretation of ς3. Therefore, three traces in L are in dispute by the interpre-tations in Γs3 , i.e. IG(Γs3 , L) = 3. From this, it can be concluded that the resolutionof ambiguity in statement ς3 has a greater impact on the ambiguity in log L than theresolution of ς2.
By computing IG for all ambiguous statements in a behavioral space and resolvingthe statements with the highest information gain, users can efficiently reduce the levelof conformance-checking uncertainty. As such, the behavioral space will be prunedby removing process interpretations that are not conforming with the resolved ambi-guity. This greatly enhances the efficient usage of the notion of behavioral spaces forconformance checking.
5.5 EvaluationIn this section, we evaluate the usefulness of behavioral spaces for conformance check-ing in the context of ambiguous textual process descriptions. For this purpose, weconduct a two-stage evaluation. First, we assess the impact that the consideration ofbehavioral spaces has on conformance-checking results. In particular, we compare the

94 5.5. EVALUATION
conformance-checking results obtained by using behavioral spaces to two alternativeways of dealing with behavioral ambiguity. Second, we demonstrate the effectivenessof the proposed IG metric for the reduction of uncertainty in conformance-checkingresults.
In the remainder, Section 5.5.1 first introduces the test collection used in both partsof the evaluation. Then, Sections 5.5.2 and 5.5.3 respectively describe the evaluationof the conformance-checking results and of the IG metric.
5.5.1 Test Collection
To perform our evaluation, we reuse the collection of textual process descriptions fromthe text-to-model generation approach by Friedrich et al. [99]. The collection contains47 process descriptions from various industrial and scholarly sources. These textualdescriptions were also used in the evaluation described in Chapter 3. Table 5.4 givesan overview of the characteristics of the test collection.
Table 5.4: Overview of the test collection
ID Source Type T S W
1 HU Berlin Academic 4 10.0 18.12 TU Berlin Academic 2 34.0 21.23 QUT Academic 8 6.1 18.34 TU Eindhoven Academic 1 40.0 18.55 Vendor Tutorials Industry 4 9.0 18.26 inubit AG Industry 4 11.5 18.47 BPM Practitioners Industry 1 7.0 9.78 BPMN Practice Handbook Textbook 3 4.7 17.09 BPMN Guide Textbook 6 7.0 20.8
10 Federal Network Agency Public Sector 14 6.4 20.0
Total 47 9.2 17.2
Legend: T = Number of textual process descriptions, S = Sen-tences per text (avg.), W = Words per sentence (avg.)
The data from Table 5.4 illustrate that the included process descriptions differgreatly in size. The average number of sentences ranges from 4.7 to 34.0. The longestprocess description contains a total of 40 sentences. Furthermore, the descriptions dif-fer in the average length of the sentences. While the BPM Practitioners source containsprocess descriptions with rather short sentences (9.7 words), the process descriptionsfrom the TU Berlin source contain relatively long sentences (21.2 words). Lastly, theprocess descriptions differ in terms of how explicitly and unambiguously they describethe process behavior. Among others, this results from the variety of authors that cre-ated the textual descriptions. Hence, we believe that the collection is well-suited forachieving a reasonably high external validity of the results.

CHAPTER 5. DEALING WITH AMBIGUOUS TEXTUAL DESCRIPTIONS 95
5.5.2 Conformance EvaluationTo demonstrate the usefulness of behavioral spaces for conformance checking, wecompare the conformance-checking results obtained by using behavioral spaces to twoalternative ways of dealing with behavioral ambiguity. These two alternatives are: (i)imposing assumptions on the correct interpretation of behavioral statements, and (ii)ignoring ambiguous statements because they cannot be resolved. The goal of this partof the evaluation is to show that behavioral spaces provide a much more reasonableview on the process behavior allowed by a textual process description, when comparedto the two alternatives. We first describe the details of the setup used for this part of theevaluation and then present and discuss the results.
Setup
To conduct the evaluation, we implemented a prototype to generate behavioral spacesfrom textual process descriptions. To achieve this, we build on the state-of-the-arttext-to-process model generation approach by Friedrich et al. [99]. In particular, ourJava prototype uses a library that is part of the RefMod-Miner3, which implements theprocess model generation approach in a stand-alone tool. We use the library to auto-matically identify activities and extract behavioral profile relations that exist betweenactivities.
We compare the conformance-checking results obtained by using behavioral spacesto two alternative ways of dealing with behavioral ambiguity. The first alternative re-flects the possibility to deal with behavioral ambiguity by imposing assumptions on thecorrect interpretation of a text, i.e., by selecting a single interpretation for each ambigu-ous behavioral statement. Second, it is possible to deal with behavioral ambiguity byignoring all ambiguous statements and, thus, only focusing on the behavioral relationsthat can be extracted with certainty from a text. Given these alternatives to behavioralspaces, we generate three behavioral models (BMs) for each of the 47 textual processdescriptions as follows:
1. Fully interpreted behavioral profile (BPfull): This behavioral model reflects anapproach that imposes assumptions on the correct interpretation of ambiguousstatements. To obtain BP f ull, we generate a process model by using the text-to-model generation approach from [99] and, subsequently, extracting a behavioralprofile from this model;
2. Minimally restricted behavioral profile (BPmin): This behavioral model re-flects an approach in which ambiguous statements are fully ignored. The result-ing behavioral profile only captures the behavioral relations that can be extractedwith certainty from the textual process description. To obtain BPmin, we removeall behavioral profile relations from BP f ull that were extracted from the analysisof ambiguous behavioral statements;
3. Behavioral space (BS): The behavioral space generated for the textual descrip-tion in accordance with the interpretation generation method described in Sec-tion 5.2.
3http://refmod-miner.dfki.de

96 5.5. EVALUATION
We conduct our evaluation by comparing the sizes of the sets of traces that are(potentially) conforming with the three behavioral models, in accordance with the def-initions provided in Section 5.3.4 Using C(BM) to refer to the collection of traces thatare conforming or potentially conforming to a behavioral model BM, we quantify thesize differences using the following two metrics:
R1 =| C(BS ) || C(BPmin) |
(5.3) R2 =| C(BP f ull)) || C(BS ) |
(5.4)
R1 quantifies the ratio between the number of traces allowed by a behavioral spaceand a minimally restricted behavioral profile. This measure reflects how much behav-ior that certainly does not conform to σ is allowed when ambiguous statements areignored. R2 quantifies the ratio between the number of traces allowed by a behavioralspace and those allowed by a fully interpreted behavioral profile. This measure reflectshow much behavior that is possibly conforming to σ is marked as nonconforming byan approach that imposes assumptions on ambiguous statements.
Results
Table 5.5 summarizes the evaluation results. The first interesting thing to note is howcommon textual process descriptions with behavioral ambiguity are. In total, 32 of the47 textual process descriptions (70%) contained one or more ambiguous phrases. Themajority of these cases, 28 in total, included just phrases with type ambiguity. Fourcases contain statements with scope ambiguity, 3 of which also contain behavioralstatements with type ambiguity.
Table 5.5: Evaluation results
Collection T Stype Sscope A BS R1 R2
Only type ambiguity 28 64 0 19.6 11.0 100.0% 37.8%With scope ambiguity 4 13 4 24.0 76.5 16.4% 0.5%
Total 32 77 4 20.2 19.1 89.5% 33.7%
Legend: T = number of textual process descriptions, Stype = statementswith type ambiguity, Sscope = statements with scope ambiguity, A = ex-tracted activities per process (avg.), BS = interpretations per behavioralspace.
For processes with just type ambiguity in their descriptions, there is a clear differ-ence between the behavior allowed by fully interpreted behavioral profiles C(BP f ull)and the behavior allowed by behavioral spaces C(BS ). As indicated by metric R2, thefully interpreted behavioral profiles allow for only 37.8% of the behavior allowed by
4For processes that contain loops, we only include traces with at most one repetition.
CHAPTER 5. DEALING WITH AMBIGUOUS TEXTUAL DESCRIPTIONS 97
the behavioral space. For the remaining 62.2% of the traces, we cannot state with cer-tainty that they do not conform to the process described in the text. This differenceresults from ordering restrictions that the text-to-model generation algorithm imposeson activities, even when these ordering restrictions may not exist. Behavioral spacesdo not impose such restrictions and, thus, mark traces that exhibit such execution flex-ibility as potentially conforming. This consideration of the cases with type ambiguityalready illustrates the impact of assumptions on conformance checking. Nevertheless,this impact is much more severe for textual process descriptions that also contain state-ments with scope ambiguity.
Legend:C(BP f ull)C(BS)C(BPmin)
Figure 5.4: Visualization of three sets of conforming traces for cases with scope ambi-guity
The behavioral models for the 4 cases with scope ambiguity show much larger dif-ferences among the behavior they allow. We visualize the relative sizes of the threesets of conforming traces in Figure 5.4. The light-gray area denotes the set of tracesconforming with BPmin, i.e., the set of traces that remain when treating ambiguousstatements as undecidable. The behavior allowed by the behavioral space, representedby the dark-gray area, is considerably smaller, as also indicated by the R1 score of16.4%. This number reveals that 83.6% of the traces in C(BPmin) are not conformingwith any reasonable interpretation of the statements with scope ambiguity. Figure 5.4also shows the considerable impact that the usage of single interpretations has on thenumber of conforming traces. The tiny size of the black area in the figure and theR2 score of 0.5% both indicate that, for the cases with scope ambiguity, the fully in-terpreted behavior profiles allow for only a very small fraction of the behavior thatis (potentially) conforming to a behavioral space. Again, the remaining 99.5% repre-sent traces that do not necessarily conflict with behavior specified in a textual processdescription.
The evaluation results show the impact both of ignoring ambiguous statements andof imposing single interpretations on them. As visualized by Figure 5.4, behavioralspaces provide a balance between these loosely restricted and overly restricted behav-ioral models. In summary, behavioral spaces exclude a large number of nonsensi-cal traces, which can be excluded by generating proper interpretations for ambiguousstatements. Still, they allow for many more traces than the restricted models that are
98 5.5. EVALUATION
obtained by imposing assumptions on the ambiguous statements in textual descriptions.
5.5.3 Pruning Evaluation
In the second part of the evaluation, we set out to demonstrate how effective the pro-posed pruning technique is at reducing uncertainty in conformance-checking results.Specifically, we assess how quickly conformance uncertainty can be reduced when weemploy the IG metric, introduced in Section 5.4, to select ambiguous phrases. Asa benchmark, we compare the results obtained in this manner to a random selectionmechanism. We first describe the details of the setup used for this part of the evalua-tion and then present and discuss the results.
Setup
To evaluate the effectiveness of the IG metric, we make use of the behavioral spacesgenerated for the textual descriptions in the previous part of the evaluation. Specifi-cally, we select the behavioral spaces for the 17 textual descriptions with more thanone ambiguous behavioral statement. For these cases it is relevant to determine whichambiguous phrase should be resolved first. To compute values for the IG metric, wegenerate a log Lt for each textual description T that contains all traces that are poten-tially conforming to the behavioral space BS .
In this evaluation, we are interested in how much we can reduce conformance-checking uncertainty by using IG to select the ambiguous phrases we resolve first. Wequantify this reduction by comparing the number of potentially conforming traces thatremain after resolving the ambiguity in a statement to the original number of potentiallyconforming traces. Again, we use C(BS ) to denote the set of potentially conformingtraces for a given behavioral space BS . Then, we compute the fraction of confor-mance uncertainty that remains after resolving k ambiguous statements as given byEquation 5.5. Here, BS k represents the behavioral space that remains after resolving kambiguous statements. BS 0 represents the behavioral space for which no ambiguity isresolved.
U(BS , k) =|C(BS k)||C(BS 0)|
(5.5)
We compute the value U(BS , k) for each k ∈ 1, . . . , n, where n is the number ofambiguous statements in BS . As a benchmark, we compare these values against theuncertainty that remains after randomly selecting ambiguous statements to resolve. Inparticular, we compute the average value of U(BS , k) for each of the n! different ordersin which ambiguous statements can potentially be selected. As such, this benchmarkmimics the situation in which people blindly select ambiguous statements to resolve.
Results
Figure 5.5 visualizes the evaluation results. The curves represent the average reductionin uncertainty over the 17 relevant cases. The figure shows considerable differences

CHAPTER 5. DEALING WITH AMBIGUOUS TEXTUAL DESCRIPTIONS 99
50%
60%
70%
80%
90%
100%
1 2 3 4 5+
Unc
erta
inty
reso
lved
# of ambiguous statements resolved
max. IGrandom
Figure 5.5: Comparison of uncertainty resolution using max. IG and random selection
between the reduction obtained by using the information gain metric versus the reduc-tions obtained through random selection.
When interpreting these results, it is important to recognize that the minimum un-certainty reduction per statement observed in the test collection is 50.0%. This quantityrepresents the amount of uncertainty that is removed when resolving the most simpleform of an ambiguous statement: a statement with type ambiguity between just twoactivities. Therefore, the reduction of 63.7% that is obtained by randomly resolving asingle ambiguous statement appears is only 13.7% higher than the minimum improve-ment per statement. In comparison, usage of the IG metric results in a removal of79.7% of the conformance-checking uncertainty in the first step. This reflects an im-provement of 29.7 percentage points above the minimum improvement per statement.Therefore, the IG metric leads to an improvement that is more than twice as high asrandom selection.
The 79.7% reduction in uncertainty demonstrates that, in many textual descrip-tions, a single statement has a much bigger impact on the ambiguity than the others.These statements are typically the ones with scope ambiguity. This is the case becausescope ambiguity results in a high number of potentially conforming traces, usuallycaused by interpretations with a considerable number of activities with interleaving or-der relations. This is, for instance, shown for statement ς3 considered in the runningexample of this chapter. Similarly, statements with type ambiguity among more thantwo activities result in an increased number of interleaving order relations comparedto statements with ambiguity between just two activities. Therefore, these statementsresult in a high number of potentially conforming traces. By resolving these ambigu-ous statements first, the information gain metric can be used to quickly resolve the vastmajority of conformance-checking uncertainty.
100 5.6. LIMITATIONS
5.6 Limitations
Our evaluation demonstrates the usefulness of behavioral spaces for reasoning aboutprocess conformance in the context of textual process descriptions. However, the eval-uation results should be considered against the backdrop of some limitations. In par-ticular, we are able to identify limitations related to the behavioral space generationapproach, the conformance-checking technique, and related to the evaluation.
Limitations related to the generation approach concern two facets. First, it has tobe considered that the natural language processing techniques on which we build ourapproach are not fully accurate. The model generation approach from [99] is heuristics-based, which means it does not cover all possible linguistic patterns that can be used toexpress behavioral relations. For instance, the approach cannot handle constructs cor-responding to OR-gateways in process models, such as “At least two of the followingthree activities should be performed”. Furthermore, the approach is not always ableto properly recognize backwards loops in process descriptions. However, since thisapproach represents the state of the art, it does provide an accurate reflection of thequality of model generation approaches. Also, it is important to stress that our genera-tion approach is largely independent of the underlying model generation approach. Aslong as this approach can provide information regarding source, relation type, and tar-get references, behavioral spaces can be generated according to the algorithms detailedin Section 5.3. Second, it has to be taken into account that we generate interpreta-tions for statements with scope ambiguity based on three commonalities. While thesecommonalities represent the plausible options in the context of process descriptions, itis possible that, in certain situations, other properties are necessary to capture the setof activities to which a statement refers. Still, the behavioral space will identify suchstatements as ambiguous and help users to analyze the impact of this ambiguity onconformance checks.
A point of consideration regarding our conformance-checking technique is that weperform conformance checks based on behavioral profiles. The expressive power ofthese relations has been shown to be less than that of process modeling notations suchas Petri nets, which are used by certain other conformance-checking techniques [15].Because of this lack of expressive power, behavioral profiles abstract from certainprocess behavior. As a result, conformance checking based on behavioral profiles isless restrictive than conformance-checking techniques based on Petri nets. [216] pro-vides a detailed overview of the restrictions on expressiveness. A particular weaknessin this regard relates to the handling of loops. When loops are present, behavioralprofile-based conformance checking is considerably less restrictive than other tech-niques. However, as previously mentioned, these constructs are notoriously problem-atic when parsing textual process descriptions. Therefore, it is important to be awareof this limitation, but also to recognize its limited impact given the current state-of-the-art text-to-model generation approaches. Nevertheless, we have selected behavioralprofiles because they enable highly efficient conformance checks, which is an impor-tant prerequisite given the numerous possible process interpretations that can exist inbehavioral spaces. However, the primary reason is that the transitive property of be-havioral profile relations allow us to combine the implications of different statement

CHAPTER 5. DEALING WITH AMBIGUOUS TEXTUAL DESCRIPTIONS 101
interpretations in an intuitive and safe manner.Finally, the obtained evaluation results must be considered in light of the specifics
of the textual process descriptions included in the test collection. To mitigate the im-pact of these specifics on the results, we composed the test collection from severalheterogeneous sources. As a result, the included descriptions contain a considerabledegree of ambiguity. Furthermore, this data set has been previously used to evaluatethe process model generation approach of Friedrich et al. [99]. Therefore, we are confi-dent that our evaluation shows a realistic picture of the impact of behavioral ambiguityin practical settings.
5.7 Related Work
The work presented in this chapter primarily relates to three major research streams:conformance checking, the analysis of textual process descriptions and the representa-tion of data uncertainty.
We previously provided an overview of conformance checking in Section 4.5, in-cluding a variety of its application scenarios and existing techniques. What these ex-isting techniques have in common is that they all compare observed behavior againsta structured process representation, such as a process model or business rules. Thetechnique presented in this chapter differs in this regard, because it is designed to workwith unstructured or semi-structured descriptions in natural language.
The relevance and widespread use of text documents as a source for process analy-sis has been emphasized in various contexts [99,163,166,250]. The majority of worksthat consider the analysis of textual artifacts related to business processes focus onthe automated derivation of process models from them. Respective techniques havebeen designed for textual process descriptions [99, 108], group stories [111], use casedescriptions [253], and textual methodologies [270]. From these, the text-to-modelgeneration technique from Friedrich et al. [99] is typically recognized as the state ofthe art [232]. Therefore, we used it as a basis for our own prototype and as a benchmarkfor our evaluation. Though none of these existing works mentions the problem of be-havioral ambiguity explicitly, all techniques impose assumptions on the interpretationof ambiguous behavioral statements. This results in a single interpretation, i.e., a pro-cess model, for any given text. However, this comes with the great disadvantage thatthe behavior allowed by this representation is much stricter than the behavior specifiedin the textual description.
Similar to behavioral ambiguity in textual process descriptions, ambiguous or un-certain data is also present in other application contexts. In these cases, uncertainty canbe caused by, among others, data randomness, incompleteness, and limitations of mea-suring equipment [210]. This has created a need for algorithms and applications foruncertain data management [25]. As a result, the modeling of uncertain data has beenstudied extensively (cf. [20, 126, 211, 246]). Our notion of a behavioral space buildson concepts related to those used in uncertain data models. For instance, similar to thebehavioral interpretations captured in a behavioral space, the model presented by DasSarma et al. [246] uses a set of possible instances to represent the spectrum of possi-ble interpretations for an uncertain relation. Furthermore, the model described in [20]

102 5.8. SUMMARY
uses conditions to capture dependencies between uncertain values. This notion has thesame result as the sets of behavioral relations that we derive from uncertain behavioralstatements and convert into different behavioral interpretations. Still, the technical as-pects and application contexts of these uncertain data models, which mostly relate toquerying and data integration [25], differ considerably from the process-oriented viewof behavioral spaces.
5.8 SummaryIn this chapter, we leveraged the concept of a behavioral space to deal with the ambi-guity in textual process descriptions. A behavioral space captures all possible interpre-tations of a textual process description. By using behavioral spaces for conformancechecking, we avoid the need to impose assumptions on the correct interpretations ofambiguous natural language texts. Therefore, conformance checks based on behav-ioral spaces provide trustworthy results: They avoid the risks associated with the se-lection of incorrect interpretations. Furthermore, we demonstrated the usefulness ofbehavioral spaces for the analysis of textual process descriptions. In particular, weused a quantitative evaluation with a set of 47 textual process descriptions to illustratethat a behavioral space strikes a reasonable balance between ignoring ambiguous state-ments and imposing fixed interpretations on them. Furthermore, we demonstrated theusefulness of a semi-automated pruning technique to quickly reduce the level of un-certainty remaining in conformance-checking results. In particular, by considering theinformation gain associated with the resolution of an ambiguous statement, the degreeof conformance-checking ambiguity can be reduced twice as fast as through randomselection.

6Transforming and Aligning Process Performance
Indicators
Monitoring Process Performance Indicators (PPIs) represents an important prerequisitefor organizations in their strive for continuous process optimization [151]. Therefore,a key task for managers is to define suitable PPIs that are aligned with the strategicbusiness objectives of the organization [233]. Typically, managers achieve this by de-scribing relevant PPIs using natural language descriptions [235,286]. This has the greatadvantage that PPIs can be easily specified and understood by all stakeholders [158].However, to be able to actually monitor PPIs, they must be defined in a way that sup-ports their automated computation and relates them to the technical implementation ofa business process in a Workflow Management or Enterprise Resource Planning Sys-tem [96]. Although there are structured notations that achieve this (cf. [218,233,286]),they are not at all similar to the unstructured natural language descriptions used andpreferred by managers.
Currently, the structured PPI definitions required to automatically monitor PPIscan only be obtained by manually transforming unstructured natural language descrip-tions [234]. Such a transformation requires considerable time and effort from a numberof resources. To illustrate the causes of this, consider the situation we observed duringour extensive research collaboration with the Andalusian Health Service [1, 235, 236].There, the IT department received requests to measure PPIs for all organizational pro-cesses, as specified by other departments in natural language. The IT department had tomanually establish SQL queries in order to compute the desired values for these PPIs.In many cases, the necessary interactions between business and IT led to miscommuni-cation. For example, as a result of misinterpretations or incomplete specifications, theIT department often obtained incorrect PPI values. The time required to clear up thesedifferences was considerable. In the general case, this necessary effort is even moreproblematic in light of the potentially vast size of process model repositories (possiblycontaining hundreds or even thousands of models [237]) and because processes andperformance measures are subject to continuous change [280]. In sum, this makes thetask of manually transforming PPIs into a structured notation hardly manageable in
103

104 6.1. PROBLEM ILLUSTRATION
practice.To overcome this problem, this chapter presents an approach to automatically trans-
late natural language PPI descriptions into PPIs that can be automatically monitored.In the remainder of this chapter, Section 6.1 illustrates the challenges associated withthe transformation task. Section 6.2 defines templates that we use for the structurednotation of PPIs and that represent the output format for our approach. Section 6.3describes the transformation approach itself. Section 6.4 presents a quantitative eval-uation that demonstrates the approach’s usefulness. Section 6.5 reflects on the limita-tions of our transformation approach and the evaluation. Section 6.6 discuss streams ofrelated research. Finally, Section 6.7 summarizes the chapter.
6.1 Problem IllustrationTo illustrate the challenges associated with the transformation of natural language PPIdescriptions into a structured notation, consider the process model shown in Figure 6.1.This figure depicts a simplified order handling process using BPMN. Table 6.1 pro-vides six exemplary PPI descriptions related to this process. These descriptions uselinguistic patterns that are similar to those that have been observed in practice [235].IS ppi formalization
Ord
er h
andl
ing
depa
rtm
ent
Order handling department
Validateorder
Acceptorder
Rejectorder
Pickproducts
Shipproducts
Sendinvoice order
handlingcompleted
orderreceived
Order
Customer
invoiceorder
Figure 6.1: Process model for an order handling process
Table 6.1: PPIs for the order handling example
ID Description
PPI1 Number of accepted orders.PPI2 Average time between receipt and completion of an order.PPI3 Average time to complete a received order.PPI4 The percentage of rejected orders.PPI5 The maximum time to transport an order.PPI6 The total order amount per customer.
To actually compute values for these PPIs, the natural language descriptions mustbe transformed into a structured notation. In some cases, this transformation is rela-tively straightforward. For instance, it is clear that the description of PPI1 refers to the

CHAPTER 6. TRANSFORMING AND ALIGNING PPIS 105
Table 6.2: Example of a structured notation for PPI2
Slot Value
ID PPI2Description Average time between receipt and completion of an orderMeasure type timeAggregation averageStart event Order receivedEnd event Order completed
number of process instances for which the “Accept order” activity is executed. Thetransformation of PPI2 is also relatively easy. For this PPI, we are interested in theaverage time between the “order received” and “order handling completed” events.Table 6.2 provides an example of how this PPI can be captured in a structured manner.Here we use measure type and aggregation to specify that the PPI computes the averagetime over process instances, whereas we use start event and end event to establish thelink between the PPI and the events of the process model depicted in Figure 6.1. How-ever, in other cases, the automated transformation of a PPI description into a structureddefinition is associated with considerable challenges. These challenges mainly relateto the flexible and inherently ambiguous nature of natural language, as preferred by hu-man users, but much less suitable for automated interpretation [182, 250]. We identifythree main challenges in this regard.
The first challenge to overcome is that natural language descriptions do not followa specific structure or notation. These descriptions can express the same PPI using abroad variety of syntactic patterns [23]. PPI2 and PPI3, for instance, both refer tothe average time between the receipt and completion of an order. However, the twoPPI descriptions use clearly distinct patterns to describe this measure. PPI2 explicitlyrefers to the start and end points of the measure in chronological order. By contrast,PPI3 describes these two points in a reverse order, i.e., the end point “completed” isdescribed before the start point “received.”
The second challenge to overcome is that natural language PPI descriptions candepend on implicit knowledge for their proper interpretation. Consider, for example,PPI4: “The percentage of rejected orders”. This PPI refers to some fraction, wherethe numerator refers to the number of process instances in which the “Reject order”activity is executed. However, the PPI description does not specify the denominatorfor this fraction, i.e., it is not clear from the description by what number this numeratorshould be divided. Instead, the description depends on the implicit assumption that thedenominator, most likely, refers to the total number of received orders.
Lastly, the third challenge that a transformation approach must address are prob-lems caused by differences in terminology between PPI descriptions and process mod-els. For example, the description of PPI5 refers to the time it takes to “transport or-ders”, whereas the process model refers to this action as “product shipment.” Suchdifferences occur in particular because PPIs and process models are generally definedby different organizational stakeholders, with their own perspectives on a process.

106 6.2. TEMPLATE-BASED PPI DEFINITIONS
In summary, an automated transformation approach must be able to deal with (i) avariety of syntactic patterns, (ii) partially implicit PPI descriptions, and (iii) differencesin terminology between description and model. The approach presented in this chapteraddresses these challenges. Before describing this approach in detail, we introduce so-called templates, which represent the output required by an automated transformationapproach.
6.2 Template-Based PPI Definitions
This chapter focuses on the transformation of natural language PPI descriptions intoones that follow a structured notation, which allows for their automated monitoring.This requires us to first define a structured notation into which we aim to transformthe unstructured descriptions. We define this structured notation in the form of PPItemplates. Each PPI template captures the different concepts of a PPI definition thatare required for its automated computation. We refer to the placeholder of each con-cept in the template as a slot, to which a value, a so-called slot filler, must be assignedwhen defining a PPI. For the definition of these templates, we build on the PPINOTmetamodel, introduced in [235]. We selected this metamodel because of its high de-gree of expressiveness and because it explicitly establishes links to process model el-ements. Due to these links, the PPINOT metamodel can be used to define structuredPPIs whose values can be computed in an automated manner. Specifically, we basethe templates for our approach on the templates and associated linguistic structures de-fined in [236]. In Section 6.2.1, we introduce the slots that correspond to the differentsemantic concepts that constitute the PPI templates. Section 6.2.2 describes the valuedomains associated with these slots.
6.2.1 Template SlotsWe define four different PPI templates, each corresponding to a different type of mea-sure that can underly a PPI: numerical, temporal, data-based, and fractional PPIs.These templates can capture the vast majority of PPIs that have been observed in empir-ical studies [234, 235]. Table 6.3 presents the four templates and provides an examplefor each of them.
Aside from an identifier and the natural language description, all of the templatescapture four distinct semantic concepts, as illustrated by Figure 6.2: (i) measure type,(ii) aggregation function, (iii) group-by property, and (iv) one or more process concepts.The first three semantic concepts together characterize the measure of a PPI. The fourthconcept links components of the PPI to the actual implementation of a business process.We now elaborate on these semantic concepts.
Measure type. The measure type classifies the nature of the measure underlying aPPI. In this work, we focus on the four most common measure types according to [236]:count, time, data, and fraction measures. A count PPI measures the number of timessomething happens. For instance, PPI1 measures the number of orders that are ac-cepted. Time measures consider the duration between two instants, i.e., the start or

CHAPTER 6. TRANSFORMING AND ALIGNING PPIS 107
Table 6.3: PPI templates and examples
Slot Value Slot Value
ID PPI1 ID PPI2Description Number of accepted orders Description Average time between re-
ceipt and completion of anorder
Measure type count Measure type timeAggregation sum Aggregation averageCounted event Accept order [completed] Start event Order receivedGroup-by — End event Order completed
Group-by —
ID PPI4 ID PPI6Description The percentage of rejected
ordersDescription The total order amount per
customer.Measure type fraction Measure type dataAggregation sum Aggregation sumNumerator Reject order [completed] Measured attr. Order [amount]Denominator Order received Group-by customerGroup-by —
PPI template
Measure Type
Aggregation function
Group-by property
Process concept
1 0..1 0..1 1..*
Activity state change
Event occurrence
Data attribute value
Figure 6.2: Semantic concepts in a PPI definition

108 6.2. TEMPLATE-BASED PPI DEFINITIONS
completion of an activity or the execution of an event. PPI2 and PPI3 represent exam-ples of such time measures. Data measures consider the attribute values of data objects,as seen for PPI6, which sums the amounts associated with “order” data objects. Fi-nally, fraction measures divide the value of one measure by another. For example, PPI4divides the number of rejected orders by the number of received orders.
Aggregation function. Aggregation functions are used to aggregate the values ofmultiple process instances using a specific metric. For example, PPI2 and PPI3 con-sider the average time of individual order handling instances, whereas PPI5 considersthe maximum time it takes to transport an order. Note that the aggregation function isan optional slot in the templates; it is not necessary to specify it for every measure.
Group-by property. Group-by properties can be applied on measures with an ag-gregation function in order to compute a value aggregated over those process instancesthat have a certain property. These properties can be based on data attributes or onresources that are involved in the execution of a process instance. For example, PPI6requires a group-by property to determine the total order amounts per customer. Agroup-by property is an optional slot in a PPI template. If no such property is defined,the aggregated measure is simply applied on all process instances.
Process concepts. A process concept refers to a value or an occurrence during theexecution of a business process that is relevant to the computation of a PPI. As shownin Figure 6.2, process concepts can refer to different things in the context of a PPItemplate. For instance, an activity is started, a process model event occurs, or the valueof a data attribute changes. Each PPI template has one or more slots associated withprocess concepts. The exact number and the semantics of these slots differ per measuretype. In particular, we define the following semantic roles for the different measuretypes:
• count measure: counted event;• time measure: start event, end event;• data measure: measured attribute;• fraction measure: numerator, denominator.
Each of the semantic roles associated with a particular measure type should be filledwith at least one process concept. For example, a time measure should always havea start and an end event. Furthermore, a slot may be filled with multiple events. Forexample, a count measure can be used to measure the total number of occurrences ofmultiple events, such as the number of accepted and the number of rejected orders.
6.2.2 Slot DomainsAs illustrated in the previous section, PPI templates contain four different types of slots:measure types, aggregation functions, group-by properties, and process concepts. In astructured PPI definition, each of these slot types can only be filled with values froma closed class, i.e., from a specific domain. By filling slots with values from known

CHAPTER 6. TRANSFORMING AND ALIGNING PPIS 109
domains, we can ensure that values for the defined PPIs can actually be computed inan automated manner. Consider, for example, the textual description of PPI2. This de-scription refers to the “completion of an order”. Without incorporating domain knowl-edge, it is not clear to which process concept this statement exactly refers. Therefore,it is not possible to compute a value for this PPI based on this information. If we,instead, fill this slot with a value from the appropriate slot domain, i.e., by associatingthe slot with the “Order handling completed” process model event, we overcome thisissue. Then, we know that the computation of a value for this PPI requires us to stopthe measurement when this specific event occurs. Table 6.4 summarizes the domainsfor the four different slot types.
Table 6.4: Domains associated with template slots
Slot type Domain values
Measure type count, time, data, fractionAggregation function minimum, maximum, average, sumGroup-by property Data objectsProcess concepts Activities, events, & data objects
To increase the expressiveness of the PPI definitions that follow our templates, webase the slot domains on an extended version of the process model definition providedin Definition 2.4. In particular, we utilize the abstract business process modeling lan-guage designed to be used with the PPINOT framework, which provides the foundationfor our PPI definitions. The metamodel for this abstract modeling language, definedin [233], introduces two main, additional concepts in process models: the notion of adata object and of a runtime state. A data object can be used to capture data that isrelevant to a process and its execution, such as data attributes and resources that exe-cute activities1. In general, the attributes that can be associated in this way are highlysimilar to event attributes, as given by Definition 2.6. Examples of data objects relevantto the running example are an order, the order amount, and an invoice.
Runtime states are used to denote values that are assigned or changed as the processinstance is executed. For example, process model activities can be associated withstates that correspond to the transaction types associated with events from event logs,defined in Section 2.2. In this way, runtime states can be used to differentiate between,for instance, the start and completion of activities for a process instance. Similarly,runtime states can denote the status of data objects. For example, in an order handlingprocess, an order data object may have a status, such as rejected or accepted associatedwith it as a runtime state.
To operationalize these additional concepts, we extend the process model definitionfrom Definition 2.4 into a definition that includes the data objects and runtime statesnecessary to capture additional details of a process:
1Note that this notion of data objects from [233] is broader than the concept of data objects in, forexample, BPMN.
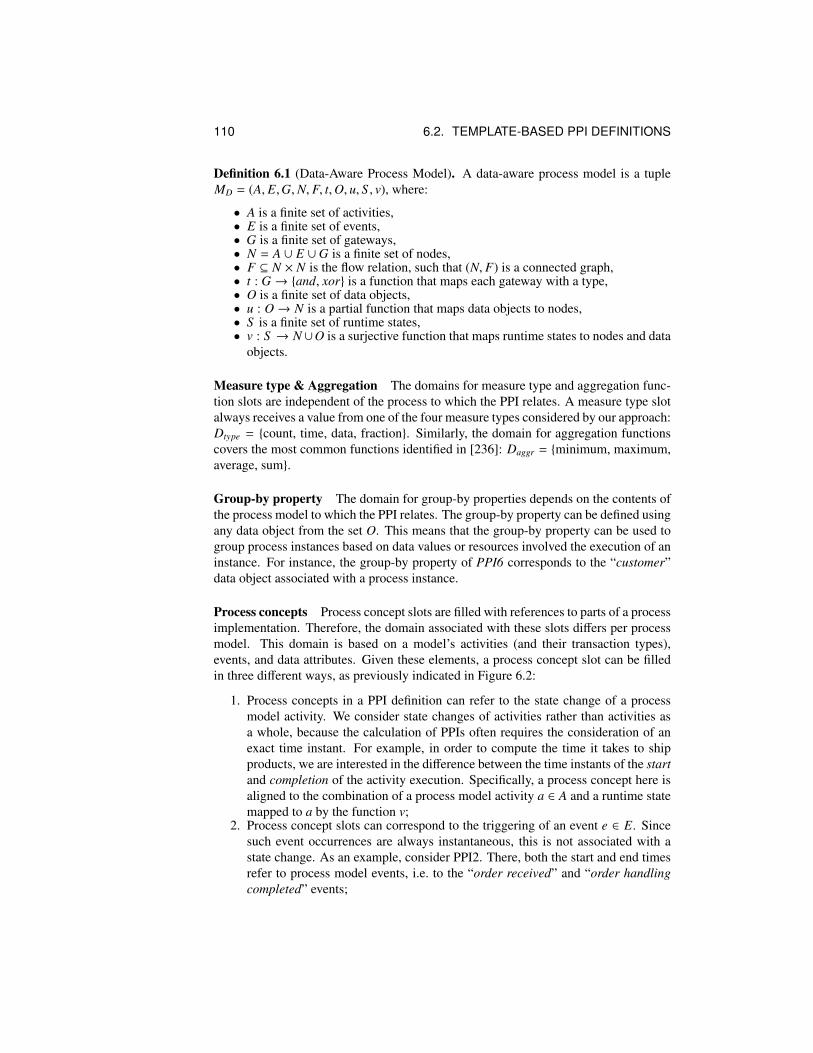
110 6.2. TEMPLATE-BASED PPI DEFINITIONS
Definition 6.1 (Data-Aware Process Model). A data-aware process model is a tupleMD = (A, E,G,N, F, t,O, u, S , v), where:
• A is a finite set of activities,• E is a finite set of events,• G is a finite set of gateways,• N = A ∪ E ∪G is a finite set of nodes,• F ⊆ N × N is the flow relation, such that (N, F) is a connected graph,• t : G → {and, xor} is a function that maps each gateway with a type,• O is a finite set of data objects,• u : O→ N is a partial function that maps data objects to nodes,• S is a finite set of runtime states,• v : S → N∪O is a surjective function that maps runtime states to nodes and data
objects.
Measure type & Aggregation The domains for measure type and aggregation func-tion slots are independent of the process to which the PPI relates. A measure type slotalways receives a value from one of the four measure types considered by our approach:Dtype = {count, time, data, fraction}. Similarly, the domain for aggregation functionscovers the most common functions identified in [236]: Daggr = {minimum, maximum,average, sum}.
Group-by property The domain for group-by properties depends on the contents ofthe process model to which the PPI relates. The group-by property can be defined usingany data object from the set O. This means that the group-by property can be used togroup process instances based on data values or resources involved the execution of aninstance. For instance, the group-by property of PPI6 corresponds to the “customer”data object associated with a process instance.
Process concepts Process concept slots are filled with references to parts of a processimplementation. Therefore, the domain associated with these slots differs per processmodel. This domain is based on a model’s activities (and their transaction types),events, and data attributes. Given these elements, a process concept slot can be filledin three different ways, as previously indicated in Figure 6.2:
1. Process concepts in a PPI definition can refer to the state change of a processmodel activity. We consider state changes of activities rather than activities asa whole, because the calculation of PPIs often requires the consideration of anexact time instant. For example, in order to compute the time it takes to shipproducts, we are interested in the difference between the time instants of the startand completion of the activity execution. Specifically, a process concept here isaligned to the combination of a process model activity a ∈ A and a runtime statemapped to a by the function v;
2. Process concept slots can correspond to the triggering of an event e ∈ E. Sincesuch event occurrences are always instantaneous, this is not associated with astate change. As an example, consider PPI2. There, both the start and end timesrefer to process model events, i.e. to the “order received” and “order handlingcompleted” events;

CHAPTER 6. TRANSFORMING AND ALIGNING PPIS 111
3. Process concept slots can be associated with data attribute values. For example,to compute PPI6, “The total order amount per customer”, we have to considerthe value of the data attribute amount of the order data object. Here, the slot ofa process concept is aligned to a data object o ∈ O.
In the next section, we present our approach, which automatically fills the definedtemplates for natural language PPI descriptions.
6.3 Transformation ApproachTo transform an unstructured natural language PPI description into a structured nota-tion, we define the transformation task as a template-filling problem. In this section,we describe a transformation approach that addresses this problem. Given a naturallanguage PPI description, our approach aims to obtain the information necessary to fillthe slots of a PPI template. To achieve this, the transformation approach performs twosubsequent steps, as depicted in Figure 6.3.
Natural language PPI description
Semantic annotation
Domain value resolution
Average time between receipt and completion of an order
AGR TMI TSI TSE TEI TEE
HMM Process model
Domains
Filled PPItemplate
D : {x | x in R}
Figure 6.3: Overview of the proposed transformation approach
First, the approach parses a natural language description in order to identify theparts of the description that correspond to slots of the PPI template. For this parsingstep we use HMMs. We refer to this parsing task as semantic annotation. Second,the approach determines the appropriate slot-fillers by matching the semantically an-notated parts to values in the relevant domain, e.g., by matching concepts from thenatural language description to activities in a process model. We refer to this task asdomain value resolution. In the remainder of this section, Sections 6.3.1 and 6.3.2respectively describe the semantic annotation and domain value resolution tasks in de-tail. Afterwards, Section 6.3.3 discusses the operationalization of our approach and itsextensibility.
6.3.1 Semantic AnnotationThe first step of our approach identifies those parts of a natural language PPI descriptionthat correspond to the semantic concepts contained in the PPI templates. For example,for PPI5: “the maximum time to transport an order”, we aim to identify that “maxi-mum” corresponds to the concept of an aggregation function, “time” corresponds to themeasure type, and “transport an order” describes the events to be measured. For thissemantic annotation task, we define a tag set Σ that can be used to annotate relevantsemantic concepts in natural language PPI descriptions.

112 6.3. TRANSFORMATION APPROACH
Semantic Tags
Table 6.5 presents the tag set we use for the semantic-annotation step. We establish thistag set Σ by defining two sorts of tags. First, Σ includes tags that correspond to eachof the semantic concepts from the PPI templates. For example, we use AGR to referto an aggregation function and FNE to denote a numerator event of a fraction PPI.Second, Σ contains tags used to annotate textual indicators that signal the transition ofthe description to a new semantic concept. For example, we use the tag T EI, i.e., atime end indicator, to show that a time end event will be described next. This can beseen for PPI2, “Average time between receipt and completion of an order” where theterm “and” denotes a transition from the description of the start event (“receipt”) to theend event (“completion of an order”). To illustrate the usage of the tag set, considerthe following annotation of PPI2 from the order handling process:
average\AGR, time\TMI, between\TSI, receipt\TSE, and\TEI,
completion of an order\TEE.
From this annotation, we can observe that “average” corresponds to the aggre-gation function slot of a PPI template, “receipt [of an order]” to the start event and“completion of an order” to the end event.
Table 6.5: Tag set used for semantic annotation
Tag Description Examples
AGR Aggregator function average, sum, maximumGBI Group by indicator per, for eachGBC Group by concept category, customer, department
CMI Count measure indicator number of, volume of, number of timesCE Counted event accepted orders, incidents
TMI Time measure indicator time, duration, throughput timeTSI Time start indicator from, betweenTSE Time start event order received, product pickingTEI Time end indicator to, untilTEE Time end event order completion, product shipmentTBE Time start and end event service interruptions, product packaging
FMI Fraction measure indicator percentage of, ratio of, proportion forFNE Fraction numerator event rejected ordersFDI Fraction division indicator divided by, relative to, as a percentage ofFDE Fraction denominator event received orders
In the tag set Σ, we purposefully do not define separate tags for data measures,because their semantic structure generally follows a similar syntactic pattern as othermeasures. Consider, for instance, PPI6: “the total order amount per customer.” Thisdescription of a data measure follows an identical structure as a count measure would.However, in the context of this process model, “amount” refers to a data attribute of an

CHAPTER 6. TRANSFORMING AND ALIGNING PPIS 113
start
AGR
TMI
TBE
TSI TSE TEI TEE
GBCGBI end
0.21
0.10
0.71
0.61
0.39
1.00 1.00 1.00
0.08
1.00 1.00
0.92
0.10
0.90
Figure 6.4: Fragment of a semantic prior P(Θ)
order, rather than describing a regular count measure. Since such distinctions solelydepend on the contents of the process model, i.e., on its data objects, we leave the dif-ferentiation between data and other measure types for the second step of our approach.
Semantic Annotation using HMMs
For the automated annotation of a PPI description, we use an HMM that assigns se-mantic tags to chunks of the description. Each word in a description is part of exactlyone chunk and each chunk is assigned exactly one tag. We use π =< ϕ1, . . . , ϕn > todenote the chunks of a partitioned description and Θ =< θ1, . . . , θn > to describe thesequence of tags assigned to the chunks, where θi ∈ Θ is the tag that corresponds to thechunk ϕi ∈ π. Formally, given a word sequence W that constitutes a PPI description,the goal of the HMM is to then find the semantic representation of the meaning Θ thathas the maximum a posteriori probability P(Θ | W) [275]. This probability is given bythe following equation:
Θ = arg maxΘ
P(Θ | W) = arg maxM
P(W | Θ)P(Θ) (6.1)
Equation 6.1 shows that, to compute Θ, the HMM combines two separate models:a semantic prior P(Θ) and a lexicalization model P(W | Θ). We now briefly describehow these models work in the context of our transformation approach. For a moredetailed explanation of the technical aspects underlying HMMs, we refer the interestedreader to [223].
Semantic prior. The semantic prior P(Θ) assigns a probability to an underlying se-mantic structure Θ. Intuitively, it models the probability that a PPI description followsa certain semantic structure, i.e., a sequence of tags from Σ. The model can be repre-sented as a probabilistic finite automaton. The states of this automaton correspond tolabels in the set Σ. The transition probabilities between states denote the probabilitiesthat these states follow each other in a semantic structure. These probabilities can belearned by training an HMM on a collection of (partially) annotated PPI descriptions.We further reflect on the training of HMMs at the end of this section.
The semantic prior that results from a training phase can be used to determine thelikelihood that PPI descriptions follow a certain semantic structure. As an example,consider the fragment of a semantic prior depicted in Figure 6.4. This figure shows the

114 6.3. TRANSFORMATION APPROACH
semantic prior relevant to the annotation of time measures. From this semantic prior,we can observe that, despite the huge variability that natural language PPI descriptionscan use to describe time measures, there is much less diversity in the semantic structurethat they follow. For example, the prior shows that if a time measure (in this trainingset) has an aggregation function, then this is the first semantic concept that is described,whereas an optional group-by property occurs at the end of a description. Furthermore,the prior shows that a time measure indicator (TMI) is followed by a specificationof an event that describes both the beginning and end of the measure (TBE) with aprobability of 0.61, i.e. T MI → TS I has a probability of 0.61. In the other cases,TMI is followed by a time start indicator (TSI). By contrast, a TSI is always followedby a time start event (TSE) (probability of 1.00), because there are no other semanticstructures in which a TSI occurs. This means that a TSI will never be directly followedby, for instance, a time end event or a group-by indicator.
Lexicalization Model. The lexicalization model P(W | Θ) quantifies the probabil-ity that a given word sequence W is used to model a certain semantic structure Θ.Intuitively, it quantifies the probability that W is used to a convey a meaning Θ. Inparticular, it models the transition probabilities between words given a certain con-text, i.e., a certain semantic concept. Probabilities in the lexicalization model have theform P(wordn | wordn−1, context), which is the probability of taking a transition fromone word to another given a particular context [196]. For example, the probabilityP(time | throughput,T MI) denotes that the word time follows the word throughputin the context of a TMI (time measure indicator). As for the semantic prior, theseprobabilities are learned from a (partially) annotated training set. By training a lexi-calization model, we can, for instance, learn that the term “for” is much more likelyto be followed by the word “each” in the context of a group by indicator (GBI) thanin the context of a time start event (TSE). Therefore, the HMM will assign a higherlikelihood to the possibility that “for each” indicates a group-by property than that it ispart of the description of a start event.
Probabilistic Annotation. Once the HMM has been trained, it can be used to assigntags to a previously unseen PPI description. To find the best tag sequence M, the op-timization problem denoted by Equation 6.1 considers the product of the probabilitiesfrom the semantic prior P(Θ) and lexicalization P(W | Θ) models. The combina-tion of these two models follows intuitively. The probability that a word sequence Wcorresponds to a certain semantic structure Θ depends on both the likelihood of this se-mantic structure occurring (P(Θ)) and the likelihood that W is associated with a certainsemantic meaning (P(W | Θ)). The task of finding the optimal sequence of labels Mis also referred to as decoding. The most common decoding algorithm for HMMs isthe viterbi algorithm, a dynamic programming algorithm [p.74] [135]. Because the al-gorithms only affect the computational efficiency of the optimization problem and notthe final outcome, we abstract from its details and refer the reader to [95] for a detailedexplanation. We previously showed the semantic annotation obtained for PPI2. For theremaining three PPI descriptions considered in Section 6.2, we obtain the followingsemantic annotations:
PPI1 : π1\M1 = number\CMI of accepted orders \CE

CHAPTER 6. TRANSFORMING AND ALIGNING PPIS 115
PPI4 : π4\M4 = the percentage\FMI of rejected orders \FNE
PPI6 : π6\M6 = the total\AGR order amount\CE per\GBI customer\GBC
We take these semantic annotations as input for the next step of our approach: thedomain value resolution step.
6.3.2 Domain Value ResolutionIn the second step of our approach, we obtain a PPI definition by filling the slots ofa PPI template with values from the appropriate domains. The semantic annotationsobtained in the previous step tell us which chunks of text correspond to which slots ina PPI template. For example, from the annotation of PPI2, we know that the chunkϕ6 : “completion of an order” corresponds to the end event slot in a template. We il-lustrate the full connection between semantic annotation and template on the left-handside of Table 6.6. However, this only presents an intermediate result of our approach.To be able to actually measure the value of this PPI definition, links have to be estab-lished to the events that occur during the execution of the process. For example, tocompute a value for PPI2 we need to determine that the chunk ϕ6 corresponds to the“order handling completed” process model event. Therefore, in this second step ofour approach, we fill the template slots with values from the appropriate domains, asdepicted in Table 6.6.
Table 6.6: Domain value resolution for PPI2
(a) Before resolution
Slot Value
Measure type timeAggregation “average”Start event “receipt”End event “completion of an or-
der”Group-by —
(b) After resolution
Slot Value
Measure type timeAggregation averageStart event Order receivedEnd event Order handling com-
pletedGroup-by —
To perform this domain value resolution for aggregation functions and group-byproperties, we consider the semantic similarity between a chunk ϕ and the respectivedomain values. For process concepts, we combine semantic similarity with constraints,which we impose based on the semantics of the various measure types. We next de-scribe these two aspects in detail.
Semantic Similarity
We use semantic similarity to determine for a given chunk ϕ ∈ π which value in itsassociated domain Dϕ has the most similar meaning. We consider semantic rather than(just) syntactic similarity for this task because it allows us to deal with semanticallyrelated terms, such as synonyms. For example, by considering semantic similarity, wecan learn that the chunk “transport an order” is most closely related to the “product

116 6.3. TRANSFORMATION APPROACH
shipping” activity. The computation of semantic similarity is achieved in a manner thatis largely equal to the one applied in the context of the alignment of process modelsto textual descriptions, as described in Section 3.2.2. More details on the employednormalization techniques and similarity measures are presented in Section 2.4.3.
Normalization. To determine the semantic similarity, we first apply a normaliza-tion step on a chunk ϕ and on the domain values Dϕ. We perform three tasks in thenormalization step. First, we split the textual contents of a chunk or a domain valueinto individual terms. Second, the function filters out stop words like “the”, “an”,and “from”, which do not contribute to the similarity computation. Finally, the nor-malization step lemmatizes the remaining terms by transformaring all remaining termsinto their grammatical base form. For instance “is” and “been” are both transformedinto “be”. To implement these steps we use the Stanford Parser and the associatedtoolkit [180]. As an illustration, the normalization step yields the following token setfor the chunk ϕ =“completion of an order”: ωϕ = {“completion”, “order”}.
Semantic computation. Given two token sets ωϕ and ωd, we quantify the semanticsimilarity using the similarity measure proposed by Mihalcea et al. [192], and describedin detail in Section 2.4.3. This measure combines the semantic similarity of individualterms with word specificity scores. Equation 6.2 formalizes the measure for a chunk ϕand a domain value d.
sim(ωϕ, ωd) =
∑t∈ωϕ
[maxt′∈ωd
simso(t, t′)] × id f (t)
2 ×∑
t∈ωϕid f (t)
+
∑t∈ωd
[maxt′∈ωϕ
simso(t, t′)] × id f (t)
2 ×∑
t∈ωd
id f (t)(6.2)
In this equation, simso(t, t′) captures the second-order similarity between two termst and t′ computed according to the approach by Kolb et al. [145].
The calculation of semantic similarity suffices for the aggregation function andgroup-by property slots, since the appropriate values for these slots solely depend onthe textual similarity between chunk and domain value. By contrast, for the filling ofprocess concept slots, we also have to consider constraints related to the semantics ofa measure type.
Constraints on event alignment
When filling the slots of a PPI template, it is important that the end result makes sensefrom a semantic perspective. For instance, the start event of a time measure shouldalways occur before its end event. Otherwise, the resulting metric will be semanticallyinvalid. For this reason, we impose certain constraints on the inter-relations of the pro-cess model elements assigned to process concept slots. To achieve this, we formulatethe slot-filling for event slots as an alignment problem. In the context of this work, analignment ∼ consists of a number of pair-wise correspondences, each between a taggedchunk from a PPI description ϕ ∈ πe and an element of a process model m ∈ M. We de-note such a correspondence as ϕ ∼ m. We impose constraints on an alignment relation

CHAPTER 6. TRANSFORMING AND ALIGNING PPIS 117
∼ through a constraint function Γ. In particular, we use Γ to impose three semantic con-straints. The first constraint applies to time measures, the other two relate to fractionmeasures. Because the constraints are applicable to the inter-relations that exist be-tween the correspondences assigned to different slots, we do not define constraints forcount measures, which only have a single slot to be filled through the correspondences.
Time measures. For time measures, we impose an ordering constraint on the eventsand activities associated with the start event and end event slots. From a semanticviewpoint, a PPI in which the start event occurs after the end event does not makesense. Therefore, we ensure that the model element mi aligned to the start event slot πi
occurs in the process model before the element m j associated with the end event slotπ j. We achieve this by considering the flow relation F that exists between the nodes ina process model. Given a time-measure alignment ∼= {πi ∼ mi, π j ∼ m j}, we imposethe constraint that there must be a path from mi to m j in the process model MD, basedon the flow relation F. Given the set of nodes N and two nodes x, y ∈ N, a path existsif there exists a sequence of nodes n1, . . . , nk ∈ N with x = n1 and y = nk such that forall i ∈ 1, . . . , k − 1 holds: (ni, ni+1) ∈ F [162, p.14]. In this way, the constraint capturesthat the aligned start element (mi) occurs before the end element (m j).
Non-trivial fractions. For fraction measures, we ensure that the obtained result is nota trivial measure, i.e., that the defined measure does not always yield 1.0. For thisreason, we ensure that the numerator slot πn and denominator slot πd are not alignedto the same model element. Therefore, given an alignment ∼= {πn ∼ mn, πd ∼ md}, itmust hold that mn , md.
Computable fractions. Lastly, we ensure that a fraction measure can actually be com-puted, instead of resulting in a divide-by-zero error. Therefore, we must ensure thatthe denominator slot is filled, even for those cases where a PPI description does not ex-plicitly mention a denominator. This can be seen for PPI4, which simply refers to “thepercentage of rejected orders,” without specifying a denominator. In these cases, wealign the slot πd by default to a process concept that represents a more coarse-granularversion of the process concept aligned to the numerator slot πn. There are two possibil-ities for such default numerators. If πn is aligned to a data object with a specific status,e.g., “order [updated]”, we align πd to the data object without the status specification,e.g., the “order” data object, if any. As such, we obtain a fraction measure that dividesthe number orders that have been updated by the total number of orders. For all otheralignments of πn, we align the denominator by default to the start event(s) of a process.In this way, the denominator corresponds to the total number of process instances. Forexample, PPI4 will then divide the number of rejected orders by the total number ofreceived orders.
We combine these constraints with semantic similarity scores. Therefore, we setout to obtain an alignment that has the highest possible sum of semantic similarityscores for the correspondences in ∼, as long as ∼ abides to the alignment constraints Γ.The alignments obtained in this way, in combination with the domain value resolution

118 6.4. EVALUATION
of the other slot types, provide the final result of our transformation approach: a filled-in PPI template.
6.3.3 Operationalization and ExtensibilityThe transformation approach described in this section can be regarded as an extensibleframework for the transformation of natural language PPI descriptions into measurableindicators. In this chapter, we have so far described an instantiation of this frame-work that covers the most common types of PPIs according to insights obtained frompractice [233, 235, 236]. This approach can thus be readily used for this set of PPIs.However, should users desire to extend the presented approach, for example, by incor-porating different measure types, this can be achieved in a straightforward manner.
An extension requires the specification of new (or adapted) PPI templates and a re-training of the HMM. By designing new PPI templates in accordance to a structured PPInotation, such as the PPINOT metamodel [233], it can be ensured that also the valuesof these newly covered measure types can be computed in an automated manner. Oncea new template has been defined, the HMM must be adapted to be able to generate PPIdefinitions in accordance to this template. To this end, tags must first be defined tocover newly introduced semantic concepts. As previously explained in Section 6.3.1,two tags must be defined for each new semantic concept: (i) a tag for the semanticconcept itself and (ii) a tag for an indicator of the concept. Once the adapted tag sethas been defined, several annotated PPI descriptions are required to retrain the HMMto incorporate the newly defined measure type.
The amount of new training data required depends on the (expected) variety of lin-guistic patterns that can be used to describe the measures. As the evaluation in the nextsection illustrates for fraction measures, sometimes only a handful of annotated PPIdescriptions suffices. Two approaches are possible to train the HMM. In case an avail-able training set DT is fully annotated, i.e., all PPI descriptions in the training set areannotated, the models P(Θ) and P(W | Θ) can be learned by simply counting [275]. Forinstance, we can learn the probability that a T EE tag follows a T MI tag by taking thenumber of descriptions in T that contains the subsequence < T MI,T EE > divided bythe total number of descriptions in T containing < T MI >. In caseDT is only partiallyannotated, estimation algorithms can be used to compute the probability distributions.The most commonly used are forward-backward algorithms, such as the Baum-Welchmethod (see e.g., [223]). Due to the ability of these methods to work with partiallyannotated data, it is possible to add large amounts of additional training data, withoutthe need to annotate them all.
Through similar adaptations, the approach can be extended in other ways. Forexample, new aggregation functions can be included or the HMM can be trained towork on specific application domains.
6.4 Evaluation
To demonstrate the capabilities of our transformation approach, we conducted a quan-titative evaluation by comparing automatically generated, structured PPI definitions to

CHAPTER 6. TRANSFORMING AND ALIGNING PPIS 119
Table 6.7: Overview of the test collection
Source P PPIs Count Time Data Frac. Aggr. Group-by
Industry 10 47 25 20 1 7 12 8SCOR 3 76 27 21 24 4 39 1
Total 13 129 52 41 25 11 51 9
a manually created gold standard. In this way, we assessed how well the automatedapproach approximates manual transformations of PPI descriptions. Therefore, it as-sesses the usefulness of our approach. To achieve this, we used a test collection con-sisting of 129 PPIs obtained from industry. Both the test collection and prototypicalimplementation used in this evaluation are publicly available.2
Section 6.4.1 provides detailed information on the used test collection. Section 6.4.2describes the way in which we conducted the evaluation. Lastly, Section 6.4.3 presentsand discusses the evaluation results.
6.4.1 Test Collection
To evaluate our approach, we use a collection of process models and accompanyingnatural language PPI descriptions from practice. Part of the test collection consistsof an industrial data set stemming from prior research on the formalization of PPIdefinitions and service level agreements [234, 235]. In particular, this set consists ofprocesses from three different organizations: (i) a healthcare institute, (ii) a university,and (iii) a telecommunications provider. This data collection was originally providedin Spanish, but translated to English in collaboration with the respective industrial part-ners. We augmented the industrial data set with a number of process models and PPIsfrom the Supply Chain Operations Reference (SCOR) reference framework. From thisframework, we selected processes with a high number of associated performance indi-cators per process and a considerable complexity of the associated process model. Theselected processes cover different aspects of the logistics domain: procurement, pro-duction, and delivery. The PPI descriptions obtained in this manner were not alteredwith respect to their contents. The set of descriptions varies greatly with regard to theirlanguage and structure.
We had to exclude nine PPI descriptions from the original data collection. ThesePPI descriptions could not be manually transformed into a structured notation basedon the contents of the available process models, i.e., their computation required infor-mation that is not conveyed in the model. The resulting test collection consists of 12process models with a total of 129 associated PPIs. Table 6.7 presents an overview ofthe further characteristics of the collection. This table shows the number of PPIs pertype, and the number of PPIs that are associated with an aggregation function (aggr.)or group-by property.
2Download from: www.hanvanderaa.com/downloads/ppi-transformation

120 6.4. EVALUATION
6.4.2 SetupTo conduct the evaluation, we implemented the presented transformation approach inthe form of a Java prototype. The prototype uses the Stanford CoreNLP toolkit [180]for the tokenization of PPI descriptions and the semantic similarity implementationDISCO [145] to calculate second order similarity scores. We use this prototype togenerate structured definitions for the PPI descriptions included in the test collection.
We compare the generated definitions to a manually created gold standard. For thecreation of this gold standard, we partially built on information directly provided bythe SCOR framework. This information included the alignment of the associated PPIsto process model elements. For the remaining alignments and PPIs, we used a similarprocedure for the establishment of a gold standard as used in Chapter 3. Specifically,we let two researchers independently establish a gold standard by manually transform-ing the PPI descriptions. The creation of the gold standard yielded an inter-annotatoragreement of 0.97. The five discrepancies between the two gold standards were re-solved through a discussion.
To perform the comparison between the generated definitions and the gold standard,we computed the same metrics as used in the evaluation of Chapter 3. In particular, wecomputed precision, recall, and the F1-score, as formalized by Equations 6.3, 6.4, and6.5.
pre =|A ∩ G|
|A|(6.3) rec =
|A ∩ G|
|G|(6.4) F1 =
2 ∗ pre ∗ recpre + rec
(6.5)
In these equations, A denotes the set of slots filled by our approach and G for theslots filled in the gold standard.3 In the context of this evaluation, precision reflectsthe fraction of slots that our automated approach filled correctly according to the goldstandard. Recall represents the fraction of slots filled in the gold standard that werealso correctly filled by our approach.
To compute the evaluation results, we train our approach on a part of the PPI collec-tion, referred to as the training set, and apply it on the remainder of the data collection,the test set. To avoid any bias in the result due to sampling, we perform a repeated k-fold cross-validation. In a k-fold cross-validation, a data setD is randomly split into kmutually exclusive subsets (i.e., folds), D1, . . . ,Dk of approximately equal size [144].In each experiment run, our approach is then tested k times. Each time t ∈ {1, 2, . . . , k}we trained the HMM on D \ Dt and tested it on Dt. By repeating the cross-validationwith different random splits of the data set, we can learn how much the results areaffected by a particular partitioning of the data collection.
6.4.3 ResultsIn this section, we present the results of our evaluation experiments. We first providean overview of the quantitative results and, afterwards, discuss the challenges that our
3Note that we exclude null values assigned to the optional aggregation function and group-by propertyslots from consideration.

CHAPTER 6. TRANSFORMING AND ALIGNING PPIS 121
approach faces in the context of a post-hoc analysis.
Overview
We used our prototype to conduct a k-fold cross validation with k = 10, which werepeated 30 times. We performed this cross validation for the industry and SCOR datacollections separately, as well as for the combined collection. Table 6.8 summarizesthese results for our approach and the baseline. It shows that our transformation ap-proach performs well, obtaining an average F1-score of 0.85. The approach achievesan average precision of 0.89, ranging between 0.78 for group-by properties and 0.93for aggregation functions. The average recall obtained by the approach is 0.82, rang-ing from 0.72 for the alignment of process concepts and 0.96 for the identification ofaggregation functions. From the low observed standard deviations (0.01 for the entireset of slots), we can learn that the performance of the approach is stable in the contextof this data set. Furthermore, we observe that the alignment of process concepts differsconsiderably between the two data collections. For the other slot types, the average per-formance is comparable. Lastly, it is interesting to consider that our approach achieveda fully correct transformation for 67% of the PPIs in the data collection. Furthermore,the transformation approach returns at most one incorrect slot filler for a total of 86%of the PPIs.
Table 6.8: Evaluation results
Data source Slot type Prec. Rec. F1
Measure type 0.90 0.90 0.90Process concepts 0.67 0.63 0.65
Industry Aggregators 0.92 1.00 0.97Group-by 0.74 0.74 0.74
Total 0.78 0.76 0.77
Measure type 0.94 0.94 0.94Process concepts 1.00 0.80 0.89
SCOR Aggregators 1.00 1.00 1.00Group-by – – –
Total 0.98 0.88 0.93
Measure type 0.92 0.92 0.92Process concepts 0.87 0.72 0.79
Full collection Aggregators 0.93 0.96 0.94Group-by 0.78 0.78 0.78
Total 0.89 0.82 0.85

122 6.4. EVALUATION
Post-hoc Analysis
The quantitative evaluation shows that our transformation approach achieves a highresult accuracy. A post-hoc analysis of these results reveals that the approach faces twomain types of challenges. One challenge corresponds to the semantic annotation stepand the other to the domain value resolution step of our approach.
The usage of HMMs for semantic annotation enables our approach to deal with abroad variety of linguistic patterns, even if a PPI description contains previously unseenterms or syntactic constructs. However, the parser can produce incorrect annotationsif unseen terms play a prominent role in a PPI description. For instance, the collec-tion of PPI descriptions from the SCOR framework contains a single PPI descriptionthat uses the term “leadtime” in a time measure. Because this is a unique occurrencein the used data collection, the HMM parser does not recognize this important logisticterm. Therefore, it incorrectly annotates this PPI description as a count measure, whichresults in an incorrect measure type prediction. Furthermore, due to the semantic dif-ference between count and time measures, it also results in an incorrect alignment ofprocess concepts. A count measure refers to only a single process event, whereas atime measure requires both a start and an end event. Therefore, the misclassificationwill also lead to at least one event not being correctly aligned. Still, such cases are rareand their occurrences can be mitigated by extending the data collection used to trainthe HMM.
The domain value resolution step of our approach has to deal with the highly com-plex task of identifying the event that a chunk of text describes. The main challengehere is that certain correspondences depend on context-specific information for theiridentification. As an illustration, consider a PPI description from the industrial collec-tion: “the elapsed time between the technician arrival to headquarters and the closureof the intervention”. The start event of this description corresponds to the chunk “thetechnician arrival to headquarters”, as correctly identified in the parsing step. How-ever, identifying the correct process concept for this chunk is far from trivial. Theprocess model accompanying this PPI does not contain any activity or event that de-scribes an “arrival” or “headquarters”. Instead, the event corresponds to the start of anactivity labeled “Perform field intervention”. To identify this correspondence correctly,background knowledge is required to establish the connection between the “arrival ofa technician” and the start of a “field intervention”. Our automated approach does nottake such domain knowledge into account and, in some cases, identifies incorrect align-ments between the PPI description and a process model. From the results described inTable 6.8, it becomes clear that such cases are mostly present in the industrial datacollection.
Despite these challenges, the evaluation results demonstrate that the PPI definitionsgenerated by our automated approach closely approximate PPI definitions manuallycreated by experts. Therefore, we can conclude that our automated approach presentsan efficient alternative for an otherwise highly tedious, manual task.

CHAPTER 6. TRANSFORMING AND ALIGNING PPIS 123
6.5 Limitations
The quantitative evaluation demonstrates that our approach achieves promising resultsin practical settings. However, these results need to be considered against the back-ground of certain limitations. In particular, we identify limitations related to the ap-proach itself and limitations related to its evaluation.
We identify two main limitations regarding the transformation approach First, itprovides an automated alternative to a highly complex task. As a result, the PPI def-initions that the approach generates are accurate, but not one hundred percent perfect.If desired, inaccuracies can be manually resolved by experts. This arguably requiresless manual effort than it takes to manually define all PPIs from scratch. As such, ourtransformation approach allows users to trade-off between invested time and effort ver-sus results quality. Second, it has to be considered that our transformation currently isnot able to detect when it is dealing with a PPI description that cannot be transformedbased on the available information. Such a situation can occur if the PPI describes ameasure type that is currently not included in the set of templates or if the PPI descrip-tion requires information that is not captured in a process model. The latter case wasobserved for the nine PPI descriptions that we had to exclude in the evaluation.
The presented quantitative evaluation results are bound to the specifics of the em-ployed data collection. For instance, the included templates do not cover all imaginablePPIs, but rather the ones most observed in our empirical studies. As stated earlier, theimpact of this limitation is diminished by the extensibility of our approach. Second,within each measure type, the data collection presents a sample of the natural languagepatterns that can be used to specify measures of this type. It is possible that in otherorganizations measures are described in different ways. These factors should be takeninto account when interpreting the specified results. Still, we aimed to compose a datacollection that is as heterogeneous as possible by obtaining data from various sources.Therefore, we are confident that our evaluation indeed shows a realistic picture of theperformance of our approach in practice.
6.6 Related Work
The work presented in this chapter particularly relates to two main streams of research:(i) structured and measurable notations of PPIs and (ii) information extraction fromnatural language.
Performance measurement is an active research field in management science, whichhas gained interest in both academia and business [218]. Much work has been per-formed on the identification and classification of Key Performance Indicators in gen-eral settings [137] and those relevant for specific domains such as logistics, production,and supply chains (cf. [52, 61, 150, 265]). Within the context of Process PerformanceMeasurement, great effort has been put on the formalization of PPI definitions. This hasresulted in a number of notations and frameworks for the description and monitoringof PPIs [67, 112, 147, 198, 208, 218, 235, 243, 286]. The main differences among themare found in their expressiveness, i.e. the different types of PPIs that can be defined,and their features to directly support monitoring. Although the templates used in our

124 6.7. SUMMARY
approach are inspired by the PPINOT metamodel, our approach is generally applicable.Specifically, the components of the templates can also be mapped to concepts in otherframeworks, such as [198, 286].
As shown in Section 6.3, we approached the task of transforming natural languagePPI descriptions as a so-called template-filling problem. Template filling, which is alsoreferred to as slot filling [262] or semantic-based understanding [274], has been exten-sively studied and applied in a variety of contexts. A major application area for thesetechniques is spoken language understanding, where information is extracted from un-structured natural language text in the context of a dialog system [114]. The viterbialgorithm, which we employed for the extraction of information from the descriptions,also been applied in a broad variety of application scenarios. These include machinetranslation [54], part-of-speech tagging [154], and spoken language processing [197].To achieve this, many approaches employ probabilistic models, such as (variations on)HMMs [196, 275].
6.7 SummaryThis chapter presented an approach for the automated transformation and alignmentof natural language PPI descriptions. Our approach takes as input an unstructuredPPI description and produces a structured, template-based notation of a PPI. Becauseour template-based notation builds on the PPINOT metamodel, the values of the ob-tained PPI definition can be computed automatically. This makes the PPIs suitable forautomated process performance monitoring. To achieve this, the approach builds onHMMs as linguistic parsers to identify the parts of a PPI description that correspond toslots in a PPI template. Then, we use semantic similarity measures and semantic con-straints to fill the slots with the appropriate values belonging to particular domains. Weevaluated the performance of our approach with a set of 129 real-world PPI descrip-tions and accompanying process models obtained from various industrial sources. Theevaluation revealed that the structured PPI definitions generated by our approach are agood approximation of those created manually by experts. In particular, the approachachieves precision and recall values of, respectively, 0.89 and 0.82. Therefore, our ap-proach represents a viable, automated alternative to an otherwise highly laborious andtime-intensive, manual task. This enables organizations to more efficiently monitorthe performance of their business processes and continuously adapt their monitoringactivities to changing business needs.

7Process Model Matching using Event-Log
Information
Alignments between processes provide an important basis for a variety of applicationscenarios and techniques. These alignments are, among others, used for the detection ofdifferences between models [156], the harmonization of process model variants [157],process querying [131], and the propagation of process changes [280]. The accuracyand, therefore, usefulness of such techniques is highly dependent on the correctnessand completeness of the alignments that are established by process model matchingtechniques. However, despite the existence of a plethora of matching techniques, it hasbeen shown that their results leave room for improvement [58]. A possible cause forthis is that existing process model matching techniques focus exclusively on informa-tion related to the specification of processes, typically by just considering the infor-mation contained in process models themselves. Therefore, they ignore informationthat relates to the actual execution of the processes, as captured in event logs. Theselogs provide valuable information on data attributes, event durations, and other aspectsspecifically associated with the enactment of a process.
In this chapter, we present techniques that exploit event-log information for pro-cess model matching. Section 7.1 illustrates the usefulness of event-log informationin a matching context. Then, Section 7.2 presents six event log-based process modelmatching techniques. The quantitative evaluation in Section 7.3 considers the perfor-mance of the individual matching techniques, as well as their performance in the formof a matching ensemble. We discuss limitations of our matching techniques and theevaluation in Section 7.4. Afterwards, we consider related work in Section 7.5 andsummarize the chapter in Section 7.6.
7.1 Problem Illustration
To illustrate the usefulness of event-log information for process model matching, con-sider two process models, M1 and M2, which depict two (simplified) processes to han-
125

126 7.1. PROBLEM ILLUSTRATION
dle loan applications. Also, consider their respective sets of activities A1 and A2. Fig-ure 7.1 illustrates these models, with M1 at the top and M2 at the bottom. The figurealso highlights their correspondences, i.e., the activities that represent similar behavior.
Bank
1Ba
nk 2
Start
Receive loan application
Assess loan application
Perform advanced
check
Send decision letter
Applicationhandled
Start
Receive application
formEvaluate
credit score
Decide on high-value
loanInform
applicantApplication
handledDecide on low-value
loan
Check document
completeness
- caseID: 1293- docsComplete: true- creditScore: good
Event1
- caseID: 23048- docsComplete: true
Event3
- caseID: 23048- creditScore: low
Event4
- caseID: 1293- amount: €200.000- decision: accepted
Event2
- caseID: 23048- amount: €10.000- decision: denied
Event6
- caseID: 47001- amount: €210.000- decision: accepted
Event5
Figure 7.1: Two process models and their correspondences
In process model matching, we wish to automatically identify these correspon-dences between A1 and A2. By analyzing the labels of activities, some correspondencescan be identified in a straightforward manner, such as the correspondence between “re-ceive loan application” and “receive application form”. However, the label-based iden-tification of other correspondences is not as straightforward, if at all possible. Considerthe “assess loan application” activity in M1 and the activities “check document com-pleteness” and “evaluate credit score” from M2. For their correspondences, there is noobvious syntactic or semantic relation between the contents of their labels. This makesit difficult to recognize their similarity based on textual analysis. However, the eventsassociated with these activities do provide valuable information about their similarity.Event1 in M1 includes attributes that describe the completeness of the filed documentsand the credit score. The events Event3 and Event4 in M2 are each also associated withone of these attributes. This similarity between event attributes provides a strong indi-cation of an existing relation between the activities, which could not be derived withoutconsidering information beyond the contents of the process model.
In other cases, the names of attributes associated with events are useful but, bythemselves, do not suffice to distinguish among potential correspondences. For exam-ple, the “decide on low-value loan” (ai) and “decide on high-value loan” (a j) activitiesfrom model M2 both have events that contain an amount attribute. Therefore, the at-tribute names are not sufficient to determine which of these corresponds to the “performadvanced check” activity (ak) in M1. However, by analyzing the values associated withthese attributes throughout an event log, this could be achieved. For instance, if events

CHAPTER 7. MATCHING USING EVENT-LOG INFORMATION 127
corresponding to a j and ak are always associated with amounts above €200.000, whileai always has a lower amount, the correspondence between a j and ak can be asserted.
In the next section, we describe how matching approaches take these and othernotions of similarity between events into account.
7.2 Event Log-Based Matching
This section describes how information contained in event logs can be utilized for pro-cess model matching. In particular, we introduce six conceptual notions of similaritythat each characterize a different aspect of similarity derivable from event-log infor-mation. Together, these notions provide a complete coverage of the prominent typesof information contained in event logs: ordering, frequencies, timestamps, and dataattributes. We consider one similarity notion for each of the first three types. Due tothe versatility of the data perspective in event logs, we consider three different sim-ilarity notions related to the data attributes associated with events. To illustrate theoperationalization of these similarity notions, we introduce a corresponding similaritymeasure for each of them. These measures can be used as FLMs, where the simi-larity scores obtained by the measures are used to populate a similarity matrix. Eachmeasure produces a value in the range [0, 1], where a 1.0 score indicates perfect sim-ilarity between two event classes according to the particular similarity notion. Themeasures that we introduce can be applied without imposing any assumptions on thedata. Furthermore, we also reflect on alternative measures that typically depend oncertain assumptions or are computationally more complex.
The input for the matching techniques presented in this section are two processmodels and two corresponding event logs, i.e., two model-log pairs (M1, L1) and (M2,L2). We assume here that, given a process model M with activity set A and a corre-sponding event log L with the set of event classes E(L), each activity a ∈ A correspondsto exactly one event class E ∈ E(L) and vice versa. Therefore, without loss of gener-ality, we here refer to activities and event classes interchangeably. This means that wecan, for example, refer to the similarity between the events of the event classes “Assesloan application” and “Check document completeness” from the running example.
Finally, it is important to note that the introduced matching techniques do not de-pend on the availability of process models. The matchers can also be used for scenariosin which the goal is to directly establish alignments between the event classes from dif-ferent event logs. However, for clarity, we focus on process model matching in theremainder of this chapter, since this use case is more generally recognized.
7.2.1 Positional SimilarityPositional similarity focuses on the order in which events occur. The underlying idea ofpositional similarity is that if two event classes occur at similar stages in the executionof a process they are more likely to be similar. For example, the final activity in M1,“Send decision letter”, is more likely to be similar to “Inform applicant”, which occursat the end of M2, than to “Receive application form”, which occurs at the start of thatprocess.

128 7.2. EVENT LOG-BASED MATCHING
Similarity measure. We define a relative position measure RP that quantifies theaverage position at which events of a certain event class occur in traces. To account forvarying trace sizes, we consider the position of an event relative to the length of a trace.Specifically, we use RPe to denote the relative position of an event e in a trace, givenas j|σ|−1 . Here we use |σ| to denote the length of a trace and j denotes the index of e in
the trace, where j ∈ [0, n]. This gives us, for example, for σ = 〈a, b, c〉, RPa = 0/2,RPb = 1/2 and RPc = 2/2. Equation 7.1 provides the RP measure, in which we useRPE to denote the average RPe over all events e ∈ E with event class E.
RP(E1, E2) = 1 − |RPE1 − RPE2 | (7.1)
Alternatives. Comparing the position of events in traces provides a basic measurefor structural or behavioral similarity. Techniques for process model matching existthat use more advanced similarity measures, for example those based on behavioralrelations [81]. Such measures can also be adapted to work on graph structures orbehavioral relations derived from event-log information. Such derivation is done bytechniques that automatically derive process models from event logs, i.e., so-calledprocess discovery techniques [19].
7.2.2 Occurrence SimilarityThe frequency with which events of a certain event class occur can provide useful infor-mation regarding its similarity to other event classes. For example, if two event classesE1 and E2 each occur only rarely in an event log, then E1 and E2 both correspond tosome exceptional action, hinting at their potential similarity. In the running example,for instance, it can be expected that the majority of loan requests will be for compara-bly low amounts. This means that occurrences of the “Perform advanced check” and“Decide on high-value loan” events are relatively rare. Therefore, by comparing thefrequencies with which these activities occur, the similarity between the activities canbe identified. Furthermore, the consideration of frequencies can also be used to iden-tify similarity between event classes that only occur once per trace and those that occurmultiple times (i.e., rework activities).
Similarity measure. We define a measure FREQ which compares the average numberof occurrences of event classes per trace. We let FREQE denote this average for anevent class E, and use Equation 7.2 to formalize FREQ. Because it is possible thatFREQE > 1, this measure is normalized to ensure a confidence score in [0, 1].
FREQ(E1, E2) = 1 − ||FREQE1 − FREQE2 |
max(FREQE1 , FREQE2 )| (7.2)
Alternatives. An alternative way to evaluate occurrence similarity is to consider thefraction of traces in which an event class occurs, rather than the average number ofoccurrences per trace. To illustrate the difference to the FREQ metric, consider anevent class E3 that occurs in only 50% of the traces, but in those traces it occurs twice.

CHAPTER 7. MATCHING USING EVENT-LOG INFORMATION 129
In this case, FREQE3 equals 1.0 (0.5 · 2), which would be the same for an event classE4 that occurs once in every trace. Nevertheless, it is clear that the occurrences ofE3 and E4 are very different. Furthermore, it is possible to use statistical tests for thecomparison of frequencies, rather than compare averages. We reflect on these tests inthe following.
7.2.3 Duration SimilarityThe time it takes to execute activities can serve as an indicator that provides useful hintsregarding their similarity. In our running example, it can be expected that activitiesthat check loans with high amounts are extensive and, therefore, consume a significantamount of time. By contrast, the communication of the decision to the applicant canvery well be automated, resulting in negligible activity durations. This means that, byconsidering the durations of activities, we can learn that the “Perform advanced check”activity is more similar to “Decide on high-value loan” than to “Inform applicant.”
Similarity measure. A straightforward similarity measure for durations can be ob-tained by comparing the average durations of an event class in a log. The duration of asingle event can be determined in two ways. In an ideal scenario, events are associatedwith transaction types (through the #trans(e) attribute) that indicate whether an eventdenotes the start or end of an activity. In these cases, durations are determined by com-puting the difference between the timestamp of an event with the transaction type startand a corresponding event with the transaction type complete. If such transaction typesare not available, an approximation can be obtained by taking the difference betweenthe timestamp of an event and the timestamp of its preceeding event in the trace. Then,using DURE to denote the average duration of events of class E, Equation 7.3 providesa normalized measure that returns a score in [0, 1].
DUR(E1, E2) = 1 − ||DURE1 − DURE2 |
max(DURE1 ,DURE2 )| (7.3)
Alternatives. Durations can vary significantly among occurrences of the same eventclass. Therefore, an alternative is to use statistical tests, e.g., the t-test or Kolmogorov-Smirnov test [227] to compare the statistical distribution of the durations for two eventclasses. By performing such tests, we do not only consider the averages of event du-rations, but also their variability. An important downside of such tests is that certainconditions have to be met in order to be able to apply them. For example, a t-testrequires data to be normally distributed. Another consideration to take into accountis the cost of computing the similarity. For instance, the Kolmogorov-Smirnov testis computationally intensive, which can negatively affect its applicability to matchingproblems.
7.2.4 Attribute name similarityThe names of attributes provide insights into the data values used or created by events.These attribute names can be useful similarity indicators to identify correspondences.

130 7.2. EVENT LOG-BASED MATCHING
Their importance is demonstrated in the motivational scenario, where event classesthat produce the same attributes (e.g., the docsComplete attribute) are recognized tobe similar to each other.
Similarity measure. We define an attribute name similarity measure ATTR, whichdetermines the level of overlap in attribute names among the attribute sets associatedwith two event classes. To quantify this overlap, we employ the well-known cosinesimilarity measure from the field of information retrieval [244]. The cosine similaritycan be used to compute the similarity between two vectors. In the case of the ATTRmeasure, these vectors represent the attributes associated with events of a certain class.
To illustrate this vectorization, consider the attributes associated with the “Assessloan application” (E) and “Check document completeness” (E′) event classes from therunning example. Using a 2D vector to represent the docComplete and creditScoreattributes, we obtain the following vectors: ATTRE = (1, 1) and ATTRE′ = (1, 0).Furthermore, we can add weights to these vectors by considering the commonality ofattribute names in the context of the context. We achieve this by computing the IDFscores, introduced in Chapter 2, for each attribute name. Given two vectors ATTRE1
and ATTRE2 , the cosine similarity between them is computed by Equation 7.4.
ATTR(E1, E2) =ATTRE1 · ATTRE2
‖ ATTRE1 ‖‖ ATTRE2 ‖(7.4)
Alternatives. The ATTR measure only considers overlap in attributes with identicalnames. However, syntactic and semantic similarity measures can also be used to quan-tify the similarity between non-identical attribute names [102]. Section 2.4.3 presentsan overview of such measures. Syntactic similarity measures, such as the Levenshteindistance [291], can be used to recognize that “name” and “lastName” describe simi-lar attributes. Semantic similarity measures, such as WordNet-based similarity [56],can be used to recognize attribute names with similar meanings, such as “amount” and“value”.
7.2.5 Attribute Value Similarity
The values of an attribute, associated with events of a given event class may provideinsights into similarity beyond attribute name similarity. We can identify two generalscenarios for this. First, an analysis of attribute values can be useful to determinesimilarity in the context of opaque or unrelated attribute names. For instance, it isdifficult to relate two attributes month and m based on their labels. By contrast, ifboth attributes are associated with numeric values in the range 1–12 (or even monthnames), their similarity becomes more apparent. Second, attribute value similarity canbe used to disambiguate event classes that use the same attributes. The motivationalscenario provides an example of this. The event classes “decide on high-value loan”and “decide on low-value loan” in M2 both consider an amount attribute. Events ofthe former class are associated with a higher range of values than events of the latter.Therefore, by considering the attribute values, we can identify that the former event

CHAPTER 7. MATCHING USING EVENT-LOG INFORMATION 131
class is more likely to correspond to “perform advanced check” in M1, which similarlyoccurs only for loan requests with a high amount.
Similarity measure. To quantify attribute value similarity for two individual attributes,we rely on techniques from the research area of schema matching [89] where content-based matching, (direct comparison of sets of attribute values) is combined with con-straint-based matching. The latter aims to extract constraints from a set of values,such as upper and lower bounds for numerical values. For brevity, we refrain frompresenting explicitly the equations used in this method. After considering the similarityof individual attributes, the similarity values obtained in this manner can be used asweights to calculate the cosine similarity between two attribute sets. Using VALE torefer to the value sets of the attributes of an event class E, we compute the VAL measureas given by Equation 7.5.
VAL(E1, E2) =VALE1 · VALE2
‖ VALE1 ‖ ‖ VALE2 ‖(7.5)
Alternatives. Various alternative techniques exist to determine the similarity betweentwo individual attributes, including identifying and comparing data types such as zipcodes or geographical names, putting constraints on values, and identifying data pat-terns and distributions. The interested reader is referred to [224] for an overview ofsuch techniques applied in a schema matching context.
7.2.6 Prerequisites SimilarityThe input data used by an event can be an important indicator of event class similarity.Intuitively, this builds on the idea that the more similar the data that is used by eventclasses, the more similar their purpose. For example, in the motivational scenario,events of the classes “send decision letter” in M1 and “inform applicant” in M2 are theonly ones to occur after an event has produced a value for the decision attribute.
A challenge here is that event logs typically do not have an explicit notion of inputdata. For instance, the the seminal definition by Van der Aalst [13] employed in thisthesis (See Section 2.2.2) assigns attributes to events, but does not enforce a distinctionbetween input and output attributes. Given this limitation, an event log can containinformation on the input data in two general ways. First, input data elements of anevent e might be part of the attribute set of e, as seen for the amount attribute of the“perform advanced check” event. In this case, similarity of inputs is already coveredby the aforementioned attribute name and value similarity measures ATTR and VAL.However, input data can also be derived from data attributes that were created prior tothe execution of an event, which we operationalize next.
Similarity measure. We define a measure PREQ that determines the similarity ofprerequisites based on the attributes associated with prior events. Specifically, givenan event ei that occurs at position i in a trace t, we define PREQei as the union ofall attribute sets Ae j for 0 < j < i. PREQE then denotes all attributes contained ina set PREQe for all events e ∈ E with event class E. The similarity between two

132 7.3. EVALUATION
prerequisites sets PREQE1 and PREQE2 is then computed in a similar manner as theATTR measure.
PREQ(E1, E2) =PREQE1 · PREQE2
‖ PREQE1 ‖ ‖ PREQE2 ‖(7.6)
Alternatives. It is possible to consider the values of prerequisite attributes, ratherthan their names, as provided by the VAL measure, or by combining the two. Further-more, alternative measures can consider two more factors in the similarity computation,namely frequency and proximity of prerequisite attributes. The frequency with whichan attribute is created prior to the execution of an event e ∈ E can be used to distinguishamong mandatory and optional prerequisites. In the context of process matching, sucha distinction was proposed by Sagi et al. [242]. The proximity between the creationof an attribute and an occurrence of an event can provide insights into their similarity.Intuitively, if an attribute is created by an event at index i in a trace, then this attribute ismore likely to be a relevant prerequisite to its immediate sequel event ei+1 than it is toevents that are further away. Frequency and proximity considerations can be integratedby adapting the weights of the elements of the vectors used by PREQ accordingly.
7.2.7 OperationalizationThe proposed similarity measures can be used as FLMs that quantify the similaritybetween the activities of two process models. In order to use them for a full-fledgedmatching task, the FLMs should be followed by second-line matching. In the eval-uation presented in Section 7.3, we illustrate this by combining the similarity scoresof all six FLMs using an ensemble matcher. Afterwards, we identify the most likelycorrespondence for each activity, by employing a decision maker to select the bestcombination of correspondences.
It is here important to stress that the proposed FLMs are intended to be complemen-tary to traditional process model matching techniques, rather than to replace them. Forinstance, by using ensemble matchers, our event log-based matchers can be combinedwith matchers that consider the activity labels of the process models. In this manner,matching approaches can provide a full coverage of available process information inorder to achieve high-quality matching results.
7.3 EvaluationThis section presents an empirical evaluation that demonstrates the usefulness of event-log information for process model matching. We evaluate the performance of the pro-posed log-based matchers as a standalone tool. Specifically, we compare the corre-spondences obtained by automatic matching based on our FLMs to a gold standardthat contains the true correspondences between event classes. Our evaluation is basedon real-world data, using a test collection of 105 event-log pairs. Section 7.3.1 providesfurther details on this test collection. Afterwards, Section 7.3.2 describes the way inwhich we conducted the evaluation. Finally, Section 7.3.3 presents and discusses theevaluation results.

CHAPTER 7. MATCHING USING EVENT-LOG INFORMATION 133
7.3.1 Test Collection
To perform the evaluation, we use data from the BPI Challenge 2015 [83], which con-sists of real-world event data related to the handling of construction permit applicationsby five Dutch municipalities. The event data describe similar processes, while their ac-tual implementation differs considerably. To obtain a sufficiently large collection ofevent logs to match, we split the event data into event logs, each relating to a differentsubprocess (on average 17 subprocesses per municipality). We omit the event logs thatcontain less than five event classes in order to avoid trivial matching tasks. After thisstep, we have a total of 57 event logs. We create pairs of event logs that relate to thesame subprocess from different municipalities. This results in a total of 105 event logpairs.
Table 7.1: Characteristics of the test collection
Measure Traces Event classes Total corr. True corr. Log Overlap
Average 487.0 33.0 2,533.4 30.9 87.7%Std.dev. 353.6 40.7 6,246.3 36.5 10.5%Minimum 8 5 15 3 50.0%Maximum 1409 172 26,832 156 100.0%
Table 7.1 provides an overview of the test collection. The table illustrates the greatdiversity between the subprocesses. This can, for example, be seen in the number ofevent classes per log, which ranges from 5 to 172. The column with true correspon-dences (True corr.) reflects the number of actual correspondences that exist between theevent classes in a log pair. These true correspondences represent the gold standard forthis evaluation. This gold standard could be directly established because correspond-ing event classes are associated with the same identifiers (i.e., action code) acrossthe event logs of the different municipalities. The last column in the table describes theoverlap in terms of the event classes of a log pair, i.e., the fraction of event classes thatappear in both logs. This measure indicates that, on average, 88% of the event classes ina log also appear in the gold standard. In the most extreme case, only 50% of the eventclasses from a log pair correspond to each other. Table 7.1 highlights the fact that eventhough the processes are similar across the five municipalities, considerable differencesexist as well. The choice for this data collection is, furthermore, motivated by the lackof event logs associated with the collections typically used to evaluate matchers, i.e.,the collections of the Process Model Matching Contests [32, 58].
Note that in order to provide objective evaluation results, we obscure all referencesto the names of event classes in this test collection. In particular, we hide the names andvalues of the following attributes: concept:name, action code, activityNameEN,and activityNameNL.

134 7.3. EVALUATION
7.3.2 Setup
To conduct the evaluation, we used the Ontobuilder Research Environment (ORE), anopen source schema matching tool that enables researchers to run and evaluate match-ing experiments. We implemented the six FLMs in ORE and made their implementa-tion publicly available as part of the tool.1
As described at the end of Section 7.2, establishing (exact) correspondences be-tween the event class sets E(L1),E(L2) of a log pair requires a similarity matrixM(E(L1),E(L2)) and a decision maker. Here, we obtain the similarity matrices in two differentmanners, resulting in a two-part evaluation. In the first part, we use each of the sixFLMs separately to constructM(E(L1), E(L2)) based on a distinct similarity measure.This part of the evaluation provides insights into the performance of the individualFLMs and into the characteristics of the test collection. In the second part, we use anensemble matcher that combines the scores of the six similarity matrices into a singlematrix. By evaluating this matching ensemble, we obtain insights into the combinedperformance of the matchers and their complementary nature. We further reflect on theway in which the measures complement each other by computing correlations amongthe individual similarity scores.
After obtaining a similarity matrixM(E(L1), E(L2)) we apply a decision maker onthe matrixM(E(L1), E(L2)) to obtain a set of exact correspondences, to which we willrefer to as C(E(L1), E(L2)) . In particular, we apply the Maximum Weighted Bipartite-graph Match (MWBM) [105] to establish M(E(L1), E(L2)) . This decision maker isparticularly well-suited in the context of the test collection, because it establishes 1:1correspondences between event classes.
As in previous chapters, we again use the precision, recall, and F1 measures tocompare the automatically obtained set of correspondences C to the set G of actualcorrespondences included in the gold standard, as formalized by Equations 7.7, 7.8,and 7.9. Precision here reflects the fraction of the correspondences obtained by thematching techniques that is also included in the gold standard, whereas recall representsthe fraction of the correspondences in the gold standard that is correctly identified bythe matchers.
pre =C ∩ G
C(7.7) rec =
C ∩ G
G(7.8) F1 =
2 ∗ pre ∗ recpre + rec
(7.9)
Next, we presents the results of our quantitative evaluation.
7.3.3 Results
Table 7.2 presents an overview of the results obtained by using the individual FLMsand by using a matching ensemble based on all six FLMs. We will now elaborate onthe results obtained through these two methods.
1 https://bitbucket.org/tomers77/ontobuilder-research-environment

CHAPTER 7. MATCHING USING EVENT-LOG INFORMATION 135
Table 7.2: Evaluation results
FLM Precision Recall F1-score
RP 0.24 0.25 0.25FREQ 0.14 0.14 0.14DUR 0.13 0.11 0.12ATTR 0.05 0.04 0.04VAL 0.27 0.27 0.27PREQ 0.09 0.08 0.08
Ensemble 0.38 0.38 0.38
Matching results
The results presented in Table 7.2 show that the performance varies greatly across thevarious FLMs. The lowest performance results belong to ATTR and PREQ FLMs,which both consider similarity based on attribute names. These FLMs achieve F1-scores of 0.04 and 0.08, respectively. A post-hoc analysis of the similarity matricesgenerated by these FLMs shows that, indeed, attribute names provide little discrimina-tory power in the context of this particular test collection. In fact, most event classes areassociated with identical or nearly identical sets of attributes, which results in a simi-larity score of 1.00 for the vast majority of event class pairs. By contrast, VAL achievesthe highest results with an F1-score of 0.27. This shows that attribute values provide asubstantially better indicator of similarity than attribute names. Furthermore, the per-formance of RP shows that the consideration of positional similarity also provides arelatively good indicator of similarity.
The last row of Table 7.2 presents the results obtained by an ensemble consistingof the six FLMs. For this ensemble, we applied a naıve weighting scheme, in whichwe computed the average score of the six similarity measures. The results demonstratethat the ensemble greatly outperforms individual FLMs, achieving an F1-score of .38.A one-sided paired t-test reveals that this result is statistically significant (p < 0.05)when compared to the best performing individual FLM (VAL). The improved resultsof the ensemble illustrate that the six FLMs are complementary to each other and canenhance each other’s performance.
Top-k results
The results shown so far indicate that the use of log data for process matching is avalid approach that can identify correspondences among activities by analyzing execu-tion data. It is also clear that the use of log data alone does not suffice to establish astate-of-the-art matching tool. An F1-score of about 0.4 indicates a far from randomcorrelation between the decisions made by the ensemble and the true correspondences.Still, it requires the support of other techniques to strengthen its performance. Existingprocess model-based matchers represent good candidates, because they use valuableprocess model information (e.g.,, activity labels), which is purposefully not used by

136 7.3. EVALUATION
0
0.1
0.2
0.3
0.4
0.5
0.6
0.7
0.8
0.9
1
ATTR PREQ DUR FREQ RP VAL Ensemble
Rec
all
Matcher
top-1
top-3
top-5
Figure 7.2: Recall scores for top-k results
our log-based matchers. Because numerous model-based matchers exist, each withtheir own strengths and weaknesses, we leave for future research the best way to tacklethe combination of log-based and model-based matching techniques. Here, we inves-tigate the obtained results in more depth and determine to what extent the log-basedtechniques lend themselves well to process matching.
Identified correspondences can be incorrect because often an event class has mul-tiple correspondences with equal or near-equal similarity scores as the best candidates.The selection of a single, best correspondence then becomes an arbitrary selectionamong a handful of correspondences. This problem relates to the inherent issue ofuncertainty in the matching task. Works on matching monotonicity [101] have foundthat this uncertainty prevents matchers from identifying a correct correspondence asthe one with the highest similarity measure. However, these works argue that goodmatchers should contain the correct correspondences among the correspondences withthe highest similarity scores, i.e. in the so-called top-k matches. If they succeed in this,a good matcher positions a true correspondence high enough for a human observer toconfirm it after scanning only a few possible correspondences. To test this, we checkfor each event class whether its correct correspondence occurs within the top 3 or top5 correspondences with the highest similarity scores.
Figure 7.2 presents results of the top-k analysis. For each matcher, we measurethe recall of top-1, top-3, and top-5. As expected, the matching result improves sig-nificantly when the best correspondences are considered. This holds for all matchers,but with varying levels of success. The biggest gain is observed for the RP measure.There, the performance increases from a recall of 0.25 for top-1 to 0.69 and 0.78 fortop-3 and top-5, respectively. As such, the RP measure performs nearly identicallyto the matching ensemble. The results indicate that all matchers show a monotonicbehavior, though some more than others. It is interesting to see that while the top-1performance of RP is worse than the one of VAL, a different picture is drawn for top-3 and top-5. There, RP surpasses VAL (in terms of Recall), performing just as wellas the ensemble matcher. Finally, what is important to realize is that by considering

CHAPTER 7. MATCHING USING EVENT-LOG INFORMATION 137
the top-3 and top-5 scores users need to just evaluate approximately 4% and 7% ofthe total possible correspondences. These small fractions already enable the respectiveidentification of close to 70% and 80% of the true correspondences.
7.4 Limitations
Our evaluation demonstrates that the consideration of event-log information can be use-ful for the identification of correspondences between process models. However, theseresults need to be reflected against the background of some limitations. In particular,we identify limitations related to the proposed matchers and limitations related to theevaluation.
The main limitation of the proposed matchers is that they focus on characteristicsthat can provide useful insights into similarity, but cannot guarantee similarity or dis-similarity between event classes. For example, while the usefulness of positional simi-larity is shown through the good performance of the RP measure, it is well-imaginablethat there are pairs of activities with a perfect RP similarity score, but which are ac-tually not at all related to each other. In the same way, similarity of durations can beuseful, but there can be many tasks in the same process with an execution durationof zero, i.e., automated tasks. By contrast, a certain process step can be very wellautomated in one process, whereas it is performed manually in another, resulting incomplete dissimilarity according to the DUR metric. This characteristic of the eventlog-based matchers differs compared to model-based matching techniques that, for in-stance, analyze activity labels. If two activity labels are completely equal, then thisnearly always does indicate a correct relation between the activities. Nevertheless, ourmatcher techniques are exactly intended to be used when such label-based matchersdo not achieve the desired result. Furthermore, this limitation mainly implies that theFLMs perform best when used as part of a matching ensemble. In these cases, coinci-dental similarity according to one FLM will most likely be evened out by other FLMsincluded in the ensemble, as was also demonstrated in the evaluation of Section 7.3.
A limitation of the evaluation is that the presented results are affected by the char-acteristics of the utilized test collection. Therefore, the individual FLMs can performdifferently when applied to other matching scenarios. For instance, the ATTR matcherdoes not perform well on our collection because nearly all event classes are associatedwith the same set of attributes. However, this may well not be the case for other pro-cesses, which would result in a better performance of the ATTR measure. Nevertheless,the test collection does represent a real-world collection with a great variety among itsprocesses, as described in Section 7.3.2. Therefore, the evaluation still provides usefulinsights into the performance of the proposed matching techniques in practical settings.This especially applies to the performance of the matching ensembles. These ensem-bles analyze a variety of characteristics, which makes their results less prone to thespecifics of a test collection.

138 7.5. RELATED WORK
7.5 Related WorkThe work presented in this chapter relates to two main streams of research: processmodel matching and instance-based matching. Section 2.4.4 provides an in-depthoverview of the former stream. The difference between our matching technique andthe numerous existing process model matching techniques is that we take event-log in-formation into account, rather than focus solely on information contained in the processmodels themselves. Since this information is derived from the consideration of processinstances, our work also relates to existing instance-based matching techniques appliedin other domains.
Instance-based matching has been previously explored in the context of schemamatching and the related field of ontology alignment. Engmann and Maßmann [89]used two methods to enhance their COMA++ matcher. The first, a constraint-basedmatcher, identifies the field types using a list of patterns and numerical constraintsattempted over the instance data per attribute. An approach similar to our own VALmeasure. Their second method applies to text-based fields taken from the same do-main in which the string-similarity of all instances is compared and averaged. A sim-ilar approach is suggested by Wang et. al. [273] which probe a Web query interfaceswith keywords and then compare the vector-space similarity of the query result to-kens. A similar approach is applied by Duan et. al. [86], using Locality SensitiveHashing (LSH) techniques to compare instances over very large ontologies. Zaiß et.al. [292] use regular expressions to improve pattern identification of attribute domains.Our work differs from these works in that we make use of process-unique features toperform the matching task. For instance, the consideration of execution order, duration,and prerequisites are characteristics that are specific to the process perspective.
7.6 SummaryIn this chapter we proposed instance-based process matching as a new element for thetoolbox of matching process models. We introduced six FLMs that assess the similar-ity of two event classes from different event logs. Each FLM focuses on a differentconceptual notion of similarity, resulting in a broad coverage of the process informa-tion stored in event logs. In particular, we presented matchers that quantify similarityaccording to: event positions, frequencies, durations, attribute names, attribute values,and prerequisites. We demonstrated the usefulness of these similarity metrics through aquantitative evaluation using real-world data. The evaluation showed that by just con-sidering the information specific to event logs, the introduced matchers can identifya considerable number of correspondences between event classes. This performancewas particularly achieved when the six FLMs were combined into a single matchingensemble. As an illustration, the results show that users would need to evaluate just4% out of all possible correspondences in order to identify nearly 70% of the actualcorrespondences. By combining our instance-based matching techniques with tradi-tional, model-based techniques users can strive to obtain matching results that cannotbe obtained by using either of these techniques alone.

8Conclusion
This chapter concludes this doctoral thesis. Section 8.1 provides a summary of themain results. Section 8.2 discusses the implications of the presented work for researchand practice. Finally, Section 8.3 provides an outlook on directions for future research.
8.1 Summary of Results
In this thesis, we focused on the automated analysis of process information containedin various representation formats. As a basis for the development of these techniques,we considered why different representation formats are used in organizations and theproblems that can result from this situation. The main contributions of this thesis areprovided by five techniques that focus on the alignment and comparison of processinformation in different informational artifacts. We can summarize the main resultspresented in this thesis as follows:
• An overview of the causes and consequences of process-information fragmenta-tion. Based on an analysis of existing literature and a case study, we identifiedvarious reasons for the existence of a variety of process-information artifacts inorganizations, as presented in Chapter 2. Most importantly, different artifactsare used in order to provide stakeholders with the process information that isrelevant to conduct their tasks, in suitable representation formats. We identifiedthree main consequences of this spread of process information, i.e., of process-information fragmentation. First, fragmentation can lead to increased time andeffort required to maintain process information. Because organizations oftenstruggle with these required efforts, this can also lead process information be-coming outdated. Second, the fragmentation of process information can nega-tively affect the execution efficiency of processes. Ultimately, this leads to moretime, effort, and costs required for their execution. Third, when fragmentationcauses users to struggle to find the process information needed to perform their
139

140 8.1. SUMMARY OF RESULTS
tasks, it can even lead to business process noncompliance. Such cases can leadto reduced quality of process outcomes and the incurrence of financial penalties.• Inconsistency detection between process models and textual process descrip-
tions. The use of textual process descriptions alongside process models makesprocess information more accessible to a variety of stakeholders. However, thiscomes with a clear risk that model and text become misaligned, for instancewhen process changes are not applied to both descriptions consistently. For or-ganizations with hundreds of processes, the effort required to manually identifyand clear up such conflicts is considerable. The approach presented in Chap-ter 3 addresses this problem by automatically detecting inconsistencies betweena process model and a corresponding textual description. A quantitative evalu-ation using real-world data demonstrates that our approach achieves promisingresults. Particularly, our approach detected all model-text pairs in which a pro-cess model activity was not described in the text or where the order betweenprocess activities differed, with a high precision.• Behavioral spaces as a means to capture behavioral uncertainty in processes.
Uncertainty about conveyed process behavior plays an important role when an-alyzing semi-structured representation formats, such as textual process descrip-tions. Furthermore, uncertainty can result in the context of alignments betweeninformation from different artifacts. Given such uncertainty, it is often impossi-ble to determine exactly which process behavior is conveyed by a process spec-ification. Rather, there are numerous potential interpretations of the describedprocess behavior. In order to still be able to reason about properties such as con-formance in the context of uncertain behavior, this thesis introduced and appliedthe concept of a behavioral space as a means to capture all potential interpreta-tion of behavioral uncertainty. We showed the need for and usefulness of behav-ioral spaces to capture uncertainty caused by alignments between process modelsand event logs in Chapter 4. Furthermore, Chapter 5 showed their application forthe analysis of ambiguous textual process descriptions.• Conformance checking in the context of behavioral uncertainty. By capturing
behavioral uncertainty in processes using behavioral spaces, trustworthy con-formance-checking results can be obtained in situations where existing con-formance-checking techniques fail to do so. In this thesis, we showed the useful-ness of behavioral spaces by using them in the context of conformance checking.The conformance-checking results obtained by our methods are probabilistic,differentiating between conforming, nonconforming, and potentially conformingbehavior. We applied our method to two scenarios in order to illustrate the utilityof behavioral spaces for conformance checking. Chapter 4 showed that behav-ioral spaces allow us to obtain conformance-checking results for numerous caseswhere traditional conformance-checking techniques cannot be applied. Simi-larly, Chapter 5 showed that the use of behavioral spaces provides a much betterbasis for conformance checking than other, naive ways of dealing with ambiguityin textual process descriptions.• Transformation of natural language descriptions into measurable Process Per-
formance Indicators (PPIs). The unstructured natural language used by man-agers to specify relevant PPIs differs considerably from the structured, formal

CHAPTER 8. CONCLUSION 141
definitions required to actually monitor them. The time and effort required totransform the natural language descriptions into a suitable format impedes theeffectiveness with which organizations can monitor their process performance.To overcome this problem, Chapter 6 presented an approach that automates thetransformation task. A quantitative evaluation with a set of real-world PPI de-scriptions and accompanying process models revealed that our approach gener-ates PPI definitions that are highly similar to those created manually. Therefore,our approach represents a viable, automated alternative to an otherwise highlylaborious and time-intensive, manual task. This enables organizations to moreefficiently monitor the performance of their business processes and continuouslyadapt their monitoring activities to changing business needs.• Process model matching based on event-log information. Process model match-
ing provides the basis for many process analysis techniques, such as inconsis-tency detection and process querying. Chapter 7 introduced a technique thatuses event-log information in process model matching. Our matching techniquebuilds on six conceptual notions of similarity between event classes. Further-more, we provided various operationalizations that quantify these conceptualnotions. We demonstrated the usefulness of these similarity metrics through aquantitative evaluation using real-world data. The evaluation showed that byjust considering the information specific to event logs, the introduced matcherscan identify a considerable number of correspondences between event classes.By combining our instance-based matching techniques with traditional, model-based techniques users can strive to obtain matching results that cannot be ob-tained by using either of these techniques alone. In this way, the accuracy and,therefore, usefulness of techniques that build on process model alignments isimproved.
To achieve these results, we followed internationally established standards applica-ble to IS research, conducted according to the behavioral science and design scienceparadigms [122]. Most importantly, this involved addressing relevant problems andevaluating our proposed solutions using appropriate metrics and relevant, real-worlddata collections. In this way, our results represent a significant contribution to the bodyof knowledge of the IS research discipline.
8.2 Implications
In this section, we consider the implications of the work presented in this thesis. Sec-tion 8.2.1 reflects on the implications for practice and Section 8.2.2 on the implicationsfor research.
8.2.1 Implications for PracticeThe work presented in this thesis has several implications for organizations that striveto improve their organizational efficiency and process quality. In particular, we identifythe following main implications for practice:

142 8.2. IMPLICATIONS
• Insights for improved management of process information. Our analysis of thecauses and consequences of process-information fragmentation, presented inChapter 2, shows the importance of the proper management of informationalartifacts for organizations. In particular, organizations should strive to make theright process information available to stakeholders in suitable formats. How-ever, organizations should simultaneously ensure that this fragmentation doesnot result in a situation in which process cannot be maintained or found. Amain threat in this regard is the ad-hoc creation of process-information artifacts,which reduces the traceability that exists between process information in differ-ent artifacts. Therefore, organizations should aim to establish guidelines for thecreation and maintenance of process information. In this way, process informa-tion becomes easy to retrieve and stays in sync with the correct way to executethe process it describes.• More efficient resolution of inconsistencies among process representations. Al-
though organizations often use multiple process representation formats in or-der to provide different stakeholders with information in a suitable format, thiscomes with the clear risk that the different representations do not convey the sameinformation about a process. Our inconsistency-detection technique presented inChapter 3 enables organizations to automatically detect such inconsistencies be-tween process models and textual process descriptions. By using our approach,organizations can more efficiently detect and, therefore, resolve inconsistenciesthat exist in their process documentation. In this way, organizations can saveconsiderable amounts of time and effort. This especially applies to organizationswith large process repositories, possibly containing information on hundreds ofprocesses.• Increased adaptability of process performance monitoring. The monitoring of
business processes represents an important prerequisite for organizations to im-prove their processes and, in this way, maintain a competitive advantage. Thismonitoring task is greatly affected by the continuous changes to which businessprocesses and their environments are subject. As a result, organizations shouldcontinuously adapt the way in which they monitor their processes to these shifts.Our transformation approach presented in Chapter 6 supports organizations inthis endeavor. The approach bridges the Business-IT gap that exists betweenthe managers that specify the performance indicators to be monitored and thesystems engineers involved in the actual monitoring of these indicators. In par-ticular, it enables managers to specify automatically measurable PPIs withoutprecarious and time-consuming communication with system engineers. In thisway, our approach enables organizations to more easily adapt the monitoring oftheir business processes to emergent changes.• Improved detection and prevention of business process noncompliance. Business
process noncompliance can pose considerable threats to organizations. Noncom-pliant actions can lead to reduced efficiency, reduced process quality, and evento the incurrence of financial penalties. In this thesis, we presented two novelconformance-checking techniques that improve the ability of organizations todetect nonconforming behavior. Chapter 4 presented a technique that enablesthe detection of nonconformance in a more trustworthy manner than traditional

CHAPTER 8. CONCLUSION 143
techniques. In particular, our technique avoids the need to impose, possibly in-correct, assumptions on the relations between observed events and a processmodel. Chapter 5 expands the applicability of conformance-checking techniquesfrom merely structured process representations, to semi-structured representa-tions, specifically in the form of textual process descriptions. In this way, weenabled conformance checking to take the wealth of process information that isstored in natural language documents into account. Ultimately, the presentedtechniques improve the detection of business process noncompliance, leading toincreased organizational efficiency and process quality.
8.2.2 Implications for researchThe work presented in this thesis has several implications for research in the field ofbusiness process management as well as IS research, in particular for the managementand alignment of process information.
• Comparison and alignment of process information in semi-structured formats.Establishing alignments between process-information artifacts is an importantprerequisite for the development of a variety of process analysis techniques, suchas inconsistency detection, update propagation, and process querying. Most ex-isting techniques focus on the creation of alignments between structured pro-cess representation formats, in the form of process models or process modelsand event logs. In this thesis, Chapters 3 and 6 presented techniques that alignprocess information from other representation formats, specifically from textualprocess descriptions and natural language PPI descriptions. In this way, our re-search provides a basis for the development of analysis techniques that buildon the alignments established by our techniques. Furthermore, our researchalso shows the potential for the development of further automated analysis tech-niques, specifically those that focus on process information contained in othersemi-structured informational artifacts that have so far been largely ignored byresearch.• Enabled reasoning in the presence of behavioral uncertainty. Uncertainty about
process behavior plays a prominent role when analyzing unstructured or semi-structured process-information artifacts, as well as when reasoning based onautomatically established alignments between artifacts. Our work presented inChapters 4 and 5 has important implications in this regard. The introduction ofthe concept of behavioral spaces provides a structured manner to capture all pos-sible interpretations of uncertain process behavior. By doing so, process analysistechniques can be applied without the need to select a single, possibly incorrect,interpretation of the process behavior. This demonstrates that the use of be-havioral spaces opens up numerous possibilities for the development of processanalysis techniques that were previously deemed unfruitful because of ambiguityor other causes of uncertainty.• Improved process model matching through the consideration of event-log infor-
mation. Alignments between process models provide an important basis for avariety of application scenarios and techniques. These alignments are, for in-

144 8.3. FUTURE RESEARCH
stance, used to detect differences between models, for the harmonization of pro-cess model variants, process querying, and for the automated propagation ofprocess changes. The accuracy and, therefore, usefulness of such techniques ishighly dependent on the correctness and completeness of the alignments that areestablished by process model matching techniques. In Chapter 7, we showedthat the quality of these results can be improved through the consideration ofevent-log information. In particular, by considering the contents of event logs inthe matching tasks, alignment results can be obtained that model-based match-ers cannot achieve. Therefore, our research supports the usefulness of analysistechniques that build on process model alignments because it can lead to an im-proved alignment quality. Furthermore, our results show that the consideration ofinstance-level information can be worthwhile in future development of processmodel matching techniques.
8.3 Future Research
This doctoral thesis focused on the fragmentation of process information and, in par-ticular, on technological developments that can mitigate its consequences. The workpresented in this thesis opens up possibilities for further research that pursues the ef-ficient use and maintenance of process information within organizations. In this pur-suit, we can distinguish two general perspectives to mitigate the negative aspects ofprocess-information fragmentation: the technical and the organizational perspective.The technical perspective focuses on mitigation by providing technical solutions tospecific problems caused fragmentation. By contrast, the organizational perspectivefocuses on mitigation by reducing the extent of fragmentation itself.
8.3.1 Technical PerspectiveThis thesis primarily takes a technical perspective to mitigate the effects of process-information fragmentation. We presented conceptual and technical developments thatfocus on the more efficient use and maintenance of process information spread out overvarious artifacts. Different opportunities for future research stem from these develop-ments.
A variety of scenarios in which organizations struggle with the impact of process-information fragmentation remain unaddressed by existing research. In particular, fu-ture research can focus on the development of techniques that (i) focus on more processperspectives, (ii) cover additional representation formats and (ii) that address additionaluse cases.
(i) Most of the techniques presented in this thesis focus on the comparison of pro-cess information from a control-flow perspective. While this is arguably themost relevant perspective in process analysis, it is important to recognize that thepresented techniques could be extended to also consider, for example, the tem-poral, resource, and data perspectives. For instance, the consistency-checkingtechnique from Chapter 3 could be extended to also detect inconsistencies with
CHAPTER 8. CONCLUSION 145
respect to the resources that should execute activities according to the processdescriptions;
(ii) Regarding the coverage of additional representation formats, we primarily seeopportunities to develop alignment and comparison techniques that focus on pro-cess information contained in slide sets, checklists, and spreadsheets. The useof these representation formats has been recognized in literature and observedin our case study, as discussed in Section 2.1.4. However, these formats arecurrently not yet covered by existing alignment techniques;
(iii) Aside from broadening the spectrum of considered formats, techniques can alsobe developed that address use cases beyond the comparison and alignment ofprocess information. For instance, our technique presented in Chapter 3 aimsto detect inconsistencies between process model and textual descriptions, whichcan be used to detect changes between the process representations. Instead, byautomatically propagating the effects of process changes from one representa-tion to the other, process consistency can be ensured, rather than just detected.The conceptual contributions presented in this thesis can be particularly help-ful in the pursuit of such new research directions. For instance, the approachused to extract process information from textual process descriptions and textualPPI descriptions can be utilized to support the extraction of process informationfrom other semi-structured artifacts. Furthermore, the concept of a behavioralspace can be applied to use cases in which the extraction or alignment of processinformation cannot provide deterministic results.
In this thesis, and in the above reflection, we have so far focused on applicationscenarios of alignment techniques in isolation. Typically, existing research focuses onthe alignment or comparison of two informational artifacts. However, as discussed inSection 2.1.4, realistic settings can involve much larger numbers of informational arti-facts related to a single process. It is for those processes that the problems caused byfragmentation can be me the most pressing. To better support such scenarios, researchshould strive for integrated solutions that enable the use and maintenance of all infor-mation related to a process and, even, entire process repositories, rather than considerpairs of informational artifacts in isolation. The main prerequisite for such support isthat traceability should be established between process information from all artifacts.Note that the provision of holistic support through such techniques differs considerablyfrom the use of data warehouses to accomplish similar goals. Data warehouses requirea considerable overhaul of the way in which organizational members capture processinformation in the first place. By contrast, by using techniques such as presented andproposed in this thesis, organizational members can still document process informationin the format that they prefer, whether this is a process model, a textual description, orany other representation format of choice.
Organizational Perspective
Although this thesis mainly focused on the technological perspective, the organiza-tional perspective also plays an important role when dealing with process informationin organizations. In particular, by taking this perspective into consideration, the nega-tive aspects associated with process-information fragmentation can already be partially

146 8.3. FUTURE RESEARCH
avoided, reducing the need for their later mitigation. This thesis, in particular Sec-tion 2.1.4, already showed the crucial nature of taking such steps to reduce the effectsof fragmentation. This can, for instance, be achieved by introducing guidelines thatchange the way in which organizations capture process information. However, furtherresearch is required in order to better understand how to achieve the desired effects.Currently, research that addresses the question of how to best capture process infor-mation has primarily focused on the suitability of representation formats for specifictasks (cf. [55, 93]. A main problem is that these scenarios and, therefore, also the use-fulness of representation formats are typically considered in isolation, generally usingexperimental settings. There is limited reflection on how or why these representationformats co-exist in practical settings, let alone that these questions are investigated.Nevertheless, insights into this direction are necessary, because it is this co-existencethat leads to problems when using and maintaining process information. A main di-rection to investigate in this regard is the trade-off that exists between the benefits ofusing more artifacts to provide stakeholders with the information they need versus thenegative aspects associated with such further process-information fragmentation. Putdifferently, when does the creation of more process-information artifacts help stake-holders by providing them with the information they need and when does it reduce theability of stakeholders to actually find this information? By answering such questions,important insights can be obtained that will enable organizations to manage their pro-cess information in a more considerate manner. Therefore, such insights would helporganizations to further improve their efficiency and provide higher quality results.

Bibliography
[1] Van der Aa, H., Del-Rıo-Ortega, A., Resinas, M., Leopold, H., Ruiz-Cortes,A., Mendling, J., Reijers, H.A.: Narrowing the business-IT gap in process per-formance measurement. In: International Conference on Advanced InformationSystems Engineering. pp. 543–557. Springer (2016)
[2] Van der Aa, H., Gal, A., Leopold, H., Reijers, H.A., Sagi, T., Shraga, R.:Instance-based process matching using event-log information. In: Interna-tional Conference on Advanced Information Systems Engineering. pp. 283–297.Springer (2017)
[3] Van der Aa, H., Leopold, H., Batoulis, K., Weske, M., Reijers, H.A.: Integratedprocess and decision modeling for data-driven processes. In: Business ProcessManagement Workshops. pp. 405–417. Springer (2015)
[4] Van der Aa, H., Leopold, H., Mannhardt, F., Reijers, H.A.: On the fragmentationof process information: Challenges, solutions, and outlook. In: InternationalConference on Enterprise, Business-Process and Information Systems Model-ing, pp. 3–18. Springer (2015)
[5] Van der Aa, H., Leopold, H., Reijers, H.A.: Detecting inconsistencies betweenprocess models and textual descriptions. In: International Conference on Busi-ness Process Management, pp. 90–105. Springer (2015)
[6] Van der Aa, H., Leopold, H., Reijers, H.A.: Dealing with behavioral ambiguityin textual process descriptions. In: International Conference on Business ProcessManagement. pp. 271–288. Springer (2016)
[7] Van der Aa, H., Leopold, H., Reijers, H.A.: Checking process compliance onthe basis of uncertain event-to-activity mappings. In: International Conferenceon Advanced Information Systems Engineering. pp. 79–93. Springer (2017)
[8] Van der Aa, H., Leopold, H., Reijers, H.A.: Comparing textual descriptions toprocess models: The automatic detection of inconsistencies. Information Sys-tems 64, 447–460 (2017)
147

148 BIBLIOGRAPHY
[9] Van der Aa, H., Leopold, H., del Rio-Ortega, A., Resinas, M., Reijers, H.A.:Transforming unstructured natural language descriptions into measurable pro-cess performance indicators using hidden markov models. Information Systems71, 27–39 (2017)
[10] Van der Aa, H., Leopold, H., van de Weerd, I., Reijers, H.A.: Causes and conse-quences of fragmented process information: Insights from a case study. In: 23rdAmericas Conference on Information Systems, AMCIS (2017)
[11] Van der Aa, H., Reijers, H.A., Vanderfeesten, I.: Composing workflow activitieson the basis of data-flow structures. In: International Conference on BusinessProcess Management, pp. 275–282. Springer (2013)
[12] Van der Aa, H., Reijers, H.A., Vanderfeesten, I.: Designing like a pro: Theautomated composition of workflow activities. Computers in industry 75, 162–177 (2016)
[13] Van der Aalst, W.M.P.: Process Mining: Discovery, Conformance, and Enhance-ment of Business Processes. Springer (2011)
[14] Van der Aalst, W.M.P., Adriansyah, A., De Medeiros, A.K.A., Arcieri, F., Baier,T., Blickle, T., Bose, J.C., et al.: Process mining manifesto. In: InternationalConference on Business Process Management. pp. 169–194. Springer (2011)
[15] Van der Aalst, W.M.P., Adriansyah, A., van Dongen, B.: Replaying history onprocess models for conformance checking and performance analysis. Wiley In-terdisciplinary Reviews: Data Mining and Knowledge Discovery 2(2), 182–192(2012)
[16] Van der Aalst, W.M.P., van Hee, K.M., van Werf, J.M., Verdonk, M.: Auditing2.0: using process mining to support tomorrow’s auditor. Computer 43(3), 90–93 (2010)
[17] Van der Aalst, W.M.P., Ter Hofstede, A.H., Weske, M.: Business process man-agement: A survey. In: International conference on business process manage-ment. pp. 1–12. Springer (2003)
[18] Van der Aalst, W.M.P., Van Hee, K.M.: Workflow management: models, meth-ods, and systems. MIT press (2004)
[19] Van der Aalst, W.M.P., Weijters, T., Maruster, L.: Workflow mining: Discover-ing process models from event logs. IEEE Transactions on Knowledge and DataEngineering 16(9), 1128–1142 (2004)
[20] Abiteboul, S., Kanellakis, P., Grahne, G.: On the representation and querying ofsets of possible worlds. SIGMOD Rec. 16(3), 34–48 (Dec 1987)
[21] Accorsi, R., Stocker, T.: On the exploitation of process mining for security au-dits: the conformance checking case. In: Proceedings of the 27th Annual ACMSymposium on Applied Computing. pp. 1709–1716. ACM (2012)
[22] Achananuparp, P., Hu, X., Shen, X.: The evaluation of sentence similarity mea-sures. In: Data Warehousing and Knowledge Discovery, pp. 305–316. Springer(2008)
[23] Achour, C.B.: Guiding scenario authoring1. Information Modelling and Knowl-edge Bases X 51, 152 (1999)
[24] Adriansyah, A., van Dongen, B., Van der Aalst, W.M.P.: Conformance checkingusing cost-based fitness analysis. In: Enterprise Distributed Object ComputingConference (EDOC), 2011 15th IEEE International. pp. 55–64. IEEE (2011)

BIBLIOGRAPHY 149
[25] Aggarwal, C.C., Yu, P.S.: A survey of uncertain data algorithms and applica-tions. IEEE Transactions on Knowledge and Data Engineering 21(5), 609–623(2009)
[26] Agirre, E., Alfonseca, E., Hall, K., Kravalova, J., Pasca, M., Soroa, A.: A studyon similarity and relatedness using distributional and wordnet-based approaches.In: Proceedings of Human Language Technologies: The 2009 Annual Confer-ence of the North American Chapter of the Association for Computational Lin-guistics. pp. 19–27. Association for Computational Linguistics (2009)
[27] Alavi, M., Leidner, D.E.: Review: Knowledge management and knowledgemanagement systems: Conceptual foundations and research issues. MIS quar-terly pp. 107–136 (2001)
[28] Algergawy, A., Nayak, R., Saake, G.: Element similarity measures in xmlschema matching. Information Sciences 180(24), 4975–4998 (2010)
[29] Allweyer, T.: BPMN 2.0: introduction to the standard for business process mod-eling. BoD–Books on Demand (2010)
[30] Alter, S.: Beneficial noncompliance and detrimental compliance: Expectedpaths to unintended consequences. In: Americas Conference on InformationSystems (2015)
[31] Andrade, E., van der Aa, H., Leopold, H., Alter, S., Reijers, H.A.: Factors lead-ing to business process noncompliance and its positive and negative effects: Em-pirical insights from a case study. In: 22nd Americas Conference on InformationSystems, AMCIS (2016)
[32] Antunes, G., Bakhshandeh, M., Borbinha, J., Cardoso, J., Dadashnia, S.,Di Francescomarino, C., Dragoni, M., Fettke, P., Gal, A., Ghidini, C., et al.: Theprocess model matching contest 2015. GI-Edition/Proceedings: Lecture notes ininformatics 248, 127–155 (2015)
[33] Awad, A., Decker, G., Weske, M.: Efficient compliance checking using bpmn-qand temporal logic. In: International Conference on Business Process Manage-ment. pp. 326–341. Springer (2008)
[34] Backus, J.W.: The syntax and semantics of the proposed international algebraiclanguage of the zurich acm-gamm conference. Proceedings of the InternationalConference on Information Processing, 1959 (1959)
[35] Bagayogo, F., Beaudry, A., Lapointe, L.: Impacts of it acceptance and resistancebehaviors: a novel framework. In: 34th International Conference on InformationSystems (ICIS) (2013)
[36] Bahl, L.R., Mercer, R.L.: Part of speech assignment by a statistical decisionalgorithm. In: Proceedings IEEE International Symposium on Information The-ory. pp. 88–89 (1976)
[37] Baier, T., Di Ciccio, C., Mendling, J., Weske, M.: Matching of events andactivities-an approach using declarative modeling constraints. In: InternationalConference on Enterprise, Business-Process and Information Systems Model-ing. pp. 119–134. Springer (2015)
[38] Baier, T., Di Ciccio, C., Mendling, J., Weske, M.: Matching events and activ-ities by integrating behavioral aspects and label analysis. Software & SystemsModeling pp. 1–26 (2017)
150 BIBLIOGRAPHY
[39] Baier, T., Mendling, J.: Bridging abstraction layers in process mining by auto-mated matching of events and activities. In: International Conference on Busi-ness Process Management, pp. 17–32. Springer (2013)
[40] Baier, T., Mendling, J., Weske, M.: Bridging abstraction layers in process min-ing. Information Systems 46, 123–139 (2014)
[41] Baier, T., Rogge-Solti, A., Weske, M., Mendling, J.: Matching of events andactivities-an approach based on constraint satisfaction. In: IFIP Working Con-ference on The Practice of Enterprise Modeling. pp. 58–72. Springer (2014)
[42] Bajwa, I.S., Choudhary, M.A.: From natural language software specifications toUML class models. In: Enterprise Information Systems, pp. 224–237. Springer(2012)
[43] Basten, T., Van der Aalst, W.M.P.: Inheritance of behavior. The Journal of Logicand Algebraic Programming 47(2), 47–145 (2001)
[44] Batini, C., Lenzerini, M., Navathe, S.B.: A comparative analysis of methodolo-gies for database schema integration. ACM computing surveys (CSUR) 18(4),323–364 (1986)
[45] Becker, J., Delfmann, P., Herwig, S., Lis, L., Stein, A.: Formalizing linguisticconventions for conceptual models. In: Conceptual Modeling - ER 2009, pp.70–83. LNCS, Springer Berlin Heidelberg (2009)
[46] Becker, J., Kugeler, M., Rosemann, M.: Process management: a guide for thedesign of business processes. Springer Science & Business Media (2013)
[47] Bernstein, P.A., Rahm, E.: Data warehouse scenarios for model management. In:International Conference on Conceptual Modeling. pp. 1–15. Springer (2000)
[48] Bird, S., Klein, E., Loper, E.: Natural language processing with Python: analyz-ing text with the natural language toolkit. O’Reilly Media, Inc. (2009)
[49] Born, M., Dorr, F., Weber, I.: User-Friendly Semantic Annotation in BusinessProcess Modeling. In: WISE 2007 Workshops, LNCS, vol. 4832, pp. 260–271.Springer (2007)
[50] Box, G.E.: Robustness in the strategy of scientific model building. Robustnessin statistics 1, 201–236 (1979)
[51] Brants, T.: Tnt: a statistical part-of-speech tagger. In: Proceedings of the sixthconference on Applied natural language processing. pp. 224–231. Associationfor Computational Linguistics (2000)
[52] Brewer, P., Speh, T.: Using the balance scorecard to measure supply chain per-formance. Journal of Business Logistics 21, 75–93 (2000)
[53] Brill, E.: Some advances in transformation-based part of speech tagging. arXivpreprint cmp-lg/9406010 (1994)
[54] Brown, P.F., Pietra, V.J.D., Pietra, S.A.D., Mercer, R.L.: The mathematics ofstatistical machine translation: Parameter estimation. Computational linguistics19(2), 263–311 (1993)
[55] Browning, T.R.: On the alignment of the purposes and views of process mod-els in project management. Journal of Operations Management 28(4), 316–332(2010)
[56] Budanitsky, A., Hirst, G.: Evaluating wordnet-based measures of lexical seman-tic relatedness. Computational Linguistics 32(1), 13–47 (2006)

BIBLIOGRAPHY 151
[57] Cavnar, W.B., Trenkle, J.M., et al.: N-gram-based text categorization. Ann Ar-bor MI 48113(2), 161–175 (1994)
[58] Cayoglu, U., Dijkman, R.M., Dumas, M., Fettke, P., Garcıa-Banuelos, L., Hake,P., Klinkmuller, C., Leopold, H., Ludwig, A., Loos, P., et al.: The process modelmatching contest 2013. In: 4th International Workshop on Process Model Col-lections: Management and Reuse (PMC-MR’13) (2013)
[59] Chaffey, D., White, G.: Business information management: improving perfor-mance using information systems. Pearson Education (2010)
[60] Chakraborty, S., Sarker, S., Sarker, S.: An exploration into the process of re-quirements elicitation: A grounded approach. J. AIS 11(4) (2010)
[61] Chan, F.: Performance measurement in a supply chain. International Journal ofAdvanced Manufacturing Technology 21, 534–548 (2003)
[62] Chaudhuri, S., Dayal, U.: An overview of data warehousing and olap technol-ogy. ACM Sigmod record 26(1), 65–74 (1997)
[63] Chesani, F., Mello, P., Montali, M., Riguzzi, F., Sebastianis, M., Storari, S.:Checking compliance of execution traces to business rules. In: InternationalConference on Business Process Management. pp. 134–145. Springer (2008)
[64] Chomsky, N.: Three models for the description of language. IRE Transactionson information theory 2(3), 113–124 (1956)
[65] Church, K.W.: A stochastic parts program and noun phrase parser for un-restricted text. In: Proceedings of the second conference on Applied naturallanguage processing. pp. 136–143. Association for Computational Linguistics(1988)
[66] Cohen, W., Ravikumar, P., Fienberg, S.: A comparison of string metrics formatching names and records. In: Kdd workshop on data cleaning and objectconsolidation. vol. 3, pp. 73–78 (2003)
[67] Costello, C., Molloy, O.: Building a process performance model for business ac-tivity monitoring. In: Information Systems Development, pp. 237–248. SpringerUS (2009)
[68] Crubezy, M., Musen, M.A.: Ontologies in support of problem solving. In: Hand-book on ontologies, pp. 321–341. Springer (2004)
[69] Cutting, D., Kupiec, J., Pedersen, J., Sibun, P.: A practical part-of-speech tagger.In: Proceedings of the third conference on Applied natural language processing.pp. 133–140. Association for Computational Linguistics (1992)
[70] Damashek, M.: Gauging similarity with n-grams: Language-independent cate-gorization of text. Science 267(5199), 843 (1995)
[71] Davenport, T.H., Short, J.E.: The new industrial engineering: information tech-nology and business process redesign. Sloan Management Review pp. 11–27(1990)
[72] Davies, I., Green, P., Rosemann, M., Indulska, M., Gallo, S.: How do practition-ers use conceptual modeling in practice? Data & Knowledge Engineering 58(3),358–380 (2006)
[73] De Marneffe, M.C., MacCartney, B., Manning, C.D., et al.: Generating typed de-pendency parses from phrase structure parses. In: Proceedings of LREC. vol. 6,pp. 449–454 (2006)

152 BIBLIOGRAPHY
[74] De Marneffe, M.C., Manning, C.D.: The stanford typed dependencies represen-tation. In: Coling 2008: Proceedings of the workshop on Cross-Framework andCross-Domain Parser Evaluation. pp. 1–8 (2008)
[75] Dellarocas, C., Klein, M.: A knowledge-based approach for designing robustbusiness processes. In: Business Process Management, pp. 50–65. Springer(2000)
[76] Denning, P.J.: A new social contract for research. Communications of the ACM40(2), 132–134 (1997)
[77] DeRose, S.J.: Grammatical category disambiguation by statistical optimization.Computational linguistics 14(1), 31–39 (1988)
[78] Di Ciccio, C., Van der Aa, H., Cabanillas, C., Mendling, J., Prescher, J.: Detect-ing flight trajectory anomalies and predicting diversions in freight transportation.Decision Support Systems 88, 1–17 (2016)
[79] Dijkman, R.M., Dumas, M., Garcıa-Banuelos, L.: Graph matching algorithmsfor business process model similarity search. In: International Conference onBusiness Process Management, pp. 48–63. Springer (2009)
[80] Dijkman, R.M., Dumas, M., Ouyang, C.: Formal semantics and analysis ofbpmn process models using petri nets. Queensland University of Technology,Tech. Rep (2007)
[81] Dijkman, R.M., Dumas, M., Van Dongen, B., Kaarik, R., Mendling, J.: Simi-larity of business process models: Metrics and evaluation. Information Systems36(2), 498–516 (2011)
[82] Doddington, G.R., Mitchell, A., Przybocki, M.A., Ramshaw, L.A., Strassel, S.,Weischedel, R.M.: The automatic content extraction (ace) program-tasks, data,and evaluation. In: LREC. vol. 2, p. 1 (2004)
[83] van Dongen, B.: Bpi challenge 2015 (2015), https://doi.org/10.4121/uuid:31a308ef-c844-48da-948c-305d167a0ec1
[84] Dorow, B., Widdows, D.: Discovering corpus-specific word senses. In: Pro-ceedings of the tenth conference on European chapter of the Association forComputational Linguistics-Volume 2. pp. 79–82. Association for ComputationalLinguistics (2003)
[85] Dou, D., McDermott, D., Qi, P.: Ontology translation on the semantic web.In: OTM Confederated International Conferences” On the Move to MeaningfulInternet Systems”. pp. 952–969. Springer (2003)
[86] Duan, S., Fokoue, A., Hassanzadeh, O., Kementsietsidis, A., Srinivas, K., Ward,M.J.: Instance-based matching of large ontologies using locality-sensitive hash-ing. In: International Semantic Web Conference. pp. 49–64. Springer (2012)
[87] Dumas, M., Rosa, M., Mendling, J., Reijers, H.A.: Fundamentals of BusinessProcess Management. Springer (2013)
[88] Earley, J.: An efficient context-free parsing algorithm. Communications of theACM 13(2), 94–102 (1970)
[89] Engmann, D., Maßmann, S.: Instance matching with COMA++. In: BTWWorkshops. pp. 28–37 (2007)
[90] Epure, E.V., Martın-Rodilla, P., Hug, C., Deneckere, R., Salinesi, C.: Automaticprocess model discovery from textual methodologies. In: Research Challenges

BIBLIOGRAPHY 153
in Information Science (RCIS), 2015 IEEE 9th International Conference on. pp.19–30. IEEE (2015)
[91] Fahey, L., Prusak, L.: The eleven deadliest sins of knowledge management.California management review 40(3), 265–276 (1998)
[92] Fahland, D., Favre, C., Koehler, J., Lohmann, N., Volzer, H., Wolf, K.: Analysison demand: Instantaneous soundness checking of industrial business processmodels. Data & Knowledge Engineering 70(5), 448–466 (2011)
[93] Figl, K., Recker, J.: Exploring cognitive style and task-specific preferences forprocess representations. Requirements Engineering 21(1), 63–85 (2016)
[94] Fisher, B.: Reengineering your business process. Journal of Systems Manage-ment 47(1), 46 (1996)
[95] Forney Jr, G.D.: The viterbi algorithm. Proceedings of the IEEE 61(3), 268–278(1973)
[96] Franceschini, F., Galetto, M., Maisano, D.: Management by measurement: De-signing key indicators and performance measurement systems. Springer (2007)
[97] Francescomarino, C., Tonella, P.: Supporting Ontology-Based Semantic An-notation of Business Processes with Automated Suggestions. In: InternationalConference on Enterprise, Business-Process and Information Systems Model-ing, LNBIP, vol. 29, pp. 211–223. Springer (2009)
[98] Francis, W., Kucera, H.: Frequency analysis of english usage. Journal of EnglishLinguistics 18 (1982)
[99] Friedrich, F., Mendling, J., Puhlmann, F.: Process model generation from naturallanguage text. In: International Conference on Advanced Information SystemsEngineering. pp. 482–496. Springer (2011)
[100] Gacitua-Decar, V., Pahl, C.: Automatic business process pattern matching forenterprise services design. In: Services-II, 2009. SERVICES-2’09. World Con-ference on. pp. 111–118. IEEE (2009)
[101] Gal, A., Anaby-Tavor, A., Trombetta, A., Montesi, D.: A framework for mod-eling and evaluating automatic semantic reconciliation. VLDBJ 14(1), 50–67(2005)
[102] Gal, A., Weidlich, M.: Model matching - processes and beyond. In: Interna-tional Conference on Advanced Information Systems Engineering. pp. 525–526.Springer (2015)
[103] Gal, A.: Uncertain schema matching. Synthesis Lectures on Data Management3(1), 1–97 (2011)
[104] Gal, A., Sagi, T.: Tuning the ensemble selection process of schema matchers.Information Systems 35(8), 845–859 (2010)
[105] Galil, Z., Micali, S., Gabow, H.: An o(ev\logv) algorithm for finding a maximalweighted matching in general graphs. SIAM Journal on Computing 15(1), 120–130 (1986)
[106] Garside, R., Leech, G.N., McEnery, T.: Corpus annotation: linguistic informa-tion from computer text corpora. Taylor & Francis (1997)
[107] Ge, N., Hale, J., Charniak, E.: A statistical approach to anaphora resolution. In:Proceedings of the sixth workshop on very large corpora. vol. 71, p. 76 (1998)
[108] Ghose, A., Koliadis, G., Chueng, A.: Process discovery from model and textartefacts. In: Services, 2007 IEEE Congress on. pp. 167–174. IEEE (2007)

154 BIBLIOGRAPHY
[109] Giunchiglia, F., Shvaiko, P., Yatskevich, M.: Semantic matching. In: Encyclo-pedia of Database Systems, pp. 2561–2566. Springer (2009)
[110] Gomez, F., Segami, C., Delaune, C.: A system for the semiautomatic gener-ation of ER models from natural language specifications. Data & KnowledgeEngineering 29(1), 57–81 (1999)
[111] de Goncalves, J.C., Santoro, F.M., Baiao, F.A.: Business process mining fromgroup stories. In: Computer Supported Cooperative Work in Design, 2009.CSCWD 2009. 13th International Conference on. pp. 161–166. IEEE (2009)
[112] Gonzalez, O., Casallas, R., Deridder, D.: MMC-BPM: A Domain-Specific Lan-guage for Business Processes Analysis. Business Information Systems 21, 157–168 (2009)
[113] Goodhue, D.L., Thompson, R.L.: Task-technology fit and individual perfor-mance. MIS quarterly pp. 213–236 (1995)
[114] Gorin, A.L., Riccardi, G., Wright, J.H.: How may I help you? Speech commu-nication 23(1), 113–127 (1997)
[115] Greene, B.B., Rubin, G.M.: Automatic grammatical tagging of English. Depart-ment of Linguistics, Brown University (1971)
[116] Grefenstette, G.: Explorations in automatic thesaurus discovery, volume 278 ofthe springer international series in engineering and computer science (1994)
[117] Gregor, S.: The nature of theory in information systems. MIS quarterly pp. 611–642 (2006)
[118] Griffiths, T.V., Petrick, S.R.: On the relative efficiencies of context-free gram-mar. Communications of the ACM 8(5), 289–300 (1965)
[119] Gruber, T.R., et al.: A translation approach to portable ontology specifications.Knowledge acquisition 5(2), 199–220 (1993)
[120] Gruhn, V., Laue, R.: Detecting Common Errors in Event-Driven Process Chainsby Label Analysis. Enterprise Modelling and Information Systems Architectures6(1), 3–15 (2011)
[121] Hammer, M., Champy, J.: Reengineering the Corporation: Manifesto for Busi-ness Revolution, A. Zondervan (2009)
[122] Hevner, A., March, S.T., Park, J., Ram, S.: Design science in information sys-tems research. MIS quarterly 28(1), 75–105 (2004)
[123] Hidders, J., Dumas, M., Van der Aalst, W.M.P., ter Hofstede, A.H., Verelst, J.:When are two workflows the same? In: Proceedings of the 2005 Australasiansymposium on Theory of computing-Volume 41. pp. 3–11. Australian ComputerSociety, Inc. (2005)
[124] Hill, J.B., Cantara, M., Kerremans, M., Plummer, D.: Magic quadrant for busi-ness process management suites, 2007. Gartner RAS Core Research Note G152906 (2007)
[125] Hobbs, J.R.: Resolving pronoun references. Lingua 44(4), 311–338 (1978)[126] Imielinski, T., Lipski Jr, W.: Incomplete information in relational databases.
Journal of the ACM (JACM) 31(4), 761–791 (1984)[127] Indurkhya, N., Damerau, F.J.: Handbook of natural language processing. Chap-
man and Hall/CRC (2010)

BIBLIOGRAPHY 155
[128] Islam, A., Inkpen, D.: Second order co-occurrence pmi for determining the se-mantic similarity of words. In: Proceedings of the International Conference onLanguage Resources and Evaluation, Genoa, Italy. pp. 1033–1038 (2006)
[129] ISR: Editorial statement and policy. Information Systems Research 13(4), insidefront cover (2002)
[130] Jackson, P., Moulinier, I.: Natural language processing for online applications:Text retrieval, extraction and categorization, vol. 5. John Benjamins Publishing(2007)
[131] Jin, T., Wang, J., La Rosa, M., Ter Hofstede, A., Wen, L.: Efficient querying oflarge process model repositories. Computers in Industry 64(1), 41–49 (2013)
[132] Joshi, A.K.: Natural language processing. Science 253(5025), 1242 (1991)[133] Jung, J.Y., Bae, J.: Workflow clustering method based on process similarity. In:
International Conference on Computational Science and Its Applications. pp.379–389. Springer (2006)
[134] Jung, J., Choi, I., Song, M.: An integration architecture for knowledge manage-ment systems and business process management systems. Computers in industry58(1), 21–34 (2007)
[135] Jurafsky, D., Martin, J.H.: Speech & language processing. Pearson EducationIndia (2000)
[136] Jurish, B.: A hybrid approach to part-of-speech tagging. Final Report at Berlin-Brandenburgische Akademie der Wissenschaften, Berlin (2003)
[137] Kaplan, R.S., Norton, D.P.: The balanced scorecard: measures that drive perfor-mance. Harvard Business Review 83(7), 172 (2005)
[138] Karlsson, F., Voutilainen, A., Heikkilae, J., Anttila, A.: Constraint Grammar:a language-independent system for parsing unrestricted text, vol. 4. Walter deGruyter (1995)
[139] Kettinger, W.J., Teng, J.T., Guha, S.: Business process change: a study ofmethodologies, techniques, and tools. MIS quarterly pp. 55–80 (1997)
[140] Klein, D., Manning, C.D.: Accurate unlexicalized parsing. In: Proceedings ofthe 41st Annual Meeting of the ACL-Volume 1. pp. 423–430. ACL (2003)
[141] Klein, S., Simmons, R.F.: A computational approach to grammatical coding ofenglish words. Journal of the ACM (JACM) 10(3), 334–347 (1963)
[142] Knackstedt, R., Kuropka, D., Muller, O., Polyvyanyy, A.: An ontology-basedservice discovery approach for the provisioning of product-service bundles. In:European Conference on Information Systems. pp. 1965–1977 (2008)
[143] Koehn, P., Hoang, H., Birch, A., Callison-Burch, C., Federico, M., Bertoldi, N.,Cowan, B., Shen, W., Moran, C., Zens, R., et al.: Moses: Open source toolkit forstatistical machine translation. In: Proceedings of the 45th annual meeting of theACL on interactive poster and demonstration sessions. pp. 177–180. Associationfor Computational Linguistics (2007)
[144] Kohavi, R.: A study of cross-validation and bootstrap for accuracy estimationand model selection. In: Ijcai. vol. 14, pp. 1137–1145 (1995)
[145] Kolb, P.: Disco: A multilingual database of distributionally similar words. Pro-ceedings of KONVENS-2008, Berlin (2008)

156 BIBLIOGRAPHY
[146] Kolb, P.: Experiments on the difference between semantic similarity and relat-edness. In: Proceedings of the ordic Conference on Computational Linguistics(ODALIDA). pp. 81–88 (2009)
[147] Korherr, B., List, B.: Extending the EPC and the BPMN with business processgoals and performance measures. In: International Conference on EnterpriseInformation Systems. pp. 287–294 (2007)
[148] Koschmider, A., Blanchard, E.: User assistance for business process model de-composition. In: Proceedings of the 1st IEEE International Conference on Re-search Challenges in Information Science. pp. 445–454 (2007)
[149] Kovacic, A.: Business renovation: business rules (still) the missing link. Busi-ness process management journal 10(2), 158–170 (2004)
[150] Krauth, E., Moonen, H., Popova, V., Schut, M.C.: Performance measurementand control in logistics service providing. In: International Conference on En-terprise Information Systems. pp. 239–247 (2005)
[151] Kronz, A.: Managing of process key performance indicators as part of thearis methodology. In: Corporate performance management, pp. 31–44. Springer(2006)
[152] Krumnow, S., Decker, G.: A concept for spreadsheet-based process modeling.In: International Workshop on Business Process Modeling Notation. pp. 63–77.Springer (2010)
[153] Kumar, E.: Natural language processing. IK International Pvt Ltd (2011)[154] Kupiec, J.: Robust part-of-speech tagging using a hidden markov model. Com-
puter Speech & Language 6(3), 225–242 (1992)[155] Kuss, E., Leopold, H., Van der Aa, H., Stuckenschmidt, H., Reijers, H.A.: Prob-
abilistic evaluation of process model matching techniques. In: Conceptual Mod-eling: 35th International Conference, ER 2016, Gifu, Japan, November 14-17,2016, Proceedings 35. pp. 279–292. Springer (2016)
[156] Kuster, J.M., Koehler, J., Ryndina, K.: Improving business process models withreference models in business-driven development. In: International Conferenceon Business Process Management. pp. 35–44. Springer (2006)
[157] La Rosa, M., Dumas, M., Uba, R., Dijkman, R.M.: Business process modelmerging: An approach to business process consolidation. ACM Transactions onSoftware Engineering and Methodology (TOSEM) 22(2), 11 (2013)
[158] Lami, G., Gnesi, S., Fabbrini, F., Fusani, M., Trentanni, G.: An automatic toolfor the analysis of natural language requirements. Tech. rep., Informe tecnico,CNR Information Science and Technology Institute, Pisa, Italia, Setiembre(2004)
[159] Landauer, T.K., Foltz, P.W., Laham, D.: An introduction to latent semantic anal-ysis. Discourse processes 25(2-3), 259–284 (1998)
[160] Lappin, S., Leass, H.J.: An algorithm for pronominal anaphora resolution. Com-putational linguistics 20(4), 535–561 (1994)
[161] Lavoie, B., Rambow, O., Reiter, E.: The modelexplainer. In: Eighth Inter-national Workshop on Natural Language Generation, Herstmonceux, Sussex(1996)
[162] Leopold, H.: Natural language in business process models. Springer (2013)

BIBLIOGRAPHY 157
[163] Leopold, H., van der Aa, H., Pittke, F., Raffel, M., Mendling, J., Reijers, H.A.:Integrating textual and model-based process descriptions for comprehensive pro-cess search. In: International Conference on Enterprise, Business-Process andInformation Systems Modeling. pp. 51–65. Springer (2016)
[164] Leopold, H., Eid-Sabbagh, R.H., Mendling, J., Azevedo, L.G., Baiao, F.A.:Detection of naming convention violations in process models for different lan-guages. Decision Support Systems 56, 310–325 (2013)
[165] Leopold, H., Meilicke, C., Fellmann, M., Pittke, F., Stuckenschmidt, H.,Mendling, J.: Towards the automated annotation of process models. In: Interna-tional Conference on Advanced Information Systems Engineering. pp. 401–416.Springer (2015)
[166] Leopold, H., Mendling, J., Polyvyanyy, A.: Supporting process model validationthrough natural language generation. IEEE Transactions on Software Engineer-ing 40(8), 818–840 (2014)
[167] Leopold, H., Niepert, M., Weidlich, M., Mendling, J., Dijkman, R.M., Stuck-enschmidt, H.: Probabilistic optimization of semantic process model matching.In: International Conference on Business Process Management. pp. 319–334.Springer (2012)
[168] Leopold, H., Pittke, F., Mendling, J.: Automatic service derivation from busi-ness process model repositories via semantic technology. Journal of Systems andSoftware 108, 134–147 (2015)
[169] Lin, D.: An information-theoretic definition of similarity. In: ICML. vol. 98, pp.296–304 (1998)
[170] Lin, D.: Dependency-based evaluation of minipar. In: Treebanks, pp. 317–329.Springer (2003)
[171] Ling, J., Zhang, L., Feng, Q.: An improved structure-based approach to measuresimilarity of business process models. In: SEKE. pp. 377–380 (2014)
[172] Liu, K., Yan, Z., Wang, Y., Wen, L., Wang, J.: Efficient syntactic process differ-ence detection using flexible feature matching. In: Asia-Pacific Conference onBusiness Process Management. pp. 103–116. Springer (2014)
[173] Lu, R., Sadiq, S., Governatori, G.: Compliance aware business process design.In: International Conference on Business Process Management. pp. 120–131.Springer (2007)
[174] Luftman, J., Papp, R., Brier, T.: Enablers and inhibitors of business-it alignment.Communications of the AIS 1(3es), 1 (1999)
[175] Madhavan, J., Bernstein, P.A., Domingos, P., Halevy, A.Y.: Representing andreasoning about mappings between domain models. AAAI/IAAI 2002, 80–86(2002)
[176] Madhavan, J., Bernstein, P.A., Rahm, E.: Generic schema matching with cupid.In: vldb. vol. 1, pp. 49–58 (2001)
[177] Maglitta, J.: Know-how, inc. Computerworld 30(1), 1996 (1996)[178] Mannhardt, F., de Leoni, M., Reijers, H.A.: Extending process logs with events
from supplementary sources. In: 3rd Workshop on Data- & Artifact-centricBPM. pp. 235–247. Springer (2014)
[179] Manning, C.D., Raghavan, P., Schutze, H.: Introduction to information retrieval,vol. 1. Cambridge university press Cambridge (2008)

158 BIBLIOGRAPHY
[180] Manning, C.D., Surdeanu, M., Bauer, J., Finkel, J., Bethard, S.J., McClosky, D.:The Stanford CoreNLP natural language processing toolkit. In: Proceedings of52nd Annual Meeting of the Association for Computational Linguistics: SystemDemonstrations. pp. 55–60 (2014)
[181] Marcus, M.P., Marcinkiewicz, M.A., Santorini, B.: Building a large annotatedcorpus of english: The penn treebank. Computational linguistics 19(2), 313–330(1993)
[182] Marshall, B., Chen, H., Madhusudan, T.: Matching knowledge elements inconcept maps using a similarity flooding algorithm. Decision Support Systems42(3), 1290–1306 (2006)
[183] Matsumoto, Y., Tanaka, H., Hirakawa, H., Miyoshi, H., Yasukawa, H.: Bup: abottom-up parser embedded in prolog. New Generation Computing 1(2), 145–158 (1983)
[184] McCallum, A., Freitag, D., Pereira, F.C.: Maximum entropy markov models forinformation extraction and segmentation. In: Icml. vol. 17, pp. 591–598 (2000)
[185] McCarthy, J.F., Lehnert, W.G.: Using decision trees for coreference resolution.arXiv preprint cmp-lg/9505043 (1995)
[186] Mendling, J.: Metrics for process models: empirical foundations of verifica-tion, error prediction, and guidelines for correctness, vol. 6. Springer Science &Business Media (2008)
[187] Mendling, J., Reijers, H.A., Van der Aalst, W.M.P.: Seven process model-ing guidelines (7pmg). Information and Software Technology 52(2), 127–136(2010)
[188] Meziane, F., Athanasakis, N., Ananiadou, S.: Generating natural language spec-ifications from UML class diagrams. Requirements Engineering 13(1), 1–18(2008)
[189] Michelberger, B.: Process-oriented information logistics: aligning process in-formation with business processes. Ph.D. thesis, Ulm University (2015)
[190] Michelberger, B., Mutschler, B., Reichert, M.: On handling process information:Results from case studies and a survey. In: International Conference on BusinessProcess Management. pp. 333–344. Springer (2011)
[191] Michelberger, B., Mutschler, B., Reichert, M.: Towards process-oriented in-formation logistics: why quality dimensions of process information matter. In:EMISA. pp. 107–120. Koellen-Verlag (2011)
[192] Mihalcea, R., Corley, C., Strapparava, C.: Corpus-based and knowledge-basedmeasures of text semantic similarity. In: Proceedings of the 21st National Con-ference on Artificial Intelligence. vol. 6, pp. 775–780 (2006)
[193] Miller, G.: The organization of lexical memory: Are word associations suffi-cient. The pathology of memory pp. 223–237 (1969)
[194] Miller, G.A.: WordNet: a lexical database for english. Communications of theACM 38(11), 39–41 (1995)
[195] Miller, G.A., Beckwith, R., Fellbaum, C., Gross, D., Miller, K.J.: Introductionto wordnet: An on-line lexical database. International journal of lexicography3(4), 235–244 (1990)
[196] Miller, S., Bobrow, R., Ingria, R., Schwartz, R.: Hidden understanding modelsof natural language. In: Proceedings of the 32nd annual meeting on Associa-

BIBLIOGRAPHY 159
tion for Computational Linguistics. pp. 25–32. Association for ComputationalLinguistics (1994)
[197] Mohri, M.: Finite-state transducers in language and speech processing. Compu-tational linguistics 23(2), 269–311 (1997)
[198] Momm, C., Malec, R., Abeck, S.: Towards a model-driven development of mon-itored processes. In: Wirtschaftsinformatik (2). pp. 319–336 (2007)
[199] Munoz-Gama, J., Carmona, J., Van der Aalst, W.M.P.: Single-entry single-exitdecomposed conformance checking. Information Systems 46, 102–122 (2014)
[200] Nadeau, D., Turney, P.D.: A supervised learning approach to acronym identi-fication. In: Conference of the Canadian Society for Computational Studies ofIntelligence. pp. 319–329. Springer (2005)
[201] Nasukawa, T., Yi, J.: Sentiment analysis: Capturing favorability using naturallanguage processing. In: Proceedings of the 2nd international conference onKnowledge capture. pp. 70–77. ACM (2003)
[202] Navarro, G.: A guided tour to approximate string matching. ACM computingsurveys (CSUR) 33(1), 31–88 (2001)
[203] Noy, N.F.: Semantic integration: a survey of ontology-based approaches. ACMSigmod Record 33(4), 65–70 (2004)
[204] Noy, N.F., Musen, M.A.: The prompt suite: interactive tools for ontology merg-ing and mapping. International Journal of Human-Computer Studies 59(6), 983–1024 (2003)
[205] Och, F.J.: Minimum error rate training in statistical machine translation. In:Proceedings of the 41st Annual Meeting on Association for ComputationalLinguistics-Volume 1. pp. 160–167. Association for Computational Linguistics(2003)
[206] Parent, C., Spaccapietra, S.: Issues and approaches of database integration.Communications of the ACM 41(5es), 166–178 (1998)
[207] Paulraj, D., Swamynathan, S., Madhaiyan, M.: Process model-based atomic ser-vice discovery and composition of composite semantic web services using webontology language for services (owl-s). Enterprise Information Systems 6(4),445–471 (2012)
[208] Pedrinaci et al., C.: Sentinel: a semantic business process monitoring tool. In:International Workshop on Ontology-Supported Business Intelligence. pp. 26–30 (2008)
[209] Peffers, K., Tuunanen, T., Rothenberger, M.A., Chatterjee, S.: A design scienceresearch methodology for information systems research. Journal of managementinformation systems 24(3), 45–77 (2007)
[210] Pei, J., Jiang, B., Lin, X., Yuan, Y.: Probabilistic skylines on uncertain data. In:Proceedings of the 33rd international conference on Very large data bases. pp.15–26 (2007)
[211] Peng, L., Diao, Y.: Supporting data uncertainty in array databases. In: ACMSIGMOD International Conference on Management of Data. pp. 545–560. ACM(2015)
[212] Phalp, K.T., Vincent, J., Cox, K.: Improving the quality of use case descrip-tions: empirical assessment of writing guidelines. Software Quality Journal15(4), 383–399 (2007)

160 BIBLIOGRAPHY
[213] Pittke, F., Leopold, H., Mendling, J.: When language meets language: Anti pat-terns resulting from mixing natural and modeling language. In: Business ProcessManagement Workshops. pp. 118–129. Springer (2014)
[214] Pittke, F., Leopold, H., Mendling, J.: Automatic detection and resolution of lex-ical ambiguity in process models. IEEE Transactions on Software Engineering41(6), 526–544 (2015)
[215] Pittke, F., Leopold, H., Mendling, J., Tamm, G.: Enabling reuse of process mod-els through the detection of similar process parts. In: International Conferenceon Business Process Management. pp. 586–597. Springer (2012)
[216] Polyvyanyy, A., Armas-Cervantes, A., Dumas, M., Garcıa-Banuelos, L.: On theexpressive power of behavioral profiles. Formal Aspects of Computing 28(4),597–613 (2016)
[217] Ponzetto, S.P., Strube, M.: Exploiting semantic role labeling, wordnet andwikipedia for coreference resolution. In: Proceedings of the main conferenceon Human Language Technology Conference of the North American Chapterof the Association of Computational Linguistics. pp. 192–199. Association forComputational Linguistics (2006)
[218] Popova, V., Sharpanskykh, A.: Modeling organizational performance indicators.Information Systems 35(4), 505–527 (2010)
[219] Porter, M.F.: An algorithm for suffix stripping. Program 14(3), 130–137 (1980)[220] Pradhan, S.S., Ramshaw, L., Weischedel, R., MacBride, J., Micciulla, L.: Un-
restricted coreference: Identifying entities and events in ontonotes. In: Interna-tional Conference on Semantic Computing. pp. 446–453. IEEE (2007)
[221] Pritchard, J.P., Armistead, C.: Business process management–lessons from eu-ropean business. Business Process Management Journal 5(1), 10–35 (1999)
[222] Quinlan, J.R.: Induction of decision trees. Machine learning 1(1), 81–106 (1986)[223] Rabiner, L.R.: A tutorial on hidden markov models and selected applications in
speech recognition. Proceedings of the IEEE 77(2), 257–286 (1989)[224] Rahm, E., Bernstein, P.A.: A survey of approaches to automatic schema match-
ing. the VLDB Journal 10(4), 334–350 (2001)[225] Ramezani, E., Fahland, D., Van der Aalst, W.M.P.: Where did i misbehave?
diagnostic information in compliance checking. In: International conference onbusiness process management. pp. 262–278. Springer (2012)
[226] Rapp, R.: A freely available automatically generated thesaurus of related words.In: LREC (2004)
[227] Razali, N.M., Wah, Y.B., et al.: Power comparisons of shapiro-wilk,kolmogorov-smirnov, lilliefors and anderson-darling tests. Journal of statisticalmodeling and analytics 2(1), 21–33 (2011)
[228] Recker, J., Safrudin, N., Rosemann, M.: How novices design business processes.Information Systems 37(6), 557–573 (2012)
[229] Reijers, H.A.: Design and control of workflow processes: business process man-agement for the service industry. Springer-Verlag (2003)
[230] Reijers, H.A., Leopold, H., Recker, J.: Towards a science of checklists. In:Proceedings of the 50th Hawaii International Conference on System Sciences(2017)

BIBLIOGRAPHY 161
[231] Resnik, P., et al.: Semantic similarity in a taxonomy: An information-basedmeasure and its application to problems of ambiguity in natural language. J.Artif. Intell. Res.(JAIR) 11, 95–130 (1999)
[232] Riefer, M., Ternis, S.F., Thaler, T.: Mining process models from naturallanguage text: A state-of-the-art analysis. In: Multikonferenz Wirtschaftsin-formatik (MKWI-16), March 9-11, Illmenau, Germany. Universitat Illmenau(2016)
[233] del Rıo-Ortega, A., Cabanillas, C., Resinas, M., Ruiz-Cortes, A.: Ppinot toolsuite: a performance management solution for process-oriented organisations.In: Service-Oriented Computing, pp. 675–678. Springer (2013)
[234] del Rıo-Ortega, A., Gutierrez, A.M., Duran, A., Resinas, M., Ruiz-Cortes, A.:Modelling service level agreements for business process outsourcing services.In: International Conference on Advanced Information Systems Engineering.pp. 485–500. Springer (2015)
[235] del Rio-Ortega, A., Resinas, M., Cabanillas, C., Ruiz-Cortes, A.: On the defi-nition and design-time analysis of process performance indicators. InformationSystems 38(4), 470–490 (2013)
[236] del Rıo-Ortega, A., Resinas, M., Duran, A., Ruiz-Cortes, A.: Using templatesand linguistic patterns to define process performance indicators. Enterprise In-formation Systems 10(2), 159–192 (2016)
[237] Rosemann, M.: Potential Pitfalls of Process Modeling: Part A. Business ProcessManagement Journal 12(2), 249–254 (2006)
[238] Rowley, J.: The wisdom hierarchy: representations of the dikw hierarchy. Jour-nal of information science 33(2), 163–180 (2007)
[239] Sadiq, S., Governatori, G., Namiri, K.: Modeling control objectives for businessprocess compliance. In: International conference on business process manage-ment. pp. 149–164. Springer (2007)
[240] Safavian, S.R., Landgrebe, D.: A survey of decision tree classifier methodology.IEEE Trans. Systems, Man, & Cybernetics (1991)
[241] Sagi, T., Gal, A.: Schema matching prediction with applications to data sourcediscovery and dynamic ensembling. The International Journal on Very LargeData Bases 22(5), 689–710 (2013)
[242] Sagi, T., Gal, A., Weidlich, M.: Measuring expected integration effort in servicecomposition. In: Services Computing (SCC), 2014 IEEE International Confer-ence on. pp. 645–652. IEEE (2014)
[243] Saldivar, J., Vairetti, C., Rodrıguez, C., Daniel, F., Casati, F., Alarcon, R.: Anal-ysis and improvement of business process models using spreadsheets. Informa-tion Systems 57, 1 – 19 (2016)
[244] Salton, G., McGill, M.J.: Introduction to modern information retrieval.McGraw-Hill, Inc. (1986)
[245] Sanchez-Ferreres, J., Carmona, J., Padro, L.: Aligning textual and graphicaldescriptions of processes through ILP techniques. In: International Conferenceon Advanced Information Systems Engineering (In press). Springer (2017)
[246] Sarma, A.D., Benjelloun, O., Halevy, A., Widom, J.: Working models for un-certain data. In: 22nd International Conference on Data Engineering. pp. 7–7.IEEE (2006)

162 BIBLIOGRAPHY
[247] Schal, T.: Workflow management for process organisations, volume 1096 of.Lecture Notes in Computer Science (1996)
[248] Schumacher, P., Minor, M., Schulte-Zurhausen, E.: Extracting and enrichingworkflows from text. In: Information Reuse and Integration (IRI), 2013 IEEE14th International Conference on. pp. 285–292. IEEE (2013)
[249] Sebu, M.L., Ciocarlie, H.: Similarity of business process models in a modulardesign. In: Applied Computational Intelligence and Informatics (SACI), 2016IEEE 11th International Symposium on. pp. 31–36. IEEE (2016)
[250] Selway, M., Grossmann, G., Mayer, W., Stumptner, M.: Formalising natural lan-guage specifications using a cognitive linguistic/configuration based approach.Information Systems 54, 191–208 (2015)
[251] Senderovich, A., Rogge-Solti, A., Gal, A., Mendling, J., Mandelbaum, A.: Theroad from sensor data to process instances via interaction mining. In: Interna-tional Conference on Advanced Information Systems Engineering. pp. 257–273.Springer (2016)
[252] Simon, H.A.: The sciences of the artificial. MIT press (1996)[253] Sinha, A., Paradkar, A.: Use cases to process specifications in Business Process
Modeling Notation. In: IEEE International Conference on Web Services. pp.473–480 (2010)
[254] Sinur, J., Schulte, W., Hill, J., Jones, T.: Magic quadrant for intelligent businessprocess management suites. Gartner RAS Core Research Note G 224913, 27(2012)
[255] Smirnov, S., Weidlich, M., Mendling, J.: Business process model abstrac-tion based on behavioral profiles. In: Service-Oriented Computing, pp. 1–16.Springer (2010)
[256] Smith, H., Fingar, P.: Business process management: the third wave, vol. 1.Meghan-Kiffer Press Tampa (2003)
[257] Soon, W.M., Ng, H.T., Lim, D.C.Y.: A machine learning approach to coref-erence resolution of noun phrases. Computational linguistics 27(4), 521–544(2001)
[258] Stachowiak, H.: Allgemeine modelltheorie. {Springer-Verlag, Wien} (1973)[259] Steiger, D.M.: Enhancing user understanding in a decision support system: a
theoretical basis and framework. Journal of Management Information Systems15(2), 199–220 (1998)
[260] Temperley, D., Sleator, D., Lafferty, J.: Parsing english with a link grammar. In:Third International Workshop on Parsing Technologies (1993)
[261] Tsichritzis, D.: The dynamics of innovation. In: Beyond calculation, pp. 259–265. Springer (1997)
[262] Tur, G., Hakkani-Tur, D., Heck, L.: What is left to be understood in atis? In:Spoken Language Technology Workshop (SLT), 2010 IEEE. pp. 19–24. IEEE(2010)
[263] Unger, M., Leopold, H., Mendling, J.: How much flexibility is good for knowl-edge intensive business processes: A study of the effects of informal work prac-tices. In: System Sciences (HICSS), 2015 48th Hawaii International Conferenceon. pp. 4990–4999. IEEE (2015)

BIBLIOGRAPHY 163
[264] Uschold, M., Gruninger, M.: Ontologies and semantics for seamless connectiv-ity. ACM SIGMod Record 33(4), 58–64 (2004)
[265] Vaidyanathan, G.: A framework for evaluating third-party logistics. Communi-cations of the ACM 48(1), 89–94 (2005)
[266] Van Glabbeek, R., Goltz, U.: Refinement of actions and equivalence notions forconcurrent systems. Acta Informatica 37(4-5), 229–327 (2001)
[267] Vance, D.: Information, knowledge and wisdom: The epistemic hierarchy andcomputer-based information systems. AMCIS 1997 Proceedings p. 124 (1997)
[268] Versley, Y.: Antecedent selection techniques for high-recall coreference resolu-tion. In: EMNLP-CoNLL. pp. 496–505 (2007)
[269] Vessey, I., Glass, R.: Strong vs. weak approaches to systems development. Com-munications of the ACM 41(4), 99–102 (1998)
[270] Viorica Epure, E., Martin-Rodilla, P., Hug, C., Deneckere, R., Salinesi, C.:Automatic process model discovery from textual methodologies. In: ResearchChallenges in Information Science (RCIS), 2015 IEEE 9th International Confer-ence on. pp. 19–30. IEEE (2015)
[271] Van der Vos, B., Gulla, J.A., van de Riet, R.: Verification of conceptual modelsbased on linguistic knowledge. Data & Knowledge Engineering 21(2), 147 –163 (1997)
[272] Wald, J.A., Sorenson, P.G.: Explaining ambiguity in a formal query language.ACM Transactions on Database Systems (TODS) 15(2), 125–161 (1990)
[273] Wang, J., Wen, J.R., Lochovsky, F., Ma, W.Y.: Instance-based schema matchingfor web databases by domain-specific query probing. In: Proceedings of theThirtieth international conference on Very large data bases-Volume 30. pp. 408–419. VLDB Endowment (2004)
[274] Wang, Y.Y., Acero, A.: Combination of cfg and n-gram modeling in semanticgrammar learning. In: INTERSPEECH (2003)
[275] Wang, Y.Y., Deng, L., Acero, A.: Spoken language understanding. Signal Pro-cessing Magazine, IEEE 22(5), 16–31 (2005)
[276] Wang, Y.Y., Waibel, A.: Decoding algorithm in statistical machine translation.In: Proceedings of the 35th Annual Meeting of the Association for Computa-tional Linguistics and Eighth Conference of the European Chapter of the Asso-ciation for Computational Linguistics. pp. 366–372 (1997)
[277] Weidlich, M., Dijkman, R.M., Mendling, J.: The ICoP framework: Identifica-tion of correspondences between process models. In: International Conferenceon Advanced Information Systems Engineering. pp. 483–498. Springer (2010)
[278] Weidlich, M., Mendling, J.: Perceived consistency between process models. In-formation Systems 37(2), 80–98 (2012)
[279] Weidlich, M., Mendling, J., Weske, M.: Efficient consistency measurementbased on behavioral profiles of process models. IEEE Transactions on SoftwareEngineering 37(3), 410–429 (2011)
[280] Weidlich, M., Mendling, J., Weske, M.: Propagating changes between alignedprocess models. Journal of Systems and Software 85(8), 1885–1898 (2012)
[281] Weidlich, M., Polyvyanyy, A., Desai, N., Mendling, J.: Process compliancemeasurement based on behavioural profiles. In: International Conference on Ad-vanced Information Systems Engineering. pp. 499–514. Springer (2010)

164 BIBLIOGRAPHY
[282] Weidlich, M., Polyvyanyy, A., Desai, N., Mendling, J., Weske, M.: Processcompliance analysis based on behavioural profiles. Information Systems 36(7),1009–1025 (2011)
[283] Weidlich, M., Sagi, T., Leopold, H., Gal, A., Mendling, J.: Predicting the qualityof process model matching. In: International Conference on Business ProcessManagement, pp. 203–210. Springer (2013)
[284] Weidlich, M., Sheetrit, E., Branco, M.C., Gal, A.: Matching business processmodels using positional passage-based language models. In: International Con-ference on Conceptual Modeling. pp. 130–137. Springer (2013)
[285] Weidlich, M., Weske, M., Mendling, J.: Change propagation in process mod-els using behavioural profiles. In: Services Computing, 2009. SCC’09. IEEEInternational Conference on. pp. 33–40. IEEE (2009)
[286] Wetzstein, B., Ma, Z., Leymann, F.: Towards measuring key performance in-dicators of semantic business processes. In: Business Information Systems. pp.227–238. Springer (2008)
[287] Wolter, C., Meinel, C.: An approach to capture authorisation requirements inbusiness processes. Requirements engineering 15(4), 359–373 (2010)
[288] Woods, W.A.: Semantics and quantification in natural language question an-swering. Advances in computers 17, 1–87 (1978)
[289] Xia, F., Palmer, M.: Converting dependency structures to phrase structures. In:Proceedings of the first international conference on Human language technologyresearch. pp. 1–5. Association for Computational Linguistics (2001)
[290] Yu, H., Hatzivassiloglou, V.: Towards answering opinion questions: Separat-ing facts from opinions and identifying the polarity of opinion sentences. In:Proceedings of the 2003 conference on Empirical methods in natural languageprocessing. pp. 129–136. Association for Computational Linguistics (2003)
[291] Yujian, L., Bo, L.: A normalized levenshtein distance metric. IEEE transactionson pattern analysis and machine intelligence 29(6), 1091–1095 (2007)
[292] Zaiß, K., Schluter, T., Conrad, S.: Instance-based ontology matching using regu-lar expressions. In: OTM Confederated International Conferences” On the Moveto Meaningful Internet Systems”. pp. 40–41. Springer (2008)
[293] Zhang, W., Sim, Y.C., Su, J., Tan, C.L.: Entity linking with effective acronymexpansion, instance selection, and topic modeling. In: IJCAI. vol. 2011, pp.1909–1914 (2011)
[294] Zmud, R.W.: Remarks from MIS Quarterly editor. MIS Quarterly 21(2), 261–290 (1997)