comparative study of ndvi and savi …€¦ · comparative study of ndvi and savi vegetation...
TRANSCRIPT

http://www.iaeme.com/IJCIET/index.asp 559 [email protected]
International Journal of Civil Engineering and Technology (IJCIET) Volume 8, Issue 4, April 2017, pp. 559–566 Article ID: IJCIET_08_04_063 Available online at http://www.iaeme.com/IJCIET/issues.asp?JType=IJCIET&VType=8&IType=4 ISSN Print: 0976-6308 and ISSN Online: 0976-6316 © IAEME Publication Scopus Indexed
COMPARATIVE STUDY OF NDVI AND SAVI VEGETATION INDICES IN ANANTAPUR
DISTRICT SEMI-ARID AREAS Vani V
Center for Disaster Mitigation and Management (CDMM), VIT University, Vellore, Tamilnadu, India
Venkata Ravibabu Mandla OS-GST Lab, Department of Environmental and Water Resources Engineering
School of Civil and Chemical Engineering, VIT University, Vellore, Tamilnadu, India
ABSTRACT Remote sensing data is very important source for monitoring and mapping
vegetation cover. The various vegetation Indices (VI) are developed to monitor the vegetation distribution and vegetation phenology. Normalized Difference Vegetation Index (NDVI) is most commonly used vegetation index where, NDVI has limitation density vegetation cover with low and medium levels. The Soil-Adjusted Vegetation Index (SAVI) combination of slope-based and distance based vegetation indices often mentioned as Optimized indices. The aim of this paper is to compare NDVI and SAVI with different land use. The study area Anantapur district is a semiarid zone and selected 200 samples with different land cover are selected. The Land sat images are used for this study and the value of the indices was compared. Results showed that the soil factor of 0.2, 0.5 and 0.9 was comparable to NDVI result when the 0.5 is best suited with vegetation and 0.9 is best suited soil factor for the land where the soil influence is more. The SAVI is best suited vegetation index in semi arid areas.
Key words: Vegetation, Comparison, Normalized Difference Vegetation Index, Soil-Adjusted Vegetation Index.
Cite this Article: Vani V and Venkata Ravibabu Mandla, Comparative Study of NDVI and SAVI Vegetation Indices in Anantapur District Semi-Arid Areas. International Journal of Civil Engineering and Technology, 8(4), 2017, pp. 559–566. http://www.iaeme.com/IJCIET/issues.asp?JType=IJCIET&VType=8&IType=4
1. INTRODUCTION Semi-arid areas are characterized as low rainfall up to 700mm per annum, with frequent droughts. These may affect the vegetative cover as diverse affiliations. Accurate estimation of vegetation is essential for any improvements and monitoring the drought conditions. There is a difficult in acquiring the data for entire regions using traditional methods where need of high qualified people with vast information from that area, It is a time and cost effective

Vani V and Venkata Ravibabu Mandla
http://www.iaeme.com/IJCIET/index.asp 560 [email protected]
work. Remote sensing technology can provide the vegetation information with multi-temporal time series. Remote sensing data used for monitoring the vegetation phenology and health condition. It is economically feasible for measuring the vegetation production in large areas.
Vegetation Indices (VI) derived from the satellite sensor data have been using to estimate vegetation cover, Normalized Difference Vegetation Index (NDVI) is most widely used vegetation quality (health condition) and spread area (quantity) [1]. NDVI was introduced by Rousil (1973), NDVI algorithm based on the vegetation phenology as the green vegetation reflects less in visible light and more in NIR, where sparse vegetation reflects a great portion of visible and less portion of NIR. Combining the ratio of these reflectance gives the NDVI value. The non-linear relationship between biophysical properties and soil background sensitivity the NDVI has such limitations where the soil influence is more [2]. To minimize the soil brightness influences in spectral vegetation indices a transformation technique is developed called as Soil Adjusted Vegetation Index (SAVI)[3]. In this index the red and NIR spectral wavelengths are used and the graphically transformation involves. It can nearly eliminates the soil influences in vegetation indices.
NDVI and SAVI have a long record of merit within the remote sensing of vegetation which is used by many researchers. The adequacy of SAVI vegetation index is more over NDVI for semi arid areas with landsat 30m resolution data.[3] In this study Landsat data was used in temporal series and computing the NDVI and SAVI to analyze the influence of the soil factor. The analyzing these vegetation indices the ground truth land cover maps are used with different years.
2. STUDY AREA AND DATA The study area is on Andhra Pradesh which is a state of India. Area of the district is 19,197 (sq km). The Anantapur district lies between 13o30' and 15o-15 'latitudes, 76 o -50'and 78 o -30' longitudes. (fig.1) Anantapur District is in the arid agro-ecological zone and is marked by hot arid bioclimatic condition with dry summers and mild winters.
The Data used for this study was satellite images. The U.S. LANDSAT series in different years presented in table.1 and the LULC maps for 2005-06 and 2011-12 for identify the sample land cover type.
All Landsat images used in this study were provided by the USGS and downloaded from website. These products are processed geometric and atmospheric corrections and application-ready data sets.
Figure 1 Study area Anantapur district in false color composite image of Landsat 8
Comparative Study of NDVI and SAVI Vegetation Indices in Anantapur District Semi-Arid Areas
http://www.iaeme.com/IJCIET/index.asp 561 [email protected]
Table 1 Satellite images used in the study
Image Satellite/Sensor Acquision Resolution (m)
1 2 3 4
Landsat-8 OLI 28 Oct 2015 19April 2015 16 April 2014 13 April 2013
30
5 Landsat-7 ETM+ 26 Oct 2000 30
6 Landsat-5 9 Sep 2008 30
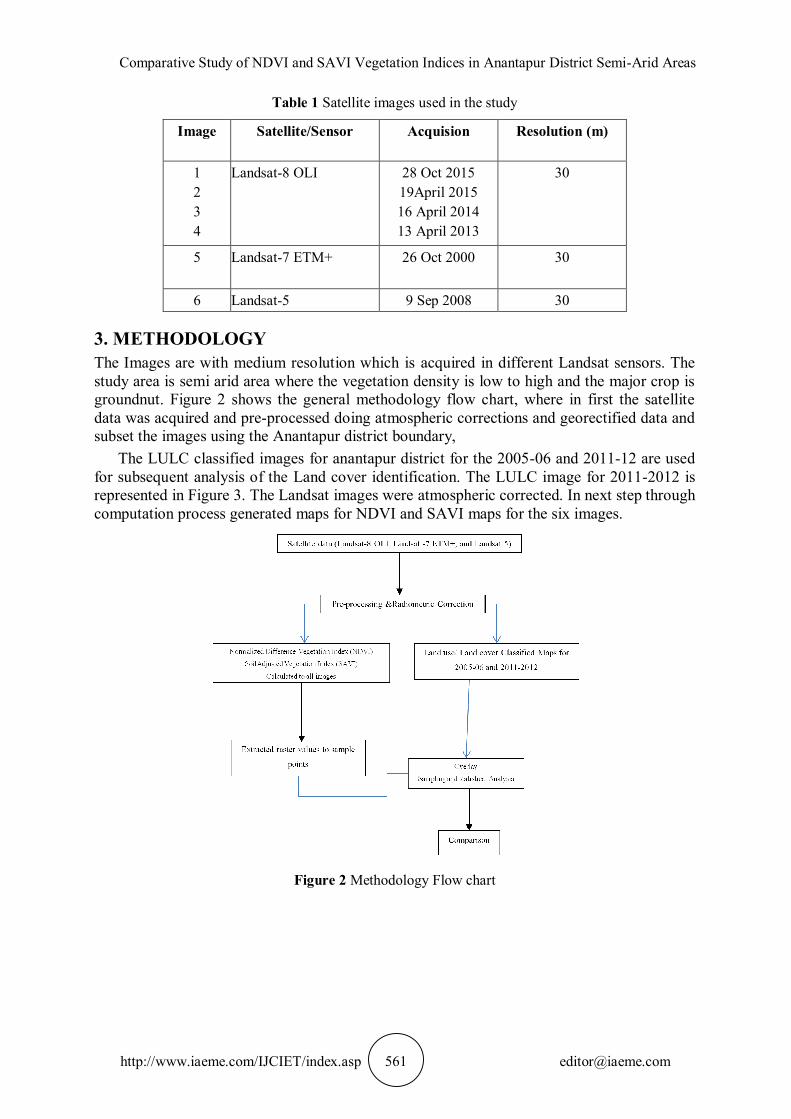
3. METHODOLOGY The Images are with medium resolution which is acquired in different Landsat sensors. The study area is semi arid area where the vegetation density is low to high and the major crop is groundnut. Figure 2 shows the general methodology flow chart, where in first the satellite data was acquired and pre-processed doing atmospheric corrections and georectified data and subset the images using the Anantapur district boundary,
The LULC classified images for anantapur district for the 2005-06 and 2011-12 are used for subsequent analysis of the Land cover identification. The LULC image for 2011-2012 is represented in Figure 3. The Landsat images were atmospheric corrected. In next step through computation process generated maps for NDVI and SAVI maps for the six images.
Figure 2 Methodology Flow chart

Vani V and Venkata Ravibabu Mandla
http://www.iaeme.com/IJCIET/index.asp 562 [email protected]
Figure 3 Anantapur District map with sample locations
3.1. Normalized Difference Vegetation Index (NDVI) NDVI is widely used vegetation index for its simplicity in calculation, easy to interpret and its ability to partially compensate the effects of atmosphere, geometry etc[5]. The Normalized Difference Vegetation Index is first used by Rouse [6]. The NDVI is a measure of the vigor of vegetation.
NDVI is derived as : = ( − )/( + ) Eq (1)
Where, NIR - Near Infra Red and RED - RED are the reflectance in the spectral bands. It is a good indicator of vegetation, crop production, forest canopy and patterns of the
crop seasons. The NDVI values range from –1 to +1.
3.2. Soil Adjusted Vegetation Index (SAVI) NDVI is non-linear relationship with biophysical characteristics, and sensitivity to soil background is the major drawback. Minimizing the effects of external factors from spectral vegetation indices a transformation technique is presented. It involves the red and NIR Spectral bands and the graphically transformation involves the shift in origin of NIR and Red reflectance in vegetated canopies. This transformation eliminates soil influences in indices.
=−
+ +∗ (1 + L) Eq (2)
Where, NIR and RED are the reflectance in spectral bands, L is the parameter which is constant value [3]. Three values of the soil factors were used for SAVI calculation. they are 0.2, 0.5 and 0.9
3.3. Sampling and Statistical Analysis In order to establish relationship between the NDVI and SAVI values with the corresponding land type, sampling technique is used for the study area. Hear 200 sample points were randomly selected from different land type in the image. Extracted these sample points pixel values for NDVI and SAVI layers from different images using ARCGIS software and calculated the average value for the each land use. These values are used for comparison. To

Comparative Study of NDVI and SAVI Vegetation Indices in Anantapur District Semi-Arid Areas
http://www.iaeme.com/IJCIET/index.asp 563 [email protected]
validate the analysis compared them with the lulc maps which are already prepared by using ground truth information.
Figure 4 Anantapur District LULC map for year 2011-12
4. RESULTS AND DISCUSSION The study area is mainly classified into six land types. For all these six classes 30 samples are selected and the observed the values of these cites between NDVI and SAVI indices. Figure 5 depict the results obtained for the NDVI and SAVI comparing with land class for different time series. For this study the images were taken in the production period of the crop, for Kharif season October and November data ( 26 Oct 2000, 9 Nov 2008 and 28 Oct 2015) and ending of the second season (rabi) data sets (13 April 2013, 16 April 2014 and 19 April 2015) data. The SAVI and NDVI are highly correlated by vegetation values of R2 of 0.999. The SAVI is a complementary to the NDVI where vegetation and forest cover is present in land cover where 15% of pixels are covered by vegetation. The background soil influence the NDVI values where the sparse vegetation is dominated in the land cover [7].
Vani V and Venkata Ravibabu Mandla
http://www.iaeme.com/IJCIET/index.asp 564 [email protected]
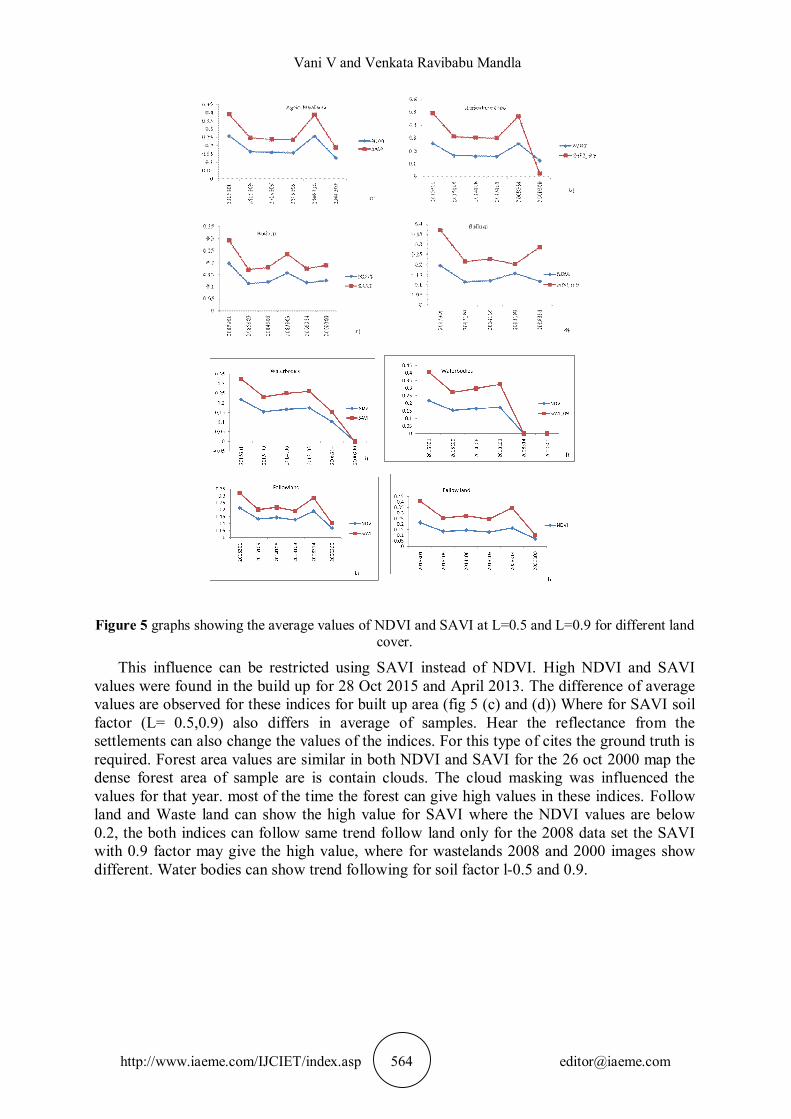
Figure 5 graphs showing the average values of NDVI and SAVI at L=0.5 and L=0.9 for different land cover.
This influence can be restricted using SAVI instead of NDVI. High NDVI and SAVI values were found in the build up for 28 Oct 2015 and April 2013. The difference of average values are observed for these indices for built up area (fig 5 (c) and (d)) Where for SAVI soil factor (L= 0.5,0.9) also differs in average of samples. Hear the reflectance from the settlements can also change the values of the indices. For this type of cites the ground truth is required. Forest area values are similar in both NDVI and SAVI for the 26 oct 2000 map the dense forest area of sample are is contain clouds. The cloud masking was influenced the values for that year. most of the time the forest can give high values in these indices. Follow land and Waste land can show the high value for SAVI where the NDVI values are below 0.2, the both indices can follow same trend follow land only for the 2008 data set the SAVI with 0.9 factor may give the high value, where for wastelands 2008 and 2000 images show different. Water bodies can show trend following for soil factor l-0.5 and 0.9.

Comparative Study of NDVI and SAVI Vegetation Indices in Anantapur District Semi-Arid Areas
http://www.iaeme.com/IJCIET/index.asp 565 [email protected]
Figure 6 NDVI and SAVI with (L=0.2 &L-0.9) profiles calculated by Land sat data and data for the six land use classes used in this study. Each profile was averaged from 30 samples extracted from
each class.
The profiles of NDVI and SAVI with six land use classes were prepared. Each profile was averaged with 30 samples extracted from each class. The land classes are Water bodies, Build up, Fallowland, Wasteland, Agricultural land and Forest. These profiles are prepared for individual years (fig 6). In general, NDVI and SAVI perform well indicators for vegetation coverage. In both indices the forest cover shows high values, were the trend difference for forest cover is similar in all the data sets, water bodies for 2014 image shows the different due to the water values near to 0. where the Waste lands shows the down peak for SAVI_0.9 because of the soil influence on the reflectance the NDVI and SAVI with 0.5 shows high value the SAVI-0.9 eliminate the background soil effect and gives the accurate values for this type of sites. The agriculture area samples are taken from both two seasons’ data, the major crop of the study area is ground nut which grows very low height (as shrub). The values of the agriculture for NDVI is low compare to SAVI. The SAVI with l=0.9 gives the high values for agriculture and these values distinguish the Wasteland, Fallowland with agriculture lands.
5. CONCLUSIONS The Vegetation studies for global studies NDVI is suitable index. When the study was limited for region scale the resolution of the datasets are more, so the background effects may increase and influence in the index values. To eliminate such effects more indices are developed. SAVI such type of index, which is developed to eliminate the soil factor on vegetation reflectance. The difference is that SAVI use soil-adjustment factors. It is a manual adjustment L. The L functions not only increases dynamic range of vegetation, also reduce the soil background variations. At higher vegetation like forest cover the L approaches 0 and behave like the NDVI, while at low vegetation covers, the L approaches 1, and different to NDVI. Where the intermediate vegetation cover the L approaches 0.5 factor. At very high vegetation cover NDVI alone sufficient to study about the vegetation cover. However, low

Vani V and Venkata Ravibabu Mandla
http://www.iaeme.com/IJCIET/index.asp 566 [email protected]
vegetation cover the NDVI is strongly affected with soil background. There SAVI is most suitable vegetation index.
This study shows that in Semi arid area where soil background is more the SAVI vegetation index is more suitable over the popular NDVI especially in medium spatial resolution. The soil factor 0.9 is more useful for the low vegetation cover areas.
REFERENCES
[1] Miura, T., Huete, A., & Yoshioka, H. (2006). An empirical investigation of cross-sensor relationships of NDVI and red/near-infrared reflectance using EO-1 Hyperion data. Remote Sensing of Environment, 100(2), 223–236. http://doi.org/10.1016/j.rse.2005.10.010
[2] Gitelson, A.A., (2013) Remote estimation of crop fractional vegetation cover: The use of noise equivalent as an indicator of performance of vegetation indices. International Journal for Remote Sensing.,34, 6054–6066.
[3] Battay, A. El. (2013). Comparative Study of SAVI and NDVI Vegetation Indices in Sulaibiya Area (Kuwait) Using Worldview Satellite Imagery, . International Journal of Geosciences and Geomatics.,50, ISSN:2052-5591
[4] Huete A.R., (1988), A Soil-Adjusted Vegetation Index (SAVI), Remote sensing of Environment, 25:295-309,295
[5] Kogan, F. (2002). World droughts in the new millennium from AVHRR-based vegetation health indices .Eos, Transactions American Geophysical Union, 83(48), 557. https://doi.org/10.1029/2002EO000382
[6] Rouse, J.W., Haas, R.H., Deering, D.W., and Sehell, J.A. 1974. Monitoring the vernal advancement and metro gradation (Green wave effect) of natural vegetation. Final Rep. RSC 1978–4, Remote Sensing Center, Texas A&M Univ., College Station
[7] Anderson, J. H., Weber, K. T., Gokhale, B., & Chen, F. (2011).Inter calibration and Evaluation of ResourceSat-1 and Landsat-5 NDVI, Canidian Journal of Remote Sensing,37(2), 213–219.