comparative study of interannual changes of the mean winds and gravity wave activity in the middle...
TRANSCRIPT
Journal of Atmospheric and Solar-Terrestrial Physics 64 (2002) 1003–1010www.elsevier.com/locate/jastp
Comparative study of interannual changes of the mean windsand gravity wave activity in the middle atmosphere over
Japan, Central Europe and Canada
Nikolai M. Gavrilova ; ∗, Shoichiro Fukaob, Takuji Nakamurab, Christoph Jacobic,Dierk K2urschnerc, Alan H. Mansond, Chris E. Meekd
aAtmospheric Physics Department, Saint-Petersburg University, 1 Ul’janovskaja St, Petrodvorets 198904, Saint Petersburg, RussiabRadio Science Center for Space and Atmosphere, Kyoto University, Uji, Kyoto 611, Japan
cUniversity of Leipzig, 04103, Leipzig, GermanydInstitute of Space and Atmospheric Science, University of Saskatchewan, Saskatoon, S7NOWO, SK, Canada
Abstract
Results are presented of measurements of the mean wind and its variances attributed to the intensity of internal gravitywaves (IGWs) with the MU radar at Shigaraki, Japan, from 1986 to 1999, with the low-frequency ionospheric drift methodDl at Collm, Germany and with the medium frequency (MF) radar at Saskatoon, Canada, between 1983 and 1999 at altitudes65–80, 80–110 and 60–100 km, respectively. The amplitudes of eastward–westward seasonal variations of the mean zonalwind in the mesosphere and lower thermosphere are di=erent in di=erent years. The mean wind and IGW intensities showsubstantial seasonal, quasi-biennial and interannual variations, which may be di=erent at di=erent altitudes. The measurementsshow di=erences in the interannual changes, IGW intensities at di=erent locations. Comparison of interannual changes of thewind and drift velocity variances reveal substantial di=erences between Saskatoon and Collm and Shigaraki. Such di=erencesin seasonal and interannual changes in the wind perturbation variances may be attributed to the changes in the strengths ofIGW sources in the atmosphere at di=erent altitudes and locations and with the conditions of wave propagation in the lower,middle and upper atmosphere. Among the possible reasons for these changes could be solar activity, the eruption of thePinatubo volcano in June 1991 and, probably, interannual changes of the temperature of oceans in tropics (El Nin2o events)on the circulation of the middle and upper atmosphere. c© 2002 Published by Elsevier Science Ltd.
Keywords: Middle atmosphere; Radars; Winds; Gravity waves; Climatology
1. Introduction
Internal gravity waves (IGWs) are very important forthe dynamical regime of the middle and upper atmosphere.Propagating from below, they may produce turbulence andsubstantial deposits of momentum and energy and in@uencethe general circulation, thermal regime, and composition ofthe middle and upper atmosphere (Andrews et al., 1987).
∗ Corresponding author. Tel.: +7-812-428-4489; fax: +7-812-428-7240.
E-mail address: [email protected] (N.M. Gavrilov).
Due to these reasons, IGWs have been studied extensivelyduring the last decades (see reviews by Fritts, 1984; Hirota,1997; McLandress, 1998).
Considerable information about IGWs has been obtainedwith radar technique (Vincent, 1984; Fritts and Vincent,1987), and particularly with the medium frequency (MF)radar at Saskatoon, Canada (52◦N; 107◦W) at altitudes60–100 km (Ebel et al., 1987; Manson and Meek, 1993;Gavrilov et al., 1995; Manson et al., 1999).
Since 1986, extensive studies of winds and IGWs in themiddle atmosphere have been performed with the Middleand Upper (MU) atmosphere radar at Shigaraki, Japan(35◦N; 136◦E) at altitudes 65–85 km (Tsuda et al., 1990;
1364-6826/02/$ - see front matter c© 2002 Published by Elsevier Science Ltd.PII: S1364 -6826(02)00055 -X
1004 N.M. Gavrilov et al. / Journal of Atmospheric and Solar-Terrestrial Physics 64 (2002) 1003–1010
Nakamura et al., 1993a, b, 1996; Gavrilov et al., 1996,1997). These observations use Fve radar antenna beamssimultaneously (one vertical and four oblique) and providean opportunity to study IGW intensity and components ofthe vertical @ux of horizontal momentum using a traditionaltechnique (Vincent and Reid, 1983; Vincent and Fritts,1987; Fukao et al., 1988).
At the Collm Observatory of the University of Leipzig,Germany (52◦N; 15◦E) continuous ionospheric drift veloc-ity measurements have been performed in the altitude rangebetween 80 and 110 km (Schminder and K2urschner, 1984;Jacobi et al., 1997a, b). Extensive studies of winds in thelower thermosphere were conducted using correspondingfadings of low-frequency (LF) radio wave propagating fromtransmitters at the earth surface through the lower ionosphereto a closely spaced antenna array (D1 method, Schminderand K2urschner, 1984), which allows average sampling den-sities of one drift velocity value per minute or more. Since1982, the virtual re@ection heights of radio waves have alsobeen measured simultaneously (K2urschner et al., 1987). At-mospheric winds and ionospheric drifts reveal @uctuationswith periods fromminutes to hours, which may be connectedwith the propagation of IGWs in the lower thermosphere.
In this paper we compare multiyear observations of vari-ances of @uctuations of atmospheric winds and drift veloc-ities in the mesosphere and lower ionosphere having timescales from minutes to several hours and measured with theMU radar in Japan, the D1 drift method in Germany andthe MF radar in Canada.
2. Method of data analysis
The details of the statistical analysis, which has been usedfor our studies of IGW climatology from the MU radar dataare described by Gavrilov et al. (2000). We applied standardnumerical Fltering by averaging the daily series of wind val-ues observed by the MU radar over Fxed time intervals, T ,with Hann window function (see Gavrilov et al., 2000). Bycombining Flters with T = 10 min; 1 and 6 h, we can getinformation about wind variations with periods 0.2–1 and1–6 h, respectively. Below we will refer to these frequencyranges as WH (within hour) and MP (medium period) com-ponents. To make the Fltering more reliable we chooseonly data sets having less than 60% gaps. To calculate themean wind and MP component we use only daily data setslonger than 6 h. Characteristics of WH component are cal-culated for all data sets longer than 1 h. With such require-ments, the numbers of days of the MU radar observations in1986–1997 used in our analysis are 343 for the mean windand MP component and 427 for WH component. For Saska-toon data similar numerical Fltering was applied to get thesame WH and HD (hourly di=erence) components havingperiods 0.1–1 and 1–4 h (see Gavrilov et al., 1995).
At Collm, an algorithmized form of the similar-fademethod is used to determine the velocity of ionospheric drift
motions from the time shifts of the fading curves at threereceivers. The data are combined to half-hourly zonal andmeridional mean drift velocity values. Often no half-hourlymeans can be obtained during daylight hours due to strongradiowave absorption. This results in a total of about 700or 1200 half-hourly mean values per month in summer andwinter, respectively. In the present study we use only datafor the frequency 177 kHz after 1983, for which we havealso half-hourly mean values of the re@ection heights z.
To estimate the intensity of drift velocity perturbationswe use a simple numerical Flter calculating di=erences ofsuccessive half-hourly drift velocities, and taking only pairswith di=erences of their heights being less than 3 km to mini-mize possible apparent wind variations due to height changesin the case of vertical gradients of the mean winds. Calcula-tion of such di=erences combined with previous half-hourlyaveraging of the data are equivalent to a numerical Flterpassing harmonics with periods 0.7–3 h with a maximum ata period of about 1 h.
After such Fltering the Collm results are arranged inheight overlapping layers of 10 km thickness. For each layerwe calculate monthly mean values of zonal and meridionaldrift velocities, and also the respective variances of theirperturbations. In addition, we calculate the mean heights foreach layer, which can di=er from its nominal values due todi=erent real distributions of re@ection heights during theexperiments. Note that no decomposition of the wind Feldinto prevailing and tidal winds was performed. Therefore,the mean wind values obtained in our study for Collm maydi=er from those presented, e.g., by Jacobi et al. (1997b).
We use the observations with the MU radar in years from1986 to 1997, with Saskatoon MF radar and Collm D1 driftmethod from 1983 to 1999 to study average seasonal vari-ations of IGW characteristics at the altitudes 60–110 km.
3. Results of measurements
Fig. 1 shows the average seasonal changes of wind vari-ances representing IGW intensities for altitudes of 70 and75 km observed with the MU radar. One can see the mainmaximum in summer and the second maximum in win-ter, the winter maximum being comparable with the sum-mer one. The same seasonal variations of IGW intensity inthe mesosphere were observed by Tsuda et al. (1990) andNakamura et al. (1993a, b, 1996);
Fig. 2 represents the seasonal changes of variances ofionospheric drift velocities at Collm. At the lowest altitude(83 km) one can see seasonal changes of zonal variancewith the minimum values of u′2 near the equinoxes, the mainmaximum in summer, and a smaller maximum in winter.This is consistent with the character of seasonal variations ofgravity wave activity in the mesosphere, which was observedwith the Japanese MU radar and shown in Fig. 1. At largeraltitudes in Fig. 2 one can see a shift of the maximum ofu′2 towards the spring months, and the formation of another
N.M. Gavrilov et al. / Journal of Atmospheric and Solar-Terrestrial Physics 64 (2002) 1003–1010 1005
0 3 6 9 120
40
80
120
u'2wh,m2s-2
0 3 6 9 120
40
80
120
v'2wh,m2s-2
0 3 6 9 12Month of Year
0
40
80
120
u'2mp,m2s-2
0 3 6 9 12Month of Year
0
40
80
120
v'2mp,m2s-2
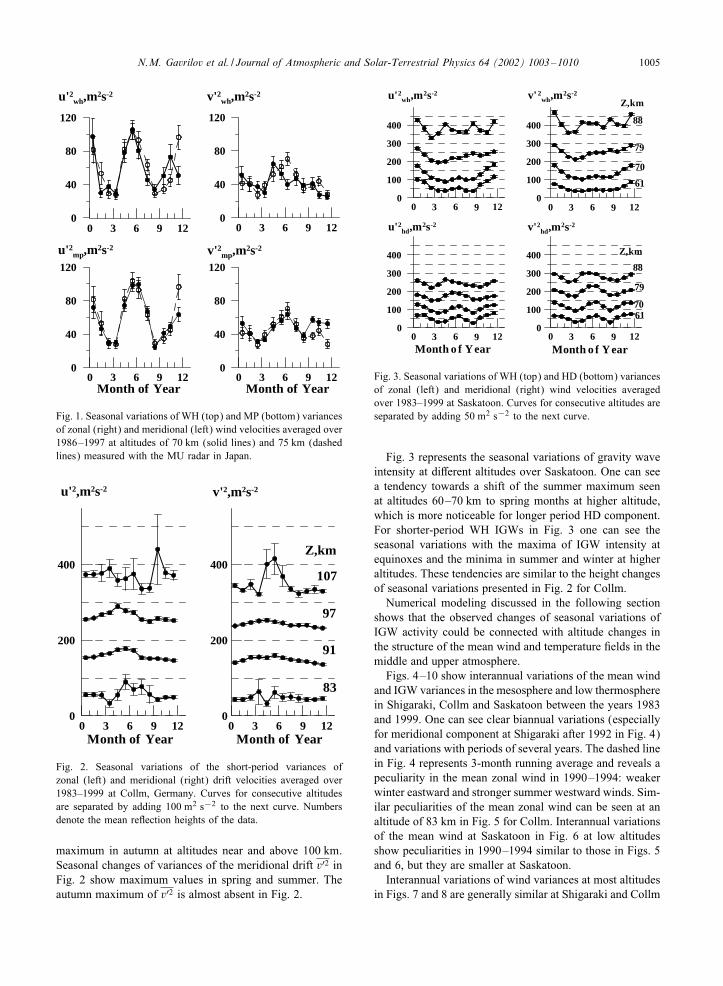
Fig. 1. Seasonal variations of WH (top) and MP (bottom) variancesof zonal (right) and meridional (left) wind velocities averaged over1986–1997 at altitudes of 70 km (solid lines) and 75 km (dashedlines) measured with the MU radar in Japan.
0 3 6 9 12Month of Year
0
200
400
u'2,m2s-2
0 3 6 9 12Month of Year
0
200
400
v'2,m2s-2
Z,km
107
97
91
83
Fig. 2. Seasonal variations of the short-period variances ofzonal (left) and meridional (right) drift velocities averaged over1983–1999 at Collm, Germany. Curves for consecutive altitudesare separated by adding 100 m2 s−2 to the next curve. Numbersdenote the mean re@ection heights of the data.
maximum in autumn at altitudes near and above 100 km.Seasonal changes of variances of the meridional drift v′2 inFig. 2 show maximum values in spring and summer. Theautumn maximum of v′2 is almost absent in Fig. 2.
Month o f Year
0
100
200
300
400
u'2hd,m2s-2
Month o f Year
0
100
200
300
400
v'2hd,m2s-2
0 6 120
100
200
300
400
u'2wh,m2s-2 v' 2
wh,m2s-2
0
100
200
300
400
Z,km
61
70
79
88
6170
79
88
Z,km
3 9
0 6 123 9 0 6 123 9
0 6 123 9
Fig. 3. Seasonal variations of WH (top) and HD (bottom) variancesof zonal (left) and meridional (right) wind velocities averagedover 1983–1999 at Saskatoon. Curves for consecutive altitudes areseparated by adding 50 m2 s−2 to the next curve.
Fig. 3 represents the seasonal variations of gravity waveintensity at di=erent altitudes over Saskatoon. One can seea tendency towards a shift of the summer maximum seenat altitudes 60–70 km to spring months at higher altitude,which is more noticeable for longer period HD component.For shorter-period WH IGWs in Fig. 3 one can see theseasonal variations with the maxima of IGW intensity atequinoxes and the minima in summer and winter at higheraltitudes. These tendencies are similar to the height changesof seasonal variations presented in Fig. 2 for Collm.
Numerical modeling discussed in the following sectionshows that the observed changes of seasonal variations ofIGW activity could be connected with altitude changes inthe structure of the mean wind and temperature Felds in themiddle and upper atmosphere.
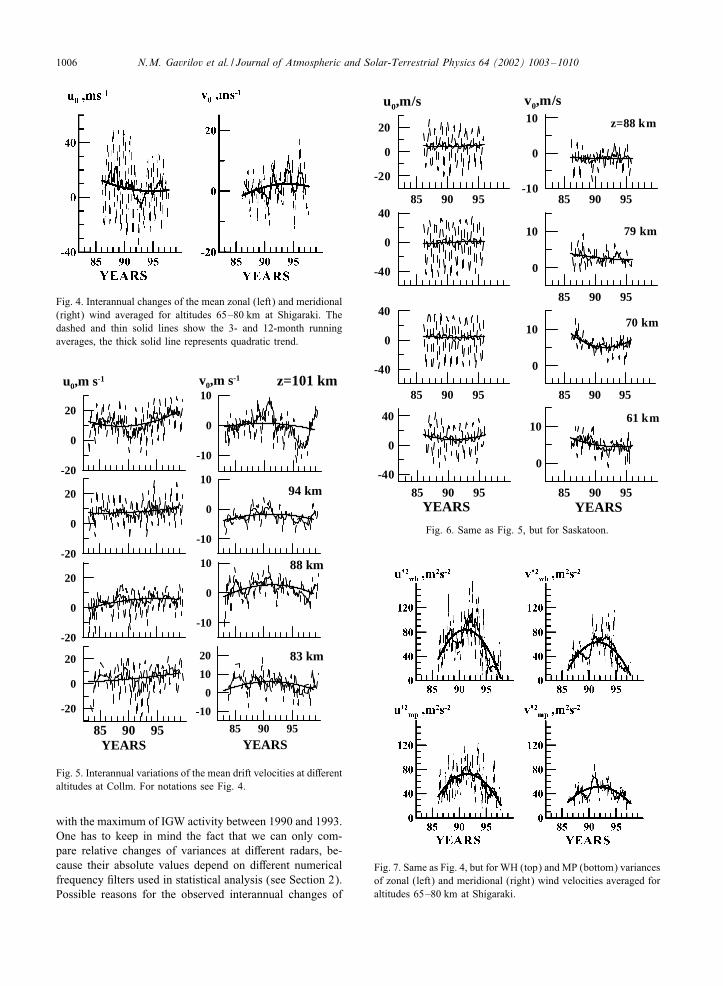
Figs. 4–10 show interannual variations of the mean windand IGW variances in the mesosphere and low thermospherein Shigaraki, Collm and Saskatoon between the years 1983and 1999. One can see clear biannual variations (especiallyfor meridional component at Shigaraki after 1992 in Fig. 4)and variations with periods of several years. The dashed linein Fig. 4 represents 3-month running average and reveals apeculiarity in the mean zonal wind in 1990–1994: weakerwinter eastward and stronger summer westward winds. Sim-ilar peculiarities of the mean zonal wind can be seen at analtitude of 83 km in Fig. 5 for Collm. Interannual variationsof the mean wind at Saskatoon in Fig. 6 at low altitudesshow peculiarities in 1990–1994 similar to those in Figs. 5and 6, but they are smaller at Saskatoon.
Interannual variations of wind variances at most altitudesin Figs. 7 and 8 are generally similar at Shigaraki and Collm
1006 N.M. Gavrilov et al. / Journal of Atmospheric and Solar-Terrestrial Physics 64 (2002) 1003–1010
Fig. 4. Interannual changes of the mean zonal (left) and meridional(right) wind averaged for altitudes 65–80 km at Shigaraki. Thedashed and thin solid lines show the 3- and 12-month runningaverages, the thick solid line represents quadratic trend.
85 90 95YEARS YEARS
-20
0
20
85 90 95
-10
0
10
20
-20
0
20
-10
0
10 88 km
83 km
-20
0
20
-10
0
10-20
0
20
u0,m s-1
-10
0
10v0,m s-1 z=101 km
94 km
Fig. 5. Interannual variations of the mean drift velocities at di=erentaltitudes at Collm. For notations see Fig. 4.
with the maximum of IGW activity between 1990 and 1993.One has to keep in mind the fact that we can only com-pare relative changes of variances at di=erent radars, be-cause their absolute values depend on di=erent numericalfrequency Flters used in statistical analysis (see Section 2).Possible reasons for the observed interannual changes of
85 90 95YEARS YEARS
-40
0
40
85 90 95
0
10
85 90 95
-40
0
40
85 90 95
0
10
-40
0
40
85 90 95
0
10
85 90 95-10
0
10v0,m/s
85 90 95
-20
0
20
u0,m/s
z=88 km
79 km
70 km
61 km
Fig. 6. Same as Fig. 5, but for Saskatoon.
Fig. 7. Same as Fig. 4, but for WH (top) and MP (bottom) variancesof zonal (left) and meridional (right) wind velocities averaged foraltitudes 65–80 km at Shigaraki.
N.M. Gavrilov et al. / Journal of Atmospheric and Solar-Terrestrial Physics 64 (2002) 1003–1010 1007
85 90 95YEARS YEARS
50
100
85 90 95
40
80
50
100
40
80 88 km
83 km
50
100
40
80
50
100
u'2,m2s-2
40
80
v'2,m2s-2 z=101 km
94 km
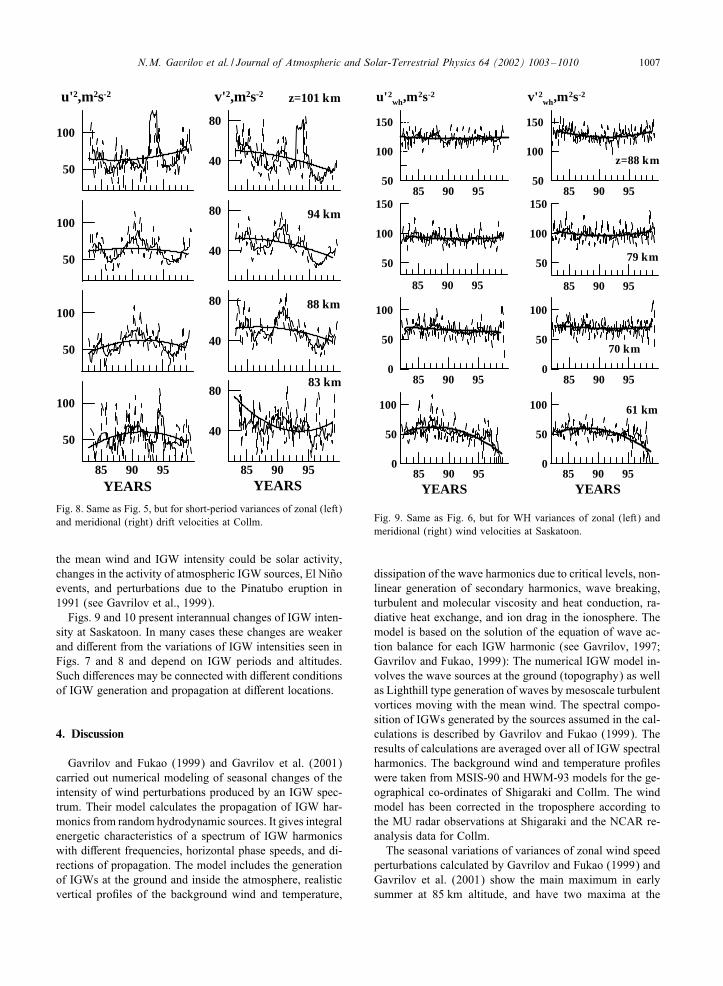
Fig. 8. Same as Fig. 5, but for short-period variances of zonal (left)and meridional (right) drift velocities at Collm.
the mean wind and IGW intensity could be solar activity,changes in the activity of atmospheric IGW sources, El Ninoevents, and perturbations due to the Pinatubo eruption in1991 (see Gavrilov et al., 1999).
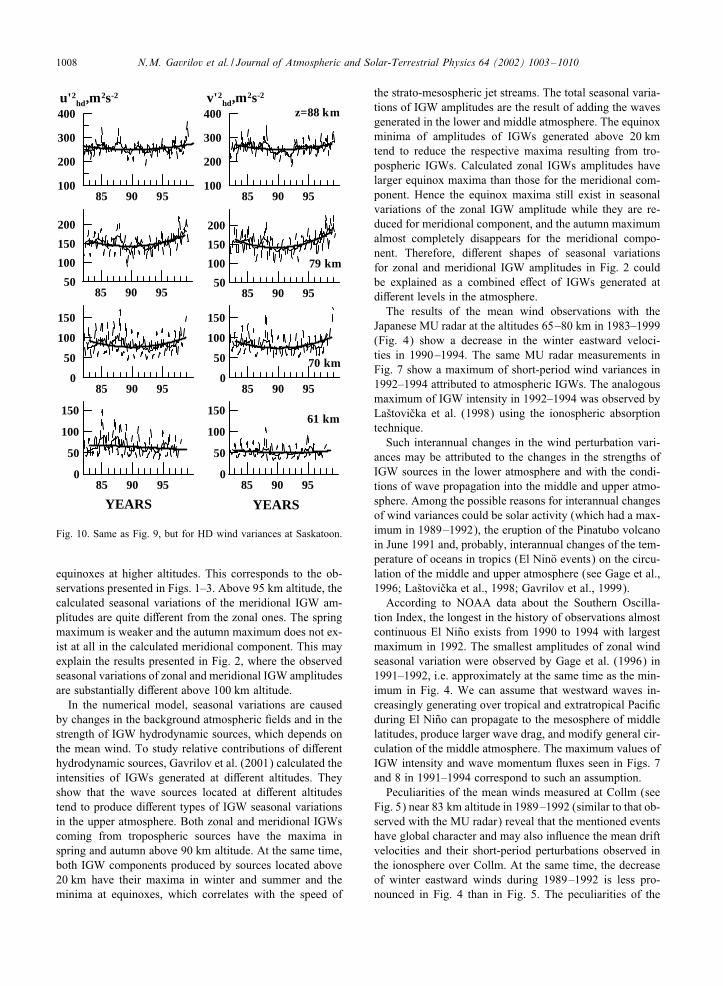
Figs. 9 and 10 present interannual changes of IGW inten-sity at Saskatoon. In many cases these changes are weakerand di=erent from the variations of IGW intensities seen inFigs. 7 and 8 and depend on IGW periods and altitudes.Such di=erences may be connected with di=erent conditionsof IGW generation and propagation at di=erent locations.
4. Discussion
Gavrilov and Fukao (1999) and Gavrilov et al. (2001)carried out numerical modeling of seasonal changes of theintensity of wind perturbations produced by an IGW spec-trum. Their model calculates the propagation of IGW har-monics from random hydrodynamic sources. It gives integralenergetic characteristics of a spectrum of IGW harmonicswith di=erent frequencies, horizontal phase speeds, and di-rections of propagation. The model includes the generationof IGWs at the ground and inside the atmosphere, realisticvertical proFles of the background wind and temperature,
85 90 950
50
100
85 90 950
50
100
85 90 950
50
100
85 90 950
50
100
85 90 95
50
100
150
85 90 95
50
100
15085 90 95
50
100
150
v'2wh,m2s-2
85 90 9550
100
150
u'2wh,m2s-2
z=88 km
79 km
70 km
61 km
YEARS YEARS
Fig. 9. Same as Fig. 6, but for WH variances of zonal (left) andmeridional (right) wind velocities at Saskatoon.
dissipation of the wave harmonics due to critical levels, non-linear generation of secondary harmonics, wave breaking,turbulent and molecular viscosity and heat conduction, ra-diative heat exchange, and ion drag in the ionosphere. Themodel is based on the solution of the equation of wave ac-tion balance for each IGW harmonic (see Gavrilov, 1997;Gavrilov and Fukao, 1999): The numerical IGW model in-volves the wave sources at the ground (topography) as wellas Lighthill type generation of waves by mesoscale turbulentvortices moving with the mean wind. The spectral compo-sition of IGWs generated by the sources assumed in the cal-culations is described by Gavrilov and Fukao (1999). Theresults of calculations are averaged over all of IGW spectralharmonics. The background wind and temperature proFleswere taken from MSIS-90 and HWM-93 models for the ge-ographical co-ordinates of Shigaraki and Collm. The windmodel has been corrected in the troposphere according tothe MU radar observations at Shigaraki and the NCAR re-analysis data for Collm.
The seasonal variations of variances of zonal wind speedperturbations calculated by Gavrilov and Fukao (1999) andGavrilov et al. (2001) show the main maximum in earlysummer at 85 km altitude, and have two maxima at the
1008 N.M. Gavrilov et al. / Journal of Atmospheric and Solar-Terrestrial Physics 64 (2002) 1003–1010
85 90 950
50
100
150
85 90 950
50
100
150
85 90 950
50
100
150
85 90 950
50
100
150
85 90 9550
100
150
200
85 90 9550
100
150
200
85 90 95100
200
300
400v'2
hd,m2s-2
85 90 95100
200
300
400u'2
hd,m2s-2
z=88 km
79 km
70 km
61 km
YEARS YEARS
Fig. 10. Same as Fig. 9, but for HD wind variances at Saskatoon.
equinoxes at higher altitudes. This corresponds to the ob-servations presented in Figs. 1–3. Above 95 km altitude, thecalculated seasonal variations of the meridional IGW am-plitudes are quite di=erent from the zonal ones. The springmaximum is weaker and the autumn maximum does not ex-ist at all in the calculated meridional component. This mayexplain the results presented in Fig. 2, where the observedseasonal variations of zonal and meridional IGW amplitudesare substantially di=erent above 100 km altitude.
In the numerical model, seasonal variations are causedby changes in the background atmospheric Felds and in thestrength of IGW hydrodynamic sources, which depends onthe mean wind. To study relative contributions of di=erenthydrodynamic sources, Gavrilov et al. (2001) calculated theintensities of IGWs generated at di=erent altitudes. Theyshow that the wave sources located at di=erent altitudestend to produce di=erent types of IGW seasonal variationsin the upper atmosphere. Both zonal and meridional IGWscoming from tropospheric sources have the maxima inspring and autumn above 90 km altitude. At the same time,both IGW components produced by sources located above20 km have their maxima in winter and summer and theminima at equinoxes, which correlates with the speed of
the strato-mesospheric jet streams. The total seasonal varia-tions of IGW amplitudes are the result of adding the wavesgenerated in the lower and middle atmosphere. The equinoxminima of amplitudes of IGWs generated above 20 kmtend to reduce the respective maxima resulting from tro-pospheric IGWs. Calculated zonal IGWs amplitudes havelarger equinox maxima than those for the meridional com-ponent. Hence the equinox maxima still exist in seasonalvariations of the zonal IGW amplitude while they are re-duced for meridional component, and the autumn maximumalmost completely disappears for the meridional compo-nent. Therefore, di=erent shapes of seasonal variationsfor zonal and meridional IGW amplitudes in Fig. 2 couldbe explained as a combined e=ect of IGWs generated atdi=erent levels in the atmosphere.
The results of the mean wind observations with theJapanese MU radar at the altitudes 65–80 km in 1983–1999(Fig. 4) show a decrease in the winter eastward veloci-ties in 1990–1994. The same MU radar measurements inFig. 7 show a maximum of short-period wind variances in1992–1994 attributed to atmospheric IGWs. The analogousmaximum of IGW intensity in 1992–1994 was observed byLaOstoviOcka et al. (1998) using the ionospheric absorptiontechnique.
Such interannual changes in the wind perturbation vari-ances may be attributed to the changes in the strengths ofIGW sources in the lower atmosphere and with the condi-tions of wave propagation into the middle and upper atmo-sphere. Among the possible reasons for interannual changesof wind variances could be solar activity (which had a max-imum in 1989–1992), the eruption of the Pinatubo volcanoin June 1991 and, probably, interannual changes of the tem-perature of oceans in tropics (El Nin2o events) on the circu-lation of the middle and upper atmosphere (see Gage et al.,1996; LaOstoviOcka et al., 1998; Gavrilov et al., 1999).
According to NOAA data about the Southern Oscilla-tion Index, the longest in the history of observations almostcontinuous El Nino exists from 1990 to 1994 with largestmaximum in 1992. The smallest amplitudes of zonal windseasonal variation were observed by Gage et al. (1996) in1991–1992, i.e. approximately at the same time as the min-imum in Fig. 4. We can assume that westward waves in-creasingly generating over tropical and extratropical PaciFcduring El Nino can propagate to the mesosphere of middlelatitudes, produce larger wave drag, and modify general cir-culation of the middle atmosphere. The maximum values ofIGW intensity and wave momentum @uxes seen in Figs. 7and 8 in 1991–1994 correspond to such an assumption.
Peculiarities of the mean winds measured at Collm (seeFig. 5) near 83 km altitude in 1989–1992 (similar to that ob-served with the MU radar) reveal that the mentioned eventshave global character and may also in@uence the mean driftvelocities and their short-period perturbations observed inthe ionosphere over Collm. At the same time, the decreaseof winter eastward winds during 1989–1992 is less pro-nounced in Fig. 4 than in Fig. 5. The peculiarities of the
N.M. Gavrilov et al. / Journal of Atmospheric and Solar-Terrestrial Physics 64 (2002) 1003–1010 1009
mean wind variations during 1989–1992 are noticeable, butless marked at Saskatoon (see Fig. 6). A reason for the dif-ferences of the mean wind interannual variations may belarger distances of Collm and Saskatoon from the equatorialPaciFc zone as compared to the MU radar location. There-fore, dynamic processes in equatorial PaciFc (like El Nin2o)may produce larger e=ects over Japan than over Europe andNorthern America.
A comparison of interannual changes of the wind anddrift velocity variances in Figs. 7–10 shows substantial dif-ference between Saskatoon and Collm and Shigaraki. Thismay indicate di=erences in dynamical regime, sources andIGW propagation conditions in di=erent regions. Some dif-ferences were previously found from comparison of the dataof di=erent MF radars and other techniques (Manson et al.,1999). One could suppose that most of the above-mentionedreasons for interannual variations of the mean wind andIGW intensity have global dimensions, and should a=ectSaskatoon station (same latitude as Collm) in a similar way.But according to the observational results presented herethere are substantial di=erences. Probably, one should takeinto account some regional peculiarities, such as di=erencesin orography, planetary waves, circulation patterns and grav-ity wave sources at di=erent continents. Further experimen-tal and theoretical studies are needed for a better understand-ing of the reasons for di=erences in dynamical regimes ofthe middle and upper atmosphere at di=erent latitudes andaltitudes.
One more reason for discrepancies between the results ofdi=erent radars could be di=erences in data coverage dur-ing the days of observations. The measurements with theMU radar (Shigaraki) and D1 method (Collm) are mainlymade during daylight hours, while the Saskatoon MF radarmeasurements above 70 km cover all 24 h of observations.At present, there is no systematic analysis of IGW inten-sity variations during the day at di=erent locations. If suchvariations are substantial and systematic, they may produceadditional di=erences between estimations of IGW intensityat di=erent sites due to di=erent coverage of the data duringthe day.
5. Conclusion
Results of comparison of seasonal and interannualchanges of the intensity of perturbations of wind velocityhaving time scales 0.1–6 h measured with the MU radarin the mesosphere over Shigaraki, Japan, with MF radarat Saskatoon, Canada, and with ionospheric drift velocitymeasured with D1 method at Collm Observatory, Germany,show that all methods provide comparable informationabout seasonal variations of IGW intensity and its heightchanges. The measurements show height changes of heightvariations of IGW intensity, which has a summer and win-ter maximum at altitudes 60–70 km and equinox maxima athigh altitudes. Comparison with the results of IGW numeri-
cal modeling show that such changes in seasonal variationsof IGW intensity may be caused by competition of IGWgeneration by hydrodynamical wave sources located in thelower and middle atmosphere.
Also, the measurements with di=erent radars show dif-ferences in the interannual changes of the mean winds andIGW intensities in di=erent locations. Such di=erences andinterannual changes in the wind perturbation variances maybe attributed to the changes in the strengths of IGW sourcesatmosphere and with the conditions of wave propagation inthe lower, middle and upper atmosphere. Among the pos-sible reasons for these changes could be solar activity, theeruption of the Pinatubo volcano in June 1991 and, prob-ably, interannual changes of the temperature of oceans intropics (El Nin2o events) on the circulation of the middle andupper atmosphere.
Further experimental and theoretical studies are neededfor a better understanding of the reasons for such di=erences.
Acknowledgements
The MU radar belongs to and is operated by the Radio At-mospheric Science Center of Kyoto University. This studywas partly supported by International Association for thepromotion of cooperation with scientists from the New In-dependent States (INTAS) and the Russian Basic ResearchFoundation.
References
Andrews, D.G., Holton, J.R., Leovy, C.B., 1987. MiddleAtmosphere Dynamics. Academic Press, New York.
Ebel, A., Manson, A.H., Meek, C.E., 1987. Short period @uctuationsof the horizontal wind measured in the upper middle atmosphereand possible relationship to internal gravity waves. Journal ofAtmospheric and Terrestrial Physics 49, 385–401.
Fritts, D.C., 1984. Gravity wave saturation in the middleatmosphere: a review of theory and observations. Review inGeophysics and Space Physics 22, 275–308.
Fritts, D.C., Vincent, R.A., 1987. Mesospheric momentum @uxstudies at Adelaide, Australia: observations and a gravitywave-tidal interaction model. Journal of Atmospheric Science44, 605–619.
Fukao, S., Sato, T., Tsuda, T., Kato, S., Inaba, M., Kimura, I., 1988.VHF Doppler radar determination of the momentum @ux in theupper troposphere and lower stratosphere: comparison betweenthe tree- and four-beam methods. Journal of Atmospheric andOceanic Technology 5, 57–69.
Gage, K.S., McAfee, J.R., Williams, C.R., 1996. On the annualvariation of tropospheric zonal winds observed above ChristmasIsland in the central equatorial PaciFc. Journal of GeophysicalResearch 101, 15,061–15,070.
Gavrilov, N.M., 1997. Parameterization of momentum and energydepositions from gravity waves generated by tropospherichydrodynamic sources. Annales Geophysicae 15, 1570–1580.
Gavrilov, N.M., Fukao, S., 1999. A comparison of seasonalvariations of gravity wave intensity observed with the middle
1010 N.M. Gavrilov et al. / Journal of Atmospheric and Solar-Terrestrial Physics 64 (2002) 1003–1010
and upper atmosphere radar with a theoretical model. Journal ofAtmospheric Science 56, 3485–3494.
Gavrilov, N.M., Manson, A.H., Meek, C.E., 1995. Climatologicalmonthly characteristics of middle atmosphere gravity waves(10 min–10 h) during 1979–1993 at Saskatoon. AnnalesGeophysicae 13, 285–295.
Gavrilov, N.M., Fukao, S., Nakamura, T., Tsuda, T., Yamanaka,M.D., Yamamoto, M., 1996. Statistical analysis of gravity wavesobserved with the MU radar in the middle atmosphere: 1. Methodand general characteristics. Journal of Geophysical Research101, 29,511–29,521.
Gavrilov, N.M., Fukao, S., Nakamura, T., Tsuda, T., 1997.Statistical analysis of gravity waves observed with the MU radarin the middle atmosphere: 2. Waves propagated in di=erentdirections. Journal of Geophysical Research 102, 13,433–13,440.
Gavrilov, N.M., Fukao, S., Hashuguchi, H., 1999. Multi-beamMU radar measurements of advective accelerations in theatmosphere. Geophysical Research Letters 26, 315–318.
Gavrilov, N.M., Fukao, S., Nakamura, T., 2000. Gravity waveintensity and momentum @uxes in the mesosphere overShigaraki, Japan (35◦N; 136◦E) during 1986–1997. AnnalesGeophysicae 18, 834–843.
Gavrilov, N.M., Jacobi, Ch., Kurschner, D., 2001. Short-periodvariations of ionospheric drifts at Collm and their connectionwith the dynamics of the lower and middle atmosphere. Physicsand Chemistry of the Earth C 26, 459–464.
Hirota, I., 1997. Some problems relating to the observedcharacteristics of gravity waves in the middle atmosphere. In:Hamilton, K. (Ed.), NATO ASI Series, Gravity Wave processes,their Parameterization in Global Climate Models, Vol. 150.Springer Publishing, Berlin, pp. 1–5.
Jacobi, Ch., Schminder, R., K2urschner, D., Bremer, J., Greisiger,K.M., Ho=mann, P., Singer, W., 1997a. Long-term trends in themesopause wind Feld obtained from LF D1 wind measurementsat Collm, Germany. Advances in Space Research 20, 2085–2088.
Jacobi, Ch., Schminder, R., K2urschner, D., 1997b. Measurements ofmesopause region winds over Central Europe from 1983 through1995 at Collm, Germany. Contributions to the AtmosphericPhysics 70, 189–200.
K2urschner, D., Schminder, R., Singer, W., Bremer, J., 1987. Einneues Verfahren zur Realisierung absoluter Re@exionsh2ohen-messungen an Raumwellen amplitudenmodulierter Rundfunk-sender bei Schr2ageinfall im Langwellenbereich als Hilfsmittelzur Ableitung von WindproFlen in der oberen Mesopausen-region. Zeitschrift fuer Meteorologie 37, 322–332.
LaOstoviOcka, J., BureOsovRa, D., BoOska, J., 1998. Does the QBO and theMt. Pinatubo volcanic eruption a=ect the gravity wave activityin the lower ionosphere. Studia Geophysica et Geodaetica 42,170–182.
Manson, A.H., Meek, C.E., 1993. Characteristics of gravity waves(10 min–6 h) at Saskatoon (52◦N; 107◦W) observed by thephase coherent medium frequency radar. Journal of GeophysicalResearch 98, 20,357–20,367.
Manson, A.H., Meek, C.E., Hall, C., Hocking, W.K., MacDougal,J., Franke, S., Igarashi, K., Riggin, D., Fritts, D.C., Vincent,R.A., 1999. Gravity wave spectra, directions, and waveinteraction: global MLT-MFR network. Earth Planets Space 51,543–562.
McLandress, Ch., 1998. On the importance of gravity waves inthe middle atmosphere and their parameterization in generalcirculation models. Journal of Atmospheric and Solar-TerrestrialPhysics 60, 1357–1383.
Nakamura, T., Tsuda, T., Yamamoto, M., Fukao, S., Kato, S.,1993a. Characteristics of gravity waves in the mesosphereobserved with the middle and upper atmosphere radar,1 Momentum @ux. Journal of Geophysical Research 98,8899–8910.
Nakamura, T., Tsuda, T., Yamamoto, M., Fukao, S., Kato, S.,1993b. Characteristics of gravity waves in the mesosphereobserved with the middle and upper atmosphere radar, 2Propagation direction. Journal of Geophysical Research 98,8911–8923.
Nakamura, T., Tsuda, T., Fukao, S., Manson, A.H., Meek, C.E.,Vincent, R.A., Reid, I.M., 1996. Mesospheric gravity waves atSaskatoon (52◦N), Kyoto (35◦N), and Adelaide (35◦S). Journalof Geophysical Research 101, 7005–7012.
Schminder, R., K2urschner, D., 1984. D1 LF wind measurements inthe 90–100 km height range. Handbook for MAP 13, 248–261.
Tsuda, T., Murayama, Y., Yamamoto, M., Kato, S., Fukao, S.,1990. Seasonal variations of momentum @ux in the mesosphereobserved with the MU radar. Geophysical Research Letters 17,725–728.
Vincent, R.A., 1984. Gravity wave motions in the mesosphere.Journal of Atmospheric and Terrestrial Physics 46, 119–128.
Vincent, R.A., Fritts, D.C., 1987. A climatology of gravity wavemotions in the mesopause region at Adelaide, Australia. Journalof Atmospheric Science 44, 748–760.
Vincent, R.A., Reid, I.M., 1983. HF Doppler measurementsof mesospheric gravity wave momentum @uxes. Journal ofAtmospheric Science 40, 1321–1333.