comparative study of dvorak analysis in the … · comparative study of dvorak analysis in the...
TRANSCRIPT

Comparative Study of Dvorak Analysis in the western North Pacific
Naohisa Koide and Shuji Nishimura
Forecast Division, Japan Meteorological Agency 1. Introduction The United Nations Economic and Social Commission for Asia and the Pacific (ESCAP)/World Meteorological Organization (WMO) Typhoon Committee published the Assessment Report on Impacts of Climate Change on Tropical Cyclone Frequency and Intensity in the Typhoon Committee Region in 2010. The report concluded that “For TC intensity, differences in best-track datasets available for WNP do not allow for a convincing detection of a long-term trend in TC intensity change in the basin when compared with variability from natural causes.” In response to the report’s conclusions, the Best-track Consolidation Meeting of the Typhoon Committee was held in Hong Kong, China, in December 2010 with the attendance of representatives from the Hong Kong Observatory (HKO), the Regional Specialized Meteorological Centre (RSMC) Tokyo, the Joint Typhoon Warning Center (JTWC) and the Shanghai Typhoon Institute (STI)/China Meteorological Administration (CMA). From a case study on Typhoon Megi (1013), it was concluded that large differences in maximum sustained wind speeds (MSWs) among the Centers was generally attributable to different conversion tables from CI numbers to MSW values. It was also found very difficult to verify MSW due to the considerable uncertainty inherent in observational data and different wind-averaging periods. It was recommended at the meeting that Centers be encouraged to exchange digitized CI number data for past TCs to enable related comparison. In line with this recommendation, CI number comparison was implemented via a project titled Harmonization of Tropical Cyclone Intensity Analysis under the Working Group on Meteorology. This paper summarizes the main outcomes of the study (Section 2), the recommendations made to WGM Members (Section 3) and the conclusion (Section 4). 2. Cyclone-by-cyclone Analysis 2.1 Methodology In most cases, CI-number differences are within 0.5. HKO and JTWC have positive biases in comparison to RSMC Tokyo, while little bias is found between CMA and RSMC Tokyo. In consideration of the Dvorak technique’s inherent subjectivity, a difference of 0.5 is considered generally acceptable. Overall, CI-number datasets from the four Centers indicated reasonably consistent tropical cyclone (TC) intensity estimates, although discrepancies as large as 1.5 or greater were occasionally observed. To determine the main causes of the discrepancies seen in the results of Dvorak analysis among the four Centers, cyclone-by-cyclone analysis was conducted with focus on 17 TCs with CI-number discrepancies as large as 2.0 or more among RSMC Tokyo and the three other Centers. T0922 (Nida) was additionally included in consideration of JMA’s handling of eye temperature, which may result in differences from other Centers. It should be noted that CI numbers from CMA were derived from the Simplified Dvorak technique until 2012; as a result, only those from 2013 onward were used for the cyclone-by-cyclone analysis. As the CI-number datasets exchanged include different numbers of named tropical cyclones as shown in the table below, TCs for which CI-number datasets from the three Centers are available for 2004 – 2012 and those of the

four Centers for 2013 were compared. Detailed cyclone-by-cyclone analysis, including Dvorak reanalysis, for the 18 TCs was conducted by an experienced TC analyst from RSMC Tokyo. The temperature color scale of the enhanced infrared imagery used for this study is described in Appendix I.
Table: Numbers of named TCs included in CI-number datasets
Year RSMC Tokyo CMA HKO JTWC
2004 29 28 24 28
2005 23 19 19 23 2006 23 1 22 20 2007 24 20 23 21
2008 22 22 20 21 2009 22 21 22 20 2010 14 13 14 14 2011 21 18 21 18 2012 25 22 25 25 2013 31 31 11 26 Total 234 195 201 216
2.2 Findings The cyclone-by-cyclone analysis revealed the main causes of large CI-number discrepancies as 1) final T-number constraints observed during rapid intensification, 2) current-intensity number rules, 3) erroneous interpretation and/or measurement of Dvorak parameters, and 4) differences in measurements of Dvorak parameters for eye patterns. A list of 18 TCs with related major causes is shown in Annex I, and details of cyclone-by-cyclone analysis are given in Annex II.
1) Final T-number constraints for periods of rapid intensification Dvorak (1984) provides the following constraints (Step 8 of the EIR analysis diagram) within which the final T number must fall: i) initial classification must be T 1.0 or T 1.5. ii) During the first 48 hours of development, T number cannot be lowered at night. iii) 24 hours after initial T 1.0, T-number must be < 2.5, iv) maximum change in the T number must be 0.5 over 6 hours for T numbers of < 4.0, and 1 over 6 hours, 1.5 over 12 hours, 2.0 over 18 hours, and 2.5 over 24 hours for T-numbers of > = 4.0). v) The final T number must be MET ±1. These constraints limit T-number variations to prevent short-term changes caused by rapid intensification/weakening of cloud systems. An internal study conducted by RSMC Tokyo concluded that the constraints are applicable to most TC intensity estimates and do not affect their accuracy. T0620 (Chebi) is considered an exceptional case that intensified so rapidly that forecasters had to
exceed the T-number constraints in order for the final T number to catch up with actual TC intensity. T1013 (Megi) demonstrated that lower T numbers at previous analysis times can result in lower T numbers at the
current analysis time in accordance with the related constraints. TC analysts often need to break associated
constraints to reflect rapid intensification. In such cases, checking should be performed to determine whether T
numbers for previous analysis times have been underestimated, and reanalysis should be performed as
necessary to obtain appropriate final T numbers without breaking the constraints.
2) Current intensity number rules

In Step 9 of the EIR Analysis Diagram, Dvorak (1984) also provides Current Intensity (CI) Number
Rules as follows: i) The CI number should be equal to the final T number except when the latter exhibits a
change to a weakening trend, or when redevelopment is indicated. ii) For initial weakening, the CI number remains unchanged for 12 hours, and is then 0.5 or 1.0 higher than the T number as the storm weakens. CI
numbers equal T numbers during TC development, but decrease with a time lag of 12 hours to T numbers
during the weakening period because cloud system decline precedes TC intensity reduction. It is assumed that
the Dvorak technique is not used when TCs are over land. Accordingly, there is a tendency for overestimation
regarding the intensity of TCs that rapidly weaken due to landfall, as the CI number remains the same 12 hours
after the beginning of the initial weakening. To address this issue, RSMC Tokyo uses its own CI-number Rules
for TCs over land (referred to here as JMA’s landfall rules) based on past TCs making landfall over the
Philippines from 1981 to 1986 (Koba et al. 1989). For more details of JMA’s landfall rules, see Appendix II.
For six TCs, large CI-number discrepancies between RSMC Tokyo and JTWC and/or HKOwere caused by the
CI-number Rules and/or JMA’s landfall rules.
T0704 (Man-Yi), T1117 (Nesat), T1209 (Saola) and T1224 (Bopha) made landfall after reaching
peak intensity before entering a phase of rapid weakening over land. RSMC Tokyo’s CI-numbers were lower
because they decreased together with T numbers in accordance with JMA’s landfall rules, whereas those of
JTWC and/or HKO remained the same due to the 12-hour time-lag regulation. Large CI-number differences
were also observed when T0505 (Haitang) made landfall. This was due both to JMA’s landfall regulations and to the CI-number difference around 12 hours before landfall. JTWC perceived redevelopment and increased its
CI number, whereas RSMC Tokyo maintained the same number. This different intensity interpretation in
combination with JMA’s landfall rules resulted in a 2.0 CI-number difference.
T0520 (Kirogi) rapidly weakened at sea, shifting to a shear pattern. While RSMC Tokyo maintained
the same CI number, JTWC reduced its number against the Rules. The question of whether these Rules are
appropriate for such rapid weakening is controversial, and CI numbers can differ significantly with TC analyst
interpretation.
3) Erroneous interpretation and/or measurement of Dvorak parameters Could pattern recognition and measurement of Dvorak parameters can be challenging, particularly
with cloud systems that shift from one cloud pattern to another and therefore exhibit the characteristics of both.
In such situations, TC analysts must perform careful judgment in consideration of the most appropriate
development/weakening scenario. However, even experienced TC analysts can make mistakes interpreting or
determining Dvorak parameters. The large CI-number discrepancies for T0427 (Nanmadol), T0519 (Longwang), T0520 (Kirogi), T0523 (Bolaven), T0615 (Xangsane), T0619 (Cimaron), T0621 (Durian), T0724 (Hagibis), T1214 (Tembin), T1224 (Bopha) and T1325 (Nari) are attributed to erroneous
interpretation of cloud patterns and/or measurement of related parameters.
T0520 (Kirogi), T0523 (Bolaven), T1224 (Bopha) and T1325 (Nari) records show large CI-number differences relating to cloud pattern recognition by TC analysts (i.e., determination as
embedded-center pattern or curved-band pattern). For these cases, CI numbers with embedded-center pattern
selection were at least 2.0 more than those with curved-band pattern selection. Based on visible and infrared
imagery alone, it can be difficult to distinguish embedded center patterns from curved band patterns. For some

of these TCs, microwave imagery was available for TC analysts. In such situations, information relating to
dense overcast from microwave imagery is very helpful in cloud pattern recognition by TC analysts. T0615 (Xangsane) was also associated with a large CI-number difference due to erroneous cloud pattern recognition.
T0427 (Nanmadol), T0519 (Longwang), T0619 (Cimaron) and T0621 (Durian) exhibited
significant CI-number differences due to varying Dvorak parameters for eye patterns. Although Dvorak
parameters for such developed systems with eye features are relatively objectively determined, their CI
numbers are largely expected to be reasonably consistent among experienced TC analysts. Accordingly, the
numbers for these TCs should be reviewed and reanalyzed as appropriate. T0724 (Hagibis) was also
characterized by large CI-number differences due to erroneous cloud pattern recognition; reanalysis produced
judgment of a shear pattern. The CI number data for T0724 (Hagibis) also need reanalysis.
4) Difference in measurements of Dvorak parameters for eye patterns T0922 (Nida) demonstrated how Dvorak parameters for eye patterns (such as eye temperature and
surrounding grayscale) can vary by up to 1.0 due to minor differences in interpretation.
T1214 (Tembin) exhibited complex eye features at its peak intensity, and CI numbers showed significant differences depending on identification of eye type, eye temperature and surrounding grayscale. At
18 UTC on 23 August, these three variables were identified as normal or elongated, DG or MG, and W or B,
respectively. For a normal eye type, DG, and W were selected and the DT number was 6.5. Meanwhile, the DT
value was 5.0 for an elongated eye type, and MG and B were selected.
3. Recommendations A set of recommendations to minimize discrepancies in TC intensity estimates among the Centers are
presented below based on the findings of the cyclone-by-cyclone analysis.
1) Final T-number constraints for periods of rapid intensification During periods of rapid intensification, TC analysts should operationally check T numbers for
previous analysis times if appropriate final T numbers obtained in accordance with the final T-number
constraints do not match actual TC intensities. Based on an internal study by RSMC Tokyo, the final T-number
constraints are considered appropriate for most TCs and rarely affect Dvorak analysis. As Dvorak analysis for
previous analysis times contributes to better Dvorak intensity estimation at analysis times, Dvorak reanalysis
should be part of operational procedures at the four Centers.
Recommendation 1: Operational TC Centers are encouraged to incorporate Dvorak reanalysis into the operational procedures of TC analysis.
2) Current intensity number Rules The cyclone-by-cyclone analysis revealed that JMA’s landfall rules sometimes cause large
discrepancies in CI numbers for TCs at land between RSMC Tokyo and the other three Centers. As TCs
approach land or make landfall, more surface observations are available for TC analysis. Accordingly, TC
intensity estimates should rely more on surface observation than on satellite-based TC intensity estimates. To

this end, to minimize discrepancies among the four Centers in operational TC intensity estimates for TCs
near/over land, surface observation data should be shared on a real-time basis within the Typhoon Committee
region.
Recommendation 2: Typhoon Committee Members are encouraged to promote sharing of surface
observation data on a real-time basis within the region.
3) Erroneous interpretation and/or measurement of Dvorak parameters Five TCs with large discrepancies caused by erroneous cloud pattern recognition were identified.
The study indicated difficulties in identifying embedded center patterns and others from visible and infrared
imagery alone. Microwave imagery often provides additional information that helps TC analysts make
appropriate interpretations. As such imagery is delayed by several hours, TC analysts should check previous
Dvorak analysis data and execute any necessary reanalysis once microwave imagery becomes available
(related to Recommendation 1).
Recommendation 3: Microwave satellite imagery providing information on TC structures under dense
overcasts should be used to achieve appropriate cloud pattern recognition. Exchanged datasets were also found to include erroneous CI numbers, resulting in large
discrepancies among the Centers. To ensure the quality of these datasets, reanalysis is necessary. Considering
the subjectivity of the Dvorak technique, such reanalysis should be conducted by a limited number of
experienced TC analysts to ensure quality and homogeneity.
Recommendation 4: Operational TC Centers are encouraged to implement reanalysis of satellite TC intensity estimates using the Dvorak technique if resources (particularly experienced TC analysts) are
available in order to develop long-term homogeneous satellite TC intensity datasets. 4) Difference in measurements of Dvorak parameters for eye patterns As observed in two TC cases, minor differences in determination of Dvorak parameters for eye
patterns sometimes result in large CI-number discrepancies. Recently advanced objective TC intensity
estimates providing reliable information are available. By way of example, the Advanced Dvorak Technique
(ADT) developed by the U.S. Cooperative Institute for Meteorological Satellite Studies (CIMSS) provides TC
intensity estimates and objective CI numbers with accuracy particularly for eye patterns. RSMC Tokyo has
also operationally used an objective Dvorak technique known as Cloud Grid Information Objective Dvorak
Analysis (CLOUD) since 2013 for DT determination. In addition, the use of satellite TC intensity consensus
products (e.g., SATCON), a weighted consensus of sounder-based TC intensity estimates and Dvorak TC
intensity estimates provides TC intensity estimates with better accuracy than that of individual techniques.
Such products are available on the CIMSS website and the Numerical Typhoon Prediction website run by
RSMC Tokyo. Using the objective satellite TC intensity estimates discussed above for reference will
contribute to better and more consistent TC intensity estimation by operational TC Centers.

Recommendation 5: Operational TC Centers are encouraged to utilize objective satellite TC intensity
estimates such as objective Dvorak techniques (e.g., ADT, CLOUD) and satellite intensity consensus (e.g.
SATCON) as reference for operational TC intensity analysis.
4. Conclusion A list of recommendations for harmonized TC intensity estimates in the region based on
cyclone-by-cyclone analysis is presented here. Typhoon Committee Members are encouraged to follow the list
under their own initiative and/or in collaboration with the Typhoon Committee. The project is now complete,
and is to be closed.
References Dvorak V. F., 1984: Tropical cyclone intensity analysis using satellite data. NOAA Tech. Rep. 11.
Koba, H., S. Osano, T. Hagiwara, S. Akashi, and T. Kikuchi, 1989: Determination of the intensity of typhoons
passing over the Philippines (in Japanese). J. Meteor. Res., 41, 157 – 162.

Annex I
TC number TC name yyyy/mm/dd/hh
CI number Major contributing factors
RSMC Tokyo Other Centers Final T-number
constraints CI-number
rules Erroneous interpretation Different measurements
T0427 NANMADOL 2004/12/02/12 5.0 7.0(JTWC) X
T0505 HAITANG 2005/07/18/06 4.5 6.5(JTWC) X
T0519 LONGWANG 2005/09/30/00 5.0 7.0(JTWC) X
T0520 KIROGI 2005/10/11/00 4.5 2.5(JTWC) X
2005/10/18/18 5.0 3.0(JTWC) X T0523 BOLAVEN 2005/11/16/06-18 2.0 4.5(JTWC) X
T0615 XANGSANE 2006/09/28/12 4.0 6.0(HKO) X
T0619 CIMARON 2006/10/29/00 7.5 5.5 (HKO) X
T0620 CHEBI 2006/11/09/12 5.0 3.0 (JTWC), 2.5 (HKO) X
T0621 DURIAN 2006/11/29/06 7.0 5.0(HKO) X
T0704 MAN-YI 2007/07/14/18 3.5 5.5(HKO) X T0724 HAGIBIS 2007/11/25/00 3.0 5.0(HKO) X
T0922 NIDA 2009/11/25/12 6.5 7.5(JTWC) X
T1013 MEGI 2010/10/14/18 3.0 5.0(JTWC) X
T1117 NESAT 2011/09/27/06 4.0 6.0(JTWC) X
T1209 SAOLA 2012/08/02/12 3.0 5.0(HKO) X
T1214 TEMBIN 2012/08/24/00 4.0 6.5 (JTWC), 6.0(HKO) X
T1224 BOPHA 2012/12/04/06 5.0
7.0(HKO), 3.0(JTWC) X
2012/12/07/00 5.0 X
T1325 NARI 2013/10/10/12 2.5 4.5(JTWC) X

Annex II
Cyclone-by-Cyclone Analysis
1. Final T-number constraints for periods of rapid intensification T0620 (Chebi) T0620 (Chebi) intensified with unusual rapidity from 06 UTC on 9 October to 06 UTC on 10 October. Before
this, the system was not well organized. JTWC was the only Center to have started Dvorak analysis at this
point. At 06 UTC on 10 October, just 24 hours after the beginning of the rapid intensification phase, a clear eye
feature was observed in visible and infrared imagery. Reanalysis gave a CI number of 7.0 (T number = 7.0
based on DT (cloud pattern: eye; E number = 6.5 (surr. grayscale: CMG ); Eadj = +0.5 (surr. ring temp.: CMG;
eye temp.: OW))) without observation of the final T-number constraints. Whether to consider the final
T-number constraints resulted in large discrepancies among JMA, JTWC and HKO.

IR (left) and EIR (right) imagery for 18 UTC on 8 October CI number (reanalysis): CI number = 3.5; T number = 3.5 based on DT (cloud pattern: curved band; band length: 0.8 (DG)). CI number (operational): JMA: --; JTWC: 1.5; HKO: --
IR (left), EIR (middle) and VIS (right) imagery for 06 UTC on 10 October CI number (reanalysis): CI number = 7.0; T number = 7.0 based on DT (cloud pattern: eye; E number = 6.5 (surr. grayscale: CMG ); Eadj = +0.5 (surr. ring temp.: CMG; eye temp.: OW) CI number (operational): JMA: 7.0; JTWC: 6.0; HKO: 4.0
T1013 (Megi) T1013 (Megi) rapidly intensified from 06 to 18 UTC on 14 October. At 18 UTC JMA’s CI number for the
storm was 3.0, while that of JTWC was 5.0. Reanalysis indicated a T number of 5.0 based on DT (cloud
pattern: embedded center; surr. gray scale: CMG). Judgment of an embedded center pattern can be made only
if the T number was at least 3.5 12 hours previously. The reanalysis also gave a CI number of 3.5 (T number:
3.5 based on DT (cloud pattern: curved band; band length: 0.5 (W)). JMA’s T number was 3.0 at the analysis
time, because previous T numbers limited any related increase in accordance with the final T-number
constraints.

2. Current Intensity number Rules (landfall Rules) for periods of rapid weakening T0505 (Haitang) T0505 (Haitang) showed signs of redevelopment at 18 UTC on 17 July just before making landfall on Taiwan
Island. JTWC increased its CI number to 6.5, while JMA held its number at 6.0. Reanalysis for the analysis
time gives a CI number of 6.0 (T number = 5.5; DT = 5.5; cloud pattern: eye; E number = 5.0 (surr. Grayscale:
W); Eadj = +0.5 (surr. ring temp.: W; eye temp.: OW). The TC then started to weaken in association with its
landfall. At 18 UTC on 18 July, JMA reduced its CI number to 4.5 together with its T number in accordance
with its landfall rules. JTWC held its CI number at 6.5 in accordance with CI-number Rules. Reanalysis for the
analysis time gives a T number of 4.0 based on DT (DT = 4.0; cloud pattern: curved band; band length = 1.1
(DG)). The CI-number difference between JMA and JTWC was caused by a combination of the difference in
the CI-numbers at 18 UTC on 17 July and JMA’s application of its landfall rules at 18 UTC on 18 July.
IR (left) and EIR (right) imagery for 18 UTC on 17 July CI number (reanalysis): CI number = 6.0; T number = 5.5 based on DT (cloud pattern: eye; E number = 5.0 (surr. gray scale: W); Eadj = +0.5 (surr. ring temp.: W; eye temp.: OW)) CI number (operational): JMA: 6.0; JTWC: 6.5; HKO: 6.5
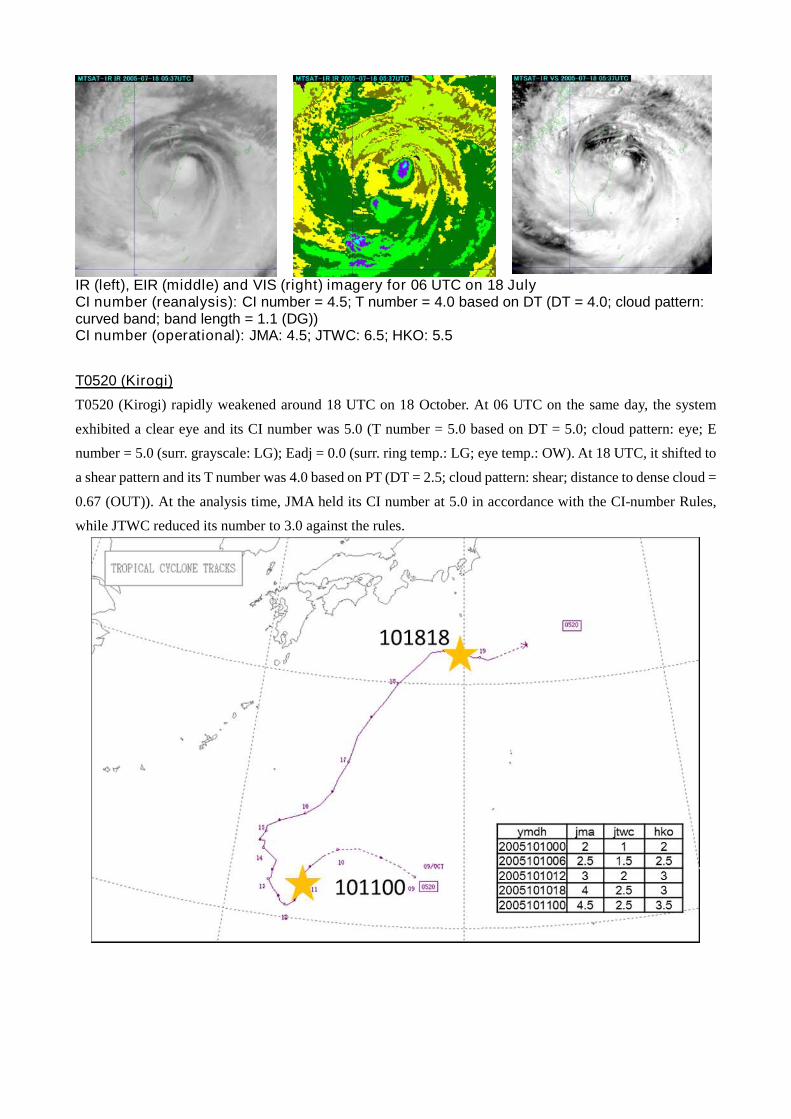
IR (left), EIR (middle) and VIS (right) imagery for 06 UTC on 18 July CI number (reanalysis): CI number = 4.5; T number = 4.0 based on DT (DT = 4.0; cloud pattern: curved band; band length = 1.1 (DG)) CI number (operational): JMA: 4.5; JTWC: 6.5; HKO: 5.5 T0520 (Kirogi) T0520 (Kirogi) rapidly weakened around 18 UTC on 18 October. At 06 UTC on the same day, the system
exhibited a clear eye and its CI number was 5.0 (T number = 5.0 based on DT = 5.0; cloud pattern: eye; E
number = 5.0 (surr. grayscale: LG); Eadj = 0.0 (surr. ring temp.: LG; eye temp.: OW). At 18 UTC, it shifted to
a shear pattern and its T number was 4.0 based on PT (DT = 2.5; cloud pattern: shear; distance to dense cloud =
0.67 (OUT)). At the analysis time, JMA held its CI number at 5.0 in accordance with the CI-number Rules,
while JTWC reduced its number to 3.0 against the rules.
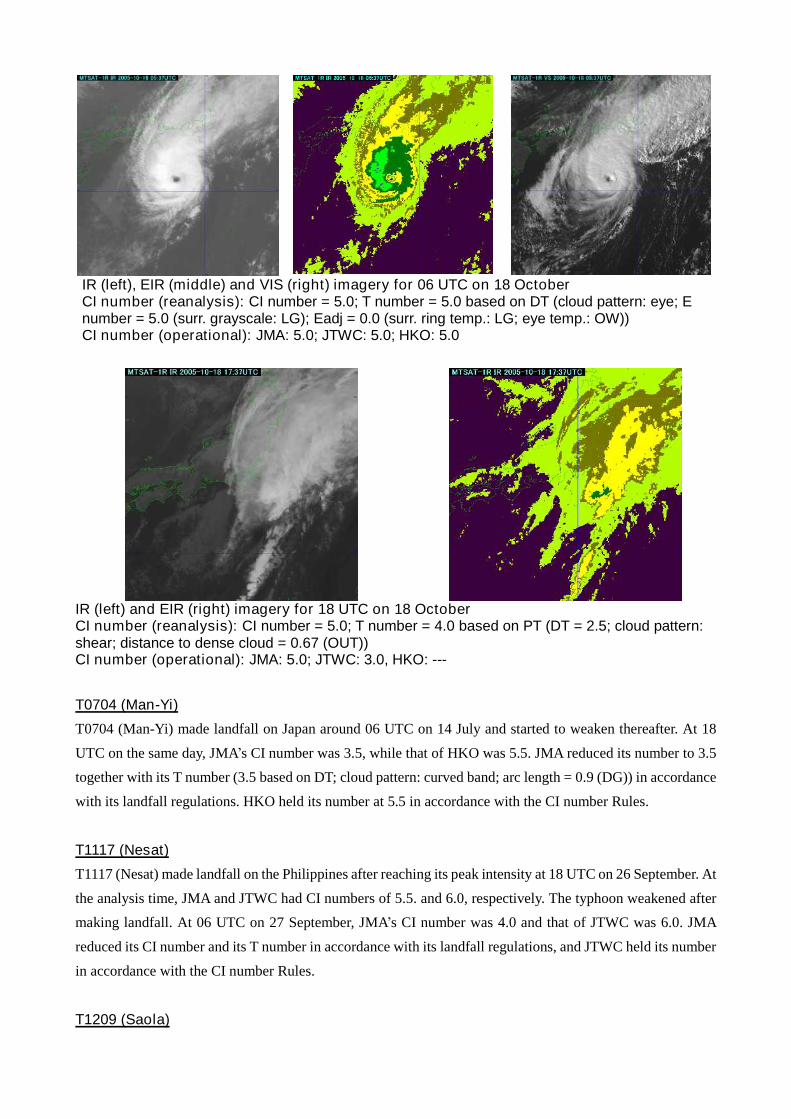
IR (left), EIR (middle) and VIS (right) imagery for 06 UTC on 18 October CI number (reanalysis): CI number = 5.0; T number = 5.0 based on DT (cloud pattern: eye; E number = 5.0 (surr. grayscale: LG); Eadj = 0.0 (surr. ring temp.: LG; eye temp.: OW)) CI number (operational): JMA: 5.0; JTWC: 5.0; HKO: 5.0
IR (left) and EIR (right) imagery for 18 UTC on 18 October CI number (reanalysis): CI number = 5.0; T number = 4.0 based on PT (DT = 2.5; cloud pattern: shear; distance to dense cloud = 0.67 (OUT)) CI number (operational): JMA: 5.0; JTWC: 3.0, HKO: --- T0704 (Man-Yi) T0704 (Man-Yi) made landfall on Japan around 06 UTC on 14 July and started to weaken thereafter. At 18
UTC on the same day, JMA’s CI number was 3.5, while that of HKO was 5.5. JMA reduced its number to 3.5
together with its T number (3.5 based on DT; cloud pattern: curved band; arc length = 0.9 (DG)) in accordance
with its landfall regulations. HKO held its number at 5.5 in accordance with the CI number Rules.
T1117 (Nesat) T1117 (Nesat) made landfall on the Philippines after reaching its peak intensity at 18 UTC on 26 September. At
the analysis time, JMA and JTWC had CI numbers of 5.5. and 6.0, respectively. The typhoon weakened after
making landfall. At 06 UTC on 27 September, JMA’s CI number was 4.0 and that of JTWC was 6.0. JMA
reduced its CI number and its T number in accordance with its landfall regulations, and JTWC held its number
in accordance with the CI number Rules.
T1209 (Saola)
T1209 (Saola) made landfall on Taiwan Island after reaching its peak intensity at around 12 UTC on 1 August.
Its cloud pattern in satellite imagery subsequently indicated signs of weakening. At 12 UTC on 2 August, there
was a 2.0 CI-number difference between JMA and HKO (JMA: 3.0; HKO: 5.0). This is because JMA reduced
its CI number to 3.0 (T number = 3.0 based on DT; cloud pattern: band; band length = 0.6 (DG)) in accordance
with its landfall rules, while HKO held its number in accordance with the CI-number Rules.
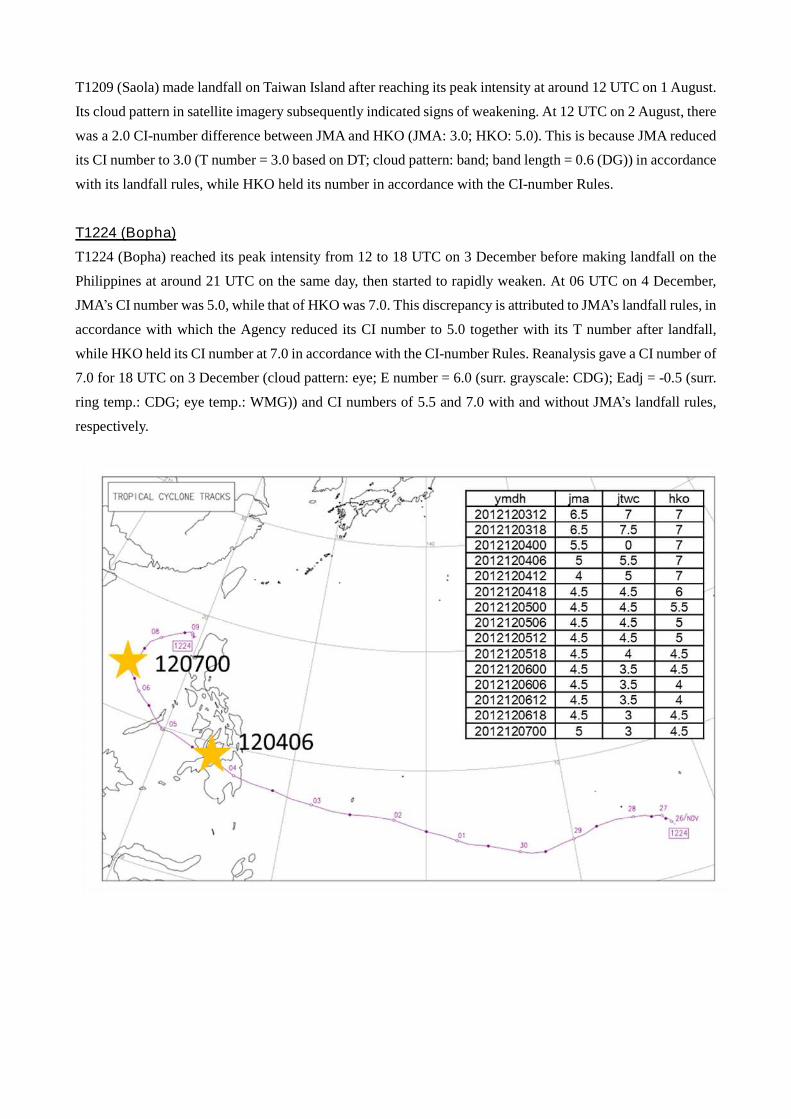
T1224 (Bopha) T1224 (Bopha) reached its peak intensity from 12 to 18 UTC on 3 December before making landfall on the
Philippines at around 21 UTC on the same day, then started to rapidly weaken. At 06 UTC on 4 December,
JMA’s CI number was 5.0, while that of HKO was 7.0. This discrepancy is attributed to JMA’s landfall rules, in
accordance with which the Agency reduced its CI number to 5.0 together with its T number after landfall,
while HKO held its CI number at 7.0 in accordance with the CI-number Rules. Reanalysis gave a CI number of
7.0 for 18 UTC on 3 December (cloud pattern: eye; E number = 6.0 (surr. grayscale: CDG); Eadj = -0.5 (surr.
ring temp.: CDG; eye temp.: WMG)) and CI numbers of 5.5 and 7.0 with and without JMA’s landfall rules,
respectively.

IR (left), EIR (middle) and VIS (right) imagery for 06 UTC on 4 December CI number (reanalysis): CI number = 5.5; T number = 5.0 based on PT (DT = 4.5; cloud pattern: embedded center; surr. grayscale: LG) CI number (operational): JMA: 5.0; JTWC: 5.5; HKO: 7.0

3. Erroneous interpretation and/or measurements of Dvorak parameters T0427 (Nanmadol) T0427 (Nanmadol) records show a CI number difference of 2.0 for JMA and JTWC for 12 UTC on 2
December just before the typhoon made landfall on the Philippines. The system started to rapidly weaken as it
approached the Philippines due to the effects of land. Reanalysis gave a CI number of 5.0 based on a DT of 4.5
(cloud pattern: embedded center; surr. grayscale: LG). JTWC held its CI number at 7.0 in accordance with CI
number Rules, as it had redeveloped the system and increased the number to 7.0 12 hours earlier at 00 UTC on
2 December. However, reanalysis for the analysis time does not support this redevelopment scenario and gives
a CI number of 6.0 based on a T number = 5.0 (DT = 5.0; cloud pattern: embedded center; surr. grayscale: B).
A CI number of 7.0 would be an overestimation of intensity due to misinterpretation.
IR (left), EIR (middle) and VIS (right) imagery for 00 UTC on 2 December CI number (reanalysis): CI number = 6.0; T number = 5.0 based on DT (cloud pattern: embedded center, surr. grayscale: B) CI number (operational): JMA: 5.0; JTWC: 7.0; HKO: 5.5

T0519 (Longwang) T0519 (Longwang) records show a CI number difference of 2.0 between JMA and JTWC for 00 UTC on 30
September, with JMA’s CI number at 5.0 and JTWC’s at 7.0. This difference is attributed to different analysis
12 hours previously. At 12 UTC on 29 September, JTWC redeveloped the system and increased its CI number
to 7.0, while JMA kept its number at 6.0. Reanalysis gave a CI number of 6.0 (T number = 5.5 based on DT
(cloud pattern: eye; E number = 5.0 (surr. grayscale: LG); Eadj = +0.5 (surr. ring temp.: W; eye temp.: WMG)).
At 00 UTC on 30 September, JTWC held its CI number at 7.0 in accordance with the CI-number Rules, while
JMA reduced its number to 5.0 because 12 hours had passed since its initial T-number reduction. Reanalysis
gave a CI number of 5.0 (T number = 4.5 based on DT (cloud pattern: eye; E number = 5.0 (surr. grayscale:
LG); Eadj = +-0.5 (surr. ring temp.: LG, eye temp.: MG))).
T0520 (Kirogi) T0520 (Kirogi) rapidly intensified from 00 to 18 UTC on 11 October 2005. During this period, there was a 2.0
CI number difference between JMA and JTWC. At 00 UTC on 11 October 2005, JTWC’s number was 2.5,
while that of JMA was 4.5. Reanalysis gave a CI number of 4.5 (T number = 4.5 based on DT (cloud pattern:
embedded center; surr. grayscale: LG)), as an eye started to form six hours later. Operational cloud pattern
recognition to determine whether the system had shifted to an embedded center pattern or maintained a curved
band pattern was challenging at this analysis time. Judgment of an embedded center pattern was inappropriate
because operational TC forecasters were unaware that an eye was forming under the dense overcast.
IR (left), EIR (middle) and VIS (right) imagery for 00 UTC on 11 October CI number (reanalysis): CI number = 4.5; T number = 4.5 based on DT (cloud pattern: embedded center; surr. grayscale: B). CI number (operational): JMA: 4.5; JTWC: 2.5; HKO: 3.5

T0523 (Bolaven) T0523 (Bolaven) records show a CI number difference of 2.0 or 2.5 between JMA and JTWC from 00 to 18
UTC on 16 November. From 00 UTC on 16 November, convective areas around the center became
symmetrical with higher cloud tops. At 18 UTC on 16 November, JTWC’s CI number was 4.5 with the system
judged to have an embedded center pattern, while that of JMA was 2.0. Microwave imagery for 17:20 UTC on
18 November shows little deep convection around the center, and judgment of a curved band pattern was
appropriate. Reanalysis for the analysis time gives a CI number of 3.0 (T number = 3.0 based on DT (cloud
pattern: curved band; band length: 0.5 (W))).
IR (left), EIR (middle) and microwave (right) imagery for 18 UTC on 16 November CI number (reanalysis): CI number = 3.0; T number = 3.0 based on DT (cloud pattern: curved band; band length = 0.5 (W)). CI number (operational): JMA: 2.5; JTWC: 4.5; HKO: 3.0
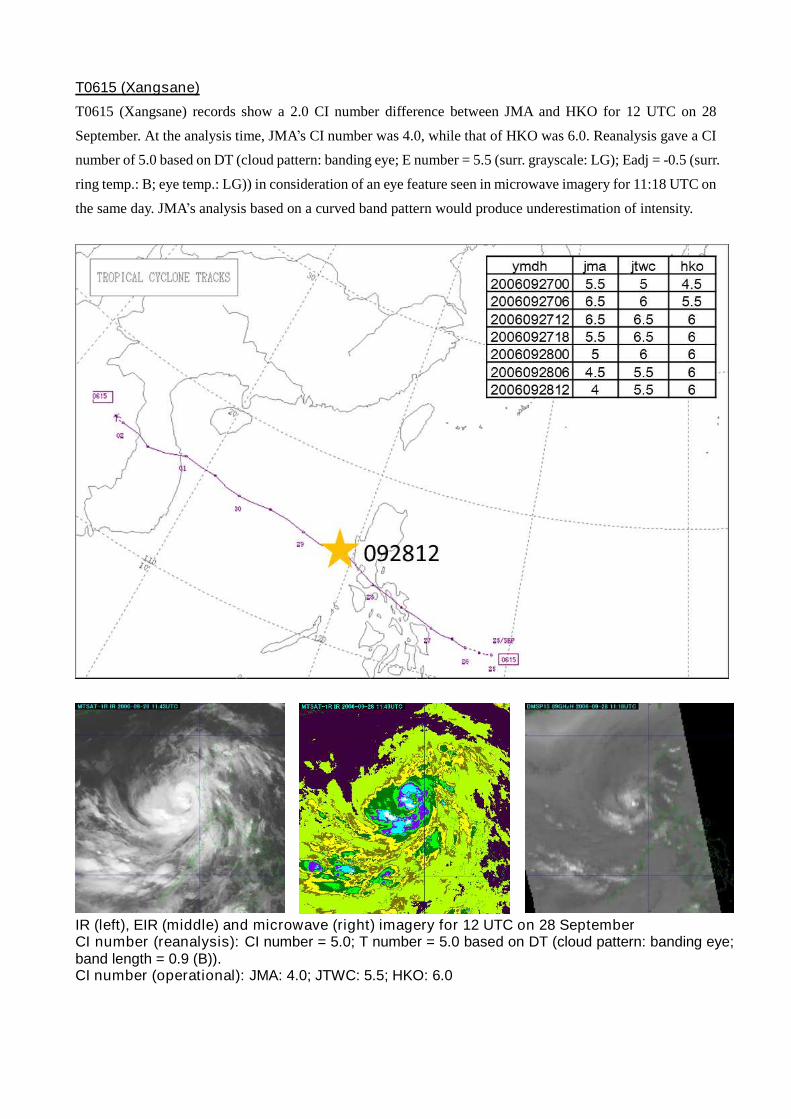
T0615 (Xangsane) T0615 (Xangsane) records show a 2.0 CI number difference between JMA and HKO for 12 UTC on 28
September. At the analysis time, JMA’s CI number was 4.0, while that of HKO was 6.0. Reanalysis gave a CI
number of 5.0 based on DT (cloud pattern: banding eye; E number = 5.5 (surr. grayscale: LG); Eadj = -0.5 (surr.
ring temp.: B; eye temp.: LG)) in consideration of an eye feature seen in microwave imagery for 11:18 UTC on
the same day. JMA’s analysis based on a curved band pattern would produce underestimation of intensity.
IR (left), EIR (middle) and microwave (right) imagery for 12 UTC on 28 September CI number (reanalysis): CI number = 5.0; T number = 5.0 based on DT (cloud pattern: banding eye; band length = 0.9 (B)). CI number (operational): JMA: 4.0; JTWC: 5.5; HKO: 6.0

T0619 (Cimaron) T0619 (Cimaron) records show a 2.0 CI number difference between JMA and HKO during the typhoon’s
period of rapid intensification from 12 UTC on 28 to 00 UTC on 29 October. JMA’s CI number was 7.5, while
that of HKO was 5.5 at 00 UTC on 29 October. Reanalysis gave a high-confidence CI number of 7.5 based on
DT (cloud pattern: eye; E number = 6.5 (surr. grayscale: CMG); Eadj = +1.0 (surr. ring temp.: CMG, eye temp.:
WMG)).
IR (left), EIR (middle) and VIS (right) imagery for 00 UTC on 29 October CI number (reanalysis): CI number = 7.5; T number = 7.5 based on DT (cloud pattern: eye; E number = 6.5 (surr. grayscale: CMG); Eadj = +1.0 (surr. ring temp.: CMG, eye temp.: WMG). CI number (operational): JMA: 7.5; JTWC: 6.5; HKO: 5.5
T0621 (Durian) T0621 (Durian) records show a 2.0 CI number difference between JMA and HKO during the period of rapid
intensification from 00 to 06 UTC on 29 November. JMA’s CI number was 7.0, while that of HKO was 5.0 at
06 UTC on 29 November. At the analysis time, both visible and infrared imagery clearly show an eye feature,

and reanalysis gave a confident CI-number determination of 7.0 (T number = 7.0 based on DT (cloud pattern:
eye; E number = 6.5 (surr. grayscale: CMG); Eadj = +0.5 (surr. ring temp.: CMG, eye temp.: OW)).
T0724 (Hagibis) T0724 (Hagibis) records show a 2.0 – 2.5 CI number difference between JMA and HKO from 00 UTC on 25 to
00 UTC on 26 November. The typhoon started to weaken at 18 UTC on 24 November, shifting to a shear
pattern. At 00 UTC on 25 November, reanalysis gave a CI number of 3.0 (T number = 2.5 based on DT (cloud
pattern: shear; distance to thick cloud area = 0.74 (OUT)). Since the cloud pattern is not to be Embedded
Center Pattern, a CI number of 5.0 would represent an overestimation.
T1224 (Bopha) T1224 (Bopha) redeveloped over the South China Sea after weakening due to landfall on the Philippines. At 00
UTC on 7 December, JMA’s CI number was 5.0, while that of JTWC was 3.0. Microwave imagery for 22:23
UTC on 6 October revealed an eye formation under dense overcast, and reanalysis therefore gave a CI number
of 5.0 (T number = 5.0 based on DT (cloud pattern: embedded center; surr. grayscale: W)). A CI number of 3.0
would represent an underestimation.
T1325 (Nari) T1325 (Nari) steadily developed before making landfall on the Philippines around 12 UTC on 11 October.
There was a 2.0 CI number difference between JMA and JTWC from 10 to 12 UTC on 11 October. At 12 UTC
on 11 October, just before landfall, JMA’s CI number was 3.5 while that of JTWC was 5.5. As microwave
imagery for 11:28 UTC on 11 October clearly shows an eye under dense overcast, reanalysis gave a CI number
of 5.0 (T number = 5.0 based on DT (cloud pattern: embedded center; surr. grayscale: CDG)).
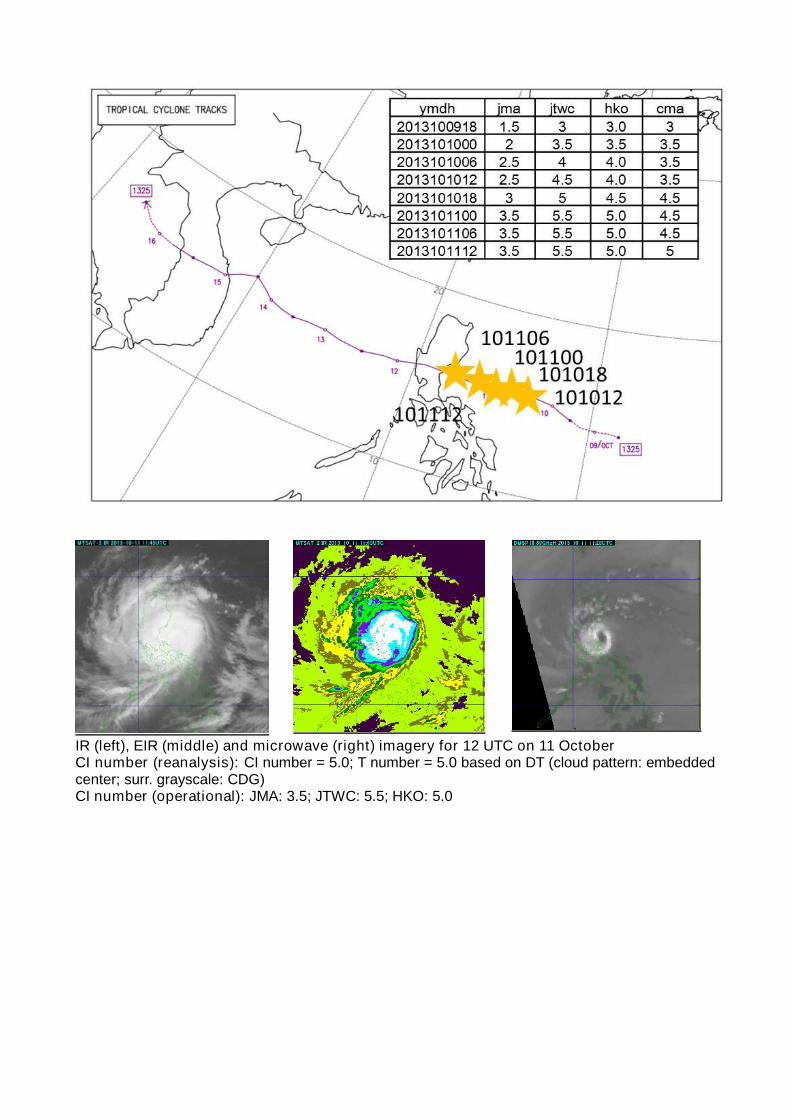
IR (left), EIR (middle) and microwave (right) imagery for 12 UTC on 11 October CI number (reanalysis): CI number = 5.0; T number = 5.0 based on DT (cloud pattern: embedded center; surr. grayscale: CDG) CI number (operational): JMA: 3.5; JTWC: 5.5; HKO: 5.0

4. Difference in measurements of Dvorak parameters for eye patterns T0922 (Nida) T0922 (Nida) redeveloped and reached its second peak intensity with a clear eye feature at 18 UTC on 27
November. As the minimum CMG width was around 0.5 degrees in latitude at the analysis time, the
surrounding grayscale could have been either CMG or W depending on TC analyst interpretation. In terms of
eye temperature, OW was dominant within the eye area itself, while the highest temperature was WMG.
RSMC Tokyo often prefers to choose the highest value that accounts for at least around a quarter of the eye
area as the eye temperature. If the highest temperature within an eye is observed in only a few pixels, it may not
be taken as the eye temperature. In this case, RSMC Tokyo took OW as the eye temperature, while JTWC
chose WMG.
Surrounding grayscale (left), eye temperature (middle) and IR image (right) for 18 UTC on 27 November CI number (reanalysis): CI number = 7.0; T number = 7.0 based on DT (cloud pattern: eye; E number = 6.0 (surr. grayscale: W); Eadj = +1.0 (surr. ring temp.: CMG; eye temp.: WMG) CI number (operational): JMA: 6.5; JTWC: 7.5; HKO: 6.0 T1214 (Tembin) T1214 (Tembin) made landfall on Taiwan Island around six hours after reaching its peak intensity around 18
UTC on 23 August. At 00 UTC on 24 August, the system weakened due to landfall. At the analysis time there
was a 2.5 (2.0) CI number difference between JMA and JTWC (HKO). JMA’s value was 4.0, and that of JTWC
(HKO) was 6.5 (6.0). Reanalysis gave a CI number of 5.0 (T number = 5.0 based on DT (cloud pattern:
embedded center; surr. grayscale: B)) and 5.5 without JMA’s landfall rules. This large discrepancy is attributed
to different interpretations of the eye pattern at 18 UTC on 23 August. JMA’s CI number was 5.0, whereas
JTWC’s was 6.5. Different interpretation of eye types (normal or elongated), and measurement of the
parameters for determination of E numbers and Eadj numbers, such as eye temperature and surrounding
grayscale, resulted in a difference of 1.5. Reanalysis gave a CI number of 5.5 (T number = 5.5 based on DT;
cloud pattern: banding eye; eye type: elongated; E number = 6.0 (surr. grayscale: W); Eadj = +-0.5 (surr. ring
temp.: W; eye temp.: MG)).
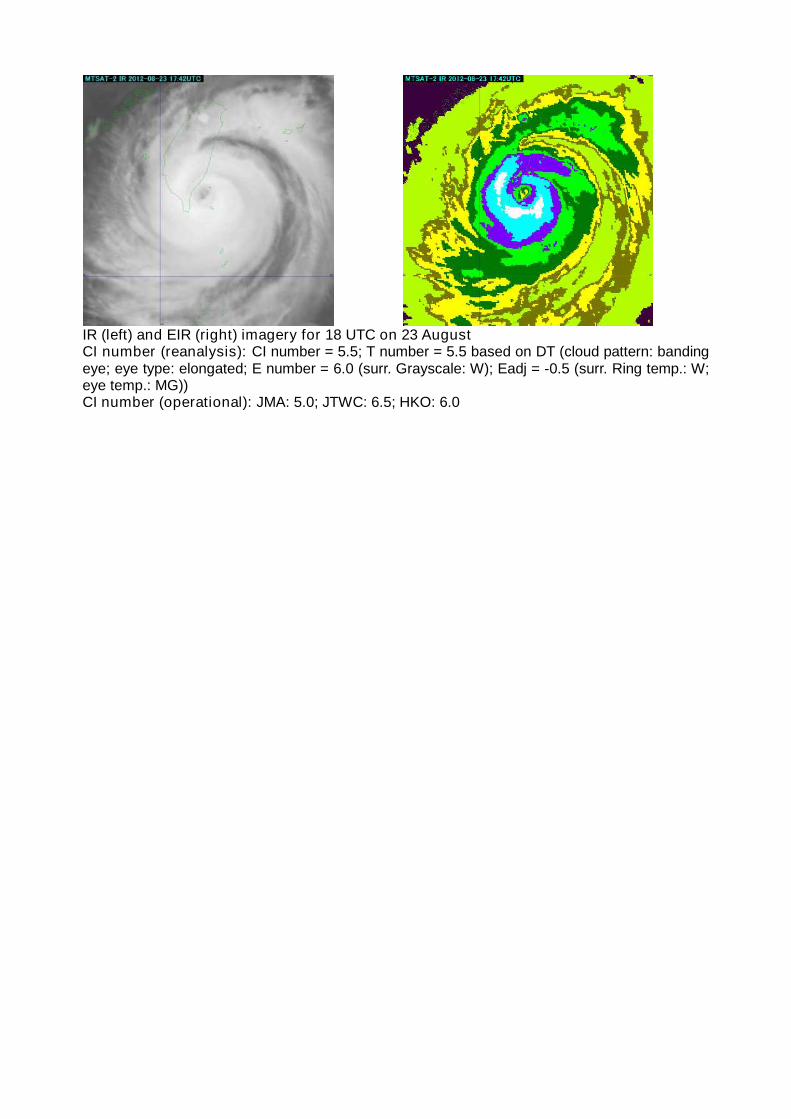
IR (left) and EIR (right) imagery for 18 UTC on 23 August CI number (reanalysis): CI number = 5.5; T number = 5.5 based on DT (cloud pattern: banding eye; eye type: elongated; E number = 6.0 (surr. Grayscale: W); Eadj = -0.5 (surr. Ring temp.: W; eye temp.: MG)) CI number (operational): JMA: 5.0; JTWC: 6.5; HKO: 6.0

Appendix I
Color Scale for Temperature in Enhanced Infrared Imagery

Appendix II
JMA’s Landfall Rules 1) If the T number decreases only after landfall occurs, the 12-hour time-lag rule for CI number determination
does not apply. The CI number is assumed to be equal to the T number.
2) If a tropical cyclone makes landfall within 12 hours of the start of a T number decrease and the number
continues to decrease, the CI number should be reduced by the same amount as the T-number decrease.
3) The above relationships should be maintained (even if the tropical cyclone heads out to sea) until signs of
redevelopment become apparent.
The figure on the left shows a case in which a typhoon lands within 6 hours after Tmax (red line) and the T
number begins to decrease. The CI number also decreases with the T number. If the typhoon lands 6 to 12
hours after Tmax (red line), the CI number decreases and the difference between the CI number and the T
number is maintained (a difference of 1.0 is maintained for differences greater than this value). If the typhoon
lands 6 to 12 hours after Tmax (red line) as shown in the figure on the right, the CI number decreases and its
difference from the T number is maintained (a difference of 1.0 is maintained for differences greater than 1.0).
T-nu
mbe
r/CI-n
umbe
r
Time
T- number CI- number
Landing
T-nu
mbe
r/CI-n
umbe
r
Time
T- number CI- number
Landing