comparative study for the energy valorisation of rice · pdf fileinefficient management of...
TRANSCRIPT
CCHHEEMMIICCAALL EENNGGIINNEEEERRIINNGG TTRRAANNSSAACCTTIIOONNSS
VOL. 37, 2014
A publication of
The Italian Association of Chemical Engineering
www.aidic.it/cet Guest Editors: Eliseo Ranzi, Katharina Kohse- HöinghausCopyright © 2014, AIDIC Servizi S.r.l., ISBN 978-88-95608-28-0; ISSN 2283-9216
Comparative Study for the Energy Valorisation of Rice Straw
Cristina Molinera*, Barbara Bosioa, Elisabetta Aratoa, Amparo Ribes-Greusb
a Dipartimento di Ingegneria Civile, Chimica e Ambientale (DICCA). Università degli Studi di Genova, Via Opera Pia 15, 16145 Genova (Italy) b Departamento de Maquinas y Motores Termicos (CMT). Universidad Politècnica de València, Camino de Vera s/n, 46022. Valencia (Spain) [email protected]
The processes of pyrolysis and combustion of rice straw were simulated by multi-rate linear non-isothermal thermogravimetric experiments under Ar and O2 respectively. The kinetic parameters and thermal stability of both thermo-chemical processes were assessed and compared under different linear heating rates. From the results obtained from TGA, the kinetic methodology (combination of Friedman, Kissinger-Akahira-Sunose, Vyazovkin and Master-Curves methods) permitted to describe mathematically the decomposition processes of rice straw. The use of all the applied atmospheres showed 4 different decomposition stages, corresponding to the main degradation processes (drying and cellulose, hemicellulose and lignin decomposition). Reactions were faster when increasing the content of O2 in the carrying gas as a result of a higher reactive atmosphere and the percentage of ashes decreased, as well as the final temperature of each degradation stage.
1. Introduction As a result of the world industrial development and the advent of new energy needs, a rapid increase in the use of fossil fuels has been encountered by all economic and social sectors. This high demand has led to a huge overuse of coal and oil based fuels, which has consequently resulted in a vast negative impact on the environment. Problems like global warming and the rapid exhaustion of provisions desperately need to be tackled; therefore renewable energy is now receiving increasing attention (Peres et al.). Additionally, the rise in population has also changed consumption patterns and waste generation has grown dramatically. Inefficient management of this waste can result in large waste dumps which can cause health problems and environmental damage. Rice is one of the most cultivated crop worldwide, with an annual production of 700 Mt according to the Food and Agriculture Organization of the United Nations (FAOSTAT) database resulting in a generation of 3.4 Mt of rice straw in Europe. Open field burning is still the most popular way of eliminating rice straw (30 %). This results in a large increase in CO2 emissions and the inconvenience caused by the resulting smoke. The other common procedure is the disposal of rice straw on the field. This affects the ecosystem as its decomposition damages the quality of water increasing fish and aquatic fauna mortality in the wetland protected areas and producing disturbing odours in the affected areas. Thermo-chemical conversions of rice straw have been purposed as an alternative to these management strategies taking profit of its capacity for energy production (HHV=15 MJ/Kg). Among the different available techniques, spouted bed reactors have emerged as a promising technology to carry out these processes due to its main working characteristics such as regular and continuous recirculation of particles and possibility of handling particles of different sizes and morphologies and initial difficulties encountered by conventional fluidisation when applied to agricultural residues are overcome. However, as a consequence of the main properties of the feedstock like its high ash content and the low conversion efficiency, an exhaustive control of the process in terms of thermal conversions will be crucial
DOI: 10.3303/CET1437041
Please cite this article as: Moliner C., Bosio B., Arato E., Ribes A., 2014, Comparative study for the energy valorisation of rice straw, Chemical Engineering Transactions, 37, 241-246 DOI: 10.3303/CET1437041
241
to obtain higher efficiencies. Thermal studies including decomposition profiles, reaction kinetics and thermal stability of the raw material will be used to model the performance of the spouted bed reactor. Thermogravimetric Analysis (TGA) is a widely used technique to assess the thermal behaviour and decomposition kinetics of biomass (Kirubakaran et al, 2009). Several works have studied the thermal properties of rice straw by means of thermal analysis (White et al, 2011). For the purpose of this work, rice straw samples were submitted to non-isothermal thermogravimetric experiments, under both inert (Ar) and oxidative (O2) atmospheres with the aim to simulate different thermo chemical processes from pyrolysis (using Ar as carrier gas) to combustion (with O2 as carrier gas). The decomposition profiles were obtained and a kinetic analysis was performed to obtain the characteristic parameters during the degradation process. All the studies were carried out following an accurate methodology defined by Badia et al in previous works.
2. Experimental procedure
2.1 Thermogravimetric analyses Multi-rate non-isothermal thermogravimetric experiments (TGA) were carried out in a Mettler Toledo TGA/SDTA 851 (Columbus, OH). Samples weighting~6 mg were heated in an alumina holder with capacity for 70μL. Experiments were performed from 25 ºC to 800 ºC at different heating rates (β=2, 5, 10, 15, 20 ºC/min) under a constant flow of 50 mL/min of gas of analysis. All samples were analysed under inert (Ar) and oxidative (O2) atmospheres to characterise the thermal and thermo-oxidative processes respectively. Experiments were repeated three times and the average values were considered as representative values. Assessment was performed with the aid of the software Stare 9.10 from Mettler Toledo.
2.2 Composition of the rice straw The composition of the rice straw was obtained according standard procedures ((UNE-EN 14774-3:2009, UNE-EN 15148 and UNE-EN 14775). The results (in dry basis) are reported in Table 1. The moisture content was 9.1%.
Table 1: Composition of rice straw (dry basis)
Volatiles Fixed Carbon Ash 63.3 16.1 20.6
3. Results and conclusions
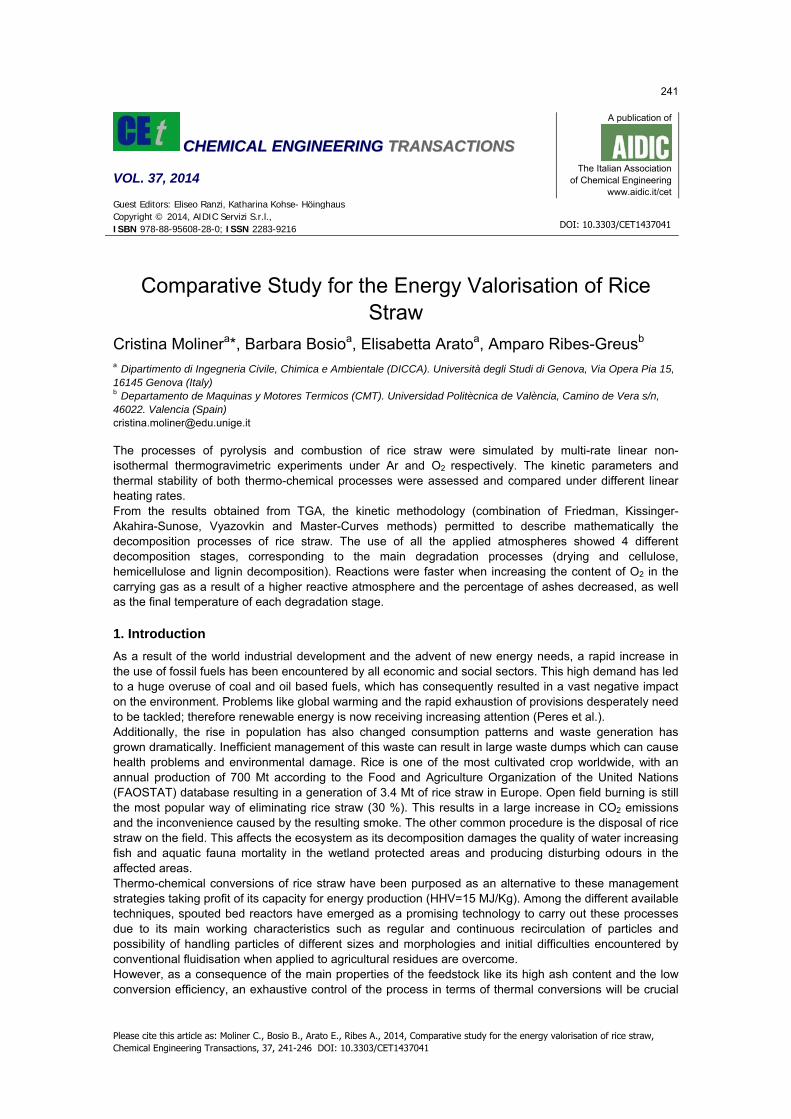
3.1 Thermal and thermo-oxidative decomposition profiles The thermal performance of the rice straw was initially addressed. The thermogravimetric curves (TG) and their first derivative curves (DTG) were obtained at all heating rates β and compared between them. Figure 1 represents both TG (inset) and DTG curves at all β (inert (a) and oxidative (b) ambient). As expected according to previous works by Amutio et al. with different types of biomass, higher β led the thermograms to shift to higher temperatures, showing the dependence of the process with temperature. As shown in Figure 1, the thermal degradation of the rice straw occurred through four different decomposition steps, regardless the atmosphere and the heating rate employed during the analysis. The material started to decompose at T0~25 ºC with the evaporation of moisture and light volatiles. The majority of the initial mass was consumed during the second degradation process at the range T=200 °C-400 °C, where the presence of shoulders/double peaks indicates that more than one reaction is being involved at the same time. This step is assigned to the decomposition of hemicellulose and cellulose in line with previous studies by Yang et al. The last stage is assigned to the degradation of lignin whose decomposition occurs in a slow velocity, especially when using Ar. The value of the final residue reached up to the 20 % for the case of samples under inert atmosphere while values around 5 % were found at oxidative conditions. All the characteristic parameters (T0, Tpi with i = 1…4 representing the different pseudo-components of the straw: moisture, hemicellulose, cellulose and lignin) for each atmosphere and heating rate are gathered in Table 2.
242
-0,012
-0,01
-0,008
-0,006
-0,004
-0,002
0
0 100 200 300 400 500 600 700 800
T (°C)
dα/
dT (
min
-1)
β = 2°C/min
β = 5°C/min
β = 10°C/min
β = 20°C/min
β = 15°C/min
(a) (b)
0
20
40
60
80
100
0 100 200 300 400 500 600 700 800
T (°C)
∆m
(%
)
β = 2°C/minβ = 5°C/minβ = 10°C/min
β = 20°C/minβ = 15°C/min
-0,01
-0,009
-0,008
-0,007
-0,006
-0,005
-0,004
-0,003
-0,002
-0,001
0
0 100 200 300 400 500 600 700 800
T (°C)
d α/d
T (
min
-1)
β = 2°C/min
β = 5°C/min
β = 10°C/min
β = 20°C/min
β = 15°C/min
0
20
40
60
80
100
0 100 200 300 400 500 600 700 800
T (°C)
∆m
(%
)
β = 2°C/minβ = 5°C/minβ = 10°C/min
β = 20°C/minβ = 15°C/min
Figure 1. TG (inset) and DTG curves for rice straw under inert (0 % O2) (a) and oxidative (100 % O2) (b) atmospheres
Table 2: Characteristic temperatures (T0, Tpi) for each β and ambient of study
Ar β (°C/min)
T0
(°C) Tp1
(°C) Tp2
(°C) Tp3
(°C) Tp4
(°C) O2 β
(°C/min)T0
(°C) Tp1
(°C) Tp2
(°C) Tp3
(°C) Tp4
(°C)
2 25.0 34.9 289.2 299.8 430.0 2 25.0 51.4 270.5 378.3 407.2 5 25.0 57.3 290.8 316.9 445.0 5 28.0 62.9 273.0 387.4 425.7 10 25.0 71.5 291.4 330.6 462.0 10 25.0 74.6 287.7 402.3 452.9 15 25.0 81.6 301.4 335.6 465.0 15 30.0 83.8 291.6 408.9 457.5 20 25.0 86.1 313.6 346.6 470.0 20 30.0 95.4 297.1 419.8 473.1
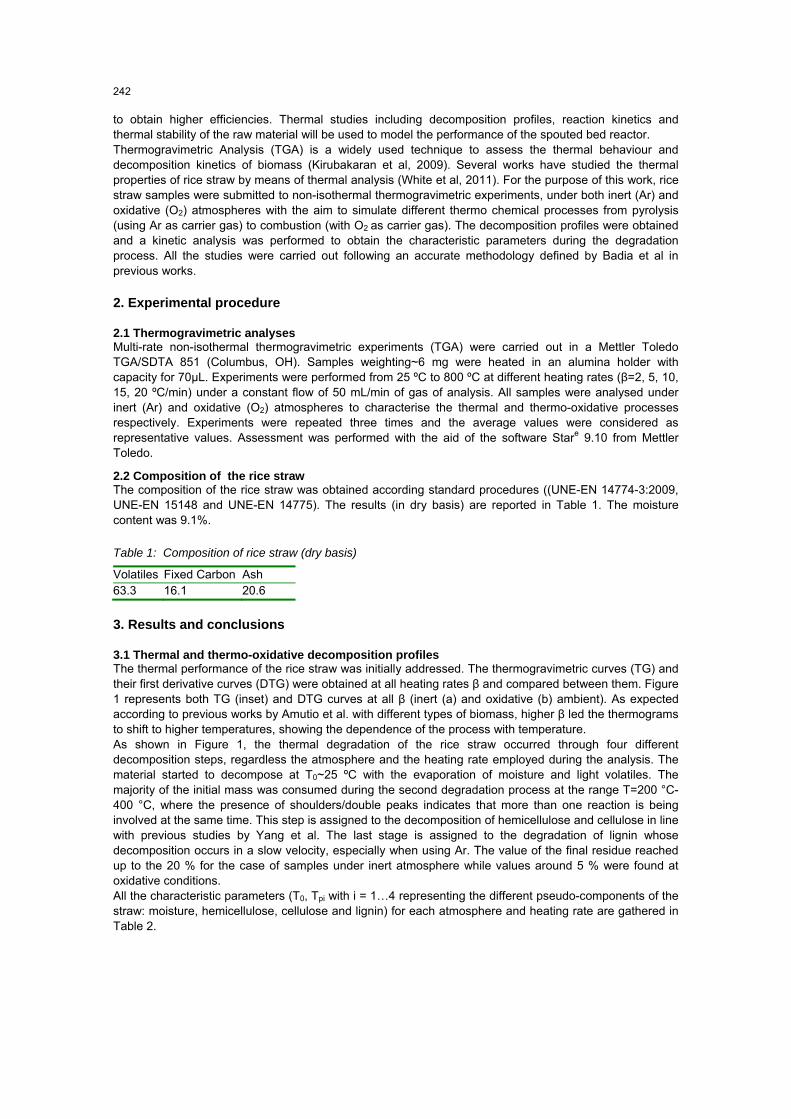
The use of a reactive ambient fastened the decomposition of the material, shifting the TG curves to lower temperatures in comparison with the results obtained under inert conditions, as shown in Figure 2 (a). These values provide valuable information for the design of the spouted bed reactor in terms of temperature of work and resulting decomposition processes of the main constituents of rice straw. A deconvolution procedure was applied to individually characterise and quantify each decomposition stage, as shown in Figure 2 (b).
-0,012
-0,010
-0,008
-0,006
-0,004
-0,002
0,000
0 100 200 300 400 500 600 700 800T (°C)
d α/d
T (m
in-1
)
Process 1-Moisture
Process 2-Hemicellulose
Process 3-Cellulose
Process 4-Lignin
Total process
-0,012
-0,01
-0,008
-0,006
-0,004
-0,002
0
0 100 200 300 400 500 600 700 800
T (°C)
d α/d
T (
min
-1)
β=2°C/min-O2
β=20°C/min-O2
β=2°C/min-Ar
β=20°C/min-Ar
(a) (b)
-0,012
-0,010
-0,008
-0,006
-0,004
-0,002
0,000
0 100 200 300 400 500 600 700 800T (°C)
d α/d
T (m
in-1
)
Process 1-Moisture
Process 2-Hemicellulose
Process 3-Cellulose
Process 4-Lignin
Total process
-0,012
-0,01
-0,008
-0,006
-0,004
-0,002
0
0 100 200 300 400 500 600 700 800
T (°C)
d α/d
T (
min
-1)
β=2°C/min-O2
β=20°C/min-O2
β=2°C/min-Ar
β=20°C/min-Ar
(a) (b)
Figure 2. Comparison of DTG curves for rice straw at different atmospheres and heating rates (a) - Deconvolution curves for rice straw at 20°C/min using Ar as carrier gas (b)
Table 3 gathers the values of mass loss of the different degradation processes for all atmospheres and heating rates.
243
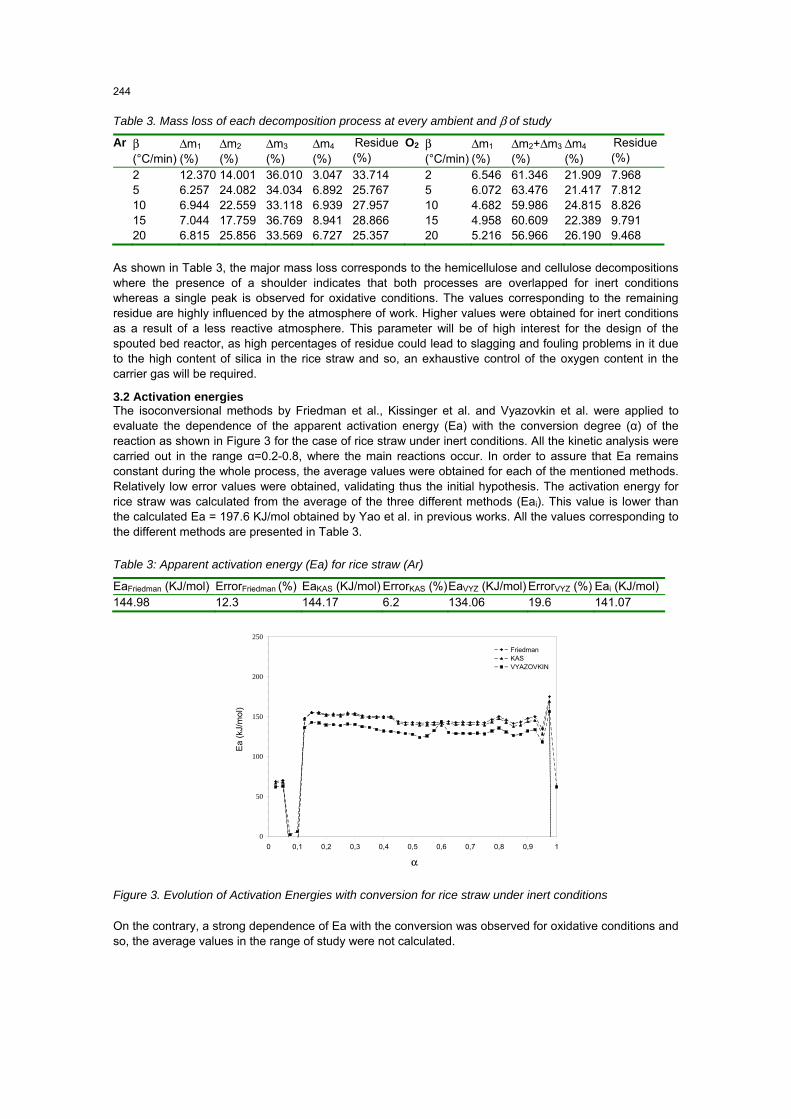
Table 3. Mass loss of each decomposition process at every ambient and β of study
Ar β (°C/min)
Δm1
(%) Δm2
(%) Δm3
(%) Δm4
(%) Residue(%)
O2 β (°C/min)
Δm1
(%) Δm2+Δm3 (%)
Δm4
(%) Residue (%)
2 12.370 14.001 36.010 3.047 33.714 2 6.546 61.346 21.909 7.968 5 6.257 24.082 34.034 6.892 25.767 5 6.072 63.476 21.417 7.812 10 6.944 22.559 33.118 6.939 27.957 10 4.682 59.986 24.815 8.826 15 7.044 17.759 36.769 8.941 28.866 15 4.958 60.609 22.389 9.791 20 6.815 25.856 33.569 6.727 25.357 20 5.216 56.966 26.190 9.468
As shown in Table 3, the major mass loss corresponds to the hemicellulose and cellulose decompositions where the presence of a shoulder indicates that both processes are overlapped for inert conditions whereas a single peak is observed for oxidative conditions. The values corresponding to the remaining residue are highly influenced by the atmosphere of work. Higher values were obtained for inert conditions as a result of a less reactive atmosphere. This parameter will be of high interest for the design of the spouted bed reactor, as high percentages of residue could lead to slagging and fouling problems in it due to the high content of silica in the rice straw and so, an exhaustive control of the oxygen content in the carrier gas will be required.
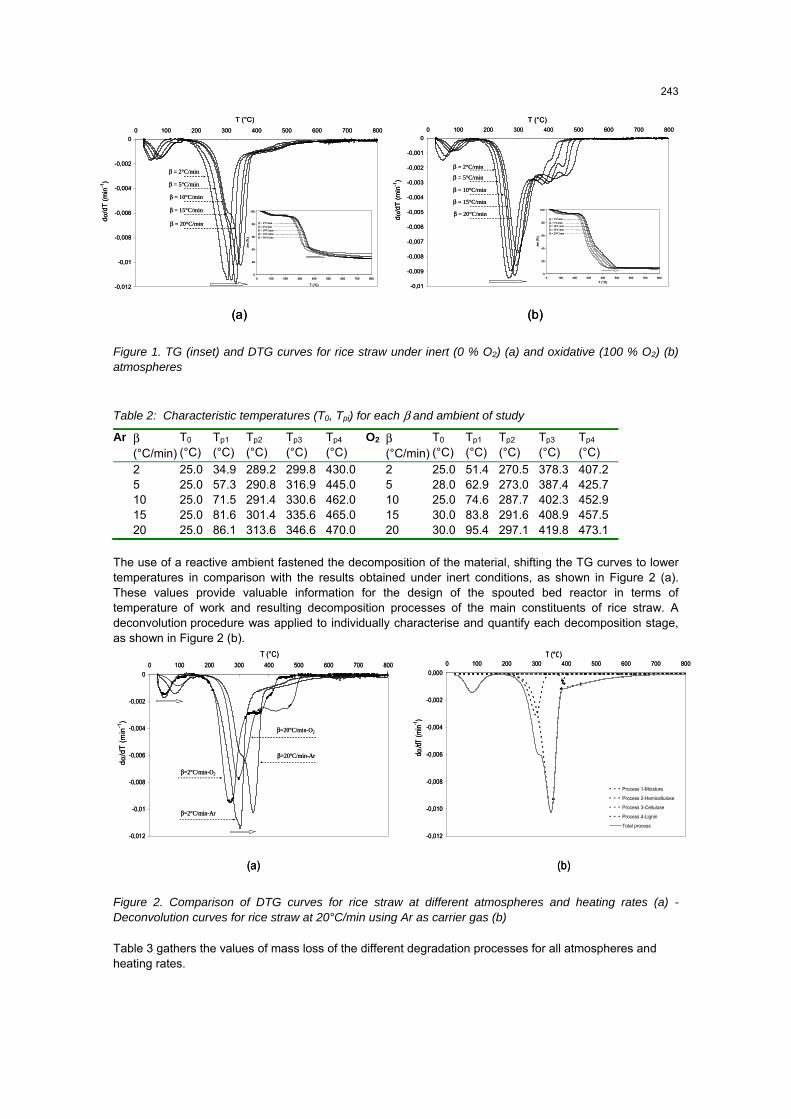
3.2 Activation energies The isoconversional methods by Friedman et al., Kissinger et al. and Vyazovkin et al. were applied to evaluate the dependence of the apparent activation energy (Ea) with the conversion degree (α) of the reaction as shown in Figure 3 for the case of rice straw under inert conditions. All the kinetic analysis were carried out in the range α=0.2-0.8, where the main reactions occur. In order to assure that Ea remains constant during the whole process, the average values were obtained for each of the mentioned methods. Relatively low error values were obtained, validating thus the initial hypothesis. The activation energy for rice straw was calculated from the average of the three different methods (Eai). This value is lower than the calculated Ea = 197.6 KJ/mol obtained by Yao et al. in previous works. All the values corresponding to the different methods are presented in Table 3.
Table 3: Apparent activation energy (Ea) for rice straw (Ar)
EaFriedman (KJ/mol) ErrorFriedman (%) EaKAS (KJ/mol) ErrorKAS (%)EaVYZ (KJ/mol) ErrorVYZ (%) Eai (KJ/mol)144.98 12.3 144.17 6.2 134.06 19.6 141.07
0
50
100
150
200
250
0 0,1 0,2 0,3 0,4 0,5 0,6 0,7 0,8 0,9 1
α
Ea
(kJ
/mol
)
FriedmanKASVYAZOVKIN
Figure 3. Evolution of Activation Energies with conversion for rice straw under inert conditions
On the contrary, a strong dependence of Ea with the conversion was observed for oxidative conditions and so, the average values in the range of study were not calculated.
244
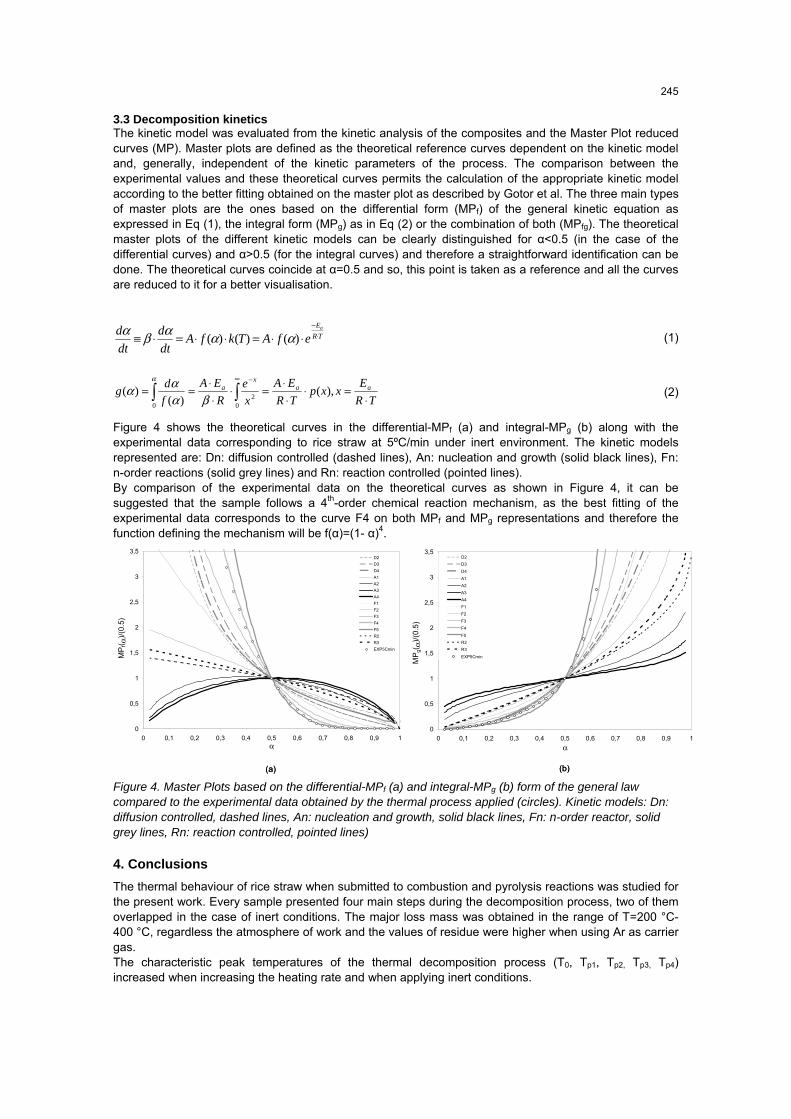
3.3 Decomposition kinetics The kinetic model was evaluated from the kinetic analysis of the composites and the Master Plot reduced curves (MP). Master plots are defined as the theoretical reference curves dependent on the kinetic model and, generally, independent of the kinetic parameters of the process. The comparison between the experimental values and these theoretical curves permits the calculation of the appropriate kinetic model according to the better fitting obtained on the master plot as described by Gotor et al. The three main types of master plots are the ones based on the differential form (MPf) of the general kinetic equation as expressed in Eq (1), the integral form (MPg) as in Eq (2) or the combination of both (MPfg). The theoretical master plots of the different kinetic models can be clearly distinguished for α<0.5 (in the case of the differential curves) and α>0.5 (for the integral curves) and therefore a straightforward identification can be done. The theoretical curves coincide at α=0.5 and so, this point is taken as a reference and all the curves are reduced to it for a better visualisation.
Figure 4 shows the theoretical curves in the differential-MPf (a) and integral-MPg (b) along with the experimental data corresponding to rice straw at 5ºC/min under inert environment. The kinetic models represented are: Dn: diffusion controlled (dashed lines), An: nucleation and growth (solid black lines), Fn: n-order reactions (solid grey lines) and Rn: reaction controlled (pointed lines). By comparison of the experimental data on the theoretical curves as shown in Figure 4, it can be suggested that the sample follows a 4th-order chemical reaction mechanism, as the best fitting of the experimental data corresponds to the curve F4 on both MPf and MPg representations and therefore the function defining the mechanism will be f(α)=(1- α)4.
0
0,5
1
1,5
2
2,5
3
3,5
0 0,1 0,2 0,3 0,4 0,5 0,6 0,7 0,8 0,9 1α
MP
f( α)/
(0.5
)
D2
D3
D4
A1
A2
A3
A4
F1
F2
F3
F4
F5
R2
R3
EXP5Cmin
0
0,5
1
1,5
2
2,5
3
3,5
0 0,1 0,2 0,3 0,4 0,5 0,6 0,7 0,8 0,9 1
α
MP
g( α
)/(0
.5)
D2
D3
D4
A1
A2
A3
A4
F1
F2
F3
F4
F5
R2
R3
EXP5Cmin
(a) (b)
0
0,5
1
1,5
2
2,5
3
3,5
0 0,1 0,2 0,3 0,4 0,5 0,6 0,7 0,8 0,9 1α
MP
f( α)/
(0.5
)
D2
D3
D4
A1
A2
A3
A4
F1
F2
F3
F4
F5
R2
R3
EXP5Cmin
0
0,5
1
1,5
2
2,5
3
3,5
0 0,1 0,2 0,3 0,4 0,5 0,6 0,7 0,8 0,9 1
α
MP
g( α
)/(0
.5)
D2
D3
D4
A1
A2
A3
A4
F1
F2
F3
F4
F5
R2
R3
EXP5Cmin
(a) (b)
Figure 4. Master Plots based on the differential-MPf (a) and integral-MPg (b) form of the general law compared to the experimental data obtained by the thermal process applied (circles). Kinetic models: Dn: diffusion controlled, dashed lines, An: nucleation and growth, solid black lines, Fn: n-order reactor, solid grey lines, Rn: reaction controlled, pointed lines)
4. Conclusions The thermal behaviour of rice straw when submitted to combustion and pyrolysis reactions was studied for the present work. Every sample presented four main steps during the decomposition process, two of them overlapped in the case of inert conditions. The major loss mass was obtained in the range of T=200 °C-400 °C, regardless the atmosphere of work and the values of residue were higher when using Ar as carrier gas. The characteristic peak temperatures of the thermal decomposition process (T0, Tp1, Tp2, Tp3, Tp4) increased when increasing the heating rate and when applying inert conditions.
TREa
efATkfAdtd
dtd ⋅
−
⋅⋅=⋅⋅=⋅≡ )()()( αααβα (1)
∞ −
⋅=⋅
⋅⋅
=⋅⋅⋅
==α
βααα
0 02 ),(
)()(
TRExxp
TREA
xe
REA
fdg aa
xa (2)
245

The total average activation energy of the process for each sample was calculated. After the kinetic analysis, it was concluded that Ea can be assumed as constant for the range of study (α=0.2-0.8) only for inert atmosphere. The average value in this case was Ea=141.07 KJ/mol. The kinetic model was evaluated with the aid of master plots, obtaining the best fitting for the 4th-order chemical reaction mechanism.
References
Akahira T., Sunose T., 1971, Trans. Joint Convention of Four Electrical Institutes, Paper N.246, Research Report/Chiba Institute of Technology. Scientific Technology, 16, 22-31.
Amutio M., Lopez G., Aguado R., Artetxe M., Bilbao J., Olazar M., 2012, Kinetic study of lignocellulosic biomass oxidative pyrolysis, Fuel 95, 305-311.
Badia J.D, Santonja-Blasco L., Martinez-Felipe A., Ribes-Greus A, 2012, A methodology to assess the energetic valorization of bio-based polymers from the packaging industry: pyrolysis of reprocessed polylactide, Bioresource Technology, 111, 468–475.
Epstein N., Grace J.R., 2011, Spouted and Spout-fluid beds. Fundamentals and applications. Ed. Cambridge university Press.
FAOSTAT (Food and Agriculture Organization of the United Nations), 2013, Production crops <faostat3.fao.org>, Accessed 12.12.2013.
Friedman H.L., 1967, Kinetics and gaseous products of thermal decomposition of polymers. Journal of Macromolecular Science Part A, 1 (1), 57-79.
Gotor F.J., Criado J.M., Malek J., Koga N., 2000, Kinetic analysis of solid-state reactions: the universatility of master plots for analysing isothermal and non-isothermal experiments. Journal of Physical Chemistry A 104, 10777-10782.
Kirubakaran V., Sivaramakrishnan V., Nalini R., Sekar T., Premalatha M., Subramanian P., 2009, A review on gasification of biomass, Renewable and Sustainable Energy reviews 13, 179-186.
Lim J.S., Manan Z.A., Alwi W., Hashim H., 2012, A review on utilisation of biomass from rice industry as a source of renewable energy, Renewable and sustainable energy reviews 16, 3084-3094.
Peres A.P.G., Lunelli B.H., Filho R.B., 2013, Applications of biomass to hydrogen and syngas production, Chemical Engineering Transactions 32, DOI: 10.3303/CET1332099.
Yang H., Yan R., Chen H., Ho Lee D., Zheng C., 2007, Characteristics of hemicellulose, cellulose and lignin pyrolysis, Fuel 86, 1781-1788.
Yao F., Wu Q., Lei Y., Wuo W., Xu Y., 2008, Thermal decomposition kinetics of natural fibers: Activation energy with dynamic thermogravimetric analysis, Polymer Degradation and Stability 93, 90-98.
Vyazovkin S., Dollimore D., 1996, Linear and non-linear procedures in isoconversional computations of the activation energy of non-isothermal reactions in solids. Journal of Chemical Information and Modelling 36, 42-45.
White J.E., Catallo W.J., Legendre B.L., 2011, Biomass pyrolysis kinetics: A comparative critical review with relevant agricultural residue case studies, Journal of Analytical and Applied Pyrolysis 91, Issue 1, 1-33.
246