comparative studies of the reflectance and degree of linear ... · journal of quantitative...
TRANSCRIPT
ARTICLE IN PRESS
Journal of Quantitative Spectroscopy &
0022-4073/$ - se
doi:10.1016/j.jq
�CorrespondE-mail addr
Radiative Transfer 100 (2006) 340–358
www.elsevier.com/locate/jqsrt
Comparative studies of the reflectance and degreeof linear polarization of particulate surfaces and
independently scattering particles
Yuriy Shkuratova,�, Sergey Bondarenkoa, Andrey Ovcharenkoa, Carle Pietersb,Takahiro Hiroib, Hester Voltenc, Olga Munozd, Gorden Videene
aAstronomical Institute of Kharkov National University, 35 Sumskaya St. Kharkov 61022, UkrainebDepartment of Geological Sciences, Brown University, Providence RI 02912, USA
cAstronomical Institute Anton Pannekoek, University of Amsterdam, Kruislaan 403, NL-1098 SJ Amsterdam, NetherlandsdInstituto de Astrofısica de Andalucıa, CSIC, Camino Bajo de Huetor 50, Granada 18008, SpaineArmy Research Laboratory AMSRL-CI-EM, 2800 Powder Mill Road, Adelphi MD 20783, USA
Abstract
We compare measurements of the phase-angle dependencies of the intensity and degree of linear polarization of particles
in air and particulate surfaces. The samples were measured at two spectral bands centered near 0.63 and 0.45 mm. The
surfaces were measured with the new photometer/polarimeter at the Astronomical Institute of Kharkov National
University. The scattering measurements of the particles in air were carried out with the equipment currently located at the
University of Amsterdam. We study a suite of samples of natural mineral particles of different sizes all in the micrometer
range, i.e. comparable with the wavelengths. The samples are characterized by a variety of particle shapes and albedos. The
samples have been studied in several works and in this paper we include new SEM microphotographs of particles and
spectra of powders in a wide spectral range, 0.3–50 mm, using the RELAB equipment of Brown University. We made
measurements of particulate surfaces in a phase-angle range, 2–601 that is significantly wider than that of our previous
studies. We confirm our earlier results that the negative polarization of the surfaces may be a remnant of the negative
polarization of the single scattering by the particles that constitute the surfaces. We also find differences in the spectral
behavior of the polarization degree of particles in air and particulate surfaces at large phase angles.
r 2005 Elsevier Ltd. All rights reserved.
1. Introduction
Experimental and theoretical analyses of phase-angle dependencies of single scattering by particles in airand of particulate surfaces are important for many scientific and engineering applications. In particular,laboratory modeling of the backscatter photometric and polarimetric effects (the latter is often called negativepolarization) of particulate surfaces at small phase angles are important for the development of remote-sensing researches of atmosphereless celestial bodies [1]. To calculate light scattering by particulate surfaces
e front matter r 2005 Elsevier Ltd. All rights reserved.
srt.2005.11.050
ing author. Tel.: +38 057 702 2207; fax: +38 057 243 2428.
ess: [email protected] (Y. Shkuratov).

ARTICLE IN PRESSY. Shkuratov et al. / Journal of Quantitative Spectroscopy & Radiative Transfer 100 (2006) 340–358 341
like planetary regoliths, the classical radiative transfer theory is used [2,3]. Various approximations of thetheory give more or less good fits for different ranges of phase angles, but there is no satisfactory modeldescribing the full range of illumination/observation geometries [4]. This may be the result of a lack of rigor inthe models. For instance in all these models, particles constituting the particulate surface are in close physicalcontact, yet are considered to scatter independently of each other. To test the applicability of independentscattering to high albedo particulate surfaces consisting of large transparent spherical particles, a series oflaboratory photometric and polarimetric measurements were carried out [4,5]. It was shown [5] thatindependent scattering is a good approximation for high albedo surfaces consisting of spheres.
Determining the scattering characteristics of irregular particles is a difficult task. Modeling studies facemany complications. First and foremost is the task of characterizing the particles. In addition, numericalgorithms are computationally intensive even for a single orientation. If the particle orientation is unknownand a size distribution is taken into account, the computational requirements may be prohibitive. For thesereasons, experimental investigations of scattering properties of representative particles in air or composingparticulate surfaces are useful and attractive. Such laboratory measurements have been carried out in ourprevious paper [6] in a range of small phase angles, 0.2–171. The particulate surface measurements ofpowdered natural mineral samples were carried out with the equipment at Kharkov National University, andthe scattering measurements of particles in air were made with the equipment currently located at theUniversity of Amsterdam. These measurements allow a direct comparison of the phase curves of intensity andthe polarization degree of particles in air and the same particles forming an optically thick layer on a substrate,demonstrating that the backscatter effects of particulate surfaces are partially due to the contribution of singlescattering. In addition it was shown that the negative polarization of the surfaces may be a remnant of thenegative polarization of the single scattering by the particles that constitute the surfaces. This result also wasconfirmed with computer simulations of the light scattering from the particulate surfaces [6].
The main purpose of this paper is further verification of results obtained earlier [6], but for a wider phaseangle range for the particulate surfaces, exploiting a new instrument. Moreover, we performed an additionalcharacterization of the samples used in our previous studies [6–12], by means of new SEM images andreflectance spectra in the range 0.3–50 mm.
2. Instruments for photopolarimetry
2.1. Large-phase-angle photometer/polarimeter
The large-phase-angle photometer/polarimeter is located at Kharkov National University. Like our small-phase-angle photometer/polarimeter [13,14], this new instrument is used to study phase curves of reflectanceand degrees of linear polarization of unpolarized incident light scattered by powdered surfaces. The large-phase-angle photometer/polarimeter allows measurements in the phase-angle range 2–1601 [15]. For themeasurements presented here the samples are viewed with the detector along the sample normal. For thisgeometry we measure samples at phase angles 2–601. The rotational light-source arm changes the incidenceangle and corresponding phase angle a. The sample albedo A is measured at a ¼ 101 relatively to a compressedHalon sample, which we use as a reflectance standard [16]. The instrument employs halogen lamps asunpolarized light sources. For this study, we select spectral bands centered at lred ¼ 0:63mm andlblue ¼ 0:45 mm, with bandwidths 70.06 and 70.05 mm, respectively. We note the large-phase-anglephotometer/polarimeter is calibrated against the small-phase-angle instrument. The sizes of the particulatesurfaces in our measurements are approximately 10� 20mm. We measure optically thick layers of powdersplaced on flat substrate. The accuracy of the measurements is within 0.05%, including random and systematicerrors. Measurements are repeated at different times to test for reproducibility. Typical differences are within0.05%.
2.2. Nephelometer
This light-scattering nephelometer allows us to measure all 16 elements of the Mueller light-scatteringmatrix from ensembles of randomly oriented particles in air under single-scattering conditions in the phase-

ARTICLE IN PRESSY. Shkuratov et al. / Journal of Quantitative Spectroscopy & Radiative Transfer 100 (2006) 340–358342
angle range from 71 to 1751. It is currently located at the University of Amsterdam. A detailed description ofthe instrument is given in [12].
The complete scattering matrices as functions of the scattering angle of the samples in air presented in thiswork have been published previously in [7–12]. In this paper, we consider only two elements of the scatteringmatrix: the scattered intensity IðaÞ and the degree of linear polarization for unpolarized incident light PðaÞ.The measurements are carried out with a HeNe laser (0.633 mm, 5mW) or a HeCd laser (0.442 mm, 40mW) asa light source. The laser light is scattered by the ensemble of randomly oriented particles located in a jet streamproduced by an aerosol generator. The scattered light is detected with a photomultiplier that moves along acircular ring in the center of which the particle stream is located.
3. Samples
We have used 10 samples of natural mineral particles. Table 1 presents the most abundant mineral ormineral groups of our samples together with two particle parameters defined in [17]. The effective radius
reff ¼
R10 rpr2nðrÞdrR10 pr2nðrÞdr
and effective variance
veff ¼
R10 ðr� reff Þ
2pr2nðrÞdr
r2effR10 pr2nðrÞdr
,
where n(r) dr is the fraction of the total number of projected surface equivalent spheres with radii in the sizerange [r,r+dr] per unit volume of space. More detailed information about the properties of the samples can befound in [7–12] and http://www.astro.uva.nl/scatter/. Optical microscope images of the particulate surfaceswith a description of the surface preparation can be found in [6]. For additional characterization we presentbelow new SEM photos and spectra of the samples.
3.1. SEM photos
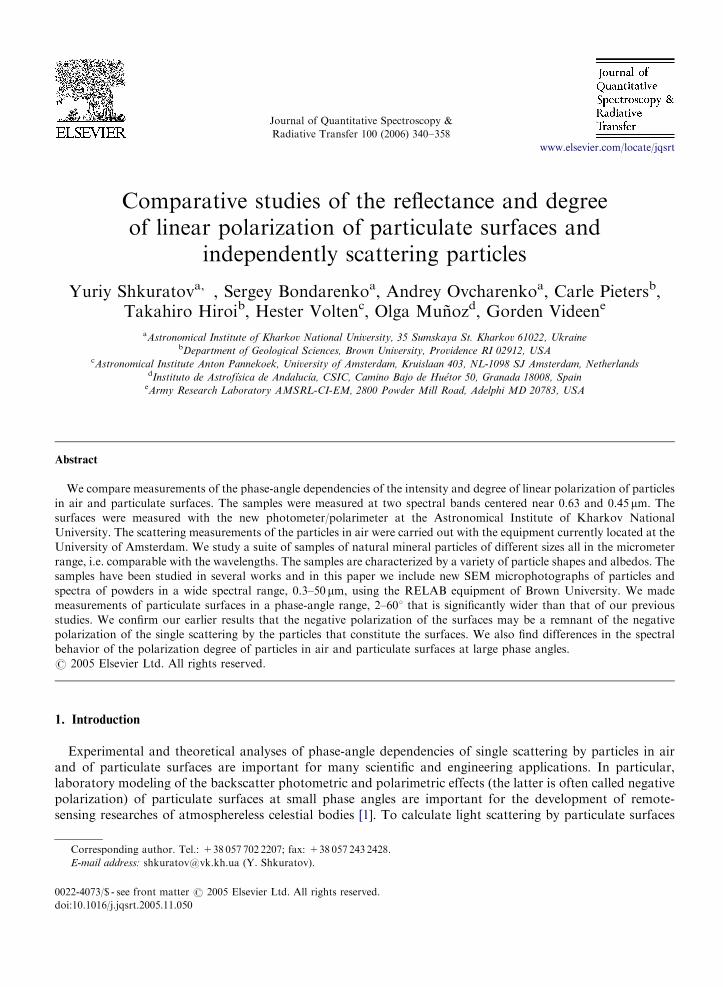
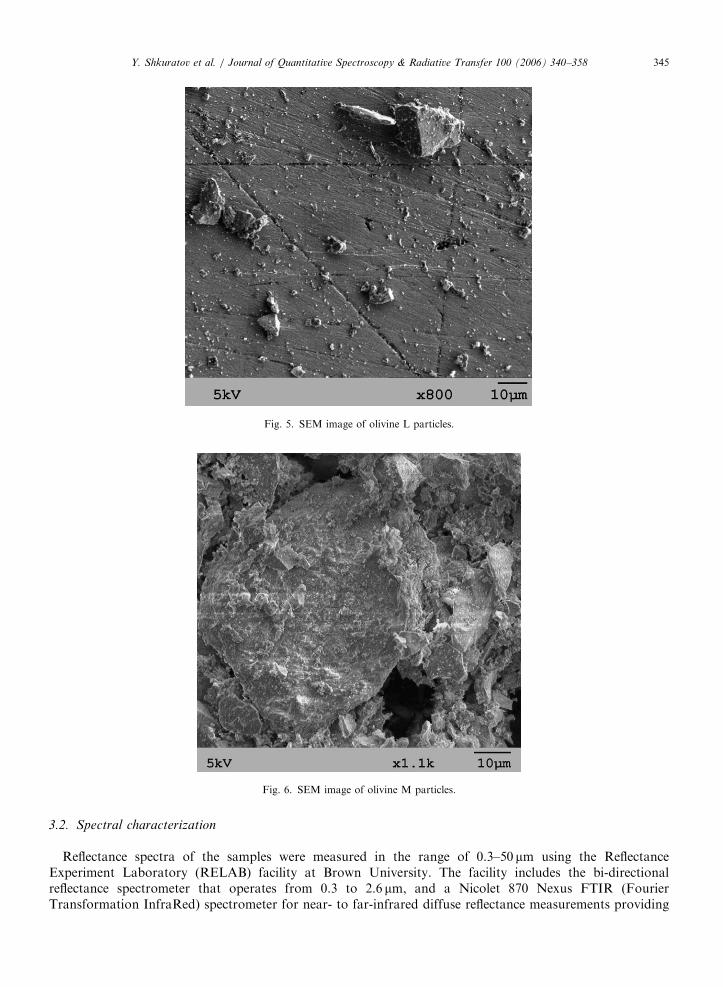
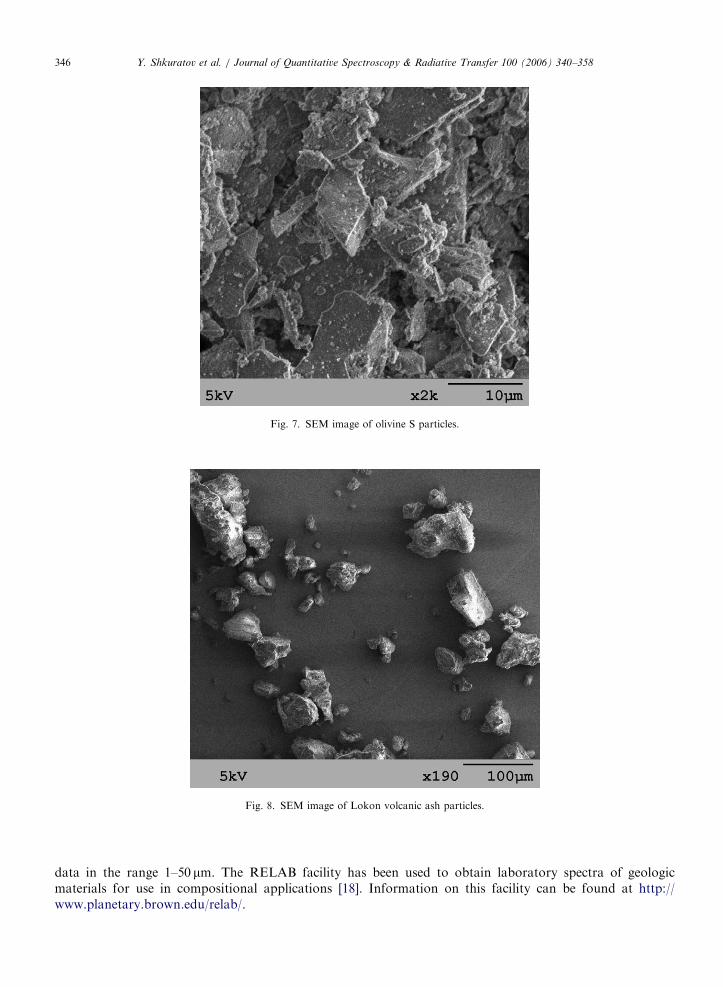
Using the scanning electron microscope of Kharkov National University we have obtained many SEMphotomicrographs of the samples with different magnifications. In Figs. 1–10 we show a representative SEMimage for each sample in this study. The feldspar powder presented in Fig. 1 consists of particles with sharpangular shapes forming smooth, flat facets. Unlike feldspar particles, the loess particles shown in Fig. 2 haverounded shapes with small-scale surface roughness. In contrast, the green and red clay presented in Figs. 3 and4 show agglomerated structures. In Figs. 5–7, we present the three olivine samples. They all were producedfrom the same bulk sample; therefore, they have the same mineralogical composition. However, they wereprepared so that three different size distributions were obtained. The ball-milled bulk sample was subsequently
Table 1
Characteristics of samples studied
Sample reff (mm) veff Main constituents
Feldspar 1.0 1.0 K-feldspar, plagioclase, quartz
Loess 3.9 2.6 K-feldspar, illite, quartz, calcite, chlorite, albite
Green clay 1.55 1.4 Illite, kaolinite, montmorillonite, quartz
Red clay 1.5 1.6 Biotite, illite, quartz
Olivine L 3.8 3.7 Mg-rich olivine (Mg1.8Fe0.14SiO4)
Olivine M 2.6 5.0 Mg-rich olivine (Mg1.8Fe0.14SiO4)
Olivine S 1.3 1.8 Mg-rich olivine (Mg1.8Fe0.14SiO4)
Lokon volcanic ash 7.1 2.6 Silica glass, plagioclase, magnetite
Pinatubo volcanic ash 3.0 12.3 Silica glass, plagioclase, amphibole, magnetite
Fly ash 3.65 10.9 Clay minerals

ARTICLE IN PRESS
Fig. 1. SEM image of feldspar particles.
Fig. 2. SEM image of loess particles.
Y. Shkuratov et al. / Journal of Quantitative Spectroscopy & Radiative Transfer 100 (2006) 340–358 343
sieved with a 65 and 20 mm sieve, producing three different size distributions designated as L (with particlesgenerally in the 20–65 mm diameter range), M (with particles generally smaller or equal to 65 mm), and S (withparticles smaller than 20 mm in diameter). As discussed in [7], the sieving procedure did not remove all particleswith diameter smaller than 20 mm from sample L. Most olivine particles have angular shapes with sharp edges,independent of size. We also have studied two samples of volcanic ashes from the Lokon and Pinatubo

ARTICLE IN PRESS
Fig. 3. SEM image of green clay particles.
Fig. 4. SEM image of red clay particles.
Y. Shkuratov et al. / Journal of Quantitative Spectroscopy & Radiative Transfer 100 (2006) 340–358344
volcanoes (Figs. 8 and 9). These two samples also present particles of very irregular shapes with extensivesurface structure. The fly-ash sample originates from the inorganic fraction (mainly clays) of the combustionof powdered coal in an electric power plant. As shown in Fig. 10, it consists of aggregates of nearly sphericalparticles.
ARTICLE IN PRESS
Fig. 5. SEM image of olivine L particles.
Fig. 6. SEM image of olivine M particles.
Y. Shkuratov et al. / Journal of Quantitative Spectroscopy & Radiative Transfer 100 (2006) 340–358 345
3.2. Spectral characterization
Reflectance spectra of the samples were measured in the range of 0.3–50 mm using the ReflectanceExperiment Laboratory (RELAB) facility at Brown University. The facility includes the bi-directionalreflectance spectrometer that operates from 0.3 to 2.6 mm, and a Nicolet 870 Nexus FTIR (FourierTransformation InfraRed) spectrometer for near- to far-infrared diffuse reflectance measurements providing
ARTICLE IN PRESS
Fig. 7. SEM image of olivine S particles.
Fig. 8. SEM image of Lokon volcanic ash particles.
Y. Shkuratov et al. / Journal of Quantitative Spectroscopy & Radiative Transfer 100 (2006) 340–358346
data in the range 1–50 mm. The RELAB facility has been used to obtain laboratory spectra of geologicmaterials for use in compositional applications [18]. Information on this facility can be found at http://www.planetary.brown.edu/relab/.

ARTICLE IN PRESS
Fig. 9. SEM image of Pinatubo volcanic ash particles.
Fig. 10. SEM image of fly ash particles.
Y. Shkuratov et al. / Journal of Quantitative Spectroscopy & Radiative Transfer 100 (2006) 340–358 347
Measured reflectance spectra of the samples are given in Figs. 11–13 for the range of wavelengths 0.3–50 mm.All spectra were obtained by the FTIR spectrometer with a 301 incidence angle and a 301 emergence angle andby the bidirectional spectrometer with a 301 incidence angle and a 01 emergence angle.
The measured spectra are rather typical for terrestrial silicates [19,20]. All samples have low reflectance inthe infrared range 7–50 mm. In this region the features associated with the Si–O stretching and O–Si–O

ARTICLE IN PRESS
1000 10000 100000
Wavelength, nm
0
0.2
0.4
0.6
0.8
1
Nor
mal
ized
bri
ghtn
ess
Feldspar
Red clay
Green clay
Loess
Fig. 11. Reflectance spectra of bright samples: feldspar, green and red clays, and loess.
1000 10000 100000
Wavelength, nm
0
0.2
0.4
0.6
0.8
1
Nor
mal
ized
bri
ghtn
ess
Olivine S
Olivine M
Olivine L
Fig. 12. Reflectance spectra of L, M, and S fractions of olivine.
Y. Shkuratov et al. / Journal of Quantitative Spectroscopy & Radiative Transfer 100 (2006) 340–358348
bending vibration bands (the reststrahlen bands) are observed (Figs. 11–13). These fundamental bands aredominated by surface scattering, which is why the reststrahlen bands are actually reflectance peaks. Thefeldspar and olivine mineral samples show prominent features corresponding to the reststrahlen bands. Allsamples show the very deep absorbed-water band centered near 2.7 mm (Figs. 11–13). The low reflectance in
ARTICLE IN PRESS
1000 10000 100000Wavelength, nm
0
0.2
0.4
0.6
0.8
1
Nor
mal
ized
bri
ghtn
ess
Pinatubo volcanic ash
Fly ash
Lokon volcanic ash
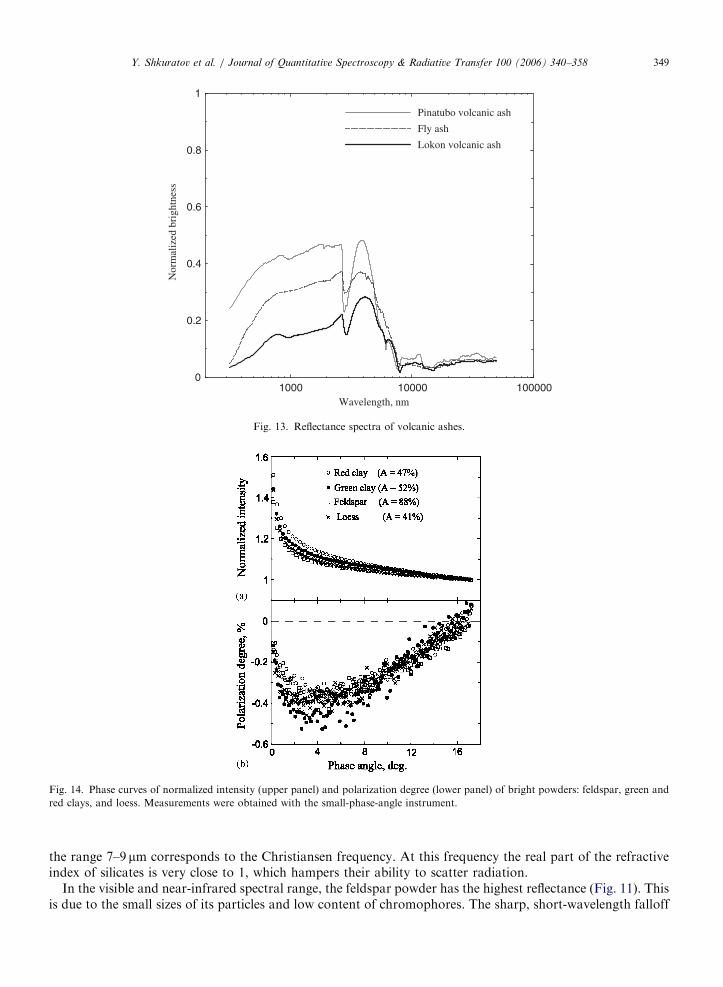
Fig. 13. Reflectance spectra of volcanic ashes.
Fig. 14. Phase curves of normalized intensity (upper panel) and polarization degree (lower panel) of bright powders: feldspar, green and
red clays, and loess. Measurements were obtained with the small-phase-angle instrument.
Y. Shkuratov et al. / Journal of Quantitative Spectroscopy & Radiative Transfer 100 (2006) 340–358 349
the range 7–9 mm corresponds to the Christiansen frequency. At this frequency the real part of the refractiveindex of silicates is very close to 1, which hampers their ability to scatter radiation.
In the visible and near-infrared spectral range, the feldspar powder has the highest reflectance (Fig. 11). Thisis due to the small sizes of its particles and low content of chromophores. The sharp, short-wavelength falloff

ARTICLE IN PRESS
Fig. 15. The same as Fig. 14 for the L, M, and S fractions of olivine.
Y. Shkuratov et al. / Journal of Quantitative Spectroscopy & Radiative Transfer 100 (2006) 340–358350
of reflectivity for red clay is responsible for its red color. This feature occurs due to Fe3+ ions in the clayminerals. The sample of green clay reveals a wide spectral band centered near 1 mm. The short-wavelengthwing of the band forms a reflectance surge near 0.54 mm that is responsible for its green color.
The olivine samples show different contrasts of the reststrahlen bands depending on particle size (Fig. 12).In an earlier work [21] it was shown that the fundamental Si–O stretching vibration bands of silicates aregreatly diminished in intensity as particle size is reduced. We indeed observe this in our measurements that thelargest particles (Olivine-L) have the strongest vibration bands; however, the Olivine-M bands appear weakerthan those of the Olivine-S. This anomaly also was measured by Volten et al. [22] for forsterite samplesprepared in the same manner and measured on different instruments. This may be due to the non-uniform sizedistributions of the different samples or possibly agglomeration of smaller particles onto larger particles. Allsamples of olivine exhibit a deep crystal field band near 1 mm characteristic of Fe2+ ions in the olivinecrystalline structure. In the visible and NIR spectral range the powders consisting of smaller particles showhigher reflectivity, as expected. The volcanic and fly ashes demonstrate comparatively smooth spectra. Notethat the Pinatubo ash reveals the deepest band at 2.7 mm of absorbed water.
4. Photopolarimetric measurements
4.1. Previous measurements
In [6] we show measurements of the brightness opposition effect and negative polarization of the powderson substrate made with the small-phase-angle photometer/polarimeter in the range of phase angles 0.2–171 at0.63 mm [6]. All intensity curves are normalized to 1 at 171. All these samples present prominent brightnessspikes and, except for fly ash, rather shallow (o0.6%) negative polarization branches. In the case of fly ash thenegative polarization is much stronger, up to 2%. No significant correlations of brightness and polarizationparameters with albedo are observed for feldspar, loess, green clay, and red clay, although their albedo variesby a factor of two (Fig. 14). The series of olivine measurements (Fig. 15) clearly demonstrate dependence ofthe examined effects on particle size. The samples with the largest particles show the narrowest brightnessspike and a very shallow asymmetric branch of negative polarization. The Lokon and Pinatubo volcanic ashsamples, although having different brightness opposition spikes, show almost the same shallow negative

ARTICLE IN PRESS
0 4 8 12 16Phase angle, deg.
-2
-1
0
Pola
riza
tion
degr
ee, %
Fly ash (A = 39%)
Lokon volcanic ash (A = 13%)
Pinatubo volcanic ash (A = 41%)
1
1.4
1.8
Nor
mal
ized
inte
nsity
(b)
(a)
Fig. 16. The same as Fig. 14 for the volcanic ashes.
Y. Shkuratov et al. / Journal of Quantitative Spectroscopy & Radiative Transfer 100 (2006) 340–358 351
polarization branches. The exception is fly ash, consisting of aggregates containing spherical particles (Fig.10), revealing a deep negative branch and unusual behavior at phase angles larger than 91 (Fig. 16).
After summarizing previous results we compare below new measurements for the phase function and degreeof linear polarization as a function of the phase angle for particulate surfaces and particles in air [7–12]. Asmentioned, the new measurements for particulate surfaces were made with the large-phase-angle photometer/polarimeter in the 2–60o phase-angle range. The phase functions for particles in air and particulate surfaces arenormalized to 1 at a ¼ 101. The measurements for particles in air are presented together with error bars. Incase the bar is not shown, the value for the standard deviation is smaller than the symbol plotted.
4.2. Measured phase function
As can be seen in Figs. 17–26, the scattering phase curves for particles in air show pronounced scatteringtoward the forward region, at large phase angles, and a relatively smaller rise at small phase angles, toward thebackward region. The surfaces show a monotonic brightness falloff with increasing phase angle; often this isalmost linear. In case of particulate surfaces a combination of three factors may be responsible for thebackscattering phenomenon: the shadow-hiding effect, multiple scattering between particles, and singlescattering by the individual particles. We can interpret many of the results in terms of the mechanisms thatplay a significant role in the backscattering region. Shadow hiding, for instance, is wavelength independent,depends on the surface structure and becomes negligible for transparent particulate systems. Multiplescattering is reduced by absorption and is wavelength dependent.
Because of the different wavelength dependencies of the mechanisms, it is interesting to compare the phase-angle curves of particles in air and particulate surfaces at the two different illumination wavelengths. For thefeldspar powdery surface, the curves are almost coincident at all studied phase angles; whereas, they aredifferent for particles in air under single-scattering conditions for phase angles larger than about 201 (Fig. 17).In contrast, we do see some differences related to the wavelength for both the loess particulate surface and theloess single particles in air (Fig. 18). The slope of the phase curve in red light is smaller than that in blue lightfor the loess surfaces. This is consistent with what would be expected: the higher the albedo, the higher themultiple-scattering component that compensates the shadow-hiding effect. Both green clay scattering by

ARTICLE IN PRESS
0 20 40 60 80 100
0
5
10
15
20
0.8
1.0
1.2
1.4
1.6
1.8
Nor
mal
ized
inte
nsity
Phase angle, deg
Pola
riza
tion
degr
ee, %
Feldspar red blue (A = 88%) (A = 67%)particles in air particulate surface
Fig. 17. Phase curves of normalized intensity (upper panel) and polarization degree (lower panel) of feldspar. Measurements of powder
were carried out with the large-phase-angle photometer/polarimeter; proper data for single particle scattering were obtained with the
Amsterdam instrument.
0 20 40 60 80 100-5
0
5
10
15
0.8
1.0
1.2
1.4Loess
red(A = 41%) (A = 24%)
particles in airparticulate surface
Nor
mal
ized
inte
nsity
Phase angle, deg
Pola
riza
tion
degr
ee, %
blue
Fig. 18. The same as Fig. 17 for loess.
Y. Shkuratov et al. / Journal of Quantitative Spectroscopy & Radiative Transfer 100 (2006) 340–358352
particles in air and by surfaces displays little spectral dependence (Fig. 19). This is also consistent with thesmall difference between the albedos of the green clay in blue and red light. The red clay powder unexpectedlyreveals very similar brightness phase functions at different wavelengths for single-particle scatter and

ARTICLE IN PRESS
0 20 40 60 80 100
0
5
10
15
20
0.8
1.0
1.2
1.4
1.6 Green Clay
red blue (A = 52%) (A = 48%)
particles in air particulate surface
Nor
mal
ized
inte
nsity
Phase angle, deg
Pola
riza
tion
degr
ee, %
Fig. 19. The same as Fig. 17 for green clay.
0 20 40 60 80 100
0
5
10
15
0.8
1.0
1.2
1.4
Red Clay red blue (A = 47%) (A = 17%)particles in air particulate surface
Nor
mal
ized
inte
nsity
Phase angle, deg
Pola
riza
tion
degr
ee, %
Fig. 20. The same as Fig. 17 for red clay.
Y. Shkuratov et al. / Journal of Quantitative Spectroscopy & Radiative Transfer 100 (2006) 340–358 353
noticeable differences for the particulate surface (Fig. 20). The latter is due to the differences in the scatteringalbedo at different wavelengths. The other samples also lack regularities in spectral difference of the phasecurves (Figs. 21–25). Because of the large differences in the brightness phase functions for particles in air andparticulate surfaces at phase angles larger than 101, we conclude that the role of single-particle scattering is

ARTICLE IN PRESS
0 20 40 60 80 100
0
3
6
9
0.8
1.0
1.2
Olivine L red blue
(A = 72%) (A = 70%)particles in airparticulate surface
Nor
mal
ized
inte
nsity
Phase angle, deg
Pola
riza
tion
degr
ee, %
Fig. 21. The same as Fig. 17 for olivine L.
0 20 40 60 80 100
0
5
10
0.8
1.0
1.2
1.4
Olivine M red blue (A = 74%) (A = 68%)
particles in air particulate surface
Nor
mal
ized
inte
nsity
Phase angle, deg
Pola
riza
tion
degr
ee, %
Fig. 22. The same as Fig. 17 for olivine M.
Y. Shkuratov et al. / Journal of Quantitative Spectroscopy & Radiative Transfer 100 (2006) 340–358354
secondary in this region. In contrast, comparison of the brightness phase functions of particles in air andparticulate surfaces at small phase angles (cf. Figs. 14–25) shows that the opposition brightness surges of thesurfaces can be formed partially with the contribution of single scattering.
ARTICLE IN PRESS
0 20 40 60 80 100
0
5
10
0.8
1.0
1.2
1.4 Olivine S
red blue (A = 78%) (A = 72%)particles in air particulate surface
Nor
mal
ized
inte
nsity
Phase angle, deg
Pola
riza
tion
degr
ee, %
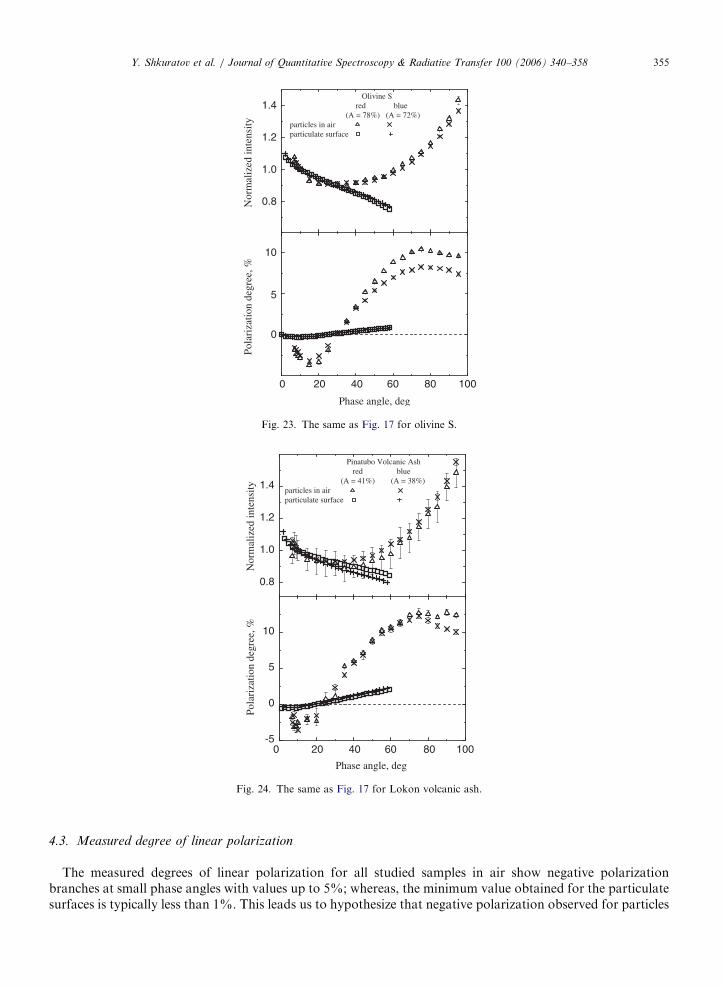
Fig. 23. The same as Fig. 17 for olivine S.
0 20 40 60 80 100-5
0
5
10
0.8
1.0
1.2
1.4
Pinatubo Volcanic Ash red blue (A = 41%) (A = 38%)particles in air particulate surface
Nor
mal
ized
inte
nsity
Phase angle, deg
Pola
riza
tion
degr
ee, %
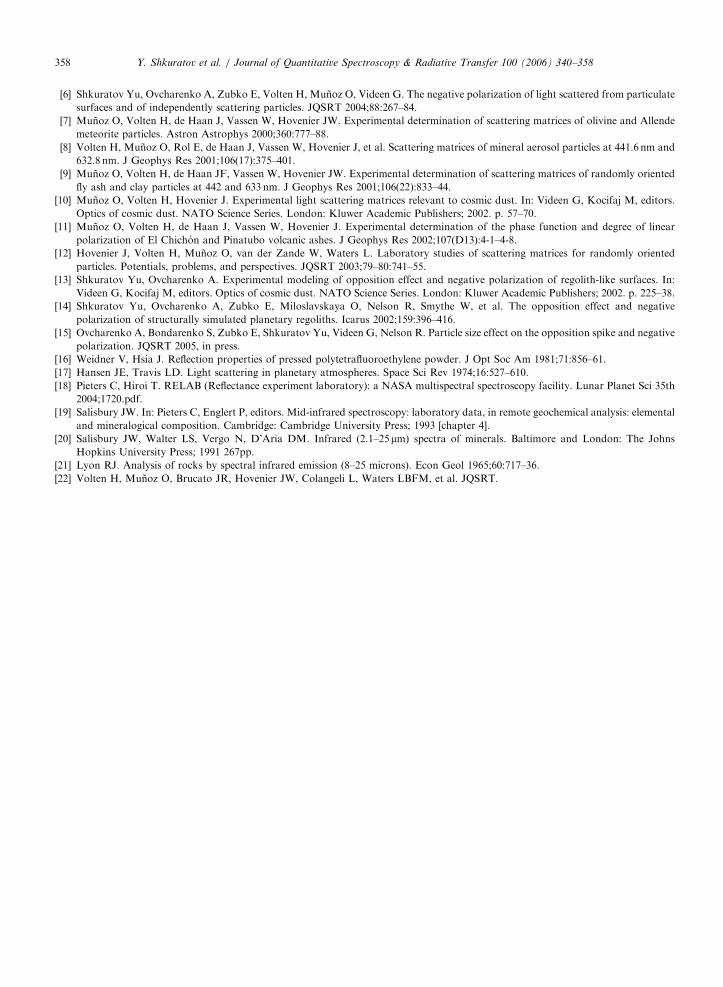
Fig. 24. The same as Fig. 17 for Lokon volcanic ash.
Y. Shkuratov et al. / Journal of Quantitative Spectroscopy & Radiative Transfer 100 (2006) 340–358 355
4.3. Measured degree of linear polarization
The measured degrees of linear polarization for all studied samples in air show negative polarizationbranches at small phase angles with values up to 5%; whereas, the minimum value obtained for the particulatesurfaces is typically less than 1%. This leads us to hypothesize that negative polarization observed for particles

ARTICLE IN PRESS
0 20 40 60 80 100
0
5
10
15
0.8
1.0
1.2
1.4
Nor
mal
ized
inte
nsity
Lokon Volcanic Ash red blue (A = 13%) (A = 8%)particles in air particulate surface
Phase angle, deg
Pola
riza
tion
degr
ee, %
Fig. 25. The same as Fig. 17 for Pinatubo volcanic ash.
0 20 40 60 80 100-3
0
3
6
0.4
0.8
1.2
1.6
Nor
mal
ized
inte
nsity
Fl Ashy blue (A = 31%)
particles in air particulate surface
Phase angle, deg
Pola
riza
tion
degr
ee, %
Fig. 26. The same as Fig. 17 for fly ash.
Y. Shkuratov et al. / Journal of Quantitative Spectroscopy & Radiative Transfer 100 (2006) 340–358356
in air could also be a dominant factor for particulate surfaces (cf. Figs. 14–26). Thus, the weak negativepolarization branches observed for the surfaces in Figs. 14–26 may be remnants of the negative polarization ofthe single scattering, surviving in spite of the masking by incoherent multiple scatter [6]. Especially striking isthe scattering by the fly ash particles in Fig. 26. In this exceptional case, the single-scattering oscillatorystructure is reproduced at lower amplitude by the surface composed of the same particles. This suggests thatsingle-scattering plays a significant role, but that its effect is reduced by multiple scattering.

ARTICLE IN PRESSY. Shkuratov et al. / Journal of Quantitative Spectroscopy & Radiative Transfer 100 (2006) 340–358 357
The behavior of the degree of linear polarization at large phase angles in red and blue light is not systematic.For instance, the feldspar and green clay particles in air show a higher maximum of PðaÞ, in the red light thanin the blue. However, there is no significant wavelength difference for the measurements of the same powderson substrate (Figs. 17 and 19). On the other hand, the loess and red clay powders that show very similar phasebehavior of polarization in red and blue light for particles in air, show a steeper PðaÞ at phase angles largerthan 301 (Figs. 18 and 20) at 0.44 mm than at 0.63 mm for the particulate surface. The greater steepness of PðaÞfor blue-light illumination is in agreement with a lower surface albedo. Indeed, a lower albedo implies a lowercontribution of incoherent multiple scattering that depolarizes the light.
Since the three olivine samples were obtained from the same original rock, the differences in the scatteringbehavior of these three samples must be related to the size of their particles. Figs. 21–23 show wavelengthdifferences of the polarimetric phase curves of the three olivine powders in air at phase angles larger than30–401. In contrast, the polarimetric phase curves for the same powders on substrate do not show anysignificant differences at the two studied wavelengths. The latter seems to be quite natural for the spectrallyneutral materials, whose optical properties do not vary significantly with wavelength. For instance, Lokonvolcanic ash, which consists of dark colored particles, is the only sample that shows the same spectral behaviorfor particles in air and particulate surfaces in the polarimetric phase curves. In this case PðaÞ at large phaseangles at 0.44 mm is steeper than at 0.63 mm for both particles in air and on substrates.
5. Conclusions
A suite of samples of natural mineral particles of different sizes, including those comparable with thewavelengths, has been studied in several works. Using SEM microphotographs of particles and spectra ofpowders obtained in a wide spectral range we suggest an additional characterization of the samples.Photometric and polarimetric measurements of particulate surfaces are made in the phase-angle range 2–601that is significantly wider than that in our previous studies (0.2–171) [6]. Comparative measurements of thephase-angle dependence of the intensity and degree of linear polarization of particulate surfaces and particlesin air show a significant variety. The measurements are consistent with our previous results that suggest thenegative polarization of the surfaces can be a remnant of the negative polarization of the single-particlescattering. A variety of spectral behaviors of polarization degree of single particles and particulate surfaces atlarge phase angles is found. In particular, in a few cases we found that brightness and polarization phasecurves are almost the same in blue and red light for particles in air; whereas, they are different for a particulatesurface consisting of the same particles.
Acknowledgments
This work was supported by the TechBase Program on Chemical and Biological Defense and by theBattlefield Environment Directorate under the auspices of the US Army Research Office Scientific ServicesProgram administered by Battelle (Delivery Order 291, Contract. no. DAAD19-02-D-0001). The authors (YS,SB, AO, and CP) also thank the CRDF grant UKP2-2614-KH-04. The work of OM was supported bycontract AYA 2004-03250.
References
[1] Shkuratov Yu, Videen G, Kreslavsky M, Belskaya I, Ovcharenko A, Kaydash V, et al. Scattering properties of planetary regoliths
near opposition. In: Videen G, Yatskiv Ya, Mishchenko M, editors. Photopolarimetry in remote sensing. NATO Science Series.
London: Kluwer Academic Publishers; 2004. p. 191–208.
[2] Hapke B. Theory of reflectance and emittance spectroscopy. Cambridge: Cambridge University Press; 1993 450pp.
[3] Mishchenko M, Dlugach M, Yanovitskij E, Zakharova N. Bidirectional reflectance of flat, optically thick particulate layers: an
efficient radiative transfer solution and applications to snow and soil surface. JQSRT 1999;63:409–32.
[4] Zhang H, Voss K. Comparison of bidirectional reflectance distribution function measurements on prepared particulate surfaces and
radiative transfer models. Appl Opt 2005;44:597–610.
[5] Goguen J. A test of the applicability of independent scattering to high albedo planetary regoliths. Lunar Planet Sci 1993;24:541–2.
ARTICLE IN PRESSY. Shkuratov et al. / Journal of Quantitative Spectroscopy & Radiative Transfer 100 (2006) 340–358358
[6] Shkuratov Yu, Ovcharenko A, Zubko E, Volten H, Munoz O, Videen G. The negative polarization of light scattered from particulate
surfaces and of independently scattering particles. JQSRT 2004;88:267–84.
[7] Munoz O, Volten H, de Haan J, Vassen W, Hovenier JW. Experimental determination of scattering matrices of olivine and Allende
meteorite particles. Astron Astrophys 2000;360:777–88.
[8] Volten H, Munoz O, Rol E, de Haan J, Vassen W, Hovenier J, et al. Scattering matrices of mineral aerosol particles at 441.6 nm and
632.8 nm. J Geophys Res 2001;106(17):375–401.
[9] Munoz O, Volten H, de Haan JF, Vassen W, Hovenier JW. Experimental determination of scattering matrices of randomly oriented
fly ash and clay particles at 442 and 633 nm. J Geophys Res 2001;106(22):833–44.
[10] Munoz O, Volten H, Hovenier J. Experimental light scattering matrices relevant to cosmic dust. In: Videen G, Kocifaj M, editors.
Optics of cosmic dust. NATO Science Series. London: Kluwer Academic Publishers; 2002. p. 57–70.
[11] Munoz O, Volten H, de Haan J, Vassen W, Hovenier J. Experimental determination of the phase function and degree of linear
polarization of El Chichon and Pinatubo volcanic ashes. J Geophys Res 2002;107(D13):4-1–4-8.
[12] Hovenier J, Volten H, Munoz O, van der Zande W, Waters L. Laboratory studies of scattering matrices for randomly oriented
particles. Potentials, problems, and perspectives. JQSRT 2003;79–80:741–55.
[13] Shkuratov Yu, Ovcharenko A. Experimental modeling of opposition effect and negative polarization of regolith-like surfaces. In:
Videen G, Kocifaj M, editors. Optics of cosmic dust. NATO Science Series. London: Kluwer Academic Publishers; 2002. p. 225–38.
[14] Shkuratov Yu, Ovcharenko A, Zubko E, Miloslavskaya O, Nelson R, Smythe W, et al. The opposition effect and negative
polarization of structurally simulated planetary regoliths. Icarus 2002;159:396–416.
[15] Ovcharenko A, Bondarenko S, Zubko E, Shkuratov Yu, Videen G, Nelson R. Particle size effect on the opposition spike and negative
polarization. JQSRT 2005, in press.
[16] Weidner V, Hsia J. Reflection properties of pressed polytetrafluoroethylene powder. J Opt Soc Am 1981;71:856–61.
[17] Hansen JE, Travis LD. Light scattering in planetary atmospheres. Space Sci Rev 1974;16:527–610.
[18] Pieters C, Hiroi T. RELAB (Reflectance experiment laboratory): a NASA multispectral spectroscopy facility. Lunar Planet Sci 35th
2004;1720.pdf.
[19] Salisbury JW. In: Pieters C, Englert P, editors. Mid-infrared spectroscopy: laboratory data, in remote geochemical analysis: elemental
and mineralogical composition. Cambridge: Cambridge University Press; 1993 [chapter 4].
[20] Salisbury JW, Walter LS, Vergo N, D’Aria DM. Infrared (2.1–25mm) spectra of minerals. Baltimore and London: The Johns
Hopkins University Press; 1991 267pp.
[21] Lyon RJ. Analysis of rocks by spectral infrared emission (8–25 microns). Econ Geol 1965;60:717–36.
[22] Volten H, Munoz O, Brucato JR, Hovenier JW, Colangeli L, Waters LBFM, et al. JQSRT.