comparative population genetics of seven notothenioid wsh
TRANSCRIPT
Polar Biol (2012) 35:1073–1086
DOI 10.1007/s00300-012-1155-xORIGINAL PAPER
Comparative population genetics of seven notothenioid Wsh species reveals high levels of gene Xow along ocean currents in the southern Scotia Arc, Antarctica
Malte Damerau · Michael Matschiner · Walter Salzburger · Reinhold Hanel
Received: 17 November 2011 / Revised: 12 January 2012 / Accepted: 20 January 2012 / Published online: 9 February 2012© Springer-Verlag 2012
Abstract The Antarctic Wsh fauna is characterized byhigh endemism and low species diversity with one perci-form suborder, the Notothenioidei, dominating the wholespecies assemblage on the shelves and slopes. Nototheni-oids diversiWed in situ through adaptive radiation and showa variety of life history strategies as adults ranging frombenthic to pelagic modes. Their larval development isunusually long, lasting from a few months to more than ayear, and generally includes a pelagic larval stage. There-fore, the advection of eggs and larvae with ocean currents isa key factor modulating population connectivity. Here, wecompare the genetic population structures and gene Xow ofseven ecologically distinct notothenioid species of thesouthern Scotia Arc based on nuclear microsatellites andmitochondrial DNA sequences (D-loop/cytochrome b). Theseven species belong to the families Nototheniidae (Gobio-notothen gibberifrons, Lepidonotothen squamifrons, Tre-matomus eulepidotus, T. newnesi) and Channichthyidae(Chaenocephalus aceratus, Champsocephalus gunnari,Chionodraco rastrospinosus). Our results show low-popu-lation diVerentiation and high gene Xow for all investigatedspecies independent of their adult life history strategies.In addition, gene Xow is primarily in congruence with the
prevailing ocean current system, highlighting the role oflarval dispersal in population structuring of notothenioids.
Keywords Notothenioids · Adaptive radiation · Scotia Arc · Dispersal · Isolation-with-migration · Population genetics
Introduction
The Southern Ocean surrounding the Antarctic continent isa unique marine environment and its Wsh fauna is character-ized by a high degree of endemism at low species diversity(Andriashev 1987; Eastman 1993, 2005). The northernboundary of the Southern Ocean is delimited by the Antarc-tic Convergence at about 50–60°S, which is marked by asharp decrease of surface temperature from north to southand constitutes a thermal barrier for many marine organ-isms existing since approximately 22–25 My (Dayton et al.1994; Eastman and McCune 2000). Besides its thermal iso-lation, the formation of deep circum-polar currents like theAntarctic Circumpolar Current (ACC) as well as largedistances and deep ocean basins between the Antarcticcontinental shelf and those of adjacent continents formadditional oceanographic, geographic and bathymetric bar-riers to migration and dispersal. The Antarctic ichthyofaunaas known today consists of 322 species from 50 families,with about 88% being endemic to the waters south of theAntarctic Convergence. A single group of Wsh, the perci-form suborder Notothenioidei, dominates the speciesassemblage on the shelves and slopes (Andriashev 1987;Eastman 2005).
Notothenioids consist of 131 species in 8 families, with104 species out of 5 of these families being endemic to theAntarctic region, where they constitute up to 77% of
Electronic supplementary material The online version of this article (doi:10.1007/s00300-012-1155-x) contains supplementary material, which is available to authorized users.
M. Damerau · R. Hanel (&)Institute of Fisheries Ecology, Johann Heinrich von Thünen-Institute, Federal Research Institute for Rural Areas, Forestry and Fisheries, Palmaille 9, 22767 Hamburg, Germanye-mail: [email protected]
M. Matschiner · W. SalzburgerZoological Institute, University of Basel, Vesalgasse 1, 4051 Basel, Switzerland
123

1074 Polar Biol (2012) 35:1073–1086
species diversity and 91% of biomass on the shelves andslopes of the continent and nearby islands (Eastman 2005).Together with members of the families Zoarcidae (24 spe-cies) and Liparidae (70 species), they comprise 88% of theAntarctic Wsh fauna (Eastman and McCune 2000). Butunlike the latter two families that probably invaded the areafrom North PaciWc waters, notothenioids diversiWed in situin the course of an adaptive radiation (Eastman 1993;Clarke and Johnston 1996; Eastman and McCune 2000;Matschiner et al. 2011). This radiation is thought to havebeen triggered by the acquisition of antifreeze glycopro-teins (AFGPs) that keep body Xuids from freezing in theice-laden waters of Antarctica (Cheng 1998; Matschineret al. 2011). While the cooling of Antarctic waters as wellas repeated expansions and retreats of the Antarctic icesheet forced most Antarctic species of the Oligocene toeither shift their distribution northwards or into deeperwaters, or otherwise led to their extinction (Briggs 2003;Barnes and Conlan 2007), notothenioids radiated in theabsence of competitors and Wlled vacant ecological niches(Eastman 1991). Although about one-half of today’sspecies show a demersal lifestyle (as is also presumed fortheir ancestors), the notothenioid radiation is largely basedon diversiWcation related to niches in the water column(Eastman 1993). Since notothenioids lack a swim bladder,buoyancy for pelagization is gained through extendedlipid depositions and reduced ossiWcation (Eastman 1993),resulting in a variety of epibenthic, semipelagic, cryopela-gic, and pelagic life strategies. Adaptive radiations in themarine realm are rare compared to those known from fresh-water systems like, for example, cichlid Wshes in the GreatLakes of East Africa (Seehausen 2006; Salzburger 2009;Matschiner et al. 2010) or are camouXaged by subsequentdispersal in the course of evolution. The notothenioidstherefore constitute a prime example for a marine adaptiveradiation, making their ecological and morphological diver-siWcation a highly interesting target for evolutionary studies(Eastman 2000).
In contrast to the variety of adult life history strategies,the early larval development in notothenioids is alwayspelagic. Depending on the species and locality, the larvalstage may be completed within 2 months after hatching orlast more than 1 year (Kellermann 1986, 1989; North2001). During this stage, strong currents like the clockwiseACC (Westwind Drift) or the counterclockwise EastwindDrift along the Antarctic continent are likely to modulatelarval dispersal away from the shelves into the open ocean.This may cause substantial losses to spawning populationsand can lead to source–sink relationships by transportinglarvae downstream toward distant shelf habitats. As White(1998) pointed out, the prolonged pelagic early life historystrategy in notothenioids is at odds with a successful larvalsurvival strategy. However, ichthyoplankton studies have
shown that larval abundances for demersal species aresurprisingly high on the shelf areas and decrease withincreasing distance to the coast, despite the fact that theirdistributions are generally inXuenced by bathymetry,hydrography, and seasonal events (Loeb et al. 1993; White1998). Local retention mechanisms, such as gyres formedbehind islands or shelf-break frontal systems limit oVshoretransport of larvae (White 1998) and should increasegenetic heterogeneity between populations of diVerentshelves, thereby fostering speciation.
Population genetic studies in notothenioids provide evi-dence that the oceanography of the Southern Ocean indeedhas large inXuence on the genetic structure of populations.Populations of species with circumpolar distributions as,for example, the pelagic Antarctic toothWsh Dissostichusmawsoni and the more sedentary benthopelagic PatagoniantoothWsh D. eleginoides are not signiWcantly diVerentiatedover large parts of their distribution range (Smith andGaVney 2005; Rogers et al. 2006). However, these resultsdo not imply complete absence of genetic heterogeneity, asother genetic markers were able to resolve diVerentiationson varying geographic scales (Parker et al. 2002; Shawet al. 2004; Kuhn and GaVney 2008). Populations con-nected along currents like the ACC are often found to bemore closely related than those located in proximity butseparated across frontal systems like, for example, the PolarFront (Shaw et al. 2004; Rogers et al. 2006). Even strictlybenthic species like the humped rockcod Gobionotothengibberifrons show no signs of diVerentiation among popu-lations separated geographically by nearly 2,000 km andbathymetrically by deep basins (Matschiner et al. 2009). Bycombining oceanographic data with population genetic sig-natures, Matschiner et al. (2009) showed that dispersal ofpelagic larvae in G. gibberifrons is most probably the majormeans of gene Xow in this otherwise benthic species. Thecontribution of larval dispersal to population structure andin the long term on species’ biogeography is still livelydebated not only in notothenioids, but also in Wsh fromwarmer waters with distinctly shorter pelagic early lifestages (e.g. Taylor and Hellberg 2003; Bay et al. 2006;Cowen and Sponaugle 2009). In particular, it is unclearwhat inXuence a prolonged pelagic early life stage and theexistence of strong currents (which together should result inhigh levels of gene Xow among populations) had on theadaptive radiation in notothenioids.
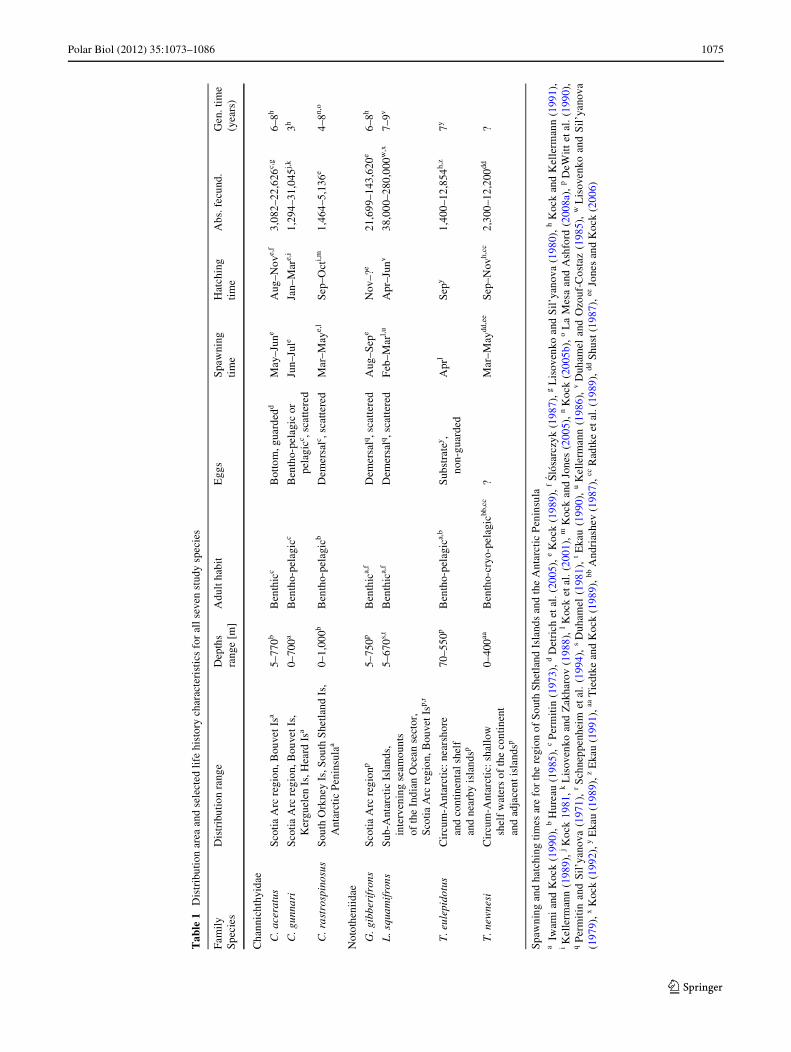
In this study, we compare the genetic signatures derivedfrom microsatellites and mitochondrial (mt) DNA sequencesof seven notothenioid species with diVerent life historystrategies and larval durations inhabiting the southernScotia Arc (Table 1). It is the Wrst time that the geneticpopulation structures based on two types of genetic markersare compared between multiple notothenioid species. Wealso included data obtained from drifting buoys to infer the
123
Polar Biol (2012) 35:1073–1086 1075
Tab
le1
Dis
trib
utio
n ar
ea a
nd s
elec
ted
life
his
tory
cha
ract
eris
tics
for
all
sev
en s
tudy
spe
cies
Spaw
ning
and
hat
chin
g tim
es a
re f
or th
e re
gion
of
Sout
h Sh
etla
nd I
slan
ds a
nd th
e A
ntar
ctic
Pen
insu
laa
Iwam
i an
d K
ock
(199
0), b
Hur
eau
(198
5), c
Per
miti
n (1
973)
, dD
etri
ch e
tal.
(200
5), e
Koc
k (1
989)
, fJ
lósa
rczy
k (1
987)
, gL
isov
enko
and
Sil’
yano
va (
1980
), h
Koc
k an
d K
elle
rman
n (1
991)
,iK
elle
rman
n (1
989)
, jK
ock
1981
, kL
isov
enko
and
Zak
haro
v (1
988)
, lK
ock
etal
. (20
01),
mK
ock
and
Jone
s (2
005)
, nK
ock
(200
5b),
oL
a M
esa
and
Ash
ford
(20
08a)
, p
DeW
itt e
tal.
(199
0),
qP
erm
itin
and
Sil’
yano
va (
1971
), r
Sch
nepp
enhe
im e
tal.
(199
4),
sD
uham
el (
1981
), t
Eka
u (1
990)
, u
Kel
lerm
ann
(198
6),
vD
uham
el a
nd O
zouf
-Cos
taz
(198
5),
wL
isov
enko
and
Sil’
yano
va(1
979)
, xK
ock
(199
2), y
Eka
u (1
989)
, zE
kau
(199
1), aa
Tie
dtke
and
Koc
k (1
989)
, bbA
ndri
ashe
v (1
987)
, ccR
adtk
e et
al. (
1989
), dd
Shus
t (19
87),
eeJo
nes
and
Koc
k (2
006)
Fam
ilySp
ecie
sD
istr
ibut
ion
rang
eD
epth
s ra
nge
[m]
Adu
lt h
abit
Egg
sS
paw
ning
ti
me
Hat
chin
g tim
eA
bs. f
ecun
d.G
en. t
ime
(yea
rs)
Cha
nnic
hthy
idae
C. a
cera
tus
Scot
ia A
rc r
egio
n, B
ouve
t Isa
5–77
0bB
enth
icc
Bot
tom
, gua
rded
dM
ay–J
une
Aug
–Nov
e,f
3,08
2–22
,626
c,g
6–8h
C. g
unna
riSc
otia
Arc
reg
ion,
Bou
vet I
s,
Ker
guel
en I
s, H
eard
Isa
0–70
0aB
enth
o-pe
lagi
ccB
enth
o-pe
lagi
c or
pe
lagi
cc , sca
ttere
dJu
n–Ju
leJa
n–M
are,
i1,
294–
31,0
45j,k
3h
C. r
astr
ospi
nosu
sSo
uth
Ork
ney
Is, S
outh
She
tland
Is,
A
ntar
ctic
Pen
insu
laa
0–1,
000b
Ben
tho-
pela
gicb
Dem
ersa
lc , sca
ttere
dM
ar–M
aye,
lSe
p–O
cti,m
1,46
4–5,
136e
4–8n,
o
Not
othe
niid
ae
G. g
ibbe
rifr
ons
Scot
ia A
rc r
egio
np5–
750p
Ben
thic
a,f
Dem
ersa
lq , sca
tter
edA
ug–S
epe
Nov
–?e
21,6
99–1
43,6
20e
6–8h
L. s
quam
ifro
nsSu
b-A
ntar
ctic
Isl
ands
,in
terv
enin
g se
amou
nts
of th
e In
dian
Oce
an s
ecto
r,
Scot
ia A
rc r
egio
n, B
ouve
t Isp,
r
5–67
0s,t
Ben
thic
a,f
Dem
ersa
lq , sca
tter
edF
eb–M
arl,u
Apr
–Jun
v38
,000
–280
,000
w,x
7–9v
T. e
ulep
idot
usC
ircu
m-A
ntar
ctic
: nea
rsho
re
and
cont
inen
tal s
helf
an
d ne
arby
isla
ndsp
70–5
50p
Ben
tho-
pela
gica,
bS
ubst
rate
y , no
n-gu
arde
dA
prl
Sepy
1,40
0–12
,854
h,z
7y
T. n
ewne
siC
ircu
m-A
ntar
ctic
: sha
llow
sh
elf
wat
ers
of th
e co
ntin
ent
and
adja
cent
isla
ndsp
0–40
0aaB
enth
o-cr
yo-p
elag
icbb
,cc
?M
ar–M
aydd
,ee
Sep–
Nov
h,cc
2,30
0–12
,200
dd?
123

1076 Polar Biol (2012) 35:1073–1086
inXuence of larval dispersal with oceanic currents on geneXow. Our study area is the southern Scotia Arc, consistingof the tip of the Antarctic Peninsula (AP), South ShetlandIslands (SSh) including Elephant Island (EI) located about200 km north of the Peninsula and the South OrkneyIslands (SO) approximately 420 km further east (Fig. 1).The shelves of the AP and SSh/EI are separated by trenchesof more than 500 m depth, whereas the SO shelf is sepa-rated by depths of 2,000–3,000 m. This region of the Sea-sonal Pack-Ice Zone, which is ice-free during the australsummer, is largely inXuenced by two water regimes: theACC Xowing eastward through the Scotia Sea in the northand water originating from the Weddell Sea in the south(Whitworth et al. 1994).
The species investigated in this study comprise the threechannichthyids Chaenocephalus aceratus, Champsocepha-lus gunnari, and Chionodraco rastrospinosus as well as thefour nototheniids G. gibberifrons, Lepidonotothen squami-frons, Trematomus eulepidotus, and T. newnesi, which areall among the most abundant species in the southern ScotiaArc. Their life histories diVer in a variety of traits (Table 1):C. aceratus, G. gibberifrons, and L. squamifrons are ben-thic species of which the two former ones spend most oftheir time resting on the bottom (Fanta et al. 1994; Kockand Jones 2005). C. gunnari, C. rastrospinosus, and T.eulepidotus show a benthopelagic lifestyle preying for foodin the water column (Rutschmann et al. 2011). Verticalmigrations between near bottom layers during the day andsub-surface waters during the night are known from severalnotothenioids including C. gunnari (Kock and Everson1997). T. newnesi shows a remarkable feeding plasticityand is considered a bentho-cryo-pelagic species (La Mesaet al. 2000). It is generally benthivorous, but carries out
vertical migrations during summer feeding on pelagicorganisms. In winter, when there is sea ice cover, T. new-nesi switches to a cryo-pelagic mode and feeds on organ-isms under the ice (Daniels 1982; Casaux et al. 1990; LaMesa et al. 2000).
The aim of this study is to investigate the role of pro-longed larval stages on the genetic population structures ofnotothenioids. Dispersing larvae should result in high simi-larities between geographically separated populations evenin those species that show a more sedentary habit as adults.We hypothesize that a high connectivity between popula-tions is a general characteristic of notothenioids whenhydrographic currents connect geographically separatedpopulations.
Methods
Sampling
The specimens analyzed in this study were collected duringexpedition ANT-XXIII/8 aboard RV Polarstern in Decem-ber 2005-January 2006 and U.S. AMLR (United StatesAntarctic Marine Living Resources) WnWsh survey inFebruary–March 2009 aboard RV Yuzhmorgeologiya.Sampling sites were located on the shelves at the tip of theAP, EI (the most easterly island of the SSh), and SO to theireast (Fig. 1). Muscle tissue of the specimens was stored in95% ethanol. DNA was extracted using two diVerent proto-cols depending on the cruise. All 2005–2006 samples wereextracted with the BioSprint 96 workstation (QIAGEN) fol-lowing the manufacturer’s protocol, whereas DNA from theAMLR 2009 samples was extracted by incubating muscle
Fig. 1 Study area and sampling localities in the southern Scotia Arc, Antarctica. Open circles = stations sampled during ANT-XXIII/8 2006, crosses = stations sampled during US AMLR 2009 WnWsh survey
Antarctic Peninsula
South Shetland Is.
South Orkney Is.
Elephant Is.
123

Polar Biol (2012) 35:1073–1086 1077
tissue in 300 �l 5%-Chelex solution containing 12 �l Pro-teinase K (20 mg/ml) for 3 h at 55°C, followed by a dena-turation step of 25 min at 98°C in a thermomixer.
MtDNA sequencing and data analysis
Depending on the ampliWcation success, mitochondrialgene sequences were either generated from the controlregion/D-loop (C. aceratus, C. gunnari, C. rastrospinosus,and G. gibberifrons) or cytochrome b (cyt b; L. squami-frons, T. eulepidotus, and T. newnesi). Partial D-loop or cytb were ampliWed with the primers LPR-02 and HDL2(Derome et al. 2002) or NotCytbF and H15915n (Matschineret al. 2011), respectively. For ampliWcation of the D-loopregion, 2 �l template DNA was mixed with 7.5 �l Taq PCRMaster Mix (QIAGEN), 0.5 �l of each 10 �M primer, 1 �lbovine serum albumin, and 14.5 �l sterile water. A simpli-Wed hot start at 94°C for 2 min initiated the PCR proWle fol-lowed by 35 cycles of 94°C for 30 s, 52°C for 30 s, and72°C for 90 s. Thermocycling Wnished with a Wnal elonga-tion step at 72°C for 7 min. Cytochrome b sequences wereampliWed using Phusion polymerase (Finnzymes) follow-ing the manufacturers manual at 57°C annealing temperature.PCR products were puriWed by adding 2 �l ExoSAP-IT(USB Corporation) to 5 �l PCR product following the man-ufacturer’s instructions.
Sequencing PCR with forward primers was performedusing the BigDye Terminator v3.1 Cycle Sequencing Kit(Applied Biosystems). After puriWcation with BigDyeXTerminator (Applied Biosystems), sequencing productswere run on an AB3130xl Genetic Analyzer (Applied Bio-systems). Sequences were automatically aligned withCodonCode Aligner (CodonCode Corp.), inspected by eye,and corrected manually if necessary.
Basic sequence properties as well as intraspeciWcsequence polymorphisms measured as nucleotide diversity(�) and haplotype diversity (h) were examined with DNASP5.10 (Librado and Rozas 2009). Population structureamong sampling localities was assessed by analysis ofmolecular variance (AMOVA) based on traditional F-sta-tistics and calculated with 16,000 permutations as imple-mented in ARELQUIN 3.5 (ExcoYer and Lischer 2010).
Phylogenetic trees were inferred with the MaximumLikelihood (ML) method implemented in PAUP* 4.0a112(SwoVord 2003), whereby models of sequence evolution wereselected according to BIC (Posada 2008). On the basis ofthese phylogenies, haplotype genealogies were constructedfollowing the method described in Salzburger et al. (2011).
The statistical power of both mtDNA and microsatellitesto detect signiWcant genetic diVerentiation between popula-tions was tested with POWSIM 4.0 (Ryman and Palm2006) using both the chi-squared test and Fisher’s exact
test. Various levels of diVerentiation (measured as FST inthe range from 0.001 to 0.08) were tested by combiningdiVerent eVective population sizes (Ne) and times sincedivergence (t). In addition, POWSIM allows calculating the� error (type I error), which is the probability of rejectingthe null hypothesis of genetic homogeneity although it wastrue by drawing the alleles directly from the base popula-tion (t = 0).
Microsatellite genotyping and data analysis
In addition to mtDNA sequences, we included data oftwelve previously published microsatellites in our analyses.Microsatellites Cr15, Cr38, Cr127, Cr236, Cr259 wereoriginally isolated from Chionodraco rastrospinosus(Papetti et al. 2006), Trne20, Trne35, Trne37, Trne53,Trne55, Trne66 from Trematomus newnesi (Van Houdtet al. 2006), and Ca26 from Chaenocephalus aceratus(Susana et al. 2007). Marker sets for each species werecomposed of 8–10 microsatellites, depending on the ampli-Wcation success (Online Resource 1).
All ampliWcation reactions contained 5 �l MultiplexMaster Mix (QIAGEN), 0.2 �l of each 10 �M primer,0.8 �l template DNA and water added to a Wnal volume of10 �l. All reactions contained primers for up to 3 microsat-ellites of which the forward primers were Xuorescentlylabeled. The PCR proWle was 95°C for 15 min followed by35 cycles of 94°C for 30 s, 59°C for 90 s, 72°C for 90 s,and Wnal elongation at 72°C for 10 min. Fragment lengthswere determined with GeneScan LIZ500 size standard(Applied Biosystems) on an AB3130xl Genetic Analyzer(Applied Biosystems) and scored with GENEMAPPER
4.0 (Applied Biosystems).Alleles were automatically binned with TANDEM
(Matschiner and Salzburger 2009) and subsequently con-verted with CONVERT (Glaubitz 2004). We used a 3D facto-rial correspondence analysis as implemented in GENETIX
(Belkhir et al. 2001) to visualize outliers in the data. Suspi-cious individuals with potential errors in the data were cor-rected, re-genotyped, or otherwise completely removedfrom the data set.
Microsatellites were tested for the presence of null alle-les, stuttering and large allele dropout with MICRO-CHECKER
2.2.3 (Van Oosterhout et al. 2004). Allele size ranges,Hardy–Weinberg-Equilibrium (HWE) per population andspecies as well as genotypic linkage disequilibriumbetween loci were examined in GENEPOP 4.0.10 (Raymondand Rousset 1995).
The number of alleles per sample and locus were calcu-lated with FSTAT (Goudet 1995, 2001) using the imple-mented rarefaction method to account for diVerences insample sizes.
123

1078 Polar Biol (2012) 35:1073–1086
Population structure was assessed performing anAMOVA based on traditional F-statistics as implemented inARLEQUIN 3.5 (ExcoYer and Lischer 2010). To account forbiases attributed to null alleles present in the data, FST valueswere also calculated excluding null alleles with FREENA(Chapuis and Estoup 2007). ARLEQUIN was further used totest loci for HWE in each population. Molecular diversitieswere measured as mean number of pairwise diVerences andaverage gene diversity. The Garza-Williamson index wascalculated as indicator of recent demographic history. Thisstatistic is sensitive to population size reductions since arecent bottleneck usually reduces the number of alleles morethan the allele size range hence leaving “vacant” positions inbetween. The index is supposed to be very small in popula-tions having experienced a recent bottleneck and close to onein stationary populations (Garza and Williamson 2001). In asimilar approach populations were tested for a recent reduc-tion in eVective population size with BOTTLENECK 1.2.02 (Piryet al. 1999) using the two-phase model (TPM) of mutationwith 10% inWnite allele model (IAM) and 90% single stepmutation model (SMM) with a variance of 15% and 1,000iterations. SigniWcance was tested with the Wilcoxon signed-rank test. In addition, we used the mode-shift indicator asqualitative descriptor of allele frequency distribution. A nor-mal L shaped distribution indicates populations in mutation-drift equilibrium whereas a shifted mode is a sign for recentbottlenecks. We considered that a population truly underwenta bottleneck if this was indicated by all three measurements(low Garza-Williamson index, signiWcant Wilcoxon signed-rank test and mode shift).
To further analyze the structure of populations and toidentify clusters of individuals, we used a Bayesianapproach based on the genotypes of microsatellites asimplemented in STRUCTURE 2.3.1 (Pritchard et al. 2000). Forevery data set we ran simulations for up to 6 clusters(k) with 20 iterations each. The parameters were set to10,000 steps of burn-in period and 100,000 MCMC replica-tions thereafter. The admixture model was used as weexpected a weak population structure as often encounteredin marine Wshes with long larval phases (and indicated byour calculated FST values). Alpha was inferred from an ini-tial value of 1.0 and correlated allele frequencies withlambda set to 1.0. In a second approach we ran the programwith the same settings but incorporated a priori informationabout the sampling sites to help with clustering. We fol-lowed the method of Evanno et al. (2005) to calculate �k asindicator of the most likely number of clusters. The powerof microsatellites to detect signiWcant population structurewas tested in the same way as the mtDNA sequences usingPOWSIM 4.0 (Ryman and Palm 2006) but in the FST rangeof 0.001–0.01.
Isolation-with-migration analyses
The directionality and extent of gene Xow between AP/EI and SO populations was examined for the combineddata set of mtDNA sequences and nuclear microsatel-lites with the isolation-with-migration (IM) model asimplemented in IMA2 (Hej and Nielsen 2007). TheHasegawa-Kishino-Yano (HKY) model of sequenceevolution was applied to mitochondrial sequences, and astepwise mutation model (SMM) was assumed for allmicrosatellite loci. Inheritance scalars of 0.25 and 1were assigned to mtDNA and microsatellite loci, respec-tively. Appropriate prior parameter ranges were deter-mined in a series of initial runs. We chose widepopulation size parameter ranges �1, �2, �A � (0,500],a divergence time prior t � (0,10], and exponentialmigration rate priors m1, m2 with distribution means of5.0. Each run included 80 Metropolis-coupled Markovchains. Geometric heating scheme parameters were cho-sen to optimize chain swap rates, and set to ha = 0.97and hb = 0.86. Per population comparison, ten replicateruns were conducted for 4.5 million generations, dis-carding the Wrst 500 000 generations as burn-in. Theconsistent genealogies of run replicates were jointlyanalyzed in IMA2’s “Load Trees”-mode. The migrationrates per year (M) were calculated from the resultingparameters M = � £ m/2 under consideration of thespecies’ generation times.
Drifter analysis
In order to compare directionality of gene Xow and oceancurrents, we also analyzed trajectories of satellite-trackeddrifting buoys (hereafter called drifters) of the GlobalDrifter Program (Lumpkin and Pazos 2007), followingestablished protocols (Matschiner et al. 2009). Interpo-lated drifter data was downloaded from http://www.aoml.noaa.gov/phod/dac/gdp.html for all drifters passing theAP/SO region (55–65°S, 40–60°W) between 15 February1979 and 31 December 2009. Three polygons were math-ematically deWned to encompass the AP, EI, and SO shelfareas at 500 m depth. Polygon vertices were 65.0°S,60.0°W; 65.0°S, 54.5°W; 63.9°S, 54.1°W; 63.3°S,52.3°W; 62.2°S, 54.3°W; 62.1°S, 55.4°W; and 63.3°S,60°W for the AP, 62.7°S, 60°W; 61.4°S, 54.1°W; 61.1°S,53.9°W; 60.8°S, 55.7°W; and 61.9°S, 60.0°W for EI, and62.3°S, 44.8°W; 61.5°S, 44.0°W; 61.2°S, 42.4°W;60.8°S, 42.8°W; 60.3°S, 46.6°W; 60.5°S, 47.3°W; and61.6°S, 46.9°W for SO. Trajectories of drifters passingthese polygons were plotted for 90 days, starting with theday of departure from one of the polygons (Fig. 2).
123

Polar Biol (2012) 35:1073–1086 1079
Results
mtDNA: genetic diversity and demographic history
The number of individuals successfully sequenced variedbetween species and ranged from 49 (L. squamifrons) to 194(G. gibberifrons; Online Resource 2). The D-loop regioncould be ampliWed in 4 out of 7 species (C. aceratus, C. gun-nari, C. rastrospinosus and G. gibberifrons). For the remain-ing three species L. squamifrons, T. eulepidotus and T.newnesi ampliWcation of the D-loop region consistently failed.Therefore, we ampliWed a part of the mt cyt b gene as an alter-native population genetic marker. Although we are aware thatthe use of two mtDNA markers is not optimal and hinders adirect comparison between data sets without restrictions, wefound both markers to resolve the population genetic struc-tures in a similar fashion. All sequences generated were sub-mitted to GenBank (Accession nos JN241690-JN241831) anda list of haplotypes per shelf area can be found in OnlineResource 3. Although a clear relationship between samplesize or sequence length and the number of haplotypes couldgenerally be expected, no such trend was found (R2 = 0.06and R2 = 0.18, respectively). Similarly, the genetic diversitiesvaried between species, but irrespective of the locus or phylo-genetic relationship. Remarkably, the three high-Antarcticspecies C. rastrospinosus, T. eulepidotus and T. newnesi hadthe highest nucleotide diversities (each > 0.004) and a similarpattern arose from the haplotype diversities. On the populationlevel, most samples from the AP region had higher diversitiesthan SO samples. Unique to C. rastrospinosus the diversityfor SO was higher than for AP.
mtDNA: genetic population structure
Power analyses revealed poor capabilities of the mtDNAsequences to detect subtle diVerentiations among popula-tions for both D-loop and cyt b. High probability to detecttrue diVerentiation as low as FST = 0.01 was only evident
for G. gibberifrons (Online Resource 4). Fine-scale geneticdiVerentiations measured as pairwise FST between sam-pling localities (AP, EI and SO) were neither high nor sig-niWcant for any species (data not shown). We thereforecombined the AP and EI samples to test diVerentiationalong the prevailing current from the AP/EI region towardSO. After pooling, diVerentiation between sample localitiesremained non-signiWcant and ranged between ¡0.003(p = 0.48) for C. gunnari and 0.04 (p = 0.06) for C. rastros-pinosus (Table 2). The constructed haplotype genealogiessupport these Wndings and reXect genetic diversity ratherthan diVerentiations between localities (Fig. 3).
Microsatellites: genetic diversity and demographic history
Microsatellites were successfully genotyped for 56 (C.rastrospinosus) to 125 individuals (C. aceratus) per species(Online Resource 1). Individuals with missing data at one ormore loci were excluded from the analyses. SigniWcant geno-typic linkage disequilibrium between loci was limited to thepair of Cr236 and Trne20 in C. gunnari (p = 0.03; data notshown). On the species level, for all but T. newnesi the hypoth-esis of HWE could be rejected (data not shown) and null alle-les might be present at least at one locus in every pertainedspecies (Online Resource 5). On the population level, HWE isonly evident for both T. newnesi populations and the EI sam-ples of C. aceratus (Online Resource 6). The null alleles foundin this study are probably a result from the cross-speciesampliWcations with microsatellite primers that were originallyisolated from other notothenioid species. Among all species,G. gibberifrons had the highest (24.0 § 14.0) and C. gunnarithe lowest (10.7 § 7.7) allelic richness (data not shown).
Reductions in population size were examined for speciesand populations. On the species level, none showed signs ofa bottleneck concurrently in all three indicators examined(Online Resource 7). The probability of heterozygosityexcess was signiWcant only in C. gunnari and C. rastrospi-nosus (both p < 0.01), while the Garza-Williamson index
Fig. 2 Trajectories of surface drifters 45 and 90 days after leaving the shelves (500 m isobath contour line) of South Shetland/Antarctic Peninsula(blue) and South Orkney Islands (yellow)
55°W 50°W 45°W
55°S45 days 90 days
60°S
65°S55°W 50°W 45°W
123

1080 Polar Biol (2012) 35:1073–1086
was low (0.48 § 0.21) only in T. newnesi. For every spe-cies, the frequency distributions of alleles were normal Lshaped. On the population level, the only sample, whichshowed evidence for a recent bottleneck in all tests, was T.newnesi from the SO shelf. In C. gunnari from SO hetero-zygosity excess and mode shift were evident, but theGarza-Williamson index was relatively high (0.63 § 0.20).
Microsatellites: genetic population structure
The power of the microsatellites to detect signiWcant popu-lation diVerentiation was generally much higher than formtDNA sequences. Simulations suggest an average proba-bility of 97% to detect a true diVerentiation of FST = 0.01resulting from both the chi-squared (SD = 0.03) andFisher’s exact (SD = 0.02) tests (Online Resource 4).
Population structure based on microsatellites wasassessed with AMOVA (Table 2) and in a Bayesianapproach (Table 3). Similar to mtDNA sequences, wefound no signiWcant diVerentiation between sampling local-ities of the AP and EI region (data not shown) and thereforecombined these samples to test the genetic structure alongthe current system. In congruence with mtDNA data, diVer-entiations between AP/EI and SO populations were minorin every species. Indeed, FST values were mostly one orderof magnitude lower than for mtDNA except for C. aceratusand C. gunnari. These two species were also the only onesshowing signiWcant diVerentiation. Excluding null allelesfrom analyses did not alter the previous Wndings of lowdiVerentiation in any species, although it also changed FST
values in some cases by one order of magnitude. The over-all genetic variation can rather be explained by larger diVer-ences between individuals than between populations.
Drifter analyses
Between 15 February 1979 and 31 December 2009, a totalof 73 drifters crossed the AP, EI, and SO shelf areas
(Fig. 2). Out of 64 drifters leaving the AP and EI shelfareas, one reached the SO shelf after 46 days, which isshorter than most notothenioid larval stages. This drifterhad left the AP shelf at its easternmost end on 30 January2008 and crossed the Philip Passage perpendicular to Wed-dell Sea Deep Water outXow (Heywood et al. 2002). Thismay have been facilitated by wind-driven surface currentsand indicates that dispersal of passive particles from AP/EIto SO shelf areas is possible albeit comparatively rare.Most other drifters leaving the AP/EI shelf areas took amore northerly route in the ACC’s main current and missedthe SO shelf. Drifters leaving the SO shelf area dispersed ina northeastern direction, and none of them reached the AP/EI region.
Microsatellites and mtDNA: isolation-with-migration model
The IM model was used to test whether gene Xow is uni-directional with the prevailing current as expected bygene Xow through passive larval dispersal or bidirec-tional through gene Xow by adult migration. In congru-ence with our F-statistics, IMA2 did only resolve geneXow in C. aceratus and C. gunnari, for which signiWcantpopulation diVerentiation could be found. The remainingspecies either showed no migration or their time sincedivergence was about zero (Table 4). Hence, IMA2 wasnot able to calculate migration rates when gene Xow istoo high and there is no clear separation between popula-tions. In the following, we therefore present and discussthe isolation-with-migration results only for C. aceratusand C. gunnari. The migration parameters m1 (from SOto AP/EI) and m2 (from AP/EI to SO) derived from themodels indicate asymmetric gene Xow with the currentin both species (Table 4; Online Resource 8). Calculatedpopulation migration rates (eVective rates at whichgenes come into populations per generation; M1, M2)show a distinct pattern of gene Xow with the current
Table 2 Population diVerentiation (F-statistics) between Antarctic Peninsula and South Orkney Islands samples based on mtDNA and microsatellites
ENA excluding null alleles
ENA results without signiWcances, AMOVA signiWcances: * p · 0.05, ** p · 0.01
Species
C. aceratus C. gunnari C. rastrospinosus G. gibberifrons L. squamifrons T. eulepidotus T. newnesi
mtDNA
FST ¡0.0056 ¡0.0027 0.0440 0.0027 ¡0.0087 ¡0.0053 ¡0.0146
Microsatellites
FST 0.0088* 0.0226** ¡0.0004 0.0002 ¡0.0015 ¡0.0035 0.0067
FST ENA 0.0088 0.0219 0.0021 0.0002 ¡0.0006 ¡0.0018 0.0027
FIS 0.022* 0.034* 0.182** 0.062** 0.074** 0.161** 0.006
FIT 0.03* 0.06* 0.18* 0.06* 0.07* 0.16* 0.01
123

Polar Biol (2012) 35:1073–1086 1081
from AP/EI to SO, but are negligible from SO to AP/EI.With regard to private alleles in microsatellites, whichmay indicate a source–sink relationship by holding moreunshared alleles in populations that act as sinks (and areusually found downstream), there is no uniform coher-ence between the direction of gene Xow according toIMA2 estimates and the number of private alleles perpopulation.
Discussion
Genetic structure and diversity
The results obtained in the present study show low or non-existing genetic population diVerentiation for seven of themost abundant notothenioid species in the southern ScotiaArc. These results seem to be independent of the adult life
Fig. 3 Unrooted haplotype genealogies based on mitochondrial D-loop (a–d) and cyt b sequences (e–g). Radii reXect number of individuals
(g) T. newnesi2
5
(e) L. squamifrons
5
2
5
(c) C. rastrospinosus
(a) C. aceratus
10
Antarctic Peninsula/Elephant IslandSouth Orkney Islands
(f) T. eulepidotus2
5
(d) G. gibberifrons
20
(b) C. gunnari
10
123

1082 Polar Biol (2012) 35:1073–1086
history strategies but are accordant to expectations formarine species with long pelagic larval stages. Both typesof genetic markers used in this study show either no or onlyweak genetic structure among populations for all studiedspecies. None of the obtained haplotype genealogies basedon mtDNA shows a clear separation between localities(Fig. 2) and F-statistics for both markers revealed, if at all,only minor diVerentiations. The only signiWcant diVerentia-tions were found within the channichthyids, C. aceratusand C. gunnari, while C. rastrospinosus and the notothe-niid populations of G. gibberifrons, L. squamifrons,T. eulepidotus, and T. newnesi generally lack a clear geneticstructure. However, the channichthyid diVerentiations arenot congruent among marker types and can therefore beused to discriminate between short- and long-term popula-tion dynamics. Microsatellites evolve faster than mtDNAand their higher diversities allow to infer present connectiv-ity patterns better than mtDNA, which carries a longer-per-sisting signature of past events (Selkoe and Toonen 2006).Historical or long existing barriers to gene Xow are hencemore likely to be detected with mtDNA sequences. In ourdata, signiWcant diVerentiations with microsatellite markersbetween samples from the AP/EI region and SO were only
detected in the benthic C. aceratus and the benthopelagicC. gunnari. However, the diVerentiation observed in bothspecies is only minor. Our cluster analyses with the soft-ware STRUCTURE suggest in both cases the existence of onlyone population in the study area. As indicated by the lowgenetic diVerentiations measured by FST, STRUCTURE maynot have been able to resolve the populations as separateentities. The small diVerentiations detected with mtDNAindicate homogenizing gene Xow between AP/EI and SO.The highest diVerentiation of mtDNA sequences was foundin the benthopelagic C. rastrospinosus (FST = 0.04), buteven for this species, the diVerentiation was not signiWcant.Although the diVerentiation measured by microsatellitedata was close to zero in C. rastrospinosus, which indicatesthat the true diVerentiation might not be as high as mea-sured with mtDNA, their power to detect subtle populationdiVerences was rather low in this case. DiVerences in thecluster analyses between runs including and excludinginformation about sampling localities, which result in oneand two clusters, respectively, suggest that a possible diVer-entiation in C. rastrospinosus is more likely based onunrecognized factors (as e.g., sampling of cohorts) thangeographically separated populations. In the four nototheniid
Table 3 Number of clusters with highest mean posterior probability inferred from Bayesian analyses as indicated by �K (maximum �K in paren-thesis)
INA including null alleles, ENA excluding null alleles (according to MicroChecker 2.2.3), locprior a priori information of sampling sites incorpo-rated in analysis
Species
C. aceratus C. gunnari C. rastrospinosus G. gibberifrons L. squamifrons T. eulepidotus T. newnesi
INA 1 (30.6) 1 (48.8) 2 (147.3) 1 (130.9) 1 (4.5) 2 (31.1) 1 (20.0)
INA locprior 1 (8.1) 1 (63.2) 1 (93.6) 1 (5.7) 1 (7.2) 1 (23.1) 1 (44.1)
ENA 1 (12.9) 1 (7.3) 2 (52.4) 1 (157.8) 1 (9.0) 1 (11.1) No NA
ENA locprior 1 (88.7) 1 (69.3) 1 (63.0) 1 (9.8) 2 (1.0) 1 (12.9) No NA
Table 4 Isolation-with-migration results reXecting parameter bins with highest posterior probabilities (high points)
t0 = time since divergence, �1 = eVective AP/EI populations size, �2 = eVective SO populations size, �A = eVective ancestral populations size,m1 = migration rate from SO to AP/EI, m2 = migration rate from AP/EI to SO, M1 and M2 = accordant population migration rates
Species Parameter
t0 �1 �2 �A m1 m2 M1 M2
C. aceratus 0.129 7.25 14.74 141.20 0.05 4.55 0.18 33.56
C. gunnari 0.443 4.75 2.75 52.25 0.05 2.65 0.12 3.64
C. rastrospinosus 0.001 74.75 23.75 47.25 0.05 0.05 1.87 0.59
G. gibberifrons I 0.001 71.25 17.25 21.25 0.05 0.05 1.78 0.43
G. gibberifrons II 0.001 125.80 21.25 46.75 0.05 0.05 3.15 0.53
L. squamifrons 0.001 35.00 15.00 55.00 0.05 0.05 0.875 0.375
T. eulepidotus 0.193 25.00 375.00 35.00 0.05 0.05 0.625 9.375
T. newnesi 0.002 37.50 16.50 360.50 3.85 0.05 72.188 0.413
123

Polar Biol (2012) 35:1073–1086 1083
species G. gibberifrons, L. squamifrons, T. eulepidotus andT. newnesi, the genetic diVerentiations between localitiesare generally low and not signiWcant giving little evidencefor the existence of barriers to gene Xow between shelfareas in the southern Scotia Arc.
Our results add new information on the connectivity ofnotothenioid populations in the area. Previous studies onnotothenioid population structures along the Scotia Arcwere based on parasite infestation rates (Kock and Möller1977; Siegel 1980a), morphometric characters (Kock1981), and more recently on a variety of genetic markers(e.g. Papetti et al. 2009). Studies based on parasite infesta-tion rates revealed diVerences between populations northand south of the ACC in C. gunnari and C. aceratus, butnot among populations of C. aceratus and C. rastrospino-sus along the southern Scotia Arc (Kock and Möller 1977;Siegel 1980a, b). For C. gunnari, four diVerent populationshad been identiWed based on morphometric characters fromSouth Georgia, SO, SSh, and EI (Kock 1981). SigniWcantdiVerentiation was also conWrmed with genetic marker setsfor C. gunnari populations north and south of the ACC(Kuhn and GaVney 2006), but the island shelves along thesouthern Scotia Arc had not yet been compared. A recentpublication on the genetic population structure of C. acera-tus from the southern Scotia Arc based on microsatellites isin agreement with our results and shows that the popula-tions on both sides of the Philip Passage are weakly, butsigniWcantly diVerentiated, while migration is still evident(Papetti et al. 2009). In our study, signiWcant genetic diVer-entiation in C. aceratus was detected with microsatellites,but not with mtDNA sequences. Hence, in the long run, themigration rates in this sedentary species seem to be highenough (e.g., >1 individual per generation Mills andAllendorf 1996) to counteract genetic drift and populationdiVerentiation. Microsatellite fragment lengths are suscep-tible to changes in frequency with every generation andF-statistics rather show a captured moment of populationstructure than history. Overall, the generally low geneticdiVerentiation suggests high connectivity between popula-tions in the study area.
With regard to the mutation rates of microsatellites andmtDNA, it seems to be counterintuitive that genetic diVer-entiations between populations measured with fast evolvingmicrosatellites are smaller than for slower evolvingmtDNA as observed in C. rastrospinosus and to a lesserextent in G. gibberifrons and T. newnesi. A similar patternwas already observed in populations of D. eleginoides fromHeard and McDonald Island, Macquarie Island, and SouthGeorgia (Appleyard et al. 2002). DiVerent genetic patternsbetween maternally inherited markers such as mtDNA andbi-parentally inherited markers such as nuclear microsatel-lites can arise from sexual diVerences in spawning behavioror simply by genetic drift and population bottlenecks.
Maternally inherited mtDNA is more aVected by the lattertwo than nuclear DNA, since its eVective population size isonly one quarter that of nuclear DNA, which may result inhigher divergences for mtDNA. Of the three species show-ing this discrepancy between markers in our study, spawn-ing migrations are only known for C. rastrospinosus, whichmigrates to shelf waters of 200–300 m depth to spawn(Kock 1989). However, it is currently unknown whetherC. rastrospinosus prefers speciWc spawning grounds andwhether sexual diVerences in migration behavior exist(Kock 2005a), leaving this explanation to speculation. Bycontrast, for all three species, at least one bottleneck indica-tor suggests that populations might have undergone areduction in population size. We therefore cannot excludebottlenecks and genetic drift as possible reasons for thispattern. However, these unusual diVerences between mark-ers do not aVect our general Wnding of low or absent popu-lation structure in the southern Scotia Arc.
According to genetic studies from the last decade, thelevels of population diVerentiation in notothenioids varywidely and do not show a universal pattern. These studiesprimarily focused on single species targeted by the Wsheriesindustry in the Southern Ocean like C. gunnari, D. elegino-ides, or D. mawsoni (Smith and McVeagh 2000; Appleyardet al. 2002; Parker et al. 2002; Shaw et al. 2004; Smith andGaVney 2005; Rogers et al. 2006; Kuhn and GaVney 2006,2008), and their results depend on the types of geneticmarkers used (allozymes, RAPDs, microsatellites, mt andnuclear DNA sequences). Although most species showgenetic diVerences between single populations, a lack ofdiVerentiation over large parts of even circum-Antarcticdistribution ranges is evident. In this regard, the adult lifehistory strategy and habit seem to play only a minor role forthe genetic structuring of populations, since this pattern canbe found not only in active pelagic swimmers as the Ant-arctic silverWsh Pleuragramma antarcticum (Zane et al.2006), but also in strictly benthic species as G. gibberifrons(Matschiner et al. 2009). It seems plausible that gene Xowbetween populations of notothenioids is primarily based onlarval dispersal. Hence, oceanography is a key factor inXu-encing the structure of notothenioid populations.
Migration and gene Xow
The genetic population structures found in this studyrevealed ongoing gene Xow in the southern Scotia Arc forall study species, regardless of their adult habit or larvalstage duration. For the channichthyids C. aceratus and C.gunnari, unidirectional gene Xow from AP/EI to SO coin-cides with the current pattern of the ACC in the study area.Advection of eggs and pelagic larvae with the current istherefore a likely key feature connecting populations ofnotothenioid species that are bound to shelf and slope
123

1084 Polar Biol (2012) 35:1073–1086
habitats during their adult stage. The pelagic phase oflarvae takes about 400–500 days in C. aceratus (La Mesaand Ashford 2008b), but exact data for C. gunnari are stilllacking. At South Shetlands, C. gunnari spawns its eggsfreely into the water in June–July and hatching occurs inJanuary–March, leaving a time frame of about 8 months inwhich eggs may be dispersed. Young juveniles caughtwith a bottom trawl at South Georgia were estimated to be3.5–6.5 months old (North 2005). If growth rates are com-parable between regions, the pelagic phase of C. gunnarimay hence be completed within 11.5 months (or about350 days). Since both species have an absolute fecundity inthe same order of magnitude, the amount of larvae reachingthe other shelf should be comparable or slightly less inC. gunnari. But as our results show, the migration rate ofC. aceratus is about twice as high as in C. gunnari. Thismay indicate that the eggs of C. gunnari stay near theground and are less advected by the current than the larvae,reducing the time of possible dispersal and raising geneticheterogeneity between populations. To this point, the roleof putative diVerences between egg and larval dispersal onpopulation structuring remains an open question and needsfurther investigations.
Overall, we conclude that the general pattern of weak orabsent genetic population structure found for notothenioidswith diVering adult life history strategies is primarily basedon the characteristic they all have in common, the pelagiclarval phase. With regard to the adaptive radiation of noto-thenioids, it remains unclear how species evolve rapidlywhile diVerentiation is counteracted by high gene Xowthrough larval dispersal. It seems likely that notothenioidspeciation events are restricted to periods when larval dis-persal is hindered as, for example, during extended ice-cov-erages in the course of glacial maxima. To further examinethe role of larval dispersal on population structure andadaptive radiation in notothenioids, it is necessary to con-duct further comparative population genetic studies overwider geographic scales including hydrographic featureslike the ACC.
Acknowledgments We are grateful to Christopher D. Jones fromNOAA (National Oceanic and Atmospheric Administration) and allscientists and crew members who helped with sampling and speciesidentiWcation during the US AMLR (United States Antarctic MarineLiving Resources Program) 2009 WnWsh survey aboard RVYuzhmorgeologiya. We further thank Karl-Hermann Kock from theInstitute of Sea Fisheries (Hamburg) for sharing his invaluable knowl-edge about notothenioids and their ecology as well as all lab memberswho gave a helping hand, especially Brigitte Aeschbach and SereinaRutschmann (Basel). We also thank two anonymous referees for theirhelpful suggestions on the manuscript. The study was funded by grantHA 4328/4 from the Deutsche Forschungsgemeinschaft (DFG-PriorityProgramme 1158) to RH and WS, and by a PhD scholarship of theVolkswagenStiftung to MM.
References
Andriashev AP (1987) A general review of the Antarctic bottom Wshfauna. In: Kullander SO, Fernholm B (eds) Proceedings, Wfthcongress of European ichthyologists, Stockholm 1985. SwedishMuseum of Natural History, Stockholm, pp 357–372
Appleyard S, Ward R, Williams R (2002) Population structure of thePatagonian toothWsh around Heard, McDonald and MacquarieIslands. Antarct Sci 14:364–373
Barnes DKA, Conlan KE (2007) Disturbance, colonization and devel-opment of Antarctic benthic communities. Phil Trans R Soc B362:11–38
Bay LK, Crozier RH, Caley MJ (2006) The relationship between pop-ulation genetic structure and pelagic larval duration in coral reefWshes on the Great Barrier Reef. Mar Biol 149:1247–1256
Belkhir K, Borsa P, Chikhi et al (2001) Genetix 402, logiciel sousWindows TM pour la génétique des populations
Briggs J (2003) Marine centres of origin as evolutionary engines.J Biogeogr 30:1–18
Casaux R, Mazzotta A, Barrera-Oro ER (1990) Seasonal aspects of thebiology and diet of nearshore nototheniid Wsh at Potter Cove,South Shetland Islands, Antarctica. Polar Biol 11:63–72
Chapuis M, Estoup A (2007) Microsatellite null alleles and estimationof population diVerentiation. Mol Biol Evol 24:621–631
Cheng CC (1998) Origin and mechanism of evolution of anti-freezeglycoproteins in polar Wshes. In: Di Prisco G, Pisano E, Clarke A(eds) Fishes of Antarctica. A biological overview. Springer,Milan, pp 311–328
Clarke A, Johnston I (1996) Evolution and adaptive radiation of Ant-arctic Wsh. Trends Ecol Evol 11:212–218
Cowen R, Sponaugle S (2009) Larval dispersal and marine populationconnectivity. Annu Rev Mar Sci 1:443–466
Daniels R (1982) Feeding ecology of some Wshes of the Antarctic Pen-insula. Fish Bull US 80:575–588
Dayton P, Mordida B, Bacon F (1994) Polar marine communities. AmZool 34:90–99
Derome N, Chen W, Dettai A et al (2002) Phylogeny of AntarcticdragonWshes (Bathydraconidae, Notothenioidei, Teleostei) andrelated families based on their anatomy and two mitochondrialgenes. Mol Phylogenet Evol 24:139–152
Detrich H, Jones C, Kim S et al (2005) Nesting behavior of the iceWshChaenocephalus aceratus at Bouvetøya Island, Southern Ocean.Polar Biol 28:828–832
DeWitt HH, Heemstra PC, Gon O (1990) Nototheniidae. In: Gon O,Heemstra PC (eds) Fishes of the Southern Ocean. JLB SmithInstitute of Ichthyology, Grahamstown, pp 279–380
Duhamel G (1981) Caracteristiques biologiques des principalesespeces de poissons du plateau continental des Iles Kerguelen.Cybium 5:19–32
Duhamel G, Ozouf-Costaz C (1985) Age, growth and reproductivebiology of Notothenia squamifrons Gunther, 1880 from theIndian sector of the Southern Ocean. Polar Biol 4:143–153
Eastman JT (1991) Evolution and diversiWcation of antarctic notothe-nioid Wshes. Am Zool 31:93–109
Eastman JT (1993) Antarctic Wsh biology: evolution in a unique envi-ronment. Academic Press, San Diego
Eastman JT (2000) Antarctic notothenioid Wshes as subjects forresearch in evolutionary biology. Antarct Sci 12:276–287
Eastman JT (2005) The nature of the diversity of Antarctic Wshes. PolarBiol 28:93–107
Eastman JT, McCune A (2000) Fishes on the Antarctic continentalshelf: evolution of a marine species Xock. J Fish Biol 57(Suppl A):84–102
123

Polar Biol (2012) 35:1073–1086 1085
Ekau W (1989) Egg development of Trematomus eulepidotus Regan,1914 (Nototheniidae, Pisces) from the Weddell Sea, Antarctica.Cybium 13:213–219
Ekau W (1990) Demersal Wsh fauna of the Weddell Sea, Antarctica.Antarct Sci 2:129–137
Ekau W (1991) Reproduction in high Antarctic Wshes (Notothenioi-dei). Meeresforsch 33:159–167
Evanno G, Regnaut S, Goudet J (2005) Detecting the number of clus-ters of individuals using the software structure: a simulationstudy. Mol Ecol 14:2611–2620
ExcoYer L, Lischer HEL (2010) Arlequin suite ver 3.5: a new seriesof programs to perform population genetics analyses under Linuxand Windows. Mol Ecol Resour 10:564–567
Fanta E, Meyer AA, Grötzner SR, Luvizotto MF (1994) Comparativestudy on feeding strategy and activity patterns of two AntarcticWsh: Trematomus newnesi Boulenger, 1902 and Gobionotothengibberifrons (Lonnberg, 1905) (Pisces, Nototheniidae) underdiVerent light conditions. Antarct Rec 38:13–29
Garza J, Williamson E (2001) Detection of reduction in population sizeusing data from microsatellite loci. Mol Ecol 10:305–318
Glaubitz JC (2004) Convert: a user-friendly program to reformat dip-loid genotypic data for commonly used population genetic soft-ware packages. Mol Ecol Notes 4:309–310
Goudet J (1995) FSTAT (Version 1.2): a computer program to calcu-late F-statistics. J Hered 86:485–486
Goudet J (2001) FSTAT, a program to estimate and test gene diversi-ties and Wxation indices, version 2.9.3. http://www2.unil.ch/pop-gen/softwares/fstat.htm
Hej J, Nielsen R (2007) Integration within the Felsenstein equation forimproved Markov chain Monte Carlo methods in populationgenetics. Proc Natl Acad Sci USA 104:2785–2790
Heywood KJ, Garabato A, Stevens D (2002) High mixing rates in theabyssal Southern Ocean. Nature 415:1011–1014
Hureau JC (1985) Channichthyidae. In: Fischer W, Hureau JC (eds) FAOspecies identiWcation sheets for Wshery purposes. Southern Ocean(Fishing areas 48, 58 and 88), vol 2. FAO, Rome, pp 261–277
Iwami T, Kock KH (1990) Channichthyidae. In: Gon O, Heemstra PC(eds) Fishes of the Southern Ocean. JLB Smith Institute of Ichthy-ology, Grahamstown, pp 381–399
Jones CD, Kock KH (2006) Standing stock, spatial distribution, andbiological features of demersal WnWsh from the 2006 US AMLRbottom trawl survey of the northern Antarctic Peninsula and Join-ville-D’Urville Islands (Subarea 48.1). WG-FSA-06/14. CCAM-LR, Hobart
Kellermann AK (1986) Zur Biologie der Jugendstadien der Notothe-nioidei (Pisces) an der Antarktischen Halbinsel. Ber Polarforsch31:1–155
Kellermann AK (1989) The larval Wsh community in the zone of sea-sonal pack-ice cover and its seasonal and interannual variability.Arch Fisch Wiss 39(Beih 1):81–109
Kock KH (1981) Fischereibiologische Untersuchungen an drei antark-tischen Fischarten: Champsocephalus gunnari Lönnberg, 1905,Chaenocephalus aceratus (Lönnberg, 1906) und Pseudochae-nichthys georgianus Norman, 1937 (Notothenioidei, Channich-thyidae). Mitt Inst SeeWsch Hambg 32:1–226
Kock KH (1989) Reproduction in Wsh around Elephant Island. ArchFisch Wiss 39(Beih 1):171–210
Kock KH (1992) Antarctic Wsh and Wsheries. Cambridge UniversityPress, Cambridge
Kock KH (2005a) Antarctic iceWshes (Channichthyidae): a uniquefamily of Wshes. A review, part I. Polar Biol 28:862–895
Kock KH (2005b) Antarctic iceWshes (Channichthyidae): a uniquefamily of Wshes. A review, part II. Polar Biol 28:897–909
Kock KH, Everson I (1997) Biology and ecology of mackerel iceWsh,Champsocephalus gunnari: an Antarctic Wsh lacking hemoglobin.Comp Biochem Physiol A 118:1067–1077
Kock KH, Jones CD (2005) Fish stocks in the southern Scotia Arcregion—a review and prospects for future research. Rev Fish Sci13:75–108
Kock KH, Kellermann AK (1991) Reproduction in Antarctic notothe-nioid Wsh. Antarct Sci 3:125–150
Kock KH, Möller H (1977) On the occurrence of the parasite copepodEubrachiella antarctica on some Antarctic Wsh. Arch Fisch Wiss28:149–156
Kock KH, Jones CD, Wilhelms S (2001) Biological characteristics ofAntarctic Wsh stocks in the southern Scotia Arc region. Ccamlr Sci7:1–41
Kuhn KL, GaVney PM (2006) Preliminary assessment of populationstructure in the mackerel iceWsh (Champsocephalus gunnari).Polar Biol 29:927–935
Kuhn KL, GaVney PM (2008) Population subdivision in the AntarctictoothWsh (Dissostichus mawsoni) revealed by mitochondrial andnuclear single nucleotide polymorphisms (SNPs). Antarct Sci20:327–338
La Mesa M, Ashford J (2008a) Age and growth of ocellated iceWsh,Chionodraco rastrospinosus DeWitt and Hureau, 1979, from theSouth Shetland Islands. Polar Biol 31:1333–1342
La Mesa M, Ashford J (2008b) Age and early life history of juvenilescotia sea iceWsh, Chaenocephalus aceratus, from Elephant andthe South Shetland Islands. Polar Biol 31:221–228
La Mesa M, Vacchi M, Sertorio T (2000) Feeding plasticity of Tre-matomus newnesi (Pisces, Nototheniidae) in Terra Nova Bay,Ross Sea, in relation to environmental conditions. Polar Biol23:38–45
Librado P, Rozas J (2009) DnaSP v5: a software for comprehensiveanalysis of DNA polymorphism data. Bioinforma 25:1451–1452
Lisovenko LA, Sil’yanova ZS (1979) The fecundity of some species ofthe family Nototheniidae in the Atlantic sector of the SouthernOcean. J Ichthyol 19:79–85
Lisovenko LA, Sil’yanova ZS (1980) The reproduction and fecundityof Wsh of the family Chaenichthyidae. In: An ecological and bio-logical description of some species of Antarctic Fishes. TrudyAll-Union Institute for Fisheries Research and Oceanography,Moscow, pp 38–52
Lisovenko LA, Zakharov GP (1988) On fecundity of the striped pikeglassWsh, Champsocephalus gunnari, in the region of South Geor-gia Island. J Ichthyol 27:131–134
Loeb VJ, Kellermann AK, Koubbi P et al (1993) Antarctic larval Wshassemblages: a review. Bull Mar Sci 53:416–449
Lumpkin R, Pazos M (2007) Measuring surface currents with surfacevelocity program drifters: the instrument, the data, and somerecent results. In: Mariano A et al (eds) Lagrangian analysis andprediction of coastal and ocean dynamics. Cambridge UniversityPress, Cambridge, pp 39–67
Matschiner M, Salzburger W (2009) TANDEM: integrating automatedallele binning into genetics and genomics workXows. Bioinforma25:1982–1983
Matschiner M, Hanel R, Salzburger W (2009) Gene Xow by larval dis-persal in the Antarctic notothenioid Wsh Gobionotothen gibberi-frons. Mol Ecol 18:2574–2587
Matschiner M, Hanel R, Salzburger W (2010) Phylogeography andspeciation processes in marine Wshes and Wshes from large fresh-water lakes. In: Rutgers DS (ed) Phylogeography. Concepts,intraspeciWc patterns and speciation processes. Nova SciencePublishers, New York, pp 1–29
Matschiner M, Hanel R, Salzburger W (2011) On the origin and triggerof the notothenioid adaptive radiation. PLoS one 6:e18911
Mills L, Allendorf F (1996) The one-migrant-per-generation rule inconservation and management. Conserv Biol 10:1509–1518
North AW (2001) Early life history strategies of notothenioids at SouthGeorgia. J Fish Biol 58:496–505
123

1086 Polar Biol (2012) 35:1073–1086
North AW (2005) Mackerel iceWsh size and age diVerences and long-term change at South Georgia and Shag Rocks. J Fish Biol67:1666–1685
Papetti C, Zane LL, Patarnello T (2006) Isolation and characterizationof microsatellite loci in the iceWsh Chionodraco rastrospinosus(Perciformes, Notothenioidea, Channichthyidae). Mol Ecol Notes6:207–209
Papetti C, Susana E, Patarnello T, Zane LL (2009) Spatial and tempo-ral boundaries to gene Xow between Chaenocephalus aceratuspopulations at South Orkney and South Shetlands. Mar Ecol ProgSer 376:269–281
Parker R, Paige K, De Vries A (2002) Genetic variation among popu-lations of the Antarctic toothWsh: evolutionary insights and impli-cations for conservation. Polar Biol 25:256–261
Permitin Y (1973) Fecundity and reproductive biology of iceWsh(Chaenichthyidae), Wsh of the family Muarenolepidae and drag-onWsh (Bathydraconidae) of the Scotia Sea (Antarctica).J Ichthyol 13:204–215
Permitin Y, Sil’yanova Z (1971) New data on the reproductive biologyand fecundity of Wshes of the genus Notothenia Rich. in the ScotiaSea (Antarctica). J Ichthyol 11:693–705
Piry S, Luikart G, Cornuet J (1999) BOTTLENECK: a computer pro-gram for detecting recent reductions in the eVective populationsize using allele frequency data. J Hered 90:502–503
Posada D (2008) jModelTest: phylogenetic model averaging. Mol BiolEvol 25:1253–1256
Pritchard JK, Stephens M, Donnelly P (2000) Inference of populationstructure using multilocus genotype data. Genetics 155:945–959
Radtke R, Targett T, Kellermann AK et al (1989) Antarctic Wshgrowth: proWle of Trematomus newnesi. Mar Ecol Prog Ser57:103–117
Raymond M, Rousset F (1995) Genepop (Version 1.2): populationgenetics software for exact tests and ecumenicism. J Hered86:248–249
Rogers AD, Morley S, Fitzcharles E et al (2006) Genetic structure ofPatagonian toothWsh (Dissostichus eleginoides) populations onthe Patagonian Shelf and Atlantic and western Indian Ocean Sec-tors of the Southern Ocean. Mar Biol 149:915–924
Rutschmann S, Matschiner M, Damerau M et al (2011) Parallel eco-logical diversiWcation in Antarctic notothenioid Wshes as evidencefor adaptive radiation. Mol Ecol 20:4707–4721
Ryman N, Palm S (2006) POWSIM: a computer program for assessingstatistical power when testing for genetic diVerentiation. MolEcol Notes 6:600–602
Salzburger W (2009) The interaction of sexually and naturally selectedtraits in the adaptive radiations of cichlid Wshes. Mol Ecol18:169–185
Salzburger W, Ewing GB, von Haeseler A (2011) The performance ofphylogenetic algorithms in estimating haplotype genealogies.Mol Ecol 20:1952–1963
Schneppenheim R, Kock KH, Duhamel G, Janssen G (1994) On thetaxonomy of the Lepidonotothen squamifrons group (Pisces,Perciformes, Notothenioidei). Arch Fish Mar Res 42:137–148
Seehausen O (2006) African cichlid Wsh: a model system in adaptiveradiation research. Proc R Soc B 273:1987–1998
Selkoe K, Toonen R (2006) Microsatellites for ecologists: a practicalguide to using and evaluating microsatellite markers. Ecol Lett9:615–629
Shaw P, Arkhipkin A, Al-Khairulla H (2004) Genetic structuring ofPatagonian toothWsh populations in the Southwest AtlanticOcean: the eVect of the Antarctic Polar Front and deep-watertroughs as barriers to genetic exchange. Mol Ecol 13:3293–3303
Shust KV (1987) Distribution and important biological aspects ofabundant Antarctic notothenioid species. In: Skarlato OA,Alekseev AP, Liubimova TG (eds) Biological resources of theArctic and Antarctic. Nauka, Moscow, pp 296–320
Siegel V (1980a) Quantitative investigations on parasites of Antarcticchannichtyid and nototheniid Wshes. Meeresforsch 28:146–156
Siegel V (1980b) Parasite tags for some Antarctic channichthyid Wsh.Arch Fisch Wiss 31:97–103
Jlósarczyk W (1987) Contribution to the early life history ofChannichthyidae from the BransWeld Strait and South Georgia(Antarctica). In: Kullander SO, Fernholm B (eds) Proceedings,Wfth congress of European ichthyologists, Stockholm 1985.Swedish Museum of Natural History, Stockholm, pp 427–433
Smith PJ, GaVney PM (2005) Low genetic diversity in the AntarctictoothWsh (Dissostichus mawsoni) observed with mitochondrialand intron DNA markers. Ccamlr Science 12:43–51
Smith P, McVeagh M (2000) Allozyme and microsatellite DNA mark-ers of toothWsh population structure in the Southern Ocean. J FishBiol 57:72–83
Susana E, Papetti C, Barbisan F et al (2007) Isolation and characteriza-tion of eight microsatellite loci in the iceWsh Chaenocephalus ace-ratus (Perciformes, Notothenioidei, Channichthyidae). Mol EcolNotes 7:791–793
SwoVord DL (2003) PAUP*. Phylogenetic analysis using parsimony(*and other methods). ed. 4.04a. Sinauer Associates, Sunderland,Massachusetts
Taylor M, Hellberg ME (2003) Genetic evidence for local retention ofpelagic larvae in a Caribbean reef Wsh. Science 299:107–109
Tiedtke JE, Kock K (1989) Structure and composition of the demersalWsh fauna around Elephant Island. Arch Fisch Wiss 39(Beih 1):143–169
Van Houdt JKJ, Hellemans B, Van De Putte AP et al (2006) Isolationand multiplex analysis of six polymorphic microsatellites in theAntarctic notothenioid Wsh, Trematomus newnesi. Mol EcolNotes 6:157–159
Van Oosterhout C, Hutchinson W, Wills D, Shipley P (2004) Micro-Checker: software for identifying and correcting genotypingerrors in microsatellite data. Mol Ecol Notes 4:535–538
White M (1998) Development, dispersal and recruitment: a paradoxfor survival among Antarctic Wsh. In: Di Prisco G, Pisano E,Clarke A (eds) Fishes of Antarctica. A biological overview.Springer, Milan, pp 53–62
Whitworth T, Nowlin WD, Orsi A et al (1994) Weddell Sea shelf waterin the BransWeld Strait and Weddell-Scotia conXuence. Deep-SeaRes I 41:629–641
Zane L, Marcato S, Bargelloni L et al (2006) Demographic history andpopulation structure of the Antarctic silverWsh Pleuragrammaantarcticum. Mol Ecol 15:4499–4511
123