comparative life cycle analysis: repair of damaged ... · the study was conducted in accordance...
TRANSCRIPT

Comparative LCA of Upright Repairs v Replacement – January 2014 – C. NADAL 1
Comparative Life Cycle Analysis:
Repair of damaged uprights
vs
Replacement of damaged uprights
(Conducted according to the methodology described by standards ISO 14040 and 14044)
January 2014
Study by Christophe NADAL - founder and consultant ACV - EKOTICA
ACV & ECO-CONCEPTION de produits
941, rue Charles Bourseul
59500 DOUAI
FRANCE
Tel. 06 63 06 67 46
www.ekotica.fr

Comparative LCA of Upright Repairs v Replacement – January 2014 – C. NADAL 2
GENERAL DESCRIPTION OF THE STUDY 3
DEFINITION OF THE OBJECTIVES AND THE SCOPE OF THE STUDY 5
INVENTORY 20
ENVIRONMENTAL IMPACT EVALUATION 28
GUIDE TO READING THE RESULTS 30
INTERPRETATION 35
STUDY CONCLUSION 56
Comparative LCA of Upright Repairs v Replacement – January 2014 – C. NADAL 3
1. General Description of the study
1.1. Background and issues
The ROS system is a method for repair of damaged uprights found in the storage structures. The
method invented by Mr. Hans SLAVENBURGl was the subject of a worldwide patent deposit. The
exploitation of this patent has been entrusted exclusively to a company in each of 8 countries of
geographic Europe where the system is operated (ROS FRANCE, ROS DEUTSCHLAND, ROS
INTERNATIONAL (United Kingdom and Netherlands), ROS HUNGARY, ROS AUSTRIA, ROS
SCHWEIZ, ROS ROMANIA.)
This innovative process avoids the replacement of the damaged upright by a new upright. Therefore
the patent operators wish to communicate the environmental benefits that the ROS solution provides by
not systematically replacing an upright.
To build this reasoning on tangible elements, the ROS FRANCE company decided to requested
EKOTICA to undertake the analysis of the comparative lifecycle of the ROS process of repair and the
replacement of upright.
This study attempts to assess the environmental benefits of one solution, to another.
It can also provide avenues of improvement the of repair service which would increase further potential
gains.
Mr. WODLI and Mr. CUVELIER put at the service of the study their expertise in the field of logistics and
storage structures.
1.2. Life Cycle Analysis Methodology
The study was conducted in accordance with the recommendations of the standards ISO 14040 and
14044 framing analysis of the life cycle assesment.
The analysis of the life cycle is an environmental assessment method that quantifies the potential
environmental impacts of a product or service throughout its life cycle.
The Life Cycle analysis methodology is articulated in four distinct phases but interdependent because,
throughout the study, frequent returns are needed, which makes the iterative general approach.
Step 1 - Definition of the objectives and the scope of the study
Each Life Cycle analysis (LCA) is built to respond to specific questions. The definition of the objectives
and the scope of the study therefore determines the methodological choices of each step (inventory,
impact assessment, interpretation) and consequently the results: LCA is "goal-dependent".
This step specifies iteratively as the progress of the analysis. We find, for example, the definition of the
boundaries of the study, the definition of the functions of the (or a) product (s), the requirement of the
quality of the data necessary for the analysis of inventory (ISO 14044), the types of impacts and their
indicators for the evaluation of environmental impacts (ISO 14044).

Comparative LCA of Upright Repairs v Replacement – January 2014 – C. NADAL 4
Step 2 - Analysis of inventory
As a first step, the functional unit is defined, a unit which will be reported and representative of the
function of the product or studied service flows. It then determines systems attached to it as well as its
borders. The flow of materials and energy incoming and outgoing are then quantified. It thus constitutes
inventory (formerly "ecobalance"). Inventory is a real work of analytical accounting of flows.
Initially limits can be extended and redefined to aid data quality.
The collection and processing of data are in accordance with the definition of the objectives as stated in
the standard ISO 14044 "Definition of objectives and the fields of study - analysis of inventory”.
Step 3 - Assessment of impacts on the environment
The LCA approach strives to make the evaluation as objective as possible by translating workflows
quantifiable and measurable. This step is designed to translate the consumption and discharges
recorded during the inventory in environmental impacts (greenhouse, hole in the ozone layer, smog,
acidification, eutrophication, toxicity...).
To do this, these flows are classified in different categories of impact for which they participate.
As a second step, these sets of flows are characterised, based on indicators, environmental impacts.
The choice of the impact categories and associated indicators are in relation to the objectives and the
systems studied.
These operations (selection, classification and characterisation) are defined as required by standard
ISO 14044.
Other optional operations can be carried out according to the objective pursued: the weighting (each
impact is assigned a weight, then the different impacts are aggregated for a final score), standardisation
(results returned to reference values, e.g. the impacts of a resident one day),…
Step 4 - Interpretation
The interpretation has for objective to analyse the results and explain the limits of inventory and/or the
assessment of impacts, in order to provide recommendations in the most transparent way possible.
It puts forward the strong points and the weak points of a system and enables knowledge of the
parameters and sensitive stages. This opens up perspectives for corrective actions and impact
decreases.
As specified in standard ISO 14044, this step relies on the identification of the significant points of
inventory and assessment of the impacts of the lifecycle accompanied by various controls: control of
sensitivity of assumptions (indicators, border...), control of completeness and consistency on the life
cycle or between several options. (Source ADEME)

Comparative LCA of Upright Repairs v Replacement – January 2014 – C. NADAL 5
2. Definition of the objectives and the scope of the study
2.1. Objective of the study
The study is an assessment of the environmental impacts of two scenarios of rehabilitation of upright
frames (also called upright columns or uprights) of warehouse rack systems. A repair scenario is
compared to replacement of the uprights and will evaluate the potential environmental benefits of the
ROS method.
This LCA aims to provide robust environmental data to companies operating the ROS system so that
they communicate to their clients feasible environmental gains by selecting the repair of the damaged
uprights rather than their replacement.
Customers of the companies operating the ROS system are logistic companies or companies with their
own warehouse. Among these companies, some consider the environmental criterion as an element of
decision and integrate it in their environmental activity accounting report. ROS companies therefore
need to be able to provide their customers with the quantitative elements on the environmental impact of
their service compared to the replacement scenario.
For the sake of improving the environmental quality of the ROS system, the study will identify some
areas of work that will contribute to the evolution of the service during the development of the
companies
2.2. Description of the systems studied
Analysed in this study are the lifecycle of two products (product/service):
• The repair of damaged uprights
• The replacement of damaged uprights
2.2.1. Description of the upright
The two systems studied are closely related to the type of upright on which they occur. The type of
upright can be defined according to the following criteria:
• The upright
• Facade width
• Thickness of steel
• Mass of the upright
• Load capacity

Comparative LCA of Upright Repairs v Replacement – January 2014 – C. NADAL 6
So that the study is closer to reality we decided to establish these criteria according to the type of
uprights on which ROS companies are involved in the majority of cases. The set standard height is 8
m. Indeed, for economic reasons and representativeness of the storage park, ROS acts on uprights
from a height of 8 to 10m.
On the other characteristics they are representative of the uprights that ROS have encountered in their
activity over several years. The characteristics of the standard upright that we will take into account are
classified in the table below:
Characteristic Unit Dimension
Height m 8
Width of Fasade mm 90
Thickness mm 2
Mass kg 32
Figure 1 - Standard dimensions of an upright
2.2.2. Repair to a damaged upright : the ROS system
The ROS system uses a hydraulic tool that through the installation of a mould on the damaged upright
point and controlled pressure reforms the channel to its original form in minutes.
A tool set consists of a mould, several prisms and corners that recreate the geometry of the damaged
profile of the upright .
The profile of the upright is built into the mould. Several prisms as well as a corner which creates a
pretension when pressure is applied, are inserted through the open side of the profile which is cold
reformed to its original geometry.
A Mould comprises a one-piece former in steel having a length of 700mm and a thickness of 30mm
consisting of three side walls and a back. The side walls are set back by five threaded rods or 16mm
screws. During the repair, this mould envelops the damaged section of the upright .
Complementing the mould are; 2 long and 2 short prisms for the inner sides left and right of the profile,
as well as a long and short corner.

Comparative LCA of Upright Repairs v Replacement – January 2014 – C. NADAL 7
Figure 2 - Illustration of the tooling of the ROS system
2.2.3. Replacement of a damaged uprights
The second scenario to ensure security of the storage structure is to remove part storage racks and
damaged uprights and exchange by an upright in good condition. The upright replacement may be
new or second-hand. Racks are then reassembled and refilled.

Comparative LCA of Upright Repairs v Replacement – January 2014 – C. NADAL 8
2.3. Function of the systems studied
Both studied solutions meet the same need to make safe a storage structure where one of the has
been damaged. In each of our two scenarios the function is to "transform" an upright to a serviceable
condition either by repairing or replacing it with a new or second-hand upright. We will therefore study
the two systems primary function to: maintain an upright racking system in good working condition.
2.4. Functional Unit
The functional unit must quantify the common function of the two scenarios studied. It is the basis of
which the two products will be compared.
We have defined the functional unit in the following manner:
«Keep an upright in good working condition so that storage racks are secure for 60 years * (3
consecutive shocks requiring 3 interventions).
* an informal study carried out by a large logistics group showed that each year 5% of the uprights are
damaged and must undergo an intervention (repair or replacement). This data can be extrapolated
and led us to determine an optimal life of one upright to be 20 years since 20 years 100% of the
uprights (in number) will be damaged. However the life expectancy of the upright has no effect on
the comparative analysis of two response scenarios, it serves as time but does not change the
reference flux. The determinant of the life of an upright is the time between manufacture and shock
causing a deformation of the upright that endangers the integrity of the structure.
We set the performance of the service rendered to 3 successive shocks to account for a limit of the
repair system. This limit is mentioned in the report of certification of the ROS system written by DEKRA
which stipulates that no fatigue of material is recorded "insofar as not more than two repair process are
carried out". Taken into account are 3 successive shocks that implies the inclusion of two interventions
methods of repair and a method for replacement of the upright .
This choice thus makes possible extrapolation of the environmental gains in several uprights within a
site.
Note: The recommendations of DEKRA limited to 2 repairs on the same area from + to -25 cm around
the shock. It is therefore possible in practice that the same upright be repaired more than 2 times. We
have however chosen to set a more restrictive hypothesis taking into account 2 repairs per upright.

Comparative LCA of Upright Repairs v Replacement – January 2014 – C. NADAL 9
Figure 3 – Illustration of the repair and replacement scenario
Comparative LCA of Upright Repairs v Replacement – January 2014 – C. NADAL 10
Figure 4 - Illustration of the replacement scenario
.

Comparative LCA of Upright Repairs v Replacement – January 2014 – C. NADAL 11
2.5. Reference Flux
The reference flux is the measure of the outputs of a given system processes necessary to perform the
function as it is expressed in a functional unit.
The reference flux corresponding to each of the 2 studied scenarios correspond to the required outputs:
• To achieve 2 repairs of an upright and 1 replacement of this upright in the case of the ROS
system
• To achieve 3 replacements of an upright in the case of the replacement scenario.
2.6. Borders of the system
The demarcation of the borders of the system is to include and exclude the constituent process of the
systems studied.
As we explained in paragraph 2.4 with functional unity, we include in the scenario of repair 2 cycles of
repairs of the same upright and then a replacement process. So the replacement scenario presents
the same functional reality we include in this case of figure 3 the replacement cycles.
Figures 2 and 3 illustrate the process taken into account in modelling of the lifecycle of 2 scenarios:
repair of uprights and the replacement of upright
Comparative LCA of Upright Repairs v Replacement – January 2014 – C. NADAL 12
Figure 5 – Borders of the system for the repair scenario
Extraction of
resources and
transformations
End of the Uprights life
Expert visit
Repair 1
2nd Repair cycle
Upright damaged
Tools Tool
manufacture
Tool
repair
Transport
Transport
Warehouse lighting
Emissions to the air,
water and soil
Replacement of Upright
cf Replacement scheme of Upright

Comparative LCA of Upright Repairs v Replacement – January 2014 – C. NADAL 13
Figure 6 - Borders of the system for the replacement scenario multi-functional process and allocation rules
2.7. Multi-functional process and allocation rules
The use of uprights of opportunity and recycling of the used uprights are multifunctional processes.
The repackaging of upright fulfils the function of managing waste from the first user of the upright and
it provides a service of support of storage rack to a second user.
Recycling, for its part, also fulfils the function of waste management and generates raw materials.
With LCAs, it is important to compare systems that provide equivalent functions to avoid arbitrary bias
for a system. There are two ways to ensure functional equivalence of systems: achieving an allocation
or proceed with the expansion of the borders. The allocation is to be charged according to a logical
physical, energy, or economic total environmental impacts to the different functions performed by each
system. In this study, the allocation is not adequate, because there is no logic that correctly describes
the relationship between the functions of the systems under consideration and their contribution to
environmental impacts.
Order to avoid allocation, the technique of the expansion of the borders is therefore used to restore the
functional equivalence of systems. The technique is to be included in the boundaries of the life cycle,
Extraction of
resources and
transformations
End of the Uprights life
Expert visit
Replacement 1
2nd Replacement cycle
Upright damaged
Destocking Upright
manufacture
Upright
transport
Transport
Transport
Emissions to the air,
water and soil
Reassembly of racks
Dismantling
racks
3rd Replacement cycle
Restocking racks
Warehouse lighting

Comparative LCA of Upright Repairs v Replacement – January 2014 – C. NADAL 14
systems of products that meet the same functions as these processes, namely, supply storage racks
support and produce raw materials. Avoided impacts of systems included the border extensions are
'credited' multifunctional systems, which allows to restore functional equivalence when comparing the
scenarios of maintenance of the upright in good condition.
2.7.1. Case of an opportunity to reuse an upright
A previously used upright presents an opportunity to be reused, still in good condition, it can again be
placed in service as a new upright.
The upright opportunity can be derived from the stock of a warehouse in activity whose upright type no
longer exists on the market and which has the replaced part of its shelving. The uprights in good
condition are then stored to be used in lieu of future uprights of the same type. They may also be from
a dismantled warehouse.
In all cases considered it had a first life during which it was in service and later that its use in lieu of a
damaged upright subject to a second life.
The lack of reliable data on the use of upright of opportunity for the replacement scenario led us to not
take into account this hypothesis in the study.
2.7.2. Case of recycling upright
Disused uprights represent a potential resource of secondary raw material for the metalworking
industry.
To account for the recovery of the used upright at the end of life we have chosen to include it in the
system, both the processing and the steel of the upright . The upright steel processing operations
avoid the extraction of iron ore and the transformation of the first cast steel iron ore.
The extension of the boundaries of the system rule allows us to credit this in the replacement scenario
all impacts avoided thanks to the recycling of the upright.
The diagram below illustrates the conducted modelling. Impacts associated with the extraction and
processing of the first cast steel (IMPACT B) iron ore are exempt from the impacts of the alternative
scenario (IMPACT A). The assessment of impacts of the alternative scenario becomes
Impact A - Impact

Comparative LCA of Upright Repairs v Replacement – January 2014 – C. NADAL 15
Figure 7 - Extension of the boundaries of the system - of the upright at the end of life recycling
2.8. General assumptions
2.8.1. Assumptions taken into account in the study
Several assumptions must be clearly expressed to precisely fit the study. These assumptions should
also accompany the communication of results to the public concerned.
The results of this study are specific to a type of upright given (cf. paragraph 2.2.1). We have defined
the characteristics of this upright as it represents the standard cases on which the company ROS
operates.
For reasons of profitability the company ROS does not contract to work for less than 20 repairs per site.
Twenty repairs correspond to a day's work for two technicians. Thus the number of uprights repaired is
set to twenty
Four uprights are set as the minimum number of uprights to be replaced per intervention.
Buckling tests by DEKRA on uprights repaired by the ROS system show that the upright conforms to
its initial load capacity. Therefore, the performance in terms of load capacity are identical between new,
special occasion and repaired uprights.
1kg of Steel
Scrap
1.1 kg
Cast iron liquid
1 kg
Upright
Recycling Iron ore
Impact A Impact B — = Impact (A — B)
Transport +
transportation Transport +
transportation
Transformation
—

Comparative LCA of Upright Repairs v Replacement – January 2014 – C. NADAL 16
Whilst special occasion uprights market is difficult to assess, it is a matter of occasion or opportunity
because of the potential specificity of the uprights. It was decided therefore not to take this factor into
account in our study.
Some shocks can result in cracks, tears or deformations of the upright that are very important (beyond
a factor of 5 cf.EN ISO 15635). In such cases the ROS method is not applicable and replacement is the
only workable scenario. In this study, we will define the type of shock in the following manner:
- Upright having undergone deformation by a factor between 1 and 5 without crack or tear.
Taking into account the development of the recycling of metals and the contained mass of steel in an
upright, it is considered that an upright damaged and replaced will be consistently placed in the steel
recycling industry. The scenario of end of life of the damaged upright will be 100% steel recycling
scenario.
Shocks above 2m require the use of a gondola for the repair. However, more than 90% of the shocks
are located below 1 m 80. Thus for shocks above 2m the protocol of repair will not be taken in to
account.
The ROS method acts on full rack and therefore does not require the emptying of the racks before
intervention conversely replacement imposes a de-stocking and restocking operation.
All of these hypotheses will be included in paragraph 3 describing the two scenarios lifecycle inventory.
2.8.2. Assumptions not taken into account in the study
Other cases that figure are fairly widespread, but are not systematically audited, and were not taken
into account because they could cause negative social or environmental effects to the replacement
scenario:
- The intervention scenario in cold rooms (problematic racks de-stocking for replacement)
- Taking account the risk of collapse in the case where replacement was delayed because of costs.
(The replacement being more expensive than repair)
- Obsolescence of forms of uprights (hooks of the stringers) may require a complete storage
structure change.
- The existence of welded ladders implies replacement of the entire ladder (i.e. the 2 uprights).
- In the case of closed profiles, the ROS system requires to open the back of the rail but this arises
rarely, profiles tend to use a minimum of material so to be open.
- Evolution of the upright
- Issue of the positioning of the sprinkler for replacement. The sprinkler is sometimes attached to the
smooth face.

Comparative LCA of Upright Repairs v Replacement – January 2014 – C. NADAL 17
2.9. Indicators of impact analysis and assessment methods selected
The following table list specified by the standard ISO 14044 environmental impact indicators, describes them and their reliability on the basis of the current advanced scientific research. According the overlap of our sources, a reliability level 1 is equivalent to an uncertainty of ± 10% on value, a level 2 of ± 30% and a level 3 ± 100%1.
1 Sources: 1) O. JOLLIET, M. SAADÉ, P. CRETTAZ, life cycle analysis, understanding and carry out an LCA Polytechnic and university presses
romandes, Lausanne, p107, 2) Analysis of Cycle of life compared to a linen shirt and a shirt in cotton, report final critical review post Bio Intelligence Service and 3) LCA of Tetra brik Aseptic Edge for the milk marketMarch 2011 Bio Intelligence Service)
Indicator Definition Level of
data
reliability
Acidification
Some gases emitted into the air, such as sulphur dioxide (SO2) and nitrogen dioxide
(NO2), are transformed into acids in the presence of moisture. They then fall to Earth,
sometimes very far from their places of issuance, during rainy periods. They are
responsible for acid rain.
2
Global warming The warming potential resulting from greenhouse gas emissions during the lifecycle of the
product. 1
Photochemical
oxidation
A Measure of the presence of ozone at the ground level that is toxic to humans in high
concentrations. This index is heavily dependent on the amount of carbon monoxide (CO),
dioxide of sulphur, monoxide and dioxide of nitrogen and ammonia (NH3) emissions. 2
Ozone layer depleation
Ozone in the stratosphere absorbs most of the harmful ultraviolet rays (UV - B rays)
biologically. Without the filtering action of the ozone layer, UV - B rays freely penetrate the
atmosphere and reach the surface of the Earth causing adverse effects associated with
excessive exposure to radiation. The thinning of the ozone layer is related to emissions of
gases such as CFCS, halon etc...
1
Human toxicity Potential for damage to health from chemicals emitted in the atmosphere and the
environment.
3
Terrestrial ecotoxicity 3
Depletion of non-
renewable natural
resources Consumption of natural non-renewable resources, such as zinc, natural gas, coal and oil. 2
Ecosystem toxicity Index similar to the potential of human toxicity, except that it takes into account the
organisms in our ecosystem.
3
3
Aquatic eutrophication Eutrophication is caused by an excessive intake of nutrient and biodegradable organic
matter from human activity. Stimulated by a substantial intake of some nutrients mainly
phosphorus and nitrogen (monoxide and dioxide), phytoplankton and some aquatic plants
grow and multiply excessively, leading, when they breakdown, to an increase of the
biodegradable natural ecosystem organic load. Bacteria, which break down the organic
matter, proliferate in turn, depleting more oxygen from the water.
2
Marine eutrophication 2
Figure 8 - Description of the LCA indicators of impact and their reliability

Comparative LCA of Upright Repairs v Replacement – January 2014 – C. NADAL 18
2.10. Quality of data
2.10.1. Source and methodology of data collection
Available data
The collection of specific data of key processes (logistics for the ROS process) was privileged via
collection files, interviews with industry professionals and site visits.
ROS provided all the data concerning repair. Replacement data were provided by Mr. WODLI an expert
in storage structure and former leader of an upright manufacturing company.
Unavailable data
Some data, including those concerning the process most upstream in the lifecycle of the uprights could
not be provided in a specific way by the actors of the 2 scenarios. Data available in the literature, was
relied upon on the advice of experts and the database Ecoinvent (V2).2
• Semi-specific data
Generic data that amended to reconcile data assumptions of our scenarios (eg Amendment of the
energy mix)
• Non-specific data
Generic data from Ecoinvent were used.
2.10.2. Requirements for the quality of the data
According to the standard ISO 14044, the quality of the data is based on "the ability to respond to the
requirements. The requirements relating to the quality of the following data were retained in order to
meet the objectives of the study. These requirements are:
• The use of recent data
The major streams of the repair scenario correspond to the activity of ROS FRANCE in 2013 and their
feedback since 2009.
2 The Ecoinvent database is a European database and the international reference in the life cycle inventory data. it is the most
developed both quantitatively and qualitatively.

Comparative LCA of Upright Repairs v Replacement – January 2014 – C. NADAL 19
For the alternative scenario, flows correspond to an average of the sector of activity from a ‘state of the
art’.
The majority of the generic data used were less than 10 years old.
• The use of data representative of the geographical area where the main processes are
carried out (manufacture of steel studs,...).
Generic data used were adapted to the geography of the process where possible.
• The use of data representative of current technologies for key processes (machining of
uprights, uprights process).
The consultation of experts such as Mr. WODLI and ROS FRANCE allows us to assert that the data
collected are representative of the average current know-how of these industries.

Comparative LCA of Upright Repairs v Replacement – January 2014 – C. NADAL 20
3. Inventory
3.1. Inventory data and assumptions
Implementation of LCA requires the inventory of emissions and extractions throughout the life cycle of
the systems studied. The comprehensive description of the process constituting the lifecycle of 2
scenarios studied allows the collection of data needed for modelling and evaluating the impact.
We asked iteratively several specialist ‘players’ in the sector of storage and logistics structure in order to
collect the data needed at this stage of inventory (see table). When the data could not be obtained
assumptions were made to complete the description of the lifecycle of each scenario.
Companies Solicited Fields of Expertise
ROS FRANCE Repair of upright of the ladder in logistics
warehouse
ONIX Expertise Manufacture of upright - control of storage
structures - Definitions of load capacities
ECOLOG Warehouse protection
Figure 9 - Firms solicited for data collection
In the following paragraphs we describe for each of the 2 scenarios studied all the data and the
assumptions on the basis of which the modelling has been built.
Comparative LCA of Upright Repairs v Replacement – January 2014 – C. NADAL 21
3.2. Assumptions and data from the scenario of repair
Life Cycle
Steps Methods Data Sources
Comments &
Assumptions
Preparatory
Step Visit of Expert
Transport,
passenger car,
diesel, fleet
average 2010/RER
U
ROSFRANCE
Ecoinvent V2.1
Expert travels by-
private car to audit 50
uprights averaged over
a return journey of 400
km
Manufacturing
Specific tooling
Hydraulic pump to
straighten the
uprights
Steel product
manufacturing,
average metal
working/RER U
ROS FRANCE et
ROS
DEUTSCHLAND
Ecoinvent V2.1
There is no specific
information about the
production of hydraulic
pump. It is therefore
considered to be a steel
tool steel of 11 kg with
an estimated life
expectancy of 10 years.
Steel, low-alloyed,
at plant/RER U
Manufacturing
Specific tooling
Set of steel prisms
for the reshaping
the profile of the
upright
Steel, low-alloyed,
at plant/RER U
ROS FRANCE et
ROS
DEUTSCHLAND
Ecoinvent V2.1
One set of prisms
corresponding to a
profile of an upright
corresponds to 5.5 kg of
steel. Its estimated life
expectancy is 5 years
Laser machining,
metal, with CO2-
laser, 4000W
power/RER U
Milling, steel,
average/RER U
Manufacturing
Specific tooling
Steel matrix which
attaches to the
front of the upright
during the
straightening
process
Steel product
manufacturing,
average metal
working/RER U
ROS FRANCE et
ROS
DEUTSCHLAND
Ecoinvent V2.1
A metal tool weighing 55
kg in total. The life
expectancy is estimated
at 10 years minimum. Steel, low-alloyed,
at plant/RER U
Repairs
Travel of the
technician to the
site with the tools
Transport, van
<3.5t/CH U
ROSFRANCE
Ecoinvent V2.1
Transit truck Expert
Peugeot 1t4 2l HDI.
800kg of tools
transported an average

Comparative LCA of Upright Repairs v Replacement – January 2014 – C. NADAL 22
Life Cycle
Steps Methods Data Sources
Comments &
Assumptions
distance of 800 km
(return journey)
Repairs
Power
consumption for
the immobilisation
of 1 m² of
warehouse
Electricity, medium
voltage, at grid/FR
U
EODEM Lighting
Ecoinvent V2.1
3Wh per m2 for
warehouse immobilised
for the repair of an
upright (30 minutes of
intervention)
Tool use
Shock key to
dismantle the
connections
Electricity, low
voltage, at grid/FR
U
ROSFRANCE
Ecoinvent V2.1
1 Li-ion battery for 50
uprights. The battery
has the following
features 18V and 3Ah
giving 54Wh of delivered
energy. The power
consumption for a
charge cycle taking into
account losses is 75Wh.
The lifespan of the
battery is estimated to
be 3 years.
Battery, Li-Io,
rechargeable,
prismatic, at
plant/kg/GLO
ROSFRANCE
Ecoinvent V2.1
Cordless battery weight
0.6 kg
Maintenance Maintenance of the
steel prisms
Electricity, medium
voltage, at grid/FR
U
ROSFRANCE
Ecoinvent V2.1
0.15 kWh for grinding a
set of steel prisms. A
grinding every 3 months.
Maintenance Maintenance of the
hydraulique pump
Lubricating oil, at
plant/RER U
ROSFRANCE
Ecoinvent V2.1
Consumption of 1 L of
oil per year for a
hydraulic pump. Oil with
a density of about 900
kg/m3
Repair cycle 2 (identical to those data above)
Replacement of the upright after 2 repairs (see data replace paragraph 3.3 scenario)

Comparative LCA of Upright Repairs v Replacement – January 2014 – C. NADAL 23
Calculation of the distance of intervention
82% of the m² warehouse storage correspond to warehouses of more than 10,000 m².3
The distribution of these warehouses on the French territory is presented in the table below:
> 10,000 m² m² IDF 10,5 million
These 4 regions
represent 67% of
warehouses greater than
10,000 m²
> 10,000 m² m² Marseille 1,7 million
> 10,000 m² m² Rhône Alpes 3 million
> 10,000 m² m² Nord Pas de calais 1,2 million
Figure 10 - distribution warehouses m² (+ 10,000 m²) by region
3 Sources: BCG / ADEME / INSEE / MEEDDM / Inrets / analysis Grace
Study DTZ and statistics of the SOeS (observation and Statistics Service)
Currently the ROS technician team is based in FRANCE. If the distances that technicians must travel
are weighted by percentage to intervene in each region in warehouses greater than 10,000 m², the
following results are found:
Current Scenario
Journey Distance in km Weighted % Kilometers
Lyon - Paris 466 64,0% 298
Lyon - Lille 691 7,3% 51
Lyon - Marseille 315 10,4% 33
Lyon Region 100 18,3% 18
Weighted average 400
Figure 11 – Calculation of the average distance of intervention weighted by the distribution of warehouses
greater than 10,000 m² in FRANCE
The average journey that technicians must travel to undertake an intervention is 400 km, or an 800 km
round trip.

Comparative LCA of Upright Repairs v Replacement – January 2014 – C. NADAL 24
3.3. Assumptions and data from the scenario of replacement
Life Cycle Steps Methods Data Sources Comments &
Assumptions
Manufacture of
coils
Cold-rolling plates
of steel in coils
Steel, low-alloyed,
at plant/RER U ONIX Expertise
Ecoinvent V2.1
Corresponds to the
manufacture of a
roll of 2mm thick
sheet steel Sheet rolling,
steel/RER U
Transport of coils
Delivery of the coils
to the
manufacturing
plant
Transport, lorry 16-
32t, EURO4/RER
U
BREF
transformation des
métaux
Ecoinvent V2.1
2000 km of
transport by truck
from the
manufacturing site
of the coils to the
production site of
the upright
Machining
Punching
Drilling,
conventional,
steel/RER U
ONIX Expertise
Ecoinvent V2.1
3% steel mass
removed from the
steel band before
profiling
Profiling
Steel product
manufacturing,
average metal
working/RER U
ONIX Expertise
Ecoinvent V2.1
Data
corresponding to a
finished steel
product.
Manufacturing.
Loss set at 5%.
Painting of the
upright
Degreasing of
upright
Degreasing, metal
part in alkaline
bath/RER U ONIX Expertise
Ecoinvent V2.1
Painting of the
upright with epoxy
paint.
Epoxy paint Powder coating,
steel/RER U
Figure 12 – Assumptions and data for the manufacture of uprights
Data to define the transport of coils up to the fabrication plant of the uprights.
Source: BREF processing of metals.

Comparative LCA of Upright Repairs v Replacement – January 2014 – C. NADAL 25
Life Cycle
Steps Methods Data Sources
Comments &
Assumptions
Preparatory
stage
Visit of the
Expert
Transport,
passenger car,
diesel, fleet
average 2010/RER
U
ROSFRANCE
Ecoinvent V2.1
Expert travels by- private
car to audit 50 uprights
averaged over a return
journey of 400 km
Intervention Travel of the
technicians
Transport, van
<3.5t/CH U
ROSFRANCE
Ecoinvent V2.1
Transit truck Expert
Peugeot 1t4 2l HDI. 100kg
of tools transported an
average distance of 800
km (return journey) (Cf.
paragraphe 3.2)
Transport of
the upright
Delivery of the
uprights from
the factory to
the warehouse
Transport, lorry 16-
32t, EURO4/RER
U
ECOLOG
Ecoinvent V2.1
1000 km because there is
no manufacturer in
FRANCE. Supply comes
from Italy or Spain. Event
of a charge back.
Destocking and
restocking of
the racks
Movement of
pallets with an
electric trolley
before the
replacement
and after
replacement
Electricity, medium
voltage, at grid/FR
U
ECOLOG
MANITOU
Ecoinvent V2.1
Operations
destocking/restocking full
racks of the damaged
uprights averaged 1 h 30
min representing 11 kWh
of electricity consumption

Comparative LCA of Upright Repairs v Replacement – January 2014 – C. NADAL 26
Life Cycle
Steps Methods Data Sources
Comments &
Assumptions
Preparation for
replacement
Transportation
on electric
trolley of the
uprights to the
location of the
replacement
Electricity, medium
voltage, at grid/FR
U
ECOLOG
MANITOU
Ecoinvent V2.1
The delivery of the
necessary elements for
the replacement
corresponds to a use of an
electric trolley during 15
min or 1.84 kWh
Replacement
of the upright
Power
consumption
for the
immobilisation
of 1 m² of
warehouse
Electricity, medium
voltage, at grid/FR
U
EODEM Lighting
Ecoinvent V2.1
3Wh per m2 for
warehouse immobilised
for the replacement of an
upright (2 h 30 minutes of
intervention)
Replacement
of the upright
Disassembly of
the stringers
and the
damaged
uprights +
reassembly of
the stringers
and the
amount
Electricity, low
voltage, at grid/FR
U
ECOLOG
Ecoinvent V2.1
These 2
disassembly/reassembly
operations require the use
of a drill and an electric
impact wrench. For each
tool battery charge cycle
corresponds to 5 uprights
replaced. Same as for the
shock key 75 Wh per
charging cycle
consumption
ECOLOG
Ecoinvent V2.1
Use of electric nacelle for
the upright replacement
operations. An upright
replacement requires the
use of a gondola for 1 h or
a power consumption of
0.94 kWh
Figure 13 - Data and assumptions for upright replacement operations

Comparative LCA of Upright Repairs v Replacement – January 2014 – C. NADAL 27
End of
Life Methods Data Sources Comments & Assumptions
Recycling
First cast steel
manufacturing
process avoided
Pig iron, at
plant/GLO
U
ECOLOG
Ecoinvent
V2.1
The amount of recycling will help
prevent iron ore mining and processing
of ore into steel. Considering that 1 kg
of scrap metal allows to avoid the use
of 0.9 kg of first cast steel.
Recycling
Transport from the
warehouse to the
recycling yard
Transport,
lorry 16-32t,
EURO4/RE
R U
Ecoinvent
V2.1
Considering that the recycling yard is
an intermediary before the recovery of
the steel. Transport of the upgrading
process is additional at this stage. 50
km of transport
Recycling
Process of
recovery of the
uprights in blocks
of steel
Iron scrap,
at
plant/RER
U
ECOLOG
Ecoinvent
V2.1
This process takes into account the
transport operations between sites and
the necessary infrastructure of sorting
and preparation of scrap to redesign
Figure 14 - Data and assumptions for the end of life of the replaced uprights

Comparative LCA of Upright Repairs v Replacement – January 2014 – C. NADAL 28
4. Environmental Impact Evaluation
4.1. Limitations of the Study
The results of the study that we conducted have some limitations which we will take into account in the
interpretation of these results.
These limits are linked to the availability of the data and the assumptions made.
Some data are so-called 'generic' which means using medium-sized business sector data from the
literature or the Ecoinvent database. These generic data although representative of the process they
describe may not exactly correspond to the input of the scenario that we describe.
The following data were not taken into account due to lack of information but their impact is relatively low
compared to the overall balance, more data are common to the 2 scenarios, allowing to ensure that they
do not call in question the findings of the study:
- The manufacture of the electric trolley (long life + tool multi-activities)
- Manufacture of the carrycot (long life + tool multi-activities)
- Making the shock keys, impact wrench and drill (to share with other activities so negligible)
- The other multi-use tools (hammer, keys...)
- Impacts of the nights in hotel for the interventions of + 24 h
- Repair labels 1 or 2 which have very little impact despite its importance in the traceability of the
intervention
- The use of opportunity uprights for replacement has not been taken into account for the lack of
reliable data.
However we are committed to use the ROS system repair scenario-specific data to characterise the
most influential process on the environmental balance of the solution (such as distance intervention for
example). These priority processes were identified using a screening process (simplified analysis) at the
beginning of realisation of the LCA.
In regard to the assumptions taken into account, we chose to exclude those which did not represent the
vast majority of situations encountered by ROS and which could affect the results for the benefit of the
repair scenario. (see subsection 2.8.2 assumptions not taken into account)
When the repair scenario occurs in the particular case of the assumptions not taken into account, the
gap between the environmental balance of the repair and replacement will be all the greater for the
repair.

Comparative LCA of Upright Repairs v Replacement – January 2014 – C. NADAL 29
4.2. Results of the life cycle impact assessment
This paragraph shows the environmental impacts related to the functional unit: "keep an upright in
good working condition so that storage racks are secure for 60 years * (3 consecutive shocks requiring
3 interventions).
4.2.1. Indicators of impacts and methods of calculations
Impact indicators selected and the corresponding characterisation methods are shown in the table
below.
The choice of methods of calculation is based on the recommendations of the Joint Research Centre of
the European commission. (ILCD Handbook - Recommendations for life cycle impact assessment in the
European context - EUR24571-EN-2011)
Indicators Methods Units
Global warming IPCC 2007 eq. Kg CO2
Ozone layer depleation CML2000 eq. Kg CFC-11
Human toxicity, Cancer USETox CTUh
Ecotoxicity USETox CTUe
Human toxicity, non Cancer USETox CTUh
Acidification CML2000 eq. Kg SO2
Photochemical oxidation Recipe 2008 eq. Kg NMVOC
Terrestrial eutrophication EDIP2003 m²
Marine eutrophication Recipe 2008 eq. Kg N
Aquatic eutrophication Recipe 2008 eq. Kg P
Depletion of non-renewable
natural resources CML2000 eq. Kg Sb
Figure 15 – Indicators of impact and methods of characterisation taken into account

Comparative LCA of Upright Repairs v Replacement – January 2014 – C. NADAL 30
5. Guide to reading the results
5.1.
5.1.1.
5.1.1.1. Specific Country Analysis
The ROS system is operated in several countries. If the repair process is the same in each country,
some data are specific to the organisation of each of the companies of ROS in Europe.
For this study we have chosen not to vary the distance of the ROS team on-site. All other data are
equivalent.
The average distance of intervention "round-trip" for each country is given in the following table:
Country Name of Society Distance Return journey km
Netherlands ROS INTERNATIONAL 140
Figure 16 - Distance average kilometres of ROS by country response
5.1.1.2. Presentation of the results
All the results of the impact analysis are presented in a chart. Scaled to present all the results on the
same chart and using a scale from 0 to 100% (each impact indicator having a different unit). All results
are therefore expressed as a percentage of the maximum impact for each indicator.
For each scan will be associated with this graph the result set encrypted in the unity of each indicator.

Comparative LCA of Upright Repairs v Replacement – January 2014 – C. NADAL 31
5.1.2. Results of the comparative analysis of impact between repair and replacement scenario
5.1.2.1. Results for ROS INTERNATIONAL (Netherlands)
Figure 17 – Comparative analysis of the scenario of replacement and repair for ROS INTERNATIONAL
scenario
Environmental impacts of the repair scenario represent about 40% of the environmental impacts of the
replacement for all indicators of impact scenario.
The table below shows all the impacts quantified for each of the 2 scenarios. We have reduced the
environmental gain related to the choice of the ROS 1 shock process.
The last column expresses the percentage of impact avoided passing the alternative to the repair
solution.

Comparative LCA of Upright Repairs v Replacement – January 2014 – C. NADAL 32
Impact
Category Unit
ROS
INTERNATIONAL Replacement
Gains for 1
shock
% of impact
avoided
IPCC GWP
100a kg CO2 eq 131 335 68 61%
Ozone layer
depletion
(ODP)
kg CFC-11
eq 1,6E-05 3,9E-05 7,6E-06 59%
Human toxicity,
cancer CTUh 2,7E-08 4,9E-08 7,5E-09 46%
Ecotoxicity CTUe 2,1E-01 4,6E-01 8,6E-02 56%
Human toxicity,
non-cancer CTUh 3,5E-08 9,2E-08 1,9E-08 62%
Acidification kg SO2 eq 4,8E-01 1,2E+00 2,5E-01 61%
Photochemical
oxidant
formation
kg
NMVOC 4,8E-01 1,1E+00 2,1E-01 57%
Terrestrial
eutrophication m2 9,2E+00 22 4,2E+00 58%
Marine
eutrophication kg N eq 1,5E-01 3,7E-01 7,4E-02 59%
Freshwater
eutrophication kg P eq 6,2E-02 1,7E-01 3,7E-02 65%
Abiotic
depletion kg Sb eq 9,0E-01 2,3E+00 4,6E-01 61%
Figure 18 - Comparative table of the environmental impacts of the scenarios of repair and replacement for
ROS INTERNATIONAL

Comparative LCA of Upright Repairs v Replacement – January 2014 – C. NADAL 33
5.1.3. Avoided impacts - example of greenhouse gas emissions.
The results of the impact analysis are not always easy to understand. In order to take the measure of
the level of environmental gain by the choice of the remedy when an upright is damaged, we propose to
report gas emissions greenhouse avoided emissions of a 10,000 m² warehouse.
• Data
Consumption of electricity of a warehouse:
If we consider a 10,000 m2 warehouse with a consumption of 30kWh/m²/year.
This warehouse consumes 300 MWh of electricity per year.
GHG emissions associated with the French consumption of 1 MWh amounted to 90kg of eq. CO2.4
Either 90kg x 300 = 27,000 kg eq. CO2 / year = 27 t eq. CO2 / year
Record of the life of a warehouse greenhouse gases:
A warehouse in its operation emits during its lifetime (construction + operation + demolition) 700 kg CO2
eq per m² 5 (heated at 5 ° C in Lyon during a lifetime of 30 years) is 7 000 tonnes. CO2 for 30 years of
operating a 10,000 m² warehouse. Which corresponds to 233 tonnes. CO2 per year for a 10 000 m²
warehouse.
Number of uprights damaged annually in a 10,000 m2 warehouse:
There are 2 uprights (front - rear) all 12 m² or 1667 uprights in a 10,000 m² warehouse. If we take the
assumption of 5% of uprights shocked every year. The total number of uprights damaged in a 10,000
m² warehouse is 83 per year.
• Calculation of the emission of greenhouse gases avoided annually by choosing repair rather
than replacement
The following table expresses the quantity of GHG emissions avoided for each studied country
Country Society
GHG emissions
avoided by
amount in
kg eq. CO2
Number of
uprights damaged
per year
GHG emissions
avoided by
amount in
t eq. CO2/yr
Netherland
ROS
INTERNATIONAL 68 83 5,6
4 Data contained in the Ecoinvent database 5 Data contained in the balance sheet GHG 2007 directed by GSE logistics warehouse of the Lyon region 6 Data of the informal report of a large INTERNATIONAL logistics provided by the company ECOLOG

Comparative LCA of Upright Repairs v Replacement – January 2014 – C. NADAL 34
Correspondence with GHG emissions related to consumption of a warehouse and all of the GHG
emissions from its construction to its end of life
Society
ROS
Power
consumption
of a
warehouse
greater than
10,000m²
emissions in
t eq. CO2/yr
Life of a
10,000 m²
warehouse -
emissions in
t eq. CO2/yr
Emissions of
GES évitées
par la
réparation
gains in
t eq. CO2/yr
Corresponden
ce in % of CO2
emissions
associated
with electricity
consumption
Corresponden
ce in % of the
emissions
related to the
life of the
warehouse
INTERNATIONAL 27,0 233,3 5,6 20,7% 2,4%
Figure 27-Tariff of the environmental gains achieved through repairs with GHG emissions linked to the
operation of a 10,000 m² warehouse
The above table illustrates the environmental gains that allows the choice of repair rather than
replacement.
The upright of avoided greenhouse gas corresponds to approximately 20% of emissions associated
with the consumption of electricity of a 10,000 m² warehouse.
The upright of avoided greenhouse gas corresponds to slightly more than 2% of annual emissions
related to the life of a 10,000 m2 warehouse (construction + operation + end of life).

Comparative LCA of Upright Repairs v Replacement – January 2014 – C. NADAL 35
6. Interpretation
The interpretation stage is presented in two parts: the analysis of the contributions and the sensitivity
analysis.
6.1. Analysis of the contributions
Analysis of contributions permits us to enter the details of the life cycle of each scenario to determine the
process and the steps most impacting of each scenario.
6.1.1. Contributions of repair and replacement in the ROS scenario operations
This first step of analysis will permit us to assess the distribution of impacts between 2 repair operations
and changing the upright constituting the lifecycle of the ROS scenario.

Comparative LCA of Upright Repairs v Replacement – January 2014 – C. NADAL 36
6.1.1.1. Contributions from operations of repair and replacement in the scenario ROS INTERNATIONAL (Netherlands)
The graph above shows that for the majority of impact indicators 2 repairs of uprights in the lifecycle of
the ROS INTERNATIONAL scenario represent between 10 and 20% of impacts when the final
replacement operation is responsible for the remaining 80%. The distribution of impacts for the indicator
of toxicity human (cancer) is about 40% for 2 repair operations and 60% for the replacement operation

Comparative LCA of Upright Repairs v Replacement – January 2014 – C. NADAL 37
6.1.2. Contributions of the stages of the life cycle of the replacement of an upright
This new stage of the impact analysis is to examine the distribution of impacts between the operations of
replacement of the upright and the end of life of the upright. The analysis focuses on a life cycle of
replacement which as we have seen in the first stage of the analysis accounts for between 45% and
more than 80% of the impact of the life cycle of the ROS by country scenario and impacts indicators.
The upright replacement operations include transport of technicians and their equipment so that the
manufacture and transport of the new upright, and also the whole of the consumption and emissions
related to these processes. Another step of the replacement is the end of life of the upright.
6.1.2.1. Contributions for ROS INTERNATIONAL (Netherlands)
Figure 28 – Allocation of contributions to the impacts between the replacement operations and the end of
life - ROS INTERNATIONAL

Comparative LCA of Upright Repairs v Replacement – January 2014 – C. NADAL 38
1.1.1.6. Comments on the analysis of the contributions
Observed in the previous graphs are processes that constitute the replacement operation are
responsible for 100% of the negative environmental impacts. It is interesting to note that the end of life
of the replaced upright has a score of negative environmental impact. Indeed, as we have explained in
paragraph 2.7.2 "rule of extension of the boundaries of the system allows us to credit to the replacement
scenario all impacts avoided thanks to the recycling of the upright."
That means that this stage of the life cycle benefit scenario of replacement of a reduction of 10 to 30%
of impacts according to the categories of impact. These 10-30% of impacts are allocated to the
environmental balance of another product that will use the thus recycled steel.
6.1.3. The process of replacing operations contributions
We enter into the details of the contributions to the impacts of the operations of replacement of the
upright. These operations are:
• The manufacture of the upright
• Tooling
• De-stocking and restocking of the racks operations
• The routing of the uprights by electric trolley on site
• The visit of expert before intervention
• The power consumption of the warehouse attributed to changing due to immobilisation of the m²
• The transport of the uprights from the factory to the site
• The transport of technicians with the tools on the site

Comparative LCA of Upright Repairs v Replacement – January 2014 – C. NADAL 39
6.1.3.1. Contributions for ROS INTERNATIONAL (Netherlands)
Figure 33 – Allocation of contributions to the impacts between the constituent process of the replacement
operation - ROS INTERNATIONAL
The 3 main contributors to the environmental impacts of the replacement of upright are:
- the manufacture of the upright approximately 80-95% according to the categories of impact (less
than 70% for toxicity human cancer)
- the transport of technicians in utility between 5 and 35% for toxicity human cancer
- the transport of the uprights to the site between 2 and 10%
Other operations have lower contributions.
Comparative LCA of Upright Repairs v Replacement – January 2014 – C. NADAL 40
6.1.3.2. Comments on the analysis of the distribution of contributions between the different constituent processes of the replacement operation.
The results presented in the graphs above show that 2 main contributors impact the processes namely
making the uprights and to a lesser extent the transport of technicians to the site.
The manufacturing process of the uprights is the most impacting for the LCA of replacement. This is
explained by the high consumption of natural resources (iron ore) and energy (steelmaking process
requires large amounts of energy) to make an upright consisting of 32 kg of steel.
The part of the impacts of the transport of the technicians naturally increases with the increase of the
distance of intervention. The most important contribution of this transport process are the indicators for
toxicity - human cancer and ecotoxicity. The specificity for these 2 categories of impact resulted from
the emission of formaldehyde and phenol in to the air during transport.
Formaldehyde is emitted into the air via exhaust. This substance is called into question in the
occurrence of nasopharyngeal cancer. It is in our case the main source of the impacts for the toxicity
indicator human cancer.
Phenol is present in the oil refining and is found in the exhaust of vehicles. It has negative effects on
human health and ecosystems.
6.1.4. Contributions of operations for the repair process
In this paragraph, we analyse the distribution of contributions to the environmental impacts of the repair
scenario. The constituent processes of the life cycle of a repair operation are:
- The visit of an expert before intervention
- Tooling (manufacture, use, maintenance and end of life)
- The transport of technicians and tooling in a utility vehicle to the site
- The power consumption of the warehouse attributed to repair for the number of m² blocked for
repair

Comparative LCA of Upright Repairs v Replacement – January 2014 – C. NADAL 41
6.1.5. Contributions for ROS INTERNATIONAL (Netherlands)
Figure 38 – Allocation of contributions to the impacts between the constituent processes of the repair
operation - ROS INTERNATIONAL

Comparative LCA of Upright Repairs v Replacement – January 2014 – C. NADAL 42
6.1.5.1. Comments on the analysis of the distribution of contributions to the impacts of the constituent processes of the repair operation.
The above analysis of the contributions shows that transport is responsible for the environmental
impacts of the repair operation.
2 process of transport share 98% of impacts to the set of indicators:
- The visit of an expert before intervention
- The transport of technicians and tooling in a utility vehicle to the site of intervention
It is also noted that the distance between the technician teams and the site is high over the share of
transport of the technicians in the environmental impacts of the repair scenario. That is why the visit of
an expert is still more than 10% for the cases of ROS INTERNATIONAL (for which the distance to the
site of intervention is the lowest 140 km round trip) and only 2% for ROS DEUTSCHLAND (cases for
which the distance to the site of intervention is the greatest 1200 km round-trip).
This result is consistent with our expectations because the repair operation requires little energy, (no
consumables except those required for the maintenance of the tools) and tools with a fairly long lifespan
(several thousands of uprights repaired with the same tools).
6.2. Sensitivity analysis
The sensitivity analysis is designed to test the robustness of the results and their sensitivity to the data,
assumptions and models used.
Modelling is based on choices of data and assumptions. We will test the sensitivity of the results of the
study to the variation of these data. The sensitivity analysis is to choose the remote data (lower and
upper values) of the given scenario and compare the results of impacts obtained.
6.2.1. Sensitivity to the methods of calculation of impacts.
There are several methods for the characterisation of environmental impacts. Substances taken into
account in the calculation and the polluting power of each substance can be slightly different from one
method to another. In this study we have selected the most reliable methods recommended by the JRC.
To make sure despite all of the robustness of the results, we proceeded to the calculation of impacts
with 3 other methods:
- IMPACT2002 +
- Recipe 2008
- CML 2000

Comparative LCA of Upright Repairs v Replacement – January 2014 – C. NADAL 43
6.2.1.1. Analysis for ROS INTERNATIONAL (Netherlands)
Figure 43 - Comparative analysis of the life cycles of the scenarios of repair and replacement with the
method IMPACT2002 + for the Netherlands
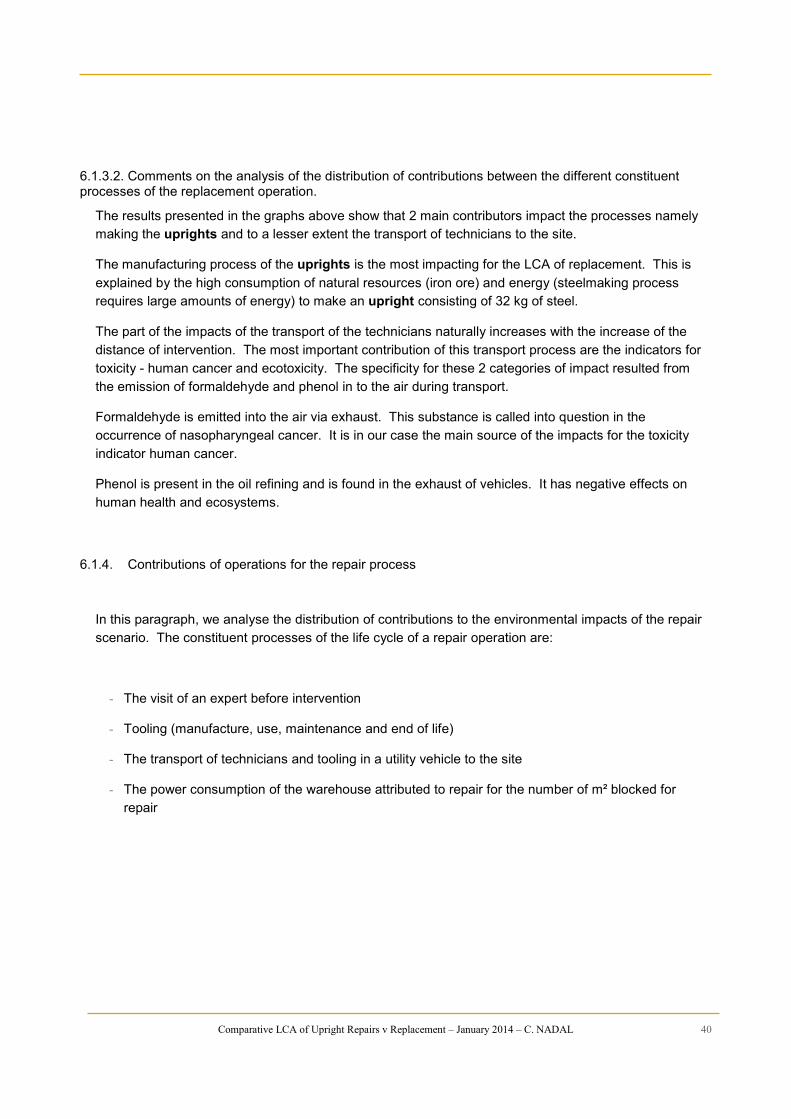
Comparative LCA of Upright Repairs v Replacement – January 2014 – C. NADAL 44
Figure 44 - Comparative analysis of the life cycles of the scenarios of repair and replacement with the
method Recipe2008 for the Netherlands

Comparative LCA of Upright Repairs v Replacement – January 2014 – C. NADAL 45
Figure 45 – Comparative analysis of the life cycles of the scenarios of repair and replacement with the
method CML2000 for the Netherlands
Observed that according to the 3 methods of calculation repair ROS scenario is 30% to 50% of the
impacts of the replacement scenario.

Comparative LCA of Upright Repairs v Replacement – January 2014 – C. NADAL 46
6.2.1.2. Comments on the sensitivity of the study methods of calculation
3 Calculation methods give for all the indicators of impact of the similar conclusions to scenarios of all
countries except for the Germany. The repair scenario is almost always 2 times less impacting than the
replacement scenario.
For the case of ROS DEUTSCHLAND, the indicator for photochemical oxidation gives a score of impact
most important with CML2000 and lower than with other methods. Therefore, we cannot determine with
certainty which of the 2 scenarios (repair or replacement) is the least striking for this indicator in the
case of ROS DEUTSCHLAND.
6.3. Sensitivity to changes in the input parameters
We modeled the life cycle of the repair ROS scenario by setting certain parameters. These assumptions
are derived from data collection that we made. However, in reality, the values of the parameters may
differ from reference conditions that we have set.
We will test the sensitivity of the study to variations in input parameters to ensure the strength of the
results.
In the table below we present the input parameters and the values of references that we have used.
Concerning the on-site distance which differs for each country where operates ROS we chose to
sensitivity analysis to other parameters taking the distance of intervention P/R equal to 800 km. This
distance corresponds to the scenario of ROS FRANCE. However, we did the analysis with extreme
distances (140 km (NL) and 1200 km (D)) and the conclusions of this analysis are strictly identical.
Parameters Reference Conditions
Number of steel tool repairs 26000
Number of repairs per matrix 52000
Number of repairs by impact wrench 15600
Number of repairs by hydraulic pump 52000
Distance of expert visit - return journey 400
Number of uprights considered 50
Distance of intervention - return journey 800
Number of uprights repaired per intervention 20
Number of upright repairs before replacement 2
Comparative LCA of Upright Repairs v Replacement – January 2014 – C. NADAL 47
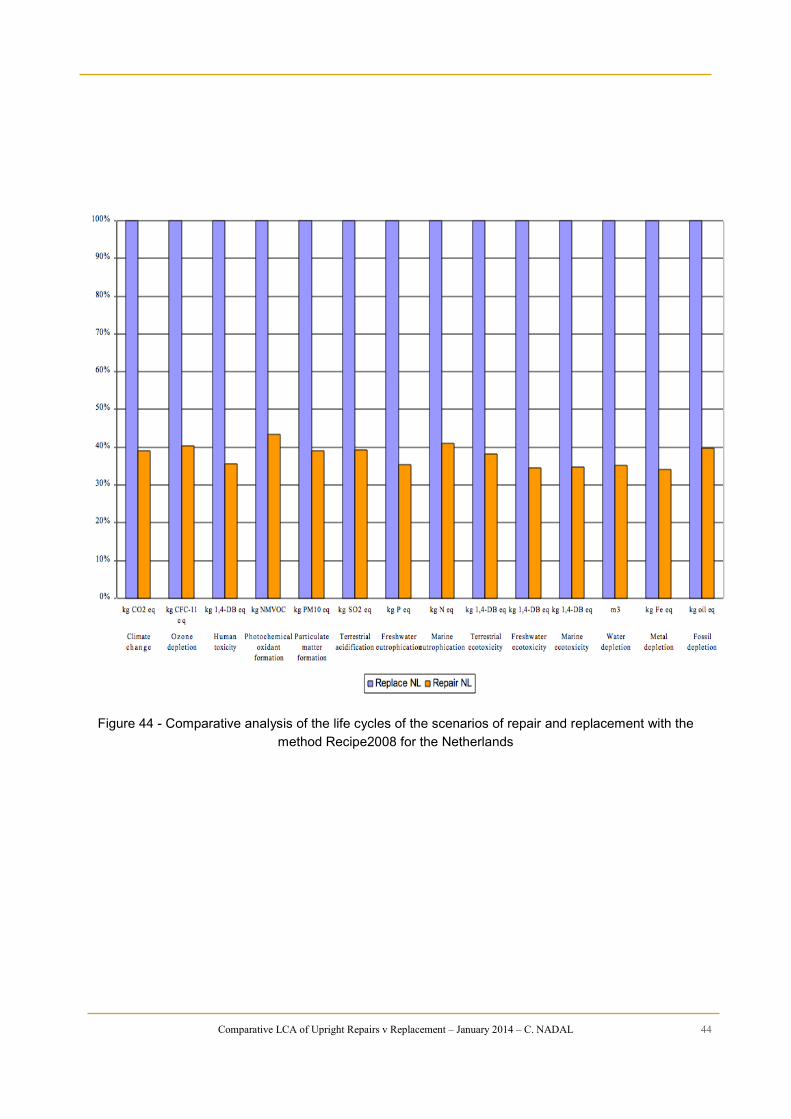
6.3.1. Sensitivity of the results to changes in the "number of repairs by steel tool”.
The parameter number of repairs by steel tools” is the number uprights (Prism and butterfly) steel tool
kit can repair before being unusable.
We had set it originally at 26,000 repaired uprights equivalent to a life expectancy of five years at a rate
of 100 repairs per week.
We may vary this setting between 20 and 100 000 repairs without affecting other parameters of
references.
The results are presented in the graph below.
Figure 58 - Sensitivity of the results to changes in the “number of repairs by steel tool”
The graph shows that the influence of the number of repairs is less than 5% on all the categories of
impact. The results of the study are not sensitive to the variation of the “number of repairs by steel tool”.

Comparative LCA of Upright Repairs v Replacement – January 2014 – C. NADAL 48
6.3.2. Sensitivity of the results to changes in the "number of repairs by matrix”.
The parameter “number of repairs by matrix” is the number uprights that the steel matrix can repair
before being unusable.
We had set it originally at 52,000 repaired uprights equivalent to a life expectancy of 10 years at the
rate of 100 repairs a week.
We may vary this setting between 20 and 100 000 repairs without affecting other parameters of
references.
The results are presented in the graph below.
Figure 59 - Sensitivity of the results to changes in the “number of repairs by matrix”
There is a significant difference between 20 repairs and other hypotheses number of repairs for non
cancer human toxicity and aquatic eutrophication. From 1000 repairs the variability of the result is
insensitive to this parameter.
The lifetime of such a steel tool is seldom a single day, this assumption is therefore an extreme case
with a very low probability. We can therefore conclude that the results are not sensitive to the life
expectancy of the matrix beyond 1000 repairs

Comparative LCA of Upright Repairs v Replacement – January 2014 – C. NADAL 49
6.3.3. Sensitivity of the results to changes in the "number of repairs by impact wrench”.
The parameter "number of repairs by impact wrench" is the number uprights that the impact wrench
can repair before being unusable.
We had set it initially to 15,600 repaired uprights, equivalent to a service life of 3 years at the rate of
100 repairs per week.
We may vary this setting between 20 and 100 000 repairs without affecting other parameters of
references.
The results are presented in the graph below.
Figure 60 - Sensitivity of the results to changes in the “number of repairs by impact wrench”
The difference measured between the different hypotheses is extremely low. The only visible difference
between the given 20 repairs and other values is 5% for the indicator of human toxicity not cancer. We
therefore conclude that the life expectancy of the impact wrench has no influence on the results of the
study.

Comparative LCA of Upright Repairs v Replacement – January 2014 – C. NADAL 50
6.3.4. Sensitivity of the results to changes in the "number of repairs by hydraulic pump”.
The parameter “number of repair by hydraulic pump” is the number uprights that the hydraulic pump
may allow repair before being unusable.
We had set it originally at 52,000 repaired uprights equivalent to a life expectancy of 10 years at the
rate of 100 repairs a week.
We may vary this setting between 20 and 100 000 repairs without affecting other parameters of
references.
The results are presented in the graph below.
Figure 61 - Sensitivity of the results to the variation of the “number of repairs by hydraulic pump”
The difference measured between the different hypotheses varies between 5 and 10% among the 20
repairs and other values that give the substantially the same results. We therefore conclude that the
service life of the hydraulic pump has no influence on the results of the study.

Comparative LCA of Upright Repairs v Replacement – January 2014 – C. NADAL 51
6.3.5. Sensitivity of the results to the variation in the "distance for the visit of an expert” return journey.
Parameter “distance for the visit of an expert” corresponds to the distance travelled by the empowered
expert who analyses the uprights that have suffered shock on site.
We had set it initially at 400 km round trip.
We did change this setting between 100 km and 800 km round trip without varying other references
parameters.
The results are presented in the graph below.
Figure 62 - Sensitivity of the results to the variation in “distance for the visit of an expert”
The difference between 100 km and 800 km is around 5%. This gap is relatively small and we can
conclude that the distance travelled by the expert to analyse the uprights before intervention has a low
impact on the results for 50 uprights visited.

Comparative LCA of Upright Repairs v Replacement – January 2014 – C. NADAL 52
6.3.6. Sensitivity of the results to changes in the "number of uprights visited”.
The parameter “number of uprights visited” is the number of uprights that the expert will analyse
during his visit and that he will give a diagnosis of replacement or repair.
We had set it initially to 50 uprights.
We may vary this setting between 10 and 100 uprights visited without affecting other parameters of
references.
The results are presented in the graph below.
We note that the influence of the number of uprights visited beyond 50 uprights visited is very low.
However the assumption of 10 uprights visited gives a difference of about 5% for all indicators.
This parameter is linked to the setting of “distance for the visit of an expert”. Although individually these
parameters have little influence on the overall result of the repair scenario, we conclude that travel to be
limited to less than 50 uprights.

Comparative LCA of Upright Repairs v Replacement – January 2014 – C. NADAL 53
6.3.7. Sensitivity of the results to the variation of "the distance of intervention - return journey".
The parameter "distance of intervention - return journey" corresponds to the distance travelled by the
technicians and equipment in a commercial vehicle to get to the site.
We had set it initially to 800 km round trip in France.
We may vary this setting between 140 km (data ROS INTERNATIONAL) and 1200 km.
The results are presented in the graph below.
Figure 63 - Sensitivity of the results to the variation of the distance of intervention on site - return journey”
This parameter is an extremely important influence on the results of the study. The gap between 140
km and 1200 km is 40 to 80% according to impact indicators.
It is therefore a parameter to define more accurately the results of more specific impact. It is also the
parameter on which ROS can act to improve the environmental performance of its repair service.

Comparative LCA of Upright Repairs v Replacement – January 2014 – C. NADAL 54
6.3.8. Sensitivity of the results to changes in the “number of uprights repaired per intervention”.
The “number uprights repaired per intervention” parameter is the number of uprights that technicians
treat per visit.
We had set it originally at 20 uprights repaired which means that the team of technicians of ROS does
not move for less than 20 uprights to repair.
We may vary this setting between 10 and 80 uprights without making other parameters of references.
The results are presented in the graph below.
Figure 64 - Sensitivity of the results to changes in the “number of uprights repaired per intervention”
This parameter is also highly influential. Observed differences range from 30 to 60% between a move
from10 uprights and a move to 80 uprights according to the indicators of impact. The number of
uprights per intervention is linked to the distance travelled by the technicians to the site of intervention
since the number of km travelled per upright decreases when uprights are increasing.
This parameter is to optimise to improve the environmental balance of the service of ROS repair.

Comparative LCA of Upright Repairs v Replacement – January 2014 – C. NADAL 55
6.3.9. Sensitivity of the results to changes in the "number of repairs before replacement”.
The parameter "number of repairs before replacement" is the number of possible repairs before needing
to change the upright . Indeed, ROS limit the number of repairs on a same uprights (and in one spot)
to 2 repairs despite tests proving the success of repair after 5 interventions.
We had set it initially to 2 repairs in the life of the upright .
We may vary this setting between 1 and 5 repairs without affecting other parameters of references.
Environmental impacts have been reduced to 1 shock to ensure comparable scenarios.
The results are presented in the graph below.
Figure 65 - Sensitivity of the results to the variation of the number of possible repairs by upright
We observe that the number of repairs is high over the environmental impact of repair service
decreases. This is explained by the fact that each additional repair allows to lengthen the life of the
uprights and thereby delay its replacement.
It is also noted that the environmental gains end up settling by increasing the number of possible
repairs.
It can be concluded that the number of possible remedies for a same upright is a parameter in the
repair scenario. Therefore, a track for improvement to reduce the environmental burden of the ROS
scenario.
Comparative LCA of Upright Repairs v Replacement – January 2014 – C. NADAL 56
7. Study Conclusion
7.1. The comparative study
The comparative study between the repair and the replacement scenarios showed the environmental
benefit of the repair scenario. The environmental gains that allows the ROS service relative to the
replacement of uprights range from 30% to 60% (ROS INTERNATIONAL) depending on the distance
travelled to the site of intervention all the indicators of impact. (see section 5.1.1.1)
The main contributors to the impacts for the replacement scenario are the uprights and transport of
technicians manufacturing processes. It should also be noted that the replacement scenario enjoys a
'credit' impact that reduces its environmental performance. This impact credit is due to the recycling of
the uprights at the end of life which helps prevent iron ore mining and processing of ore (cf. paragraph
2.7.2 first cast steel
For the scenario of repair, the replacement of the uprights after the 3rd shock is the highest contributor
to the impacts of this scenario, 80% for ROS INTERNATIONAL to almost 50%. (see section 6.1.1)
Then, we showed that only technicians transport and tooling is responsible for 85% to 98% of the
impacts of repair service.
This analysis has allowed us to identify the main levers of action to improve the environmental balance
of the ROS system.
7.2. Environmental improvement of the service of ROS repair tracks
Analysis of contributions and sensitivity of the input parameters study has shown that data flows have a
strong influence on the environmental balance of the repair service:
1. Transporting the technician team and the site of intervention tools
2. Number of repaired uprights per intervention
3. Number of possible repairs per upright
The first 2 points can be worked in the short term. The last point must be the subject of laboratory
testing and certification.
Comparative LCA of Upright Repairs v Replacement – January 2014 – C. NADAL 57
Reduce the environmental impact related to the transport of technicians and tooling to the intervention
site, several actions can be implemented:
- Optimise the distance to the sites of interventions by placing teams of technicians at major areas of
interventions
- Avoid the transport of tools whose weight is impacting, storing for example of the tooling with
recurring customers by priority intervention zone. Teams carry equipment only a short distance.
- Change the mode of transport: electric vehicle for example or another form of mobility.
- Increase productivity of repaired uprights per travel
Finally, in the medium term obtain certification to increase the number of repairs authorised per upright
would allow substantial environmental gains.
Other avenues of reflection
On the scale of a warehouse systematic repair of uprights would make interesting environmental gains.
It should therefore be able to create a competitive edge between manufacturers of uprights and ROS.
Manufacturers may offer a form of "extended warranty" of their uprights. The logistician in buying the
uprights could opt for a maintenance service of its uprights allowing it to lengthen life.
From an environmental point of view, there is still a better approach than than the repair scenario:
shock avoidance. An economic model more environmentally virtuous is possible. The service could be:
Ensure the security of goods and persons in the storage areas in contributing to the optimisation
of handling operations.
ROS would propose a service offering including (operator) training, the development of a surface to
reduce shock and last repair.
The new economic model called economy of functionality is an ideal source of inspiration for structuring
this type of offer.