comparative genomics todd castoe biochemistry and molecular genetics
TRANSCRIPT
Comparative Genomics
Todd CastoeBiochemistry and Molecular Genetics
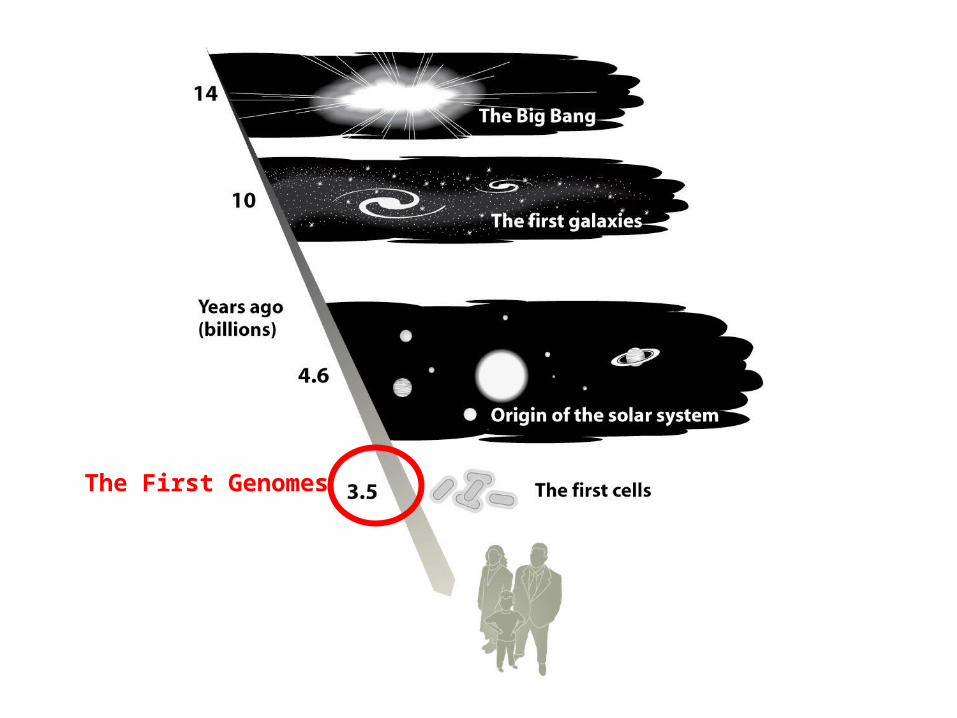
The First Genomes
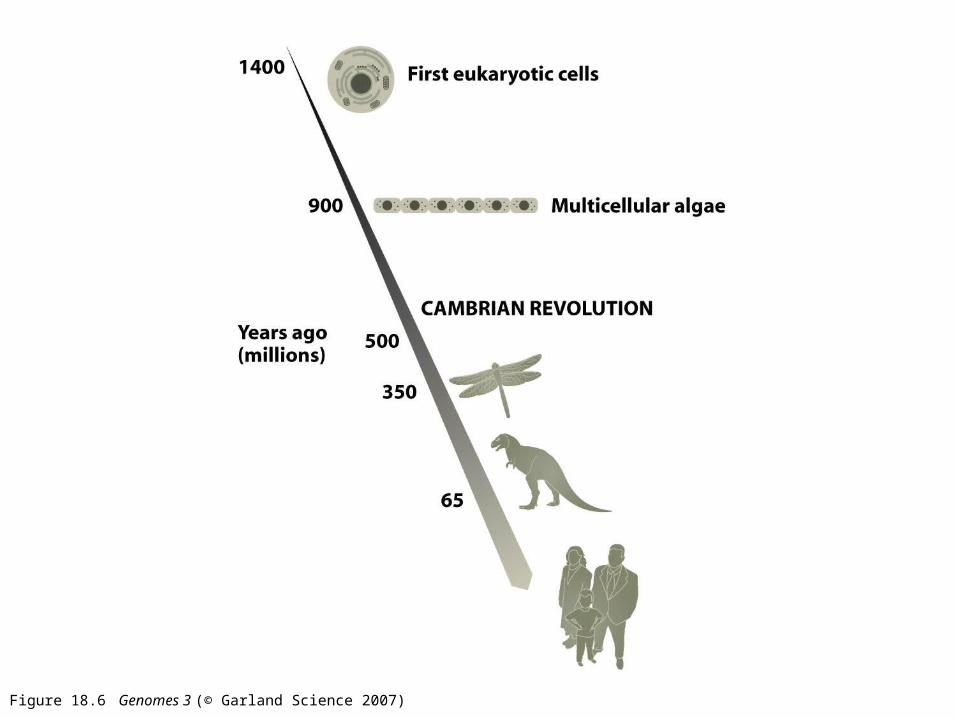
Figure 18.6 Genomes 3 (© Garland Science 2007)
http://www.zo.utexas.edu/faculty/antisense/Download.html
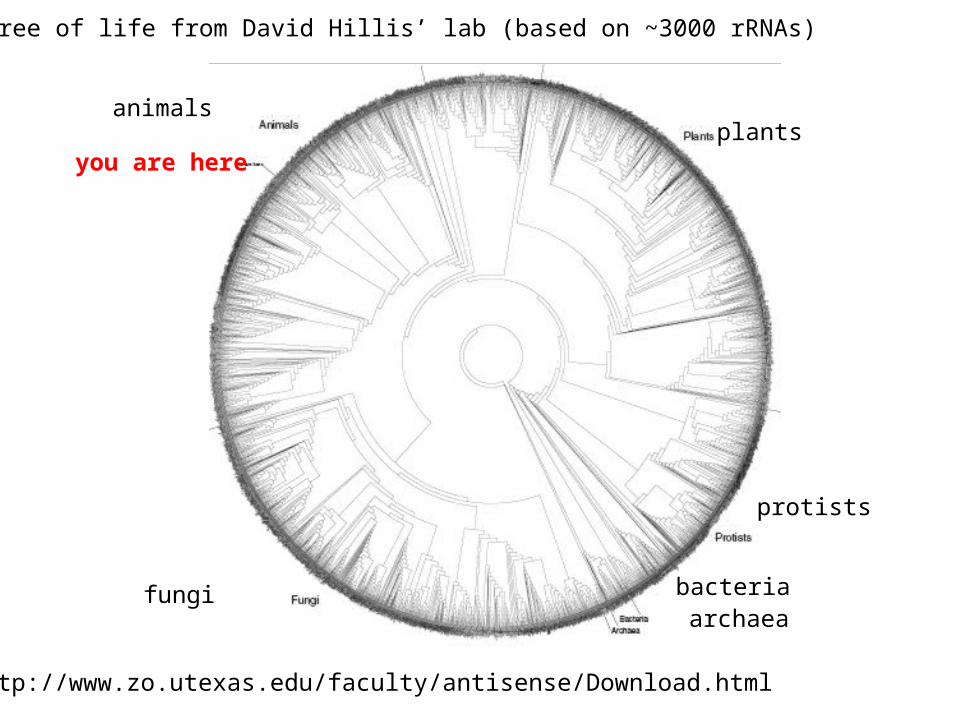
Tree of life from David Hillis’ lab (based on ~3000 rRNAs)
animalsplants
fungi
protists
bacteriaarchaea
you are here
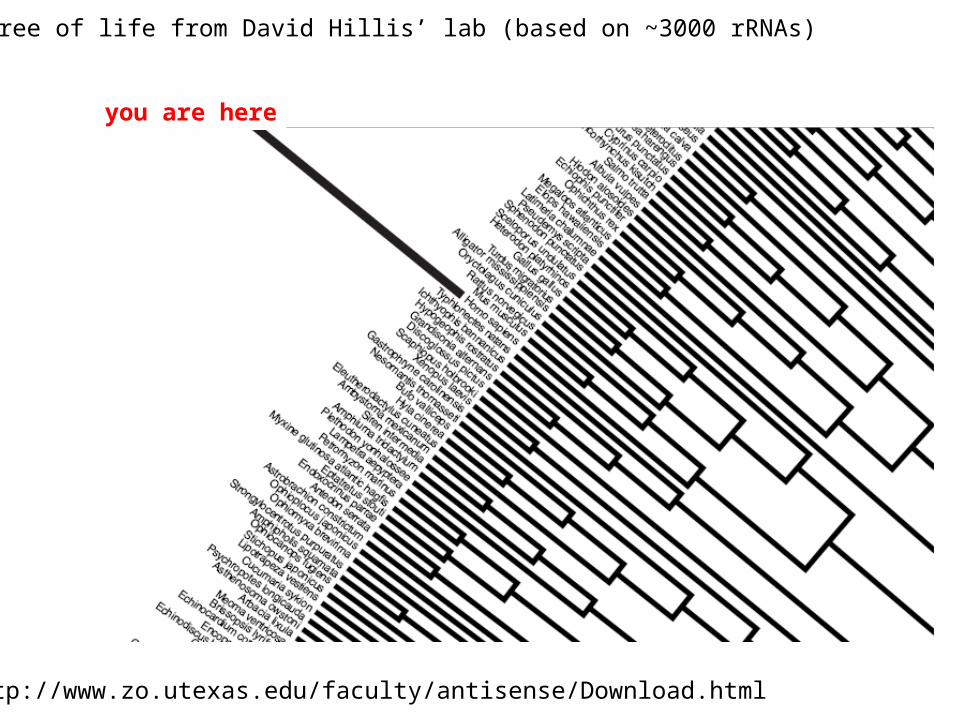
http://www.zo.utexas.edu/faculty/antisense/Download.html
you are here
Tree of life from David Hillis’ lab (based on ~3000 rRNAs)
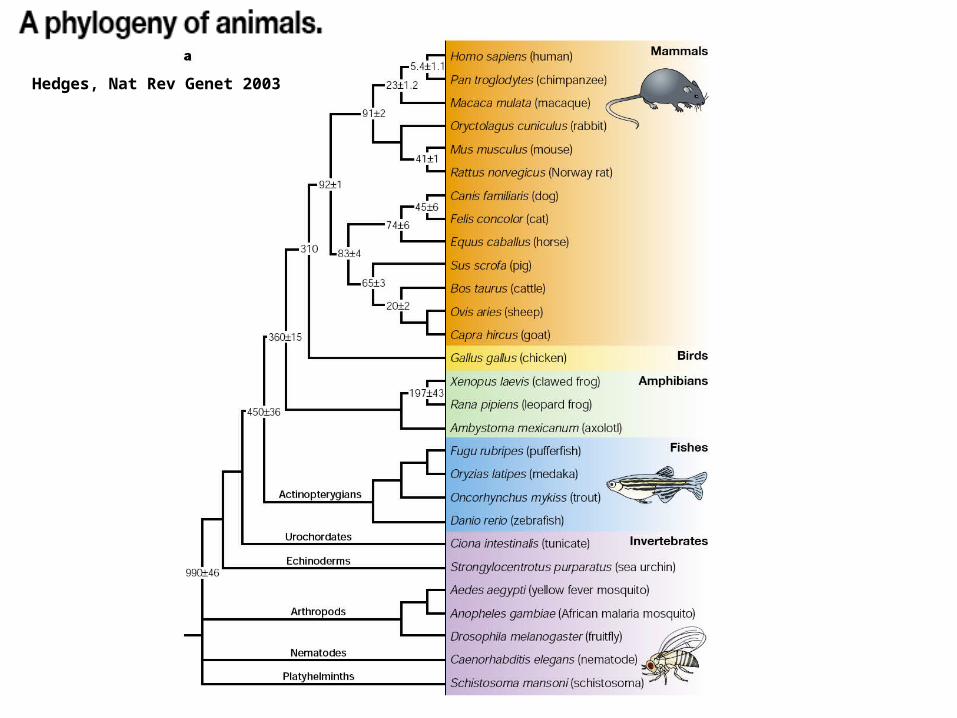
Hedges, Nat Rev Genet 2003
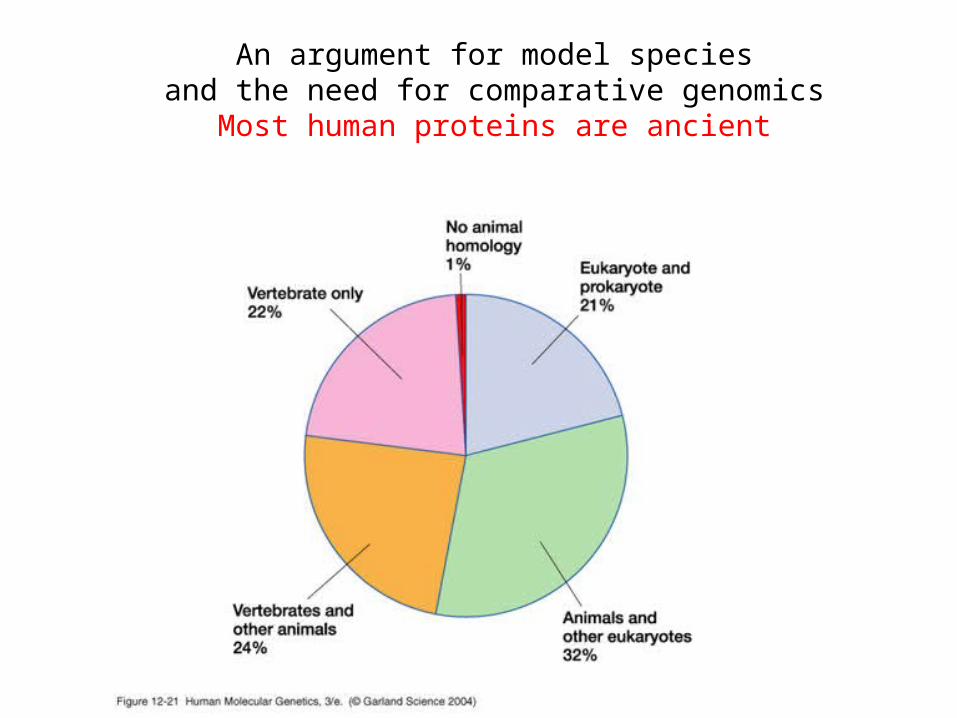
An argument for model speciesand the need for comparative genomics
Most human proteins are ancient
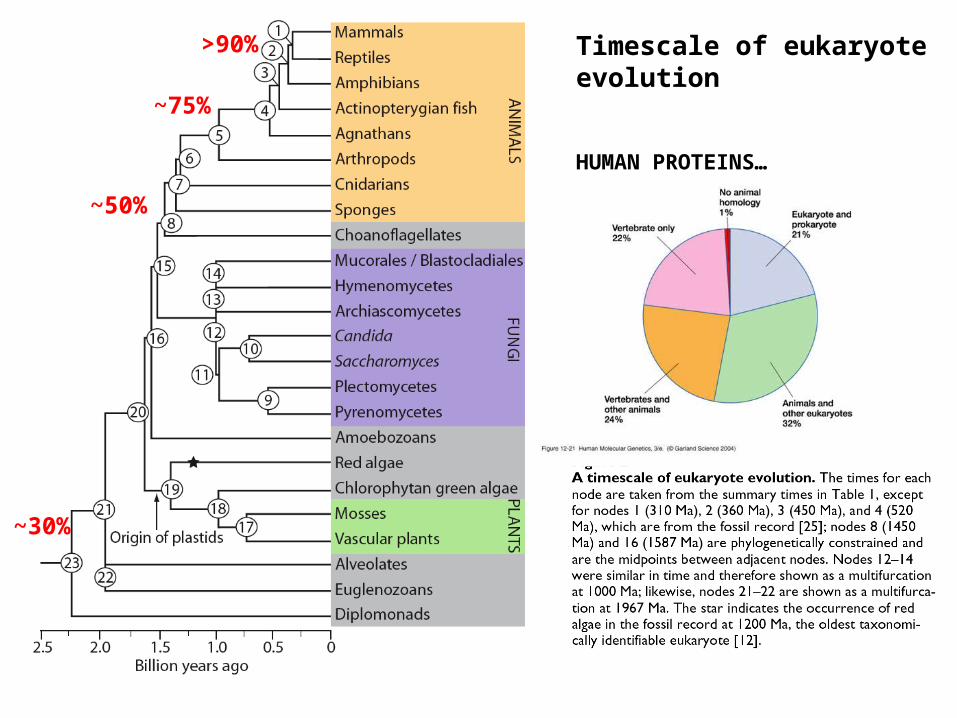
Timescale of eukaryote evolution
HUMAN PROTEINS…
~30%
~50%
~75%
>90%
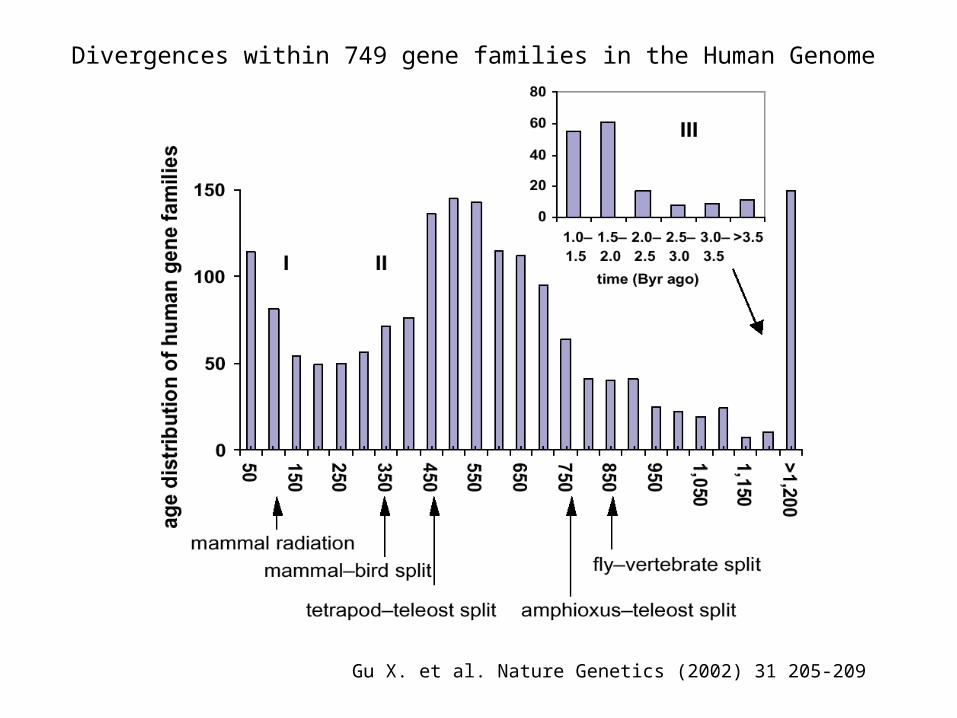
Gu X. et al. Nature Genetics (2002) 31 205-209
Divergences within 749 gene families in the Human Genome
Genomes have been recycling for Billions of years
11
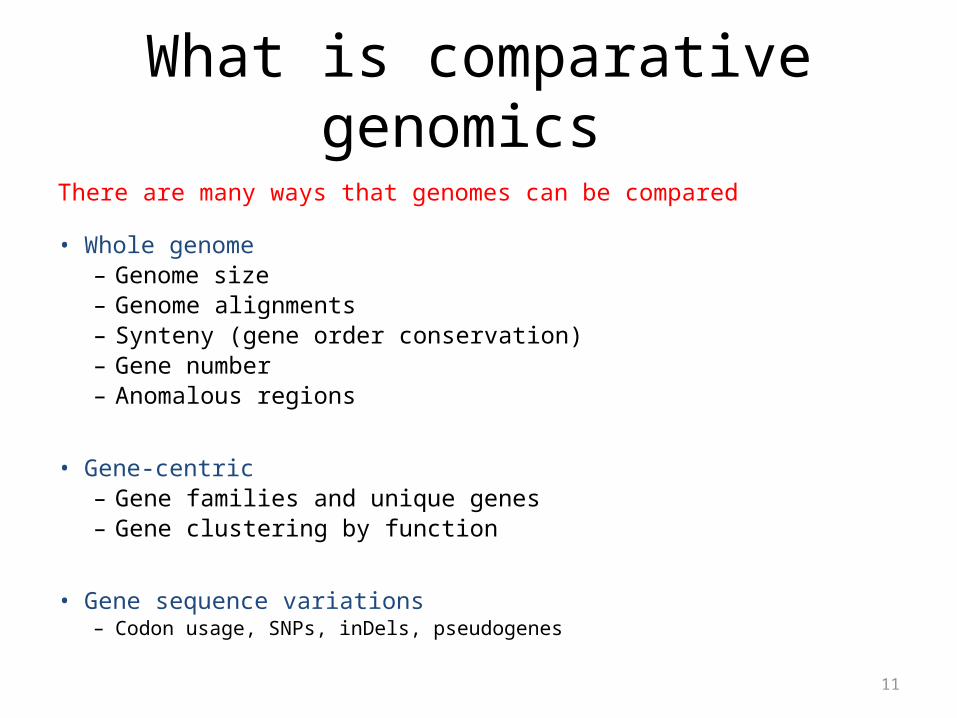
What is comparative genomics
There are many ways that genomes can be compared
• Whole genome– Genome size– Genome alignments– Synteny (gene order conservation)– Gene number– Anomalous regions
• Gene-centric– Gene families and unique genes– Gene clustering by function
• Gene sequence variations– Codon usage, SNPs, inDels, pseudogenes
12
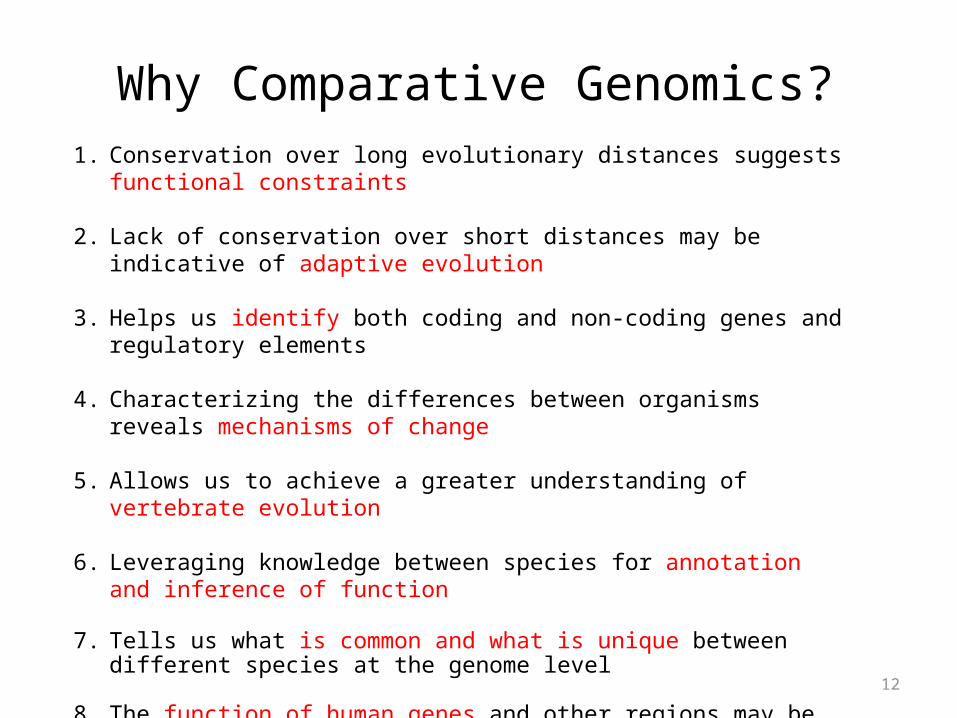
1. Conservation over long evolutionary distances suggests functional constraints
2. Lack of conservation over short distances may be indicative of adaptive evolution
3. Helps us identify both coding and non-coding genes and regulatory elements
4. Characterizing the differences between organisms reveals mechanisms of change
5. Allows us to achieve a greater understanding of vertebrate evolution
6. Leveraging knowledge between species for annotation and inference of function
7. Tells us what is common and what is unique between different species at the genome level
8. The function of human genes and other regions may be revealed by studying their counterparts in simpler model organisms
Why Comparative Genomics?
13
Comparing Genome SizeThe ‘C-value paradox’
Genome size does NOT correlate with organismal complexity
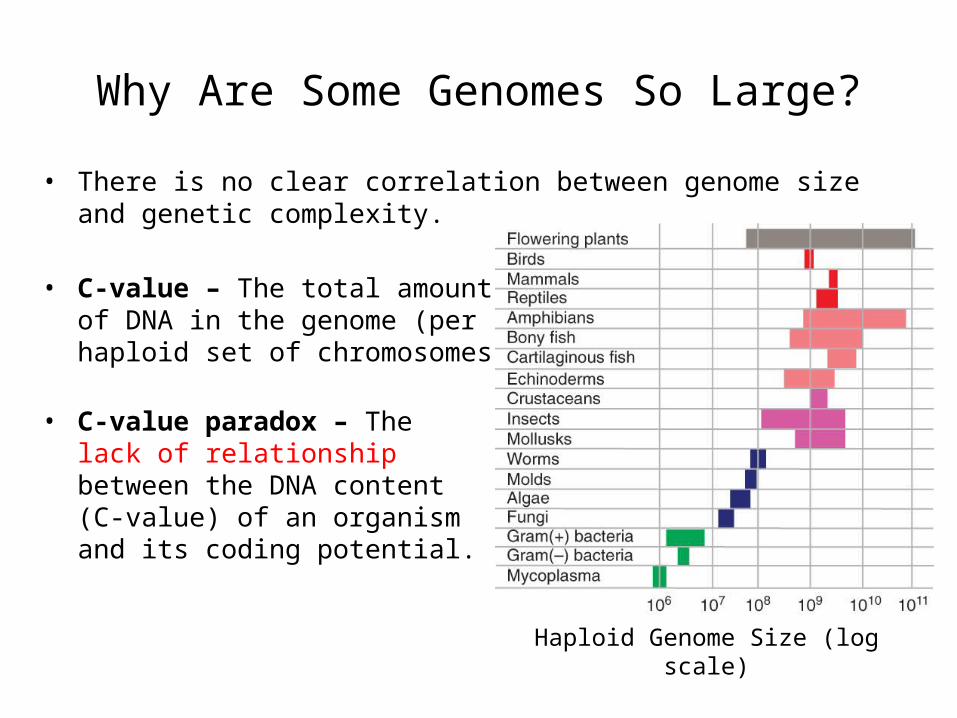
Why Are Some Genomes So Large?
• There is no clear correlation between genome size and genetic complexity.
• C-value – The total amountof DNA in the genome (perhaploid set of chromosomes)
• C-value paradox – Thelack of relationshipbetween the DNA content(C-value) of an organismand its coding potential.
Haploid Genome Size (log scale)
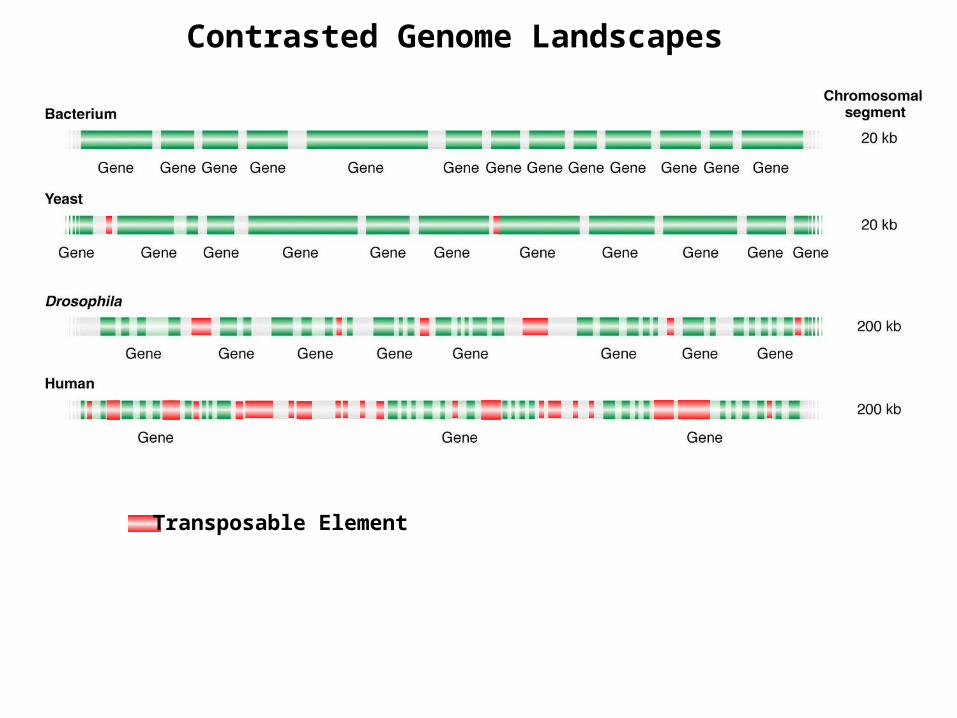
Transposable Element
Contrasted Genome Landscapes
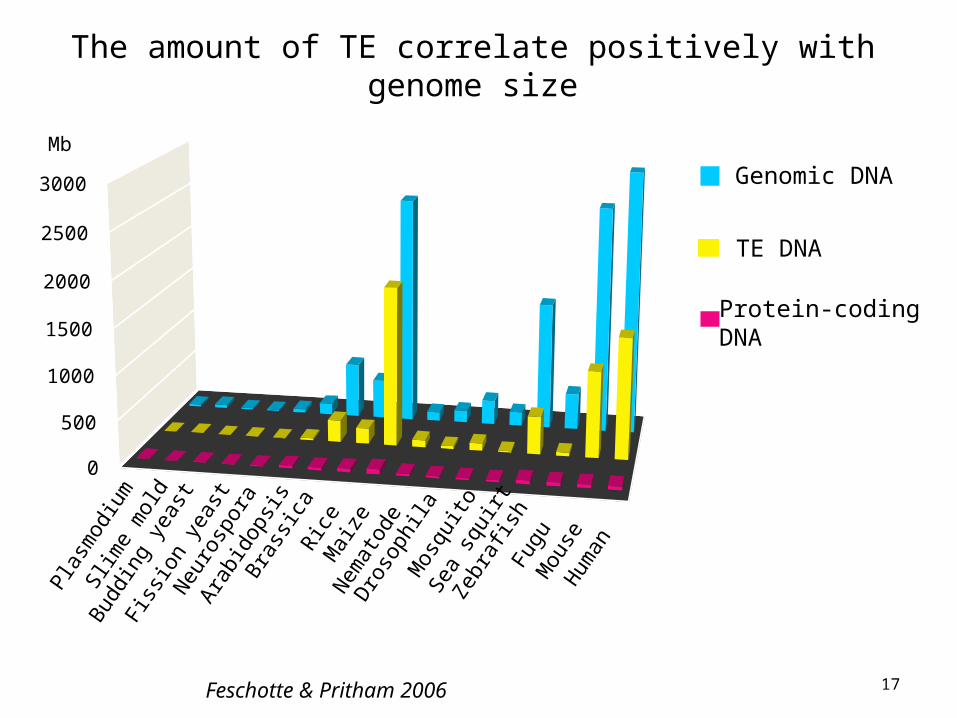
The amount of TE correlate positively with genome size
Plas
mod
ium
Slim
e m
old
Budd
ing
yeas
t
Fiss
ion
yeas
t
Neu
rosp
ora
Arab
idop
sis
Bras
sica
Rice
Mai
zeNem
atod
eDro
soph
ilaM
osqu
itoSe
a sq
uirt
Zebr
afish
Fugu
Mou
seHum
an
0
500
1000
1500
2000
2500
3000 Genomic DNA
TE DNA
Protein-codingDNA
Mb
Feschotte & Pritham 2006
17
18
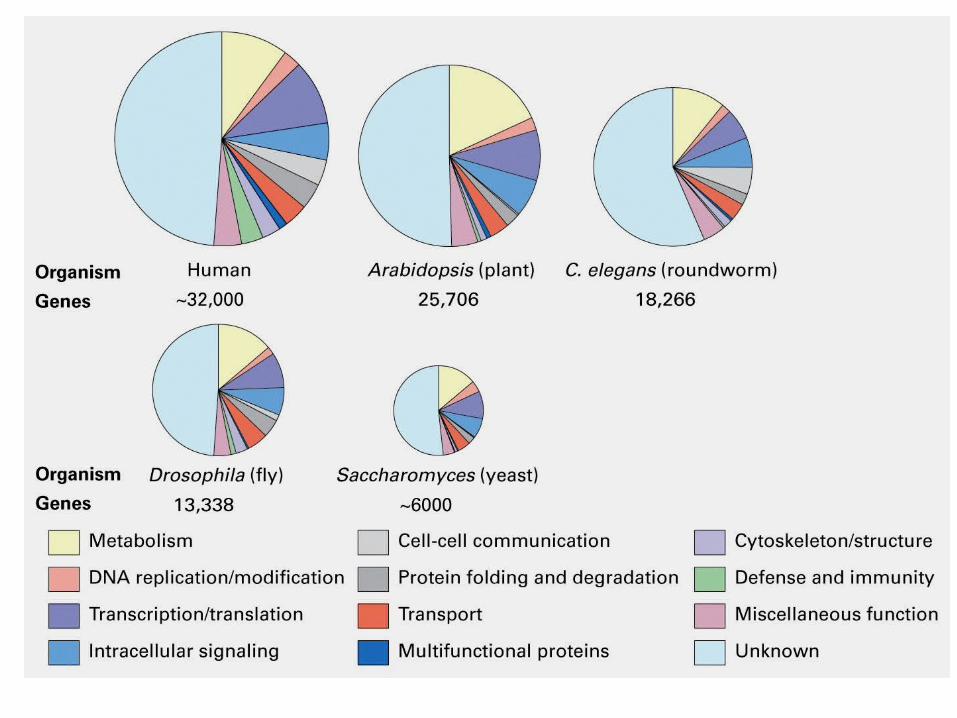
• Variation in gene numbers cannot explain variation in genome size among eukaryotes
• Most of variation in genome size is due to variation in the amount of repetitive DNA (mostly derived from TEs)
• TEs accumulate in intergenic and intronic regions
•CONCLUSIONS…• TEs have played an important role in genome evolution and
diversification
• Facilitate expansion and contraction of genomes AND gene families
Transposable Elements…
19
Coarse Comparisons of Genomes
20
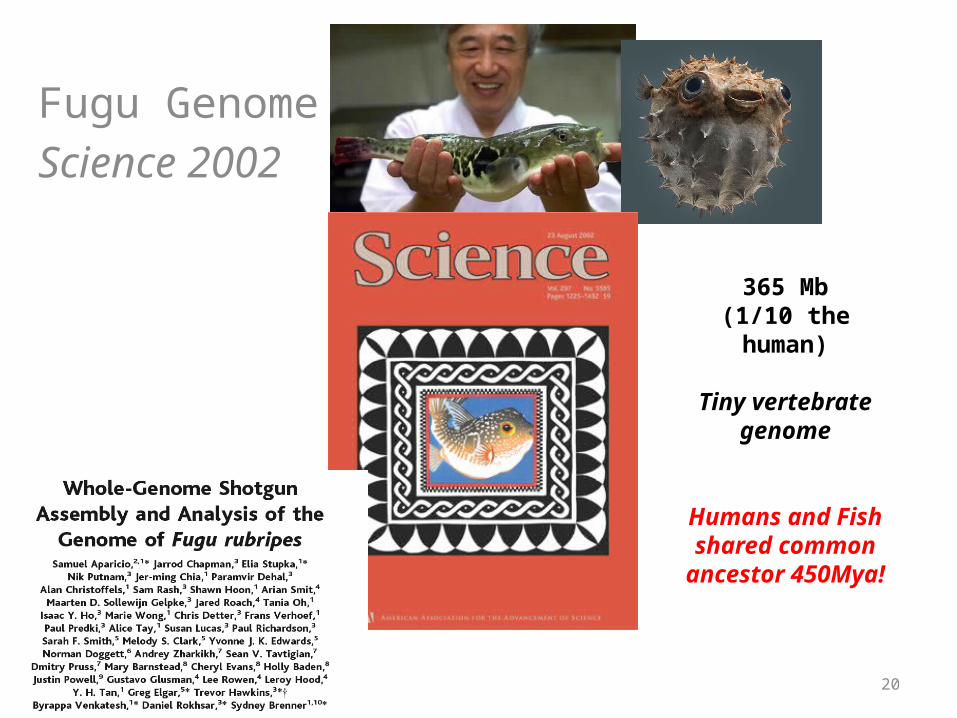
Fugu GenomeScience 2002
365 Mb(1/10 the human)
Tiny vertebrate genome
Humans and Fish shared common
ancestor 450Mya!
21
Among the Smallest Vertebrate Genome
• Genome is < 1/6 repetitive DNA– Vs. ~50% in us
• ¾ of human proteins have a strong match to Fugu (pretty good for 450My)
• ¼ of human proteins had highly diverged from, or had no pufferfish homologs
22
Shadows of the Ancient Vertebrate Genome…
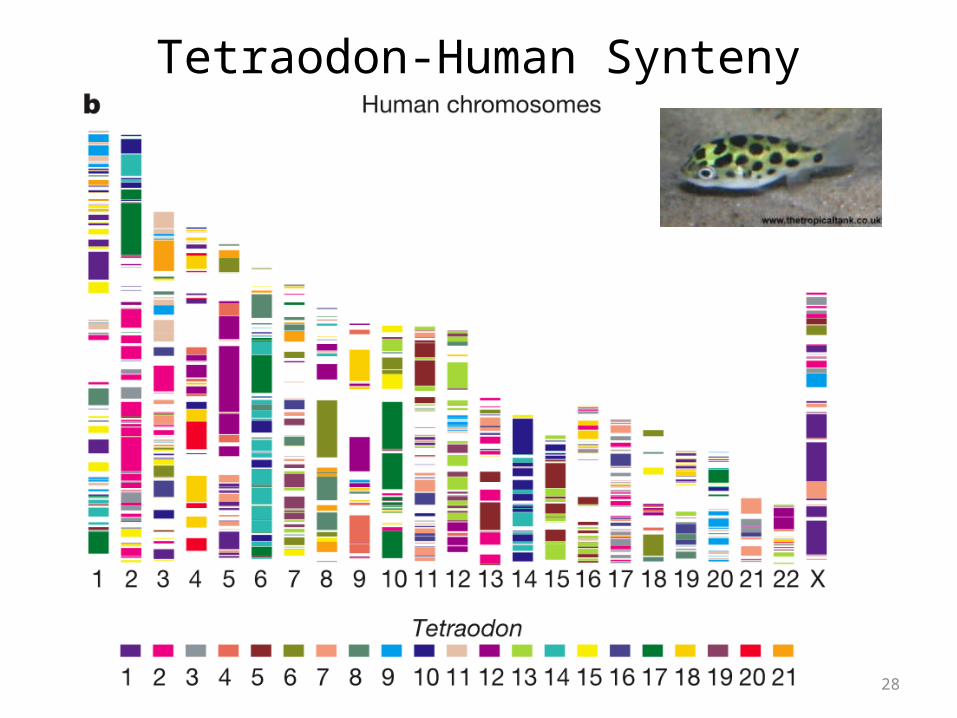
• Conserved linkages between Fugu and human – Preservation of chromosomal chunks from the
common vertebrate ancestor (synteny)
• BUT, lots of cut/copy-paste…. And some general scrambling of gene order
Shadows of the Ancient Vertebrate Genome…
• Conserved linkages between Fugu and human – Preservation of chromosomal chunks from the
common vertebrate ancestor
• BUT, lots of cut/copy-paste…. And some general scrambling of gene order
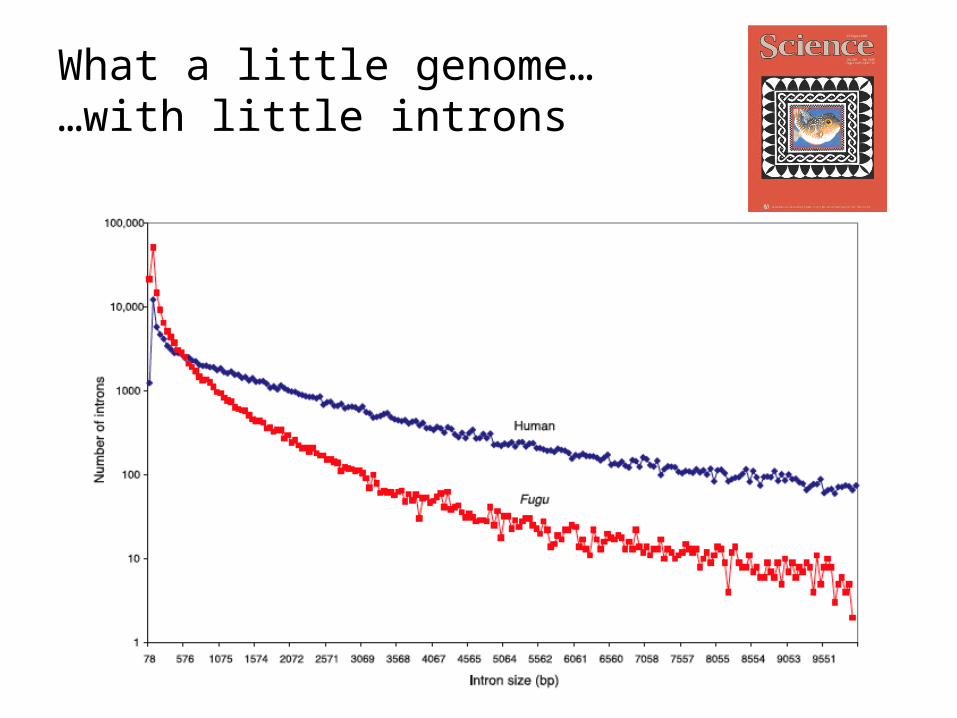
What a little genome… …with little introns
• The Fugu genome is compact partly because introns are shorter compared with the human genome
• The Fugu mode of intron size is 79 bp– 75% of introns 425 bp in length
• The human mode is 87 bp – 75% of introns 2609 bp
• Fugu: 500 introns > 10Kb --- Human: 12,000 > 10Kb
• The total numbers of introns are roughly the same– 161,536 introns in Fugu– 152,490 introns in human
What a little genome… …with little introns
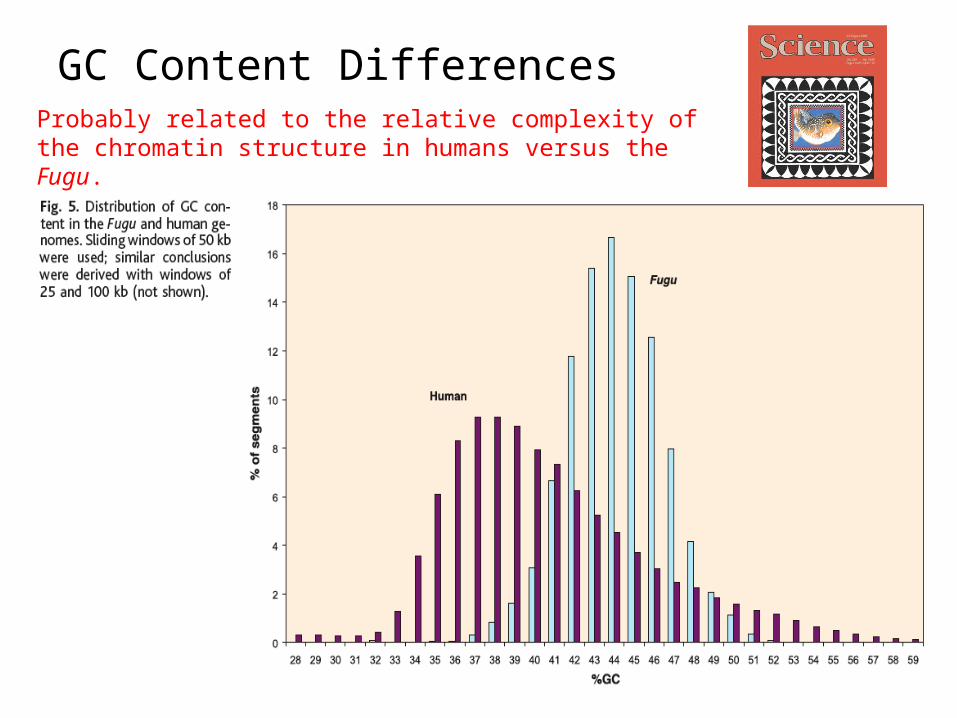
GC Content DifferencesProbably related to the relative complexity of the chromatin structure in humans versus the Fugu.
Fugu-Human Syntenyhttp://blast.fugu-sg.org/fugu-synteny/viewer_newServer.php
I think their maps, however, are confusing and not that informative, -scaffolds were not physically mapped to chromosomes…
Let’s look instead at the other pufferfish, Tetraodon, that was sequenced the following year..
-physical mapping to chromosomes was complete
28
Tetraodon-Human Synteny
29
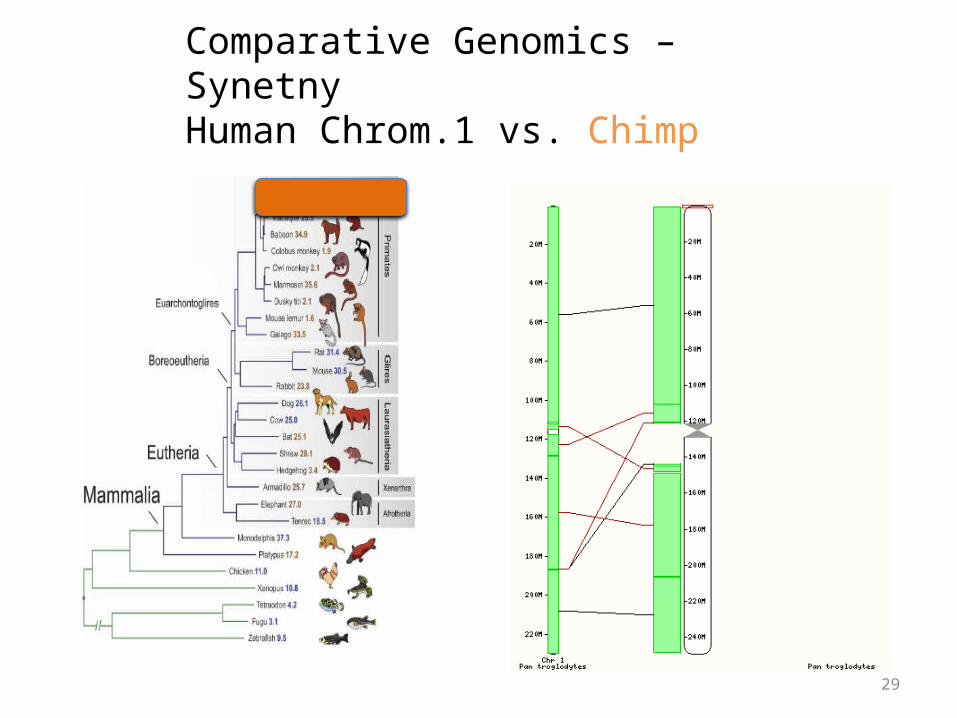
Comparative Genomics – SynetnyHuman Chrom.1 vs. Chimp
30
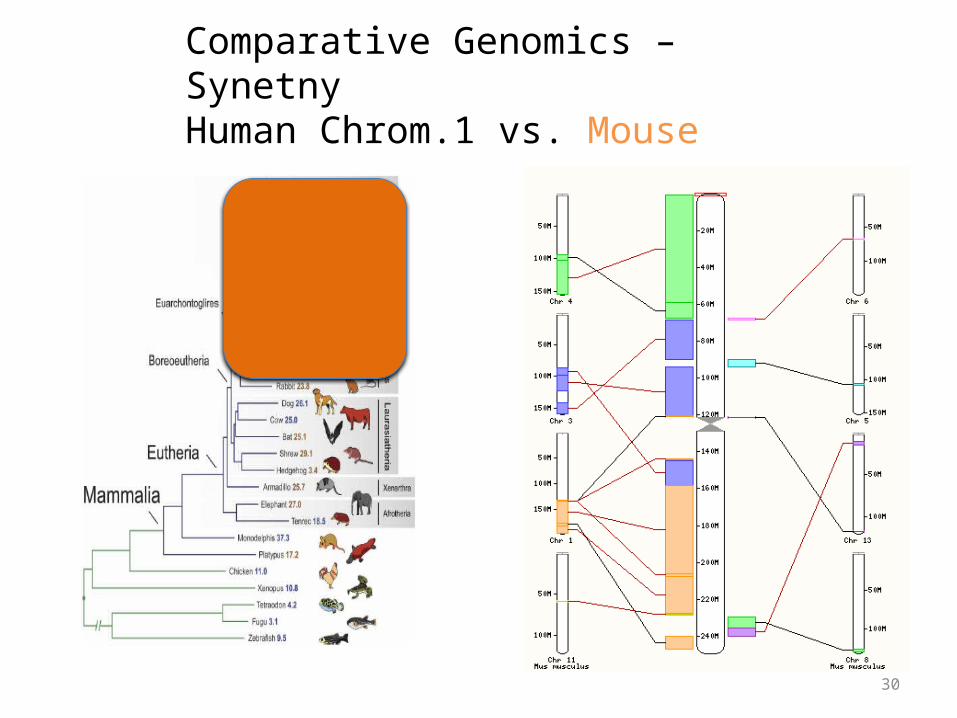
Comparative Genomics – SynetnyHuman Chrom.1 vs. Mouse
31
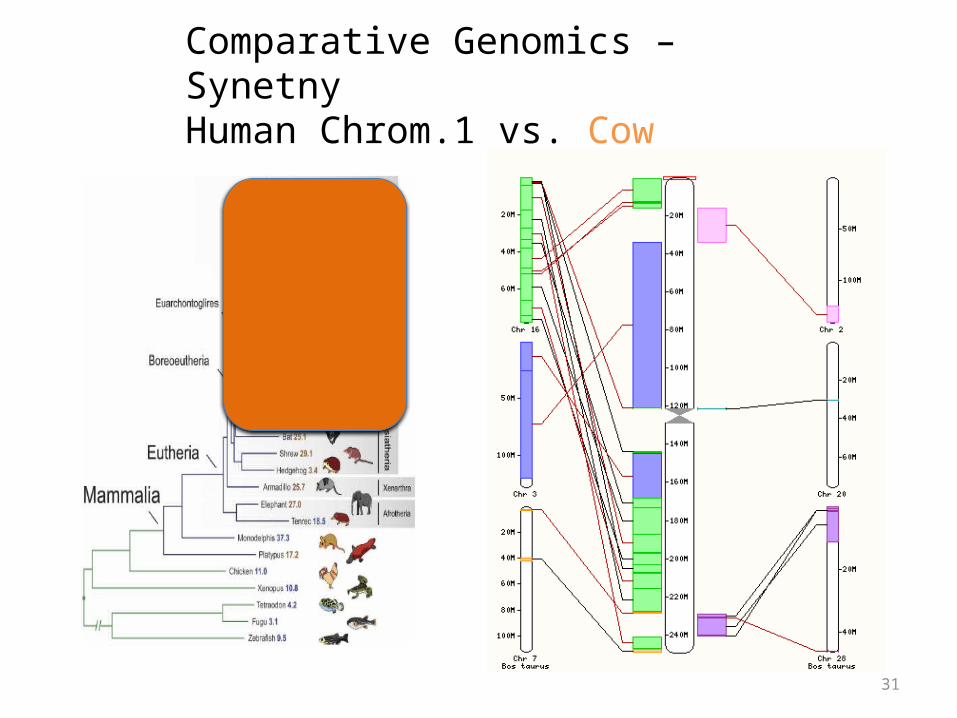
Comparative Genomics – SynetnyHuman Chrom.1 vs. Cow
32
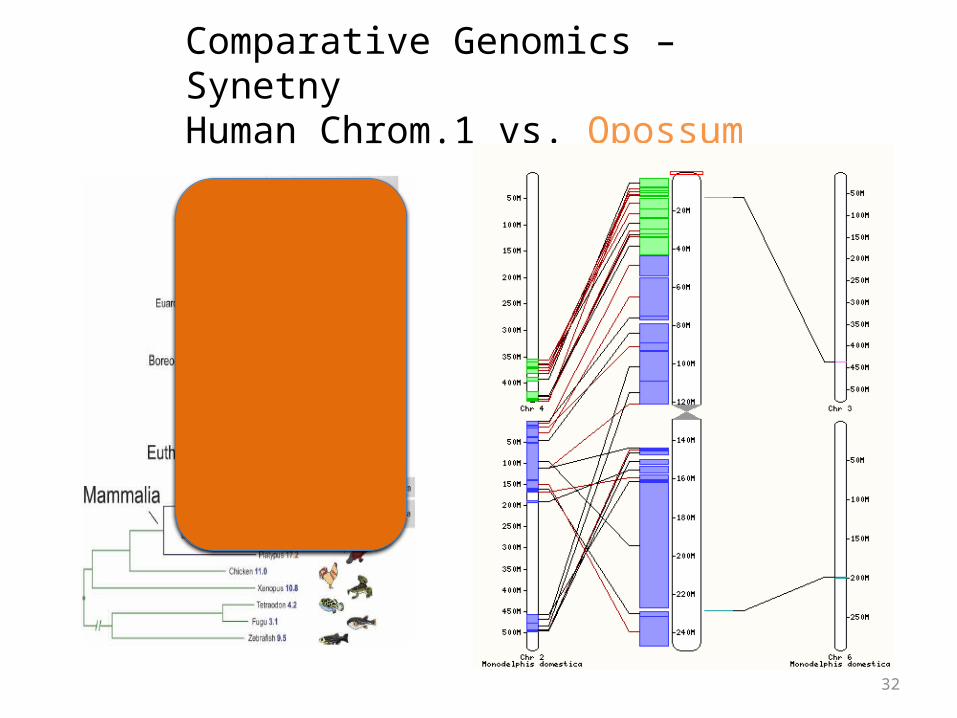
Comparative Genomics – SynetnyHuman Chrom.1 vs. Opossum
33
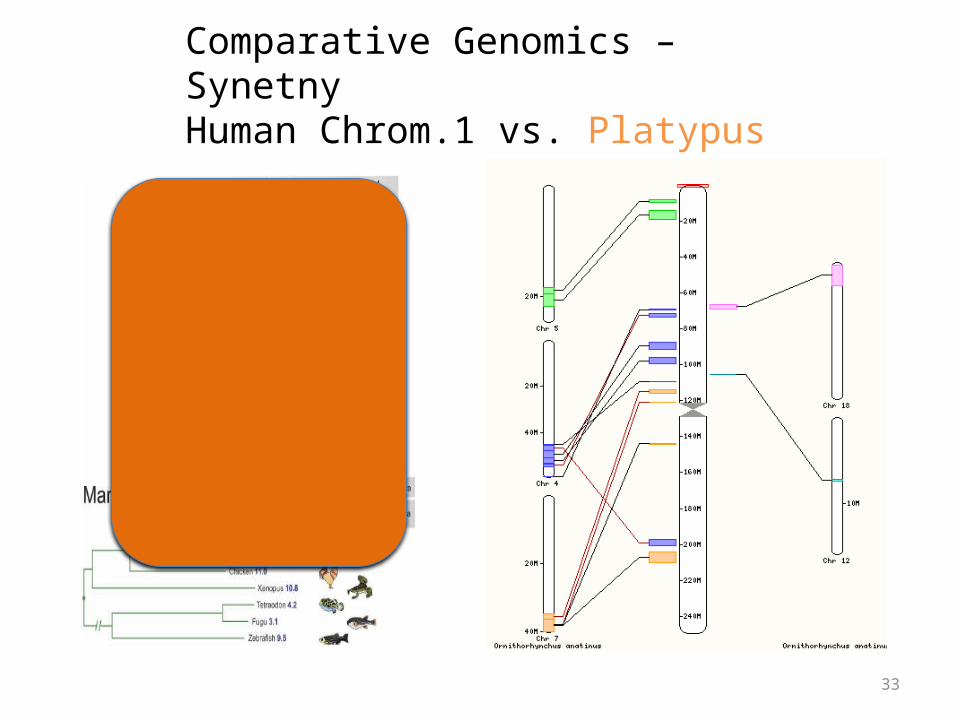
Comparative Genomics – SynetnyHuman Chrom.1 vs. Platypus
34
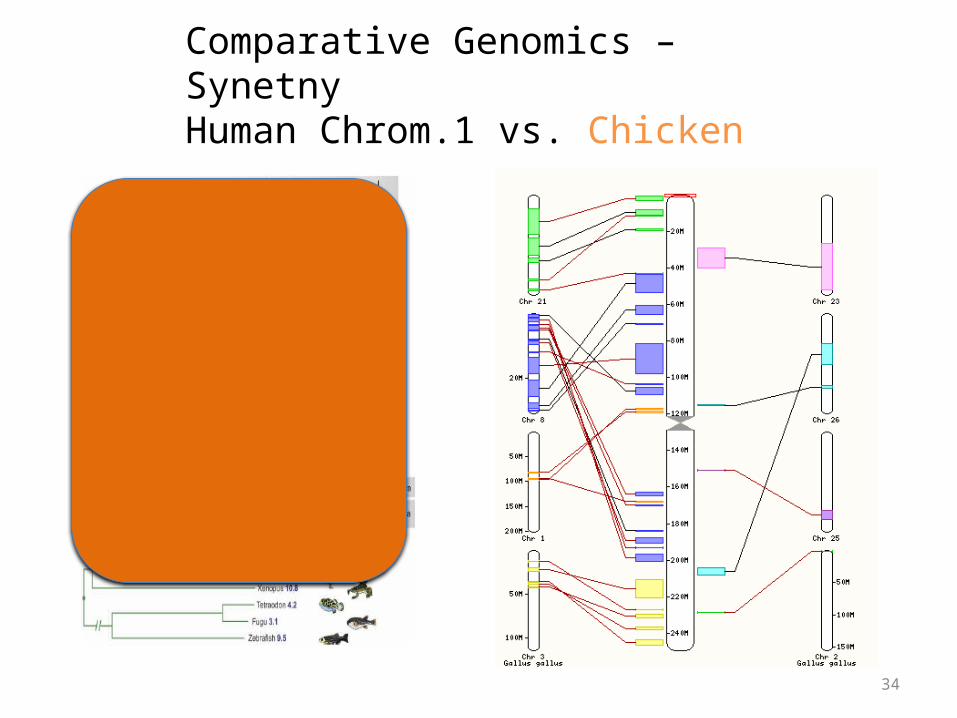
Comparative Genomics – SynetnyHuman Chrom.1 vs. Chicken
35
Synteny
• Large blocks of synteny exist even at great phylogenetic distance
• Also substantial scrambling, even at short distance…
Whole Genome Alignments
• Functional sequences often evolve more slowly than non-functional sequences, therefore sequences that remain conserved may perform a biological function.
• Comparing genomic sequences from species at different evolutionary distances allows us to identify:– Coding genes– Non-coding genes– Non-coding regulatory sequences
36
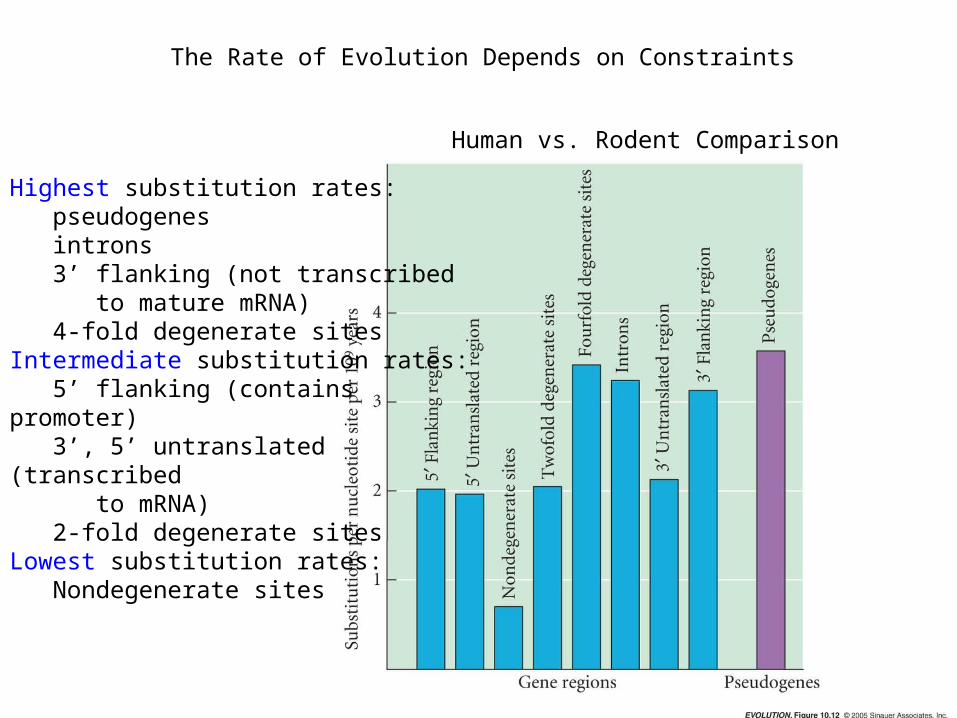
The Rate of Evolution Depends on Constraints
Human vs. Rodent Comparison
Highest substitution rates: pseudogenes introns 3’ flanking (not transcribed to mature mRNA) 4-fold degenerate sites Intermediate substitution rates: 5’ flanking (contains promoter) 3’, 5’ untranslated (transcribed to mRNA) 2-fold degenerate sitesLowest substitution rates: Nondegenerate sites
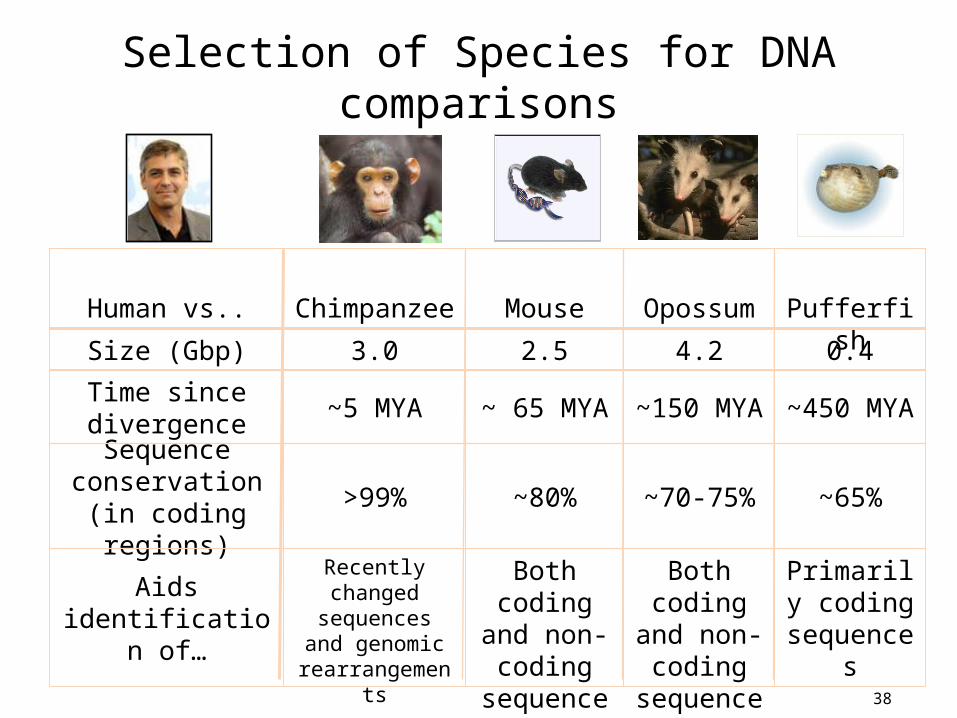
Selection of Species for DNA comparisons
Both coding and
non-coding
sequences
~70-75%
~150 MYA
4.2
Opossum
0.42.53.0Size (Gbp)
~65%~80%>99%Sequence
conservation (in coding regions)
Primarily coding
sequences
Both coding and non-coding sequences
Recently changed
sequences and genomic
rearrangements
Aids identification of…
~450 MYA~ 65 MYA~5 MYATime since divergence
PufferfishMouseChimpanzeeHuman vs..
38
39
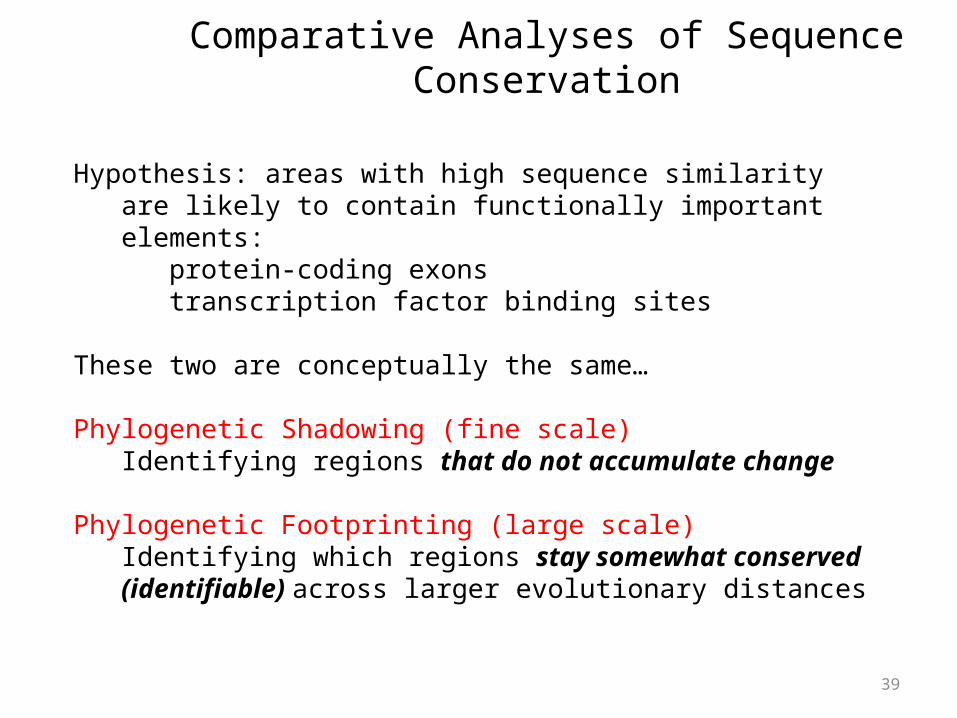
Comparative Analyses of Sequence Conservation
Hypothesis: areas with high sequence similarity are likely to contain functionally important elements:
protein-coding exonstranscription factor binding sites
These two are conceptually the same…
Phylogenetic Shadowing (fine scale)Identifying regions that do not accumulate change
Phylogenetic Footprinting (large scale)Identifying which regions stay somewhat conserved (identifiable) across larger evolutionary distances
40
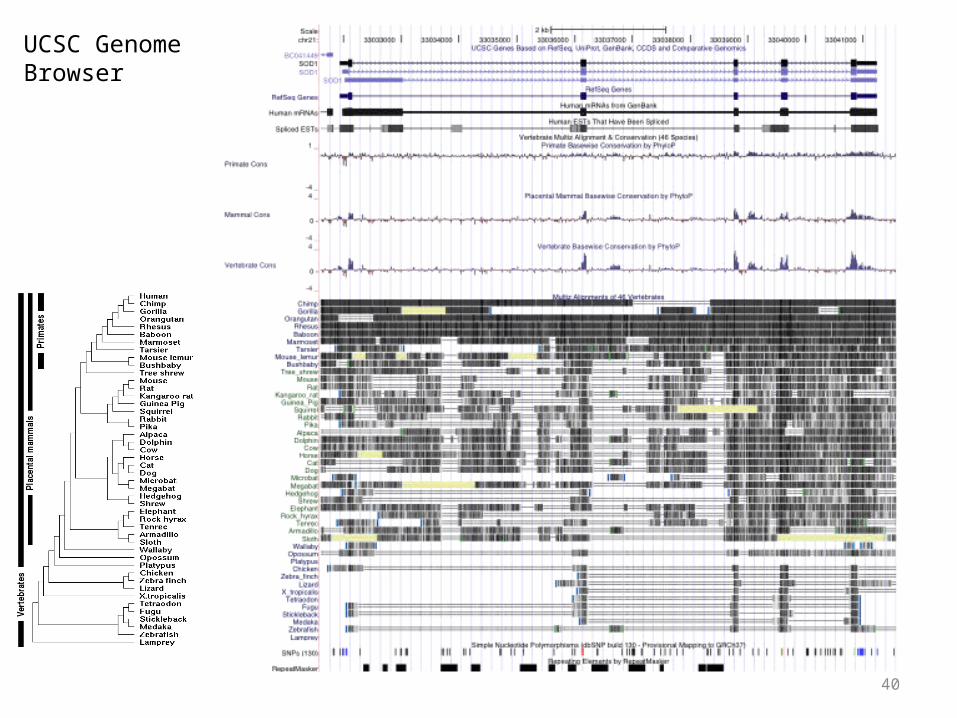
UCSC Genome Browser
41
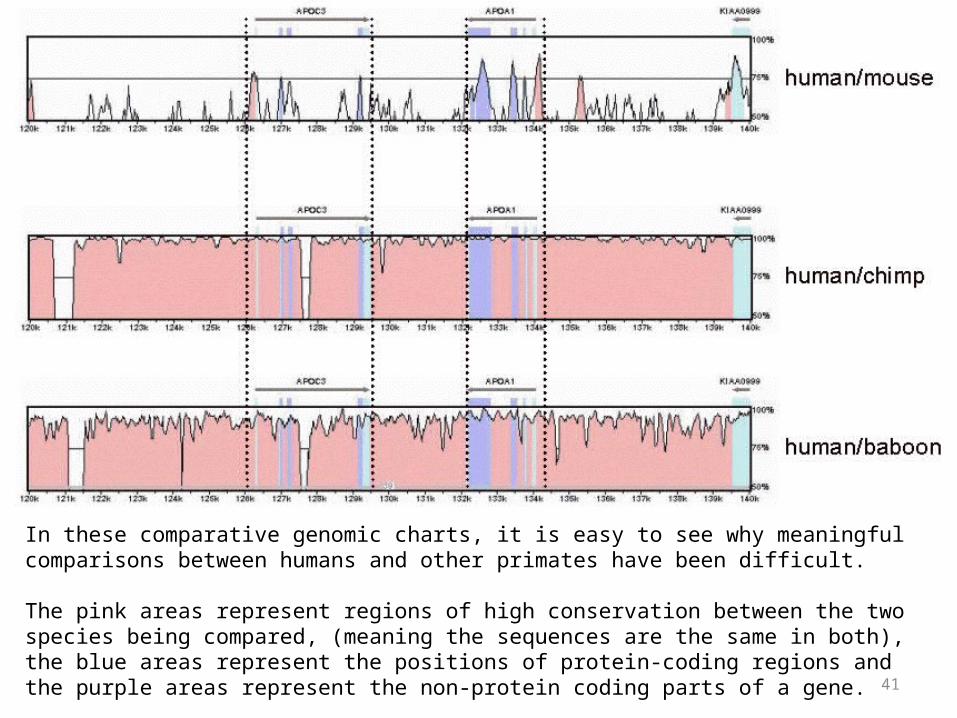
In these comparative genomic charts, it is easy to see why meaningful comparisons between humans and other primates have been difficult.
The pink areas represent regions of high conservation between the two species being compared, (meaning the sequences are the same in both), the blue areas represent the positions of protein-coding regions and the purple areas represent the non-protein coding parts of a gene.

Phylogenetic shadowing analyses sequence variation in a multiple alignment to identify regions that accumulate variation at a slower rate.
Each position of an alignment is fitted to a phylogenetic model to calculate the likelihood that the position is evolving at a fast or a slow rate (a).
Generally, positions with several sequence differences across species are more likely to be evolving at a fast rate, and in turn identify the least variable regions (b).
The slowly evolving regions often correspond to functional sequences.
42
43
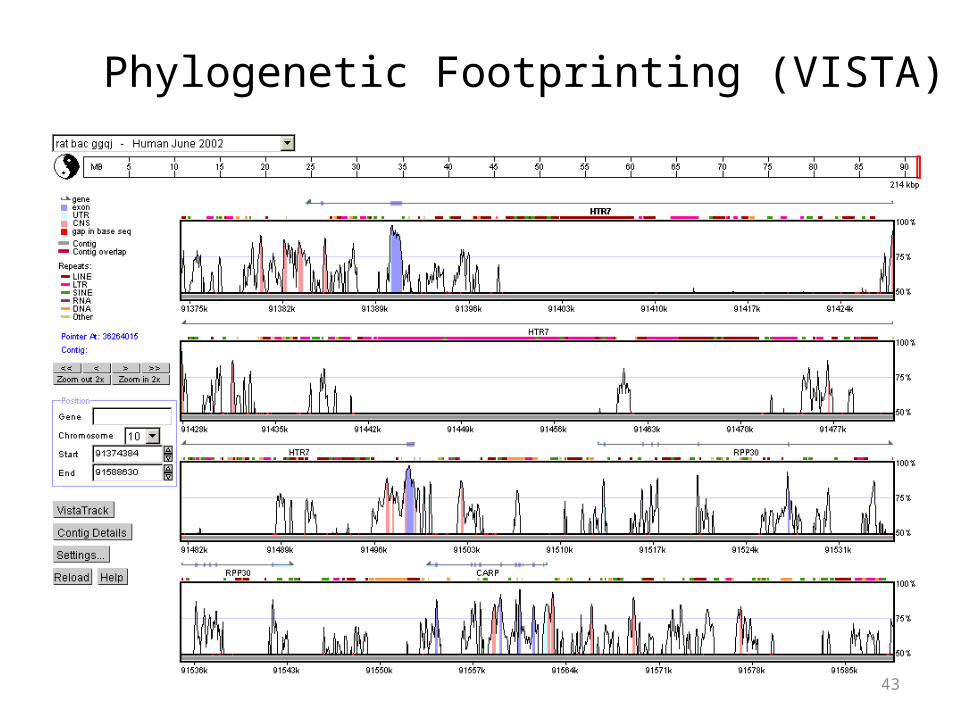
Phylogenetic Footprinting (VISTA)
44
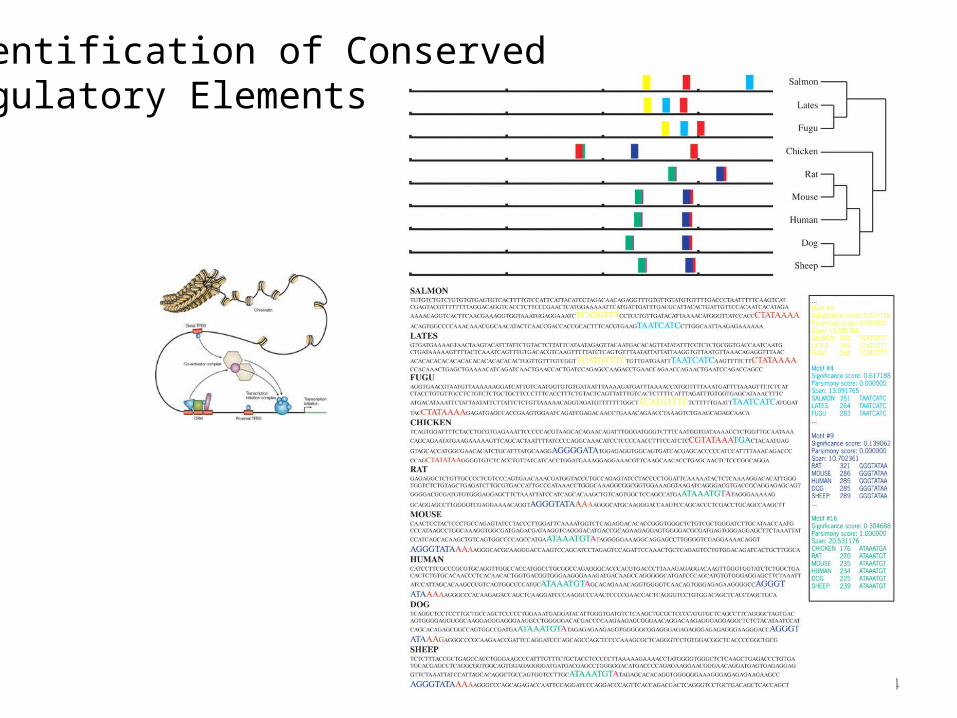
Identification of Conserved Regulatory Elements
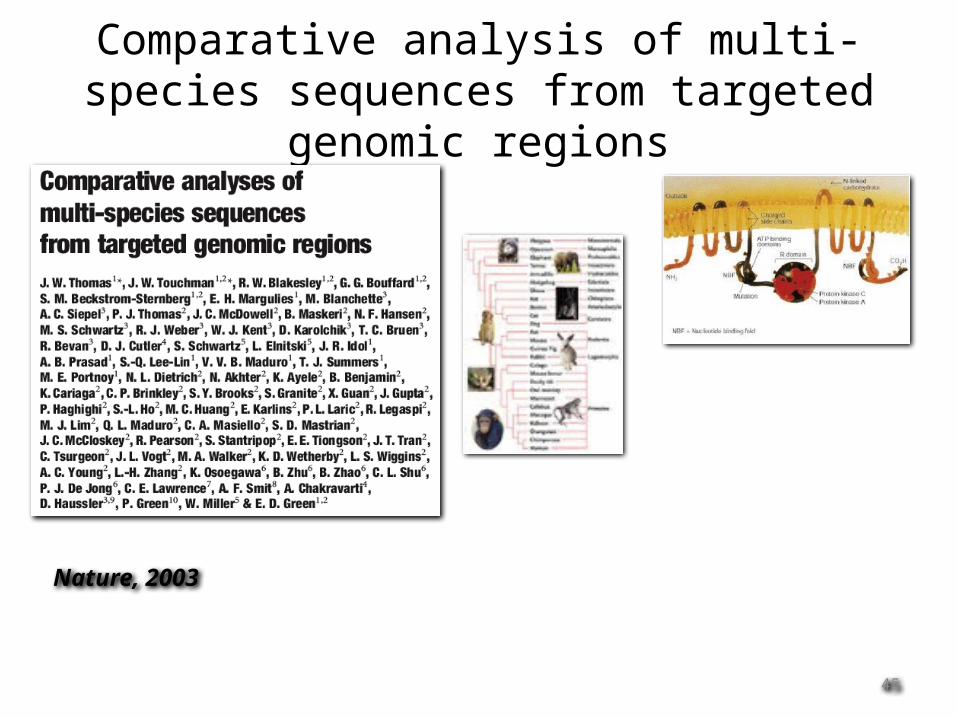
Comparative analysis of multi-species sequences from targeted genomic regions
45
Nature, 2003
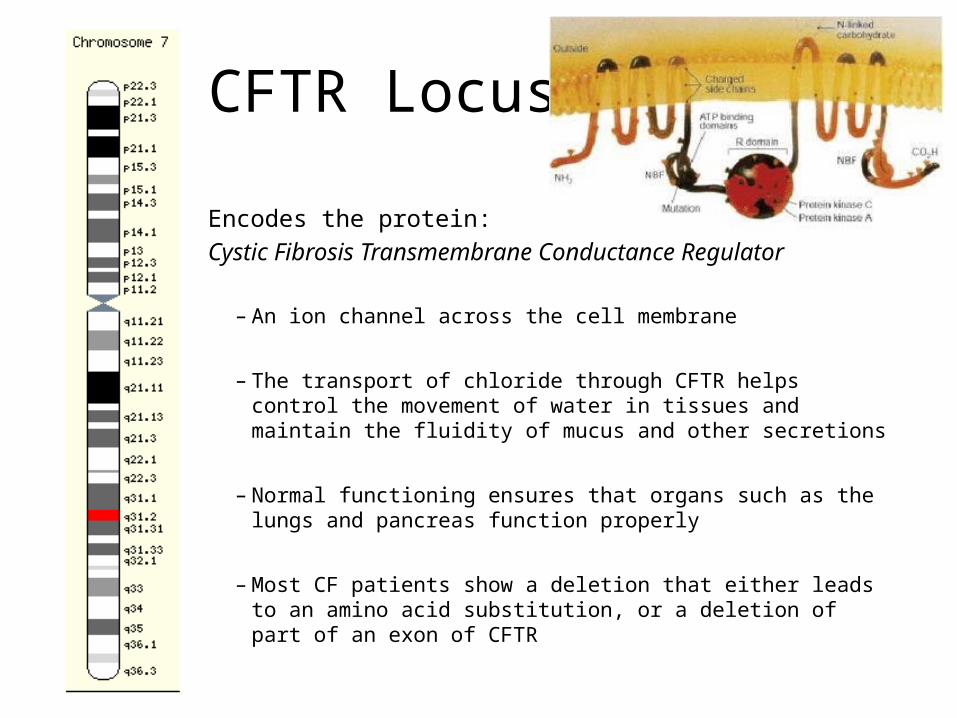
CFTR Locus
Encodes the protein: Cystic Fibrosis Transmembrane Conductance Regulator
– An ion channel across the cell membrane
– The transport of chloride through CFTR helps control the movement of water in tissues and maintain the fluidity of mucus and other secretions
– Normal functioning ensures that organs such as the lungs and pancreas function properly
– Most CF patients show a deletion that either leads to an amino acid substitution, or a deletion of part of an exon of CFTR
47
Comparative Genomics of the CFTR Locus
• CFTR = 1.8 Mb of human Ch7, Sequenced for 12 ssp.
• How does a single locus change over evolutionary time?
• How much does it change?
• What types of changes are more/less common?
• Do some lineages have more of certain changes than others?
• How much comparative genomic data do we need???
48
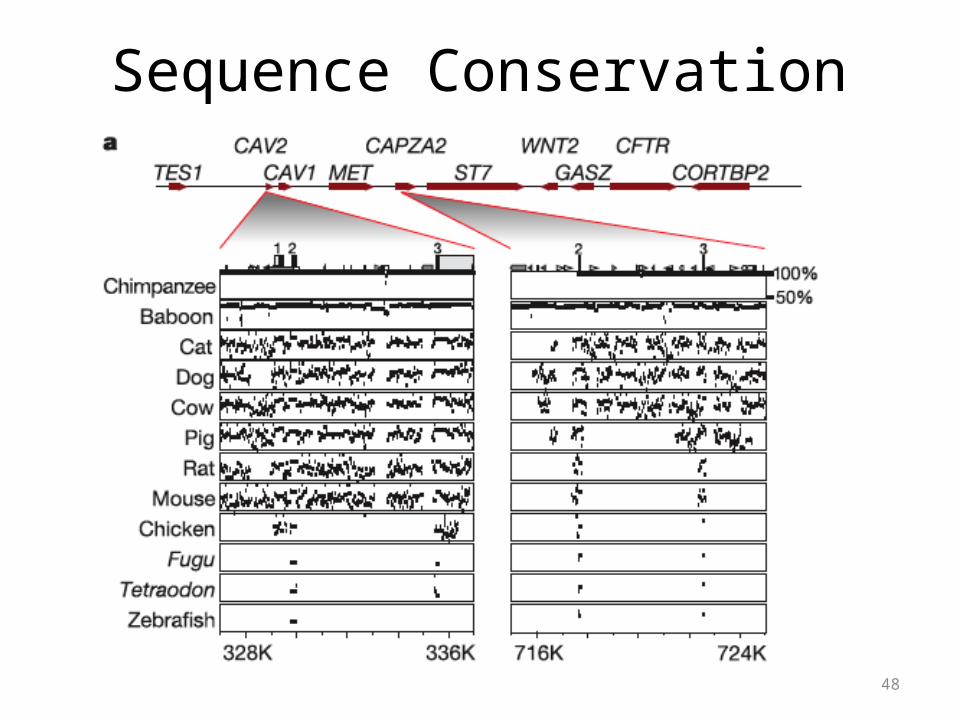
Sequence Conservation
49
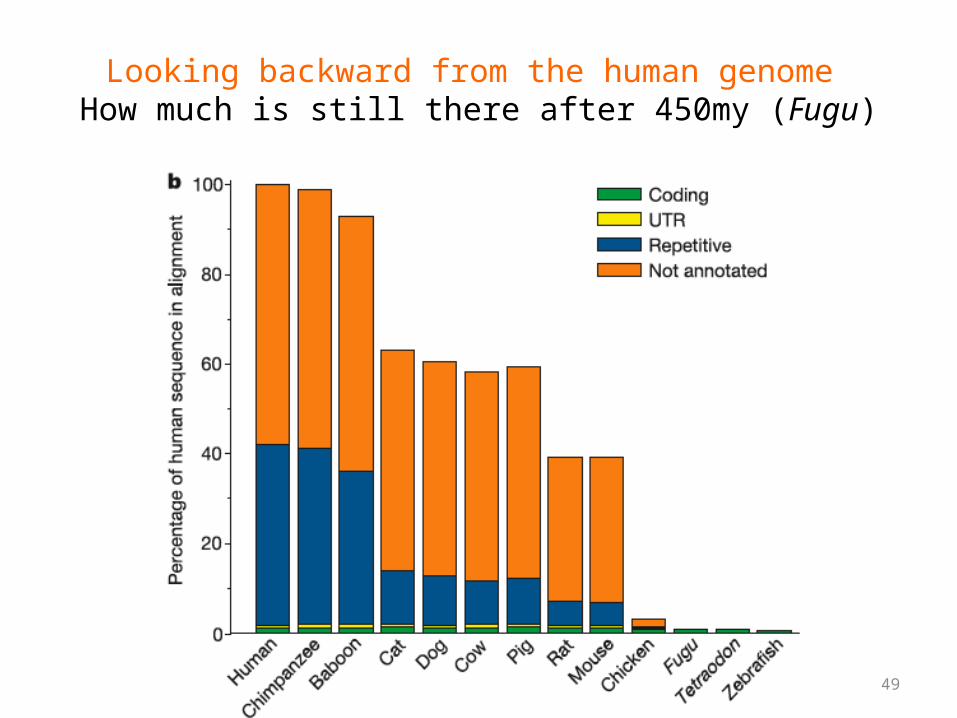
Looking backward from the human genome How much is still there after 450my (Fugu)
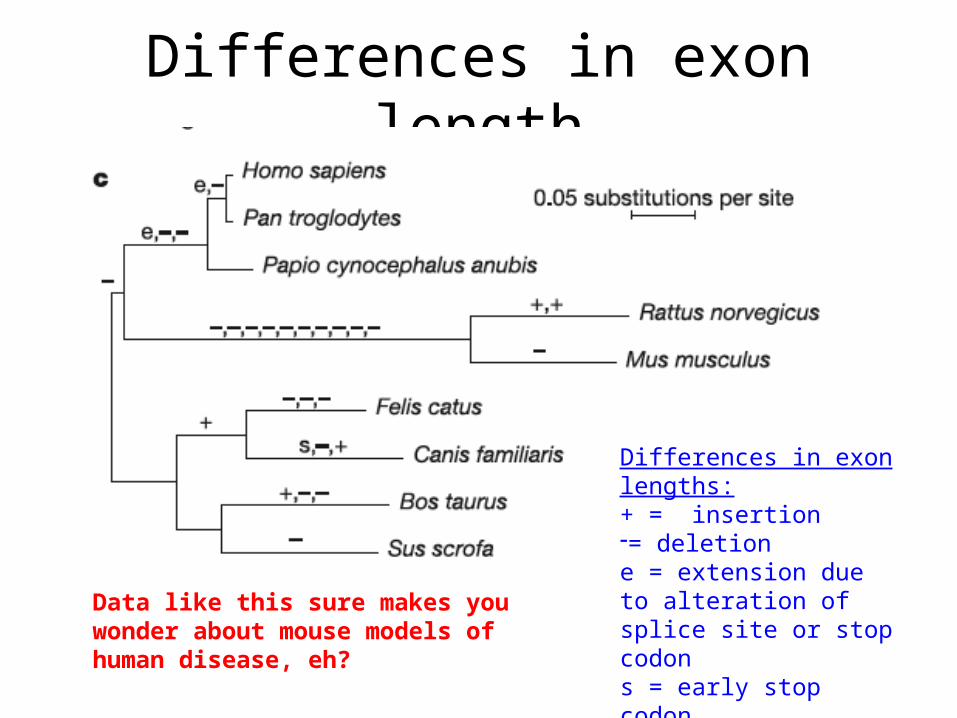
Differences in exon length
Differences in exon lengths:+ = insertion-= deletione = extension due to alteration of splice site or stop codon s = early stop codon
Data like this sure makes you wonder about mouse models of human disease, eh?
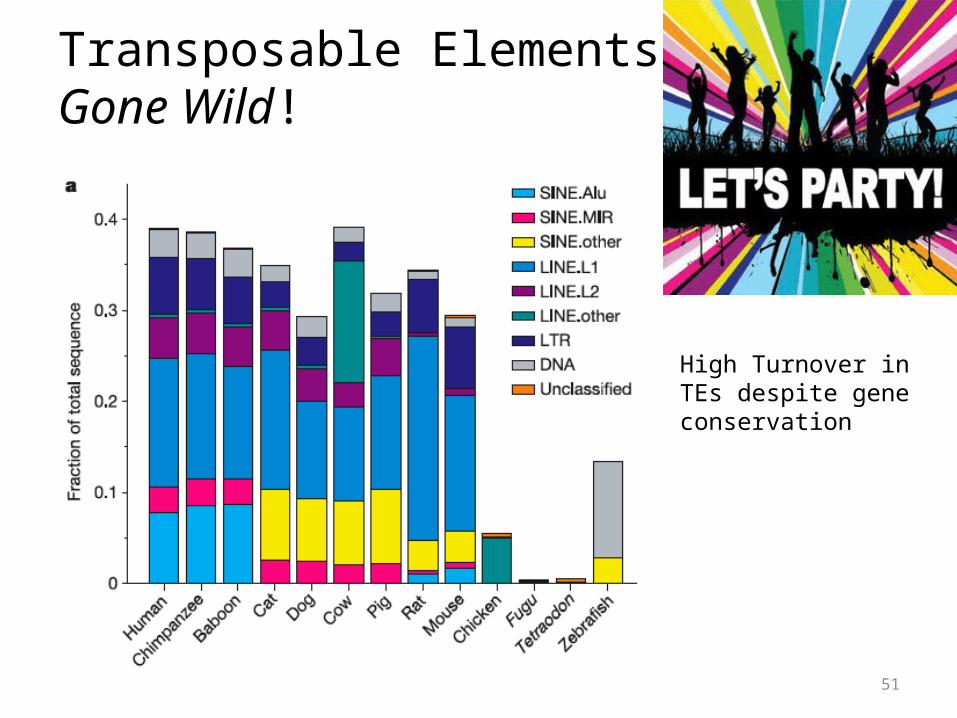
Transposable ElementsGone Wild!
51
High Turnover in TEs despite gene conservation
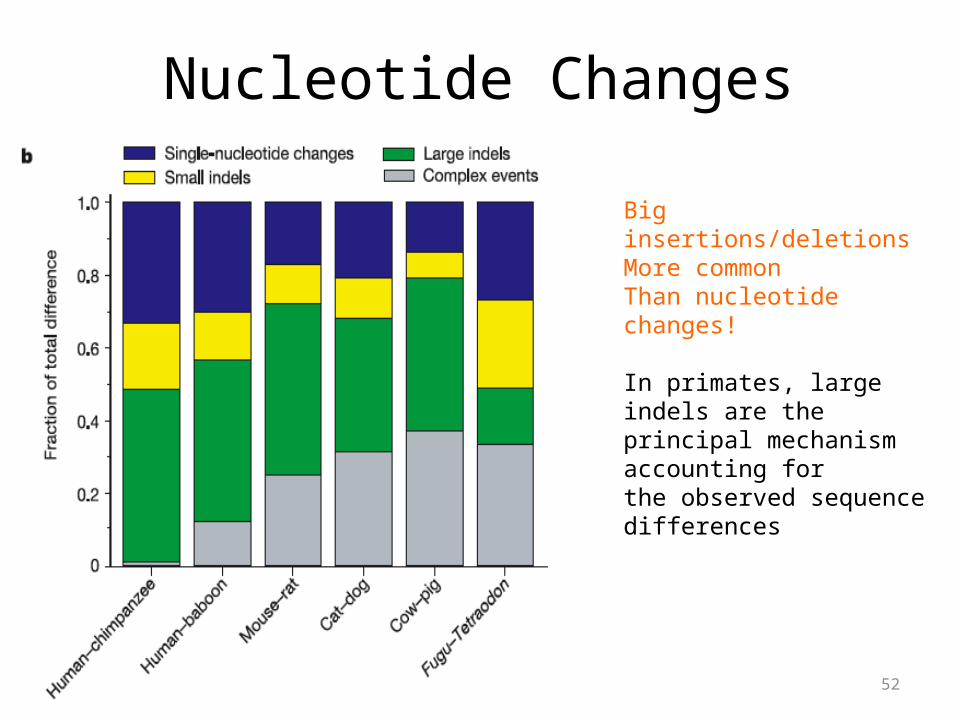
Nucleotide Changes
52
Big insertions/deletionsMore common Than nucleotide changes!
In primates, large indels are the principal mechanism accounting forthe observed sequence differences

Using all 12 species, they found 561 Multi-Species ConservedSequences (MCSs)
So, how many could we find using just the Mouse genome (rather than all 12)
Less than half even with high false positives…!!!
Using evolutionary conservation to ID functionally important conserved human genome segments
How many comparative genomes do we need – can’t we just use the mouse? (Lots, and NO)…
53
False Pos.
False Neg.True Pos.
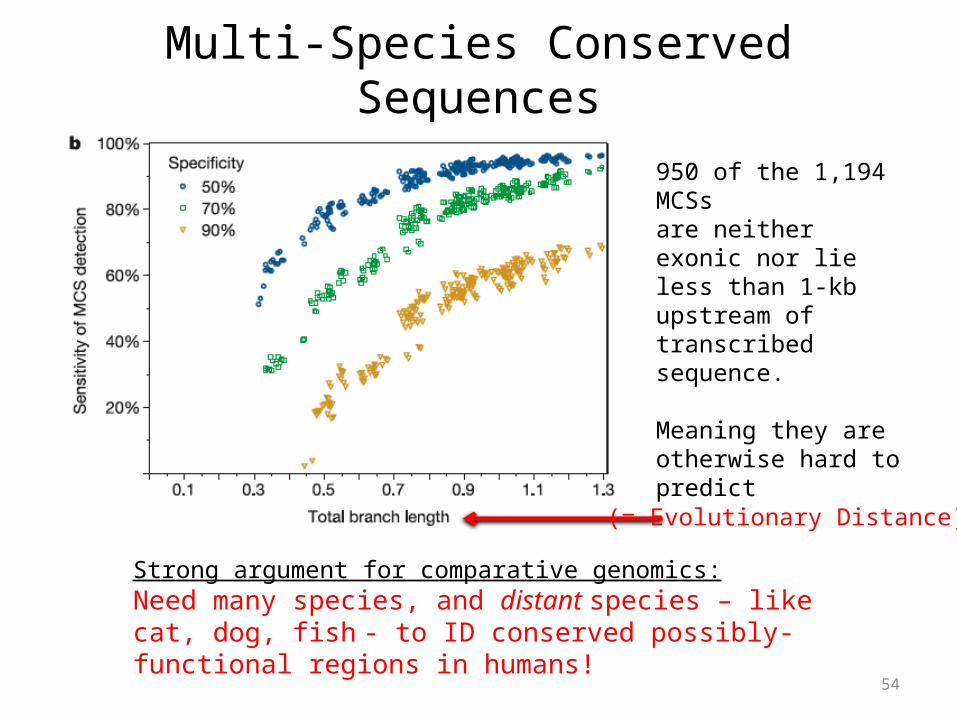
Multi-Species Conserved Sequences
54
Strong argument for comparative genomics:Need many species, and distant species – like cat, dog, fish - to ID conserved possibly-functional regions in humans!
950 of the 1,194 MCSs are neither exonic nor lie less than 1-kb upstream of transcribed sequence.
Meaning they are otherwise hard to predict
(= Evolutionary Distance)
55
Take Home Messages… • Identification of conserved non-coding segments beyond those previously
identified experimentally, and evidence we can find more with even more genomes!!!
• These were not detectable by pair-wise sequence comparisons alone– Underscores importance of comparative genomics
• Need many diverse species to figure out these questions!
• Analysis of TE insertions highlights variation in genome dynamics among species– The rate of TE evolutionary dynamics in vertebrates is amazing, and hugely important for
the structure and evolution of the genome
• Importance of large insertion-deletion (not necessarily nucleotide changes) between closely related species, including humans and primates
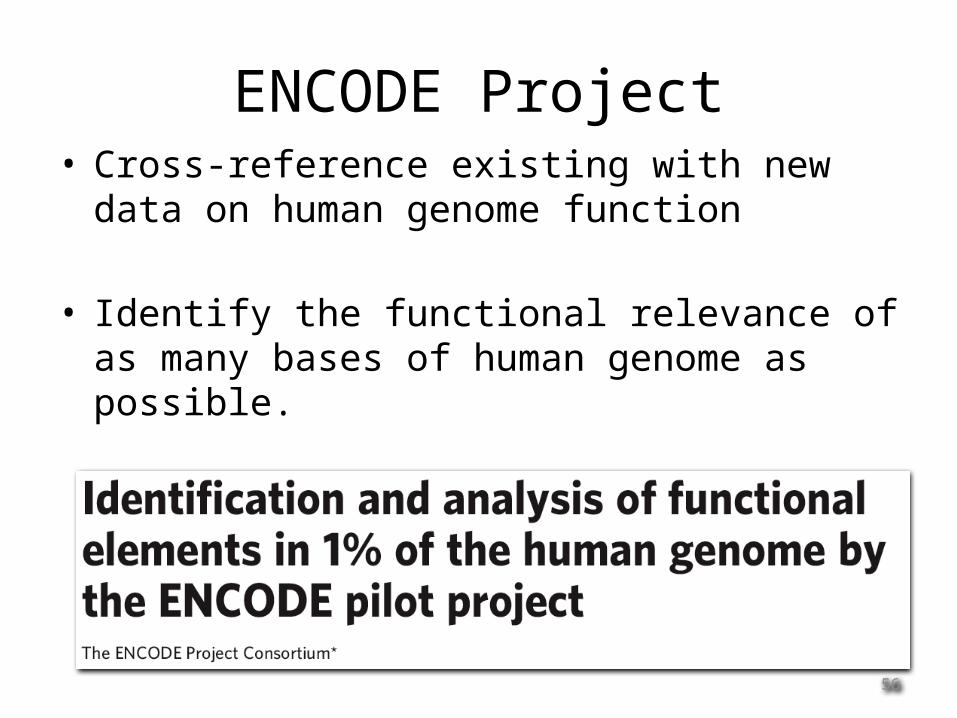
ENCODE Project• Cross-reference existing with new data on human
genome function
• Identify the functional relevance of as many bases of human genome as possible.
56
57
ENCODE Project Findings (2007)• A total of 5% of the bases in the genome can be confidently identified as
being under evolutionary constraint in mammals
• For ~60% of these conserved bases, evidence of function based on experimental assays
• However, not all bases within known functional regions are evolutionarily conserved
• Much of the variation, while functional, appears to be evolving under little selective constraint!– While functional, must not be important enough for “fitness” to be
highly conserved….
58
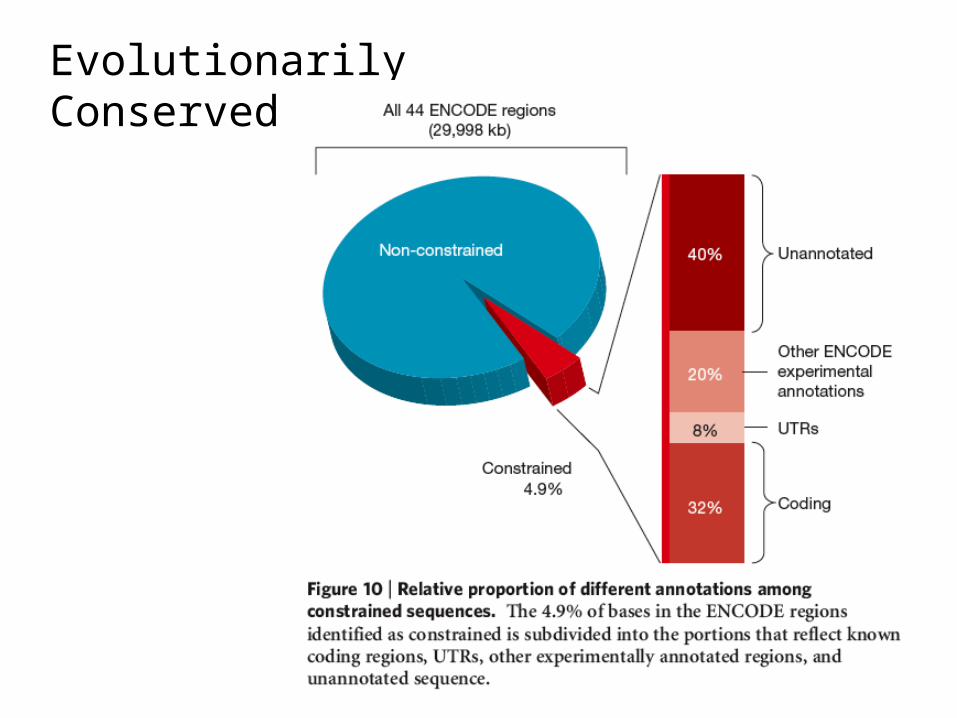
Evolutionarily Conserved Regions
Comparative Genomics
Where do babies come from? (ask your parents)Where do genes come from?
Evolution of Gene Families in Vertebrates
59
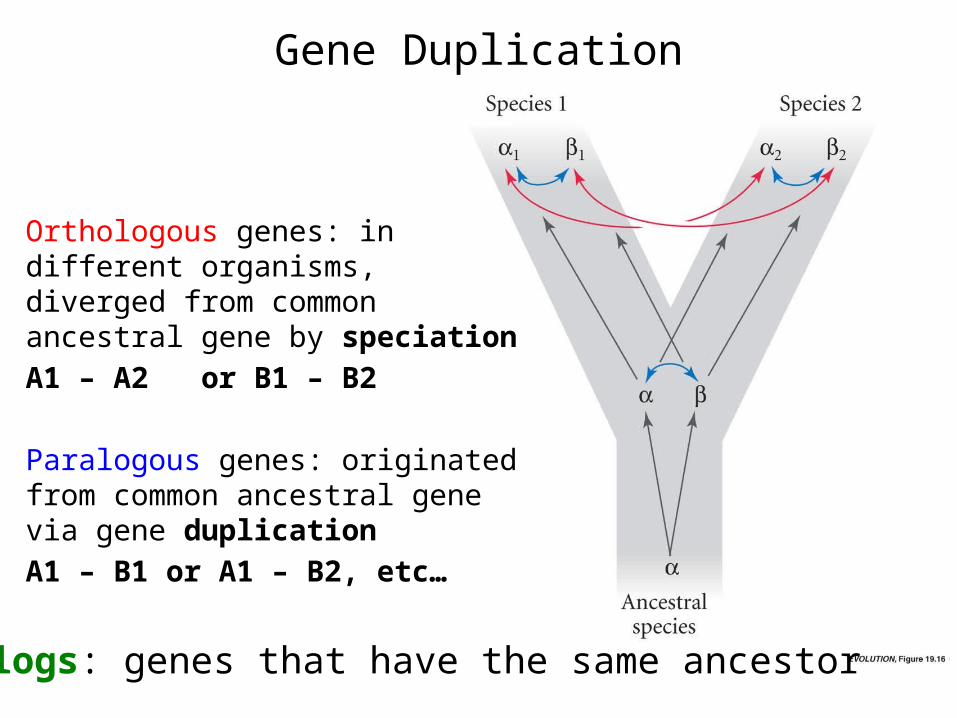
Gene Duplication
Orthologous genes: in different organisms, diverged from common ancestral gene by speciationA1 – A2 or B1 – B2
Paralogous genes: originated from common ancestral gene via gene duplicationA1 – B1 or A1 – B2, etc…
Homologs: genes that have the same ancestor
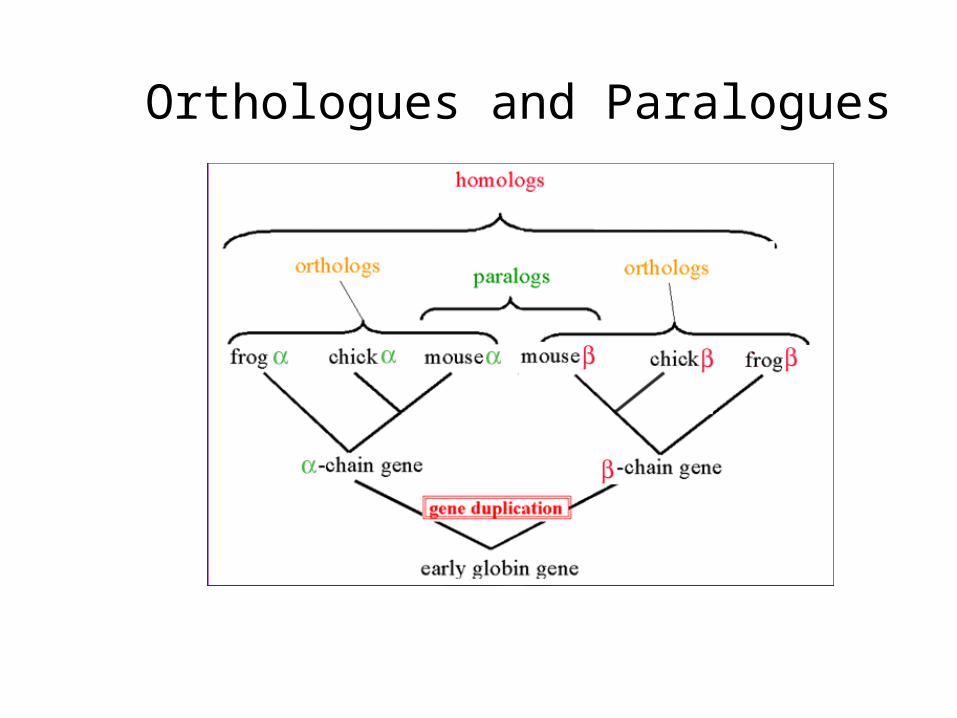
Orthologues and Paralogues
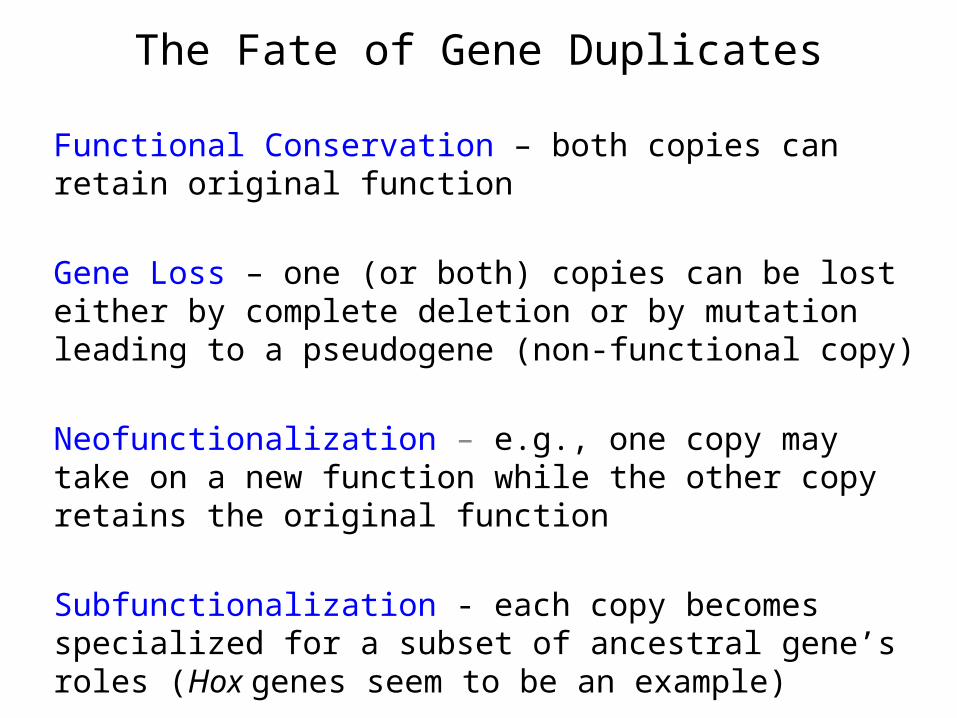
The Fate of Gene Duplicates
Functional Conservation – both copies can retain original function
Gene Loss – one (or both) copies can be lost either by complete deletion or by mutation leading to a pseudogene (non-functional copy)
Neofunctionalization – e.g., one copy may take on a new function while the other copy retains the original function
Subfunctionalization - each copy becomes specialized for a subset of ancestral gene’s roles (Hox genes seem to be an example)
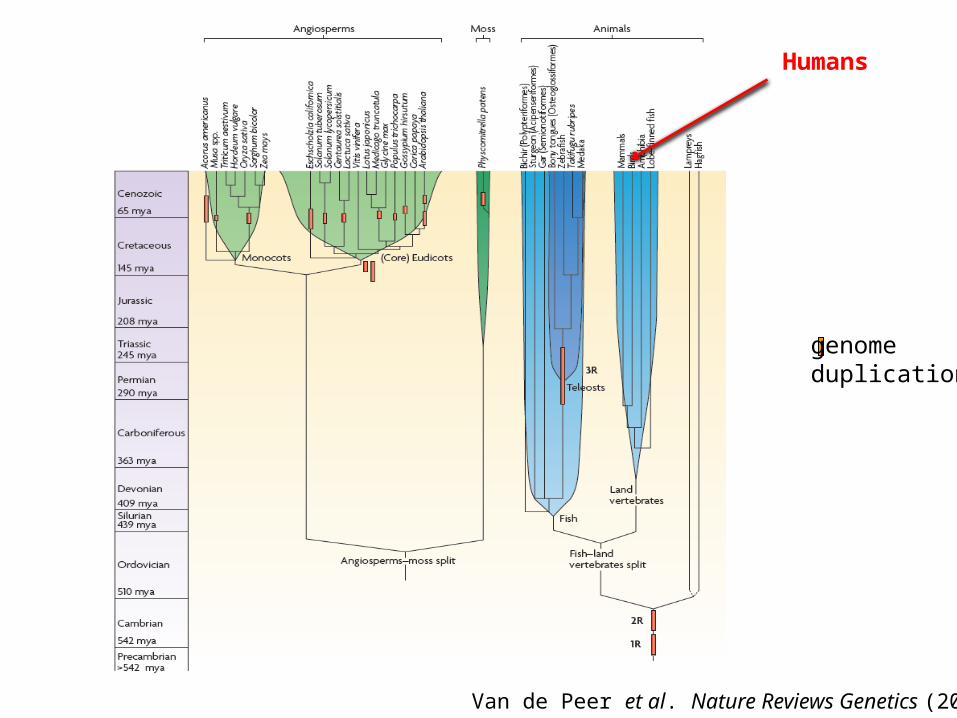
genomeduplication
Van de Peer et al. Nature Reviews Genetics (2009)
Humans

Gene Duplication
Most gene families are small; exceptions often have an adaptive basis: immunoglobulin genes (1000 copies in humans), olfactory receptor genes (100’s of copies in mammals)
65
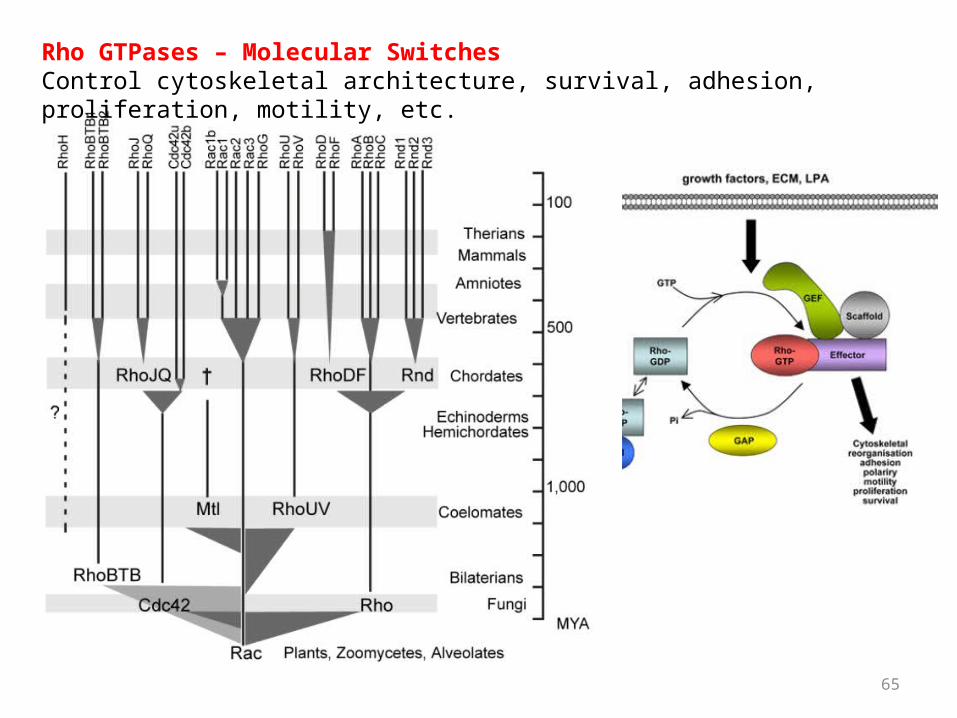
Rho GTPases – Molecular SwitchesControl cytoskeletal architecture, survival, adhesion, proliferation, motility, etc.
66
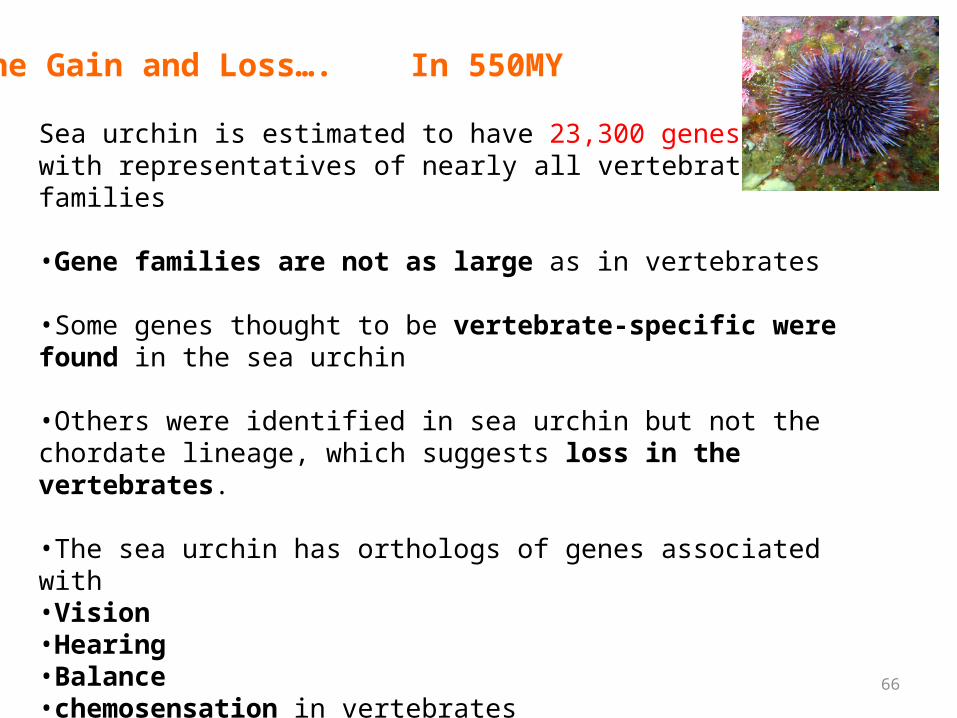
Gene Gain and Loss…. In 550MY
Sea urchin is estimated to have 23,300 genes with representatives of nearly all vertebrate gene families
•Gene families are not as large as in vertebrates
•Some genes thought to be vertebrate-specific were found in the sea urchin
•Others were identified in sea urchin but not the chordate lineage, which suggests loss in the vertebrates.
•The sea urchin has orthologs of genes associated with •Vision•Hearing•Balance•chemosensation in vertebrates
• raw material for current vertebrate complex sensory gene programs)..

67
Expansion of urchin-specific Rho GTPases
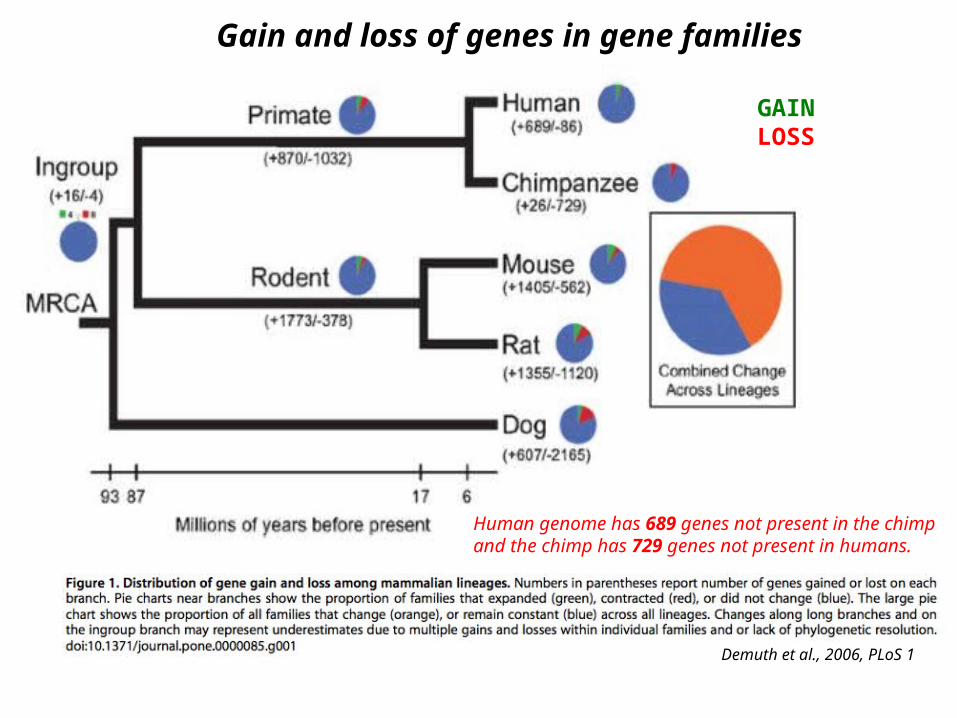
Gain and loss of genes in gene families
Demuth et al., 2006, PLoS 1
Human genome has 689 genes not present in the chimp and the chimp has 729 genes not present in humans.
GAINLOSS
69
Despite expansion-contraction of gene families, there is little novel gain or complete loss
Opossum genome… 180MY of change
• The opossum genome contains ~18,000–20,000 protein-coding genes, the vast majority have eutherian orthologues.
• Lineage-specific genes largely originate from expansion and rapid turnover in gene families involved in immunity, sensory perception and detoxification.
• Only eight currently have strong evidence of representing functional genes without homologues in humans!
70
Conclusions• Studying biology and medicine means studying
recycled genomic material
• Studying evolution informs genomics– Studying genomics informs evolution
• Knowing how genomes evolve can directly inform on how they function
• More genomes = more data points for studying how they change through evolution, thus how they function