comparative effects of two different physical education
TRANSCRIPT

South Dakota State University South Dakota State University
Open PRAIRIE: Open Public Research Access Institutional Open PRAIRIE: Open Public Research Access Institutional
Repository and Information Exchange Repository and Information Exchange
Electronic Theses and Dissertations
1957
Comparative Effects of Two Different Physical Education Comparative Effects of Two Different Physical Education
Programs Upon the Physical Fitness and Motor Educability of Programs Upon the Physical Fitness and Motor Educability of
Ninth and Tenth Grade Boys Ninth and Tenth Grade Boys
Charles Russell Reynolds
Follow this and additional works at: https://openprairie.sdstate.edu/etd
Recommended Citation Recommended Citation Reynolds, Charles Russell, "Comparative Effects of Two Different Physical Education Programs Upon the Physical Fitness and Motor Educability of Ninth and Tenth Grade Boys" (1957). Electronic Theses and Dissertations. 2407. https://openprairie.sdstate.edu/etd/2407
This Thesis - Open Access is brought to you for free and open access by Open PRAIRIE: Open Public Research Access Institutional Repository and Information Exchange. It has been accepted for inclusion in Electronic Theses and Dissertations by an authorized administrator of Open PRAIRIE: Open Public Research Access Institutional Repository and Information Exchange. For more information, please contact [email protected].

COMPARATIVE EFFECTS OF 'l'WO DIFFERENT PHYSICAL EDUCATION PROORAMS
UPON THE PHYSICAL FITNESS AND MOTOR EDUCABILITY
OF NIN'lH AND TENTH GRADE BOYS
By
Charles Russell Reynolds
A thesis submitted in partial fulfillment of the requirements for the
degree Master of Science at South Dakota State College of Agdculture
and Mechanic Arts
August,1957
~OUTH DAKOTA STA '. E CC;LLEGE LIBRARY

COMPARATIVE EFFECTS OF TWO DIFFERENT PHYSI CAL EDUCATION PROGRAMS
UPON THE PHYSICAL FITNESS AND MOTOR EDUCABILITY
OF NINTH AND TENTH GRADE BOYS
This thesis is approved as a creditable, independent investigation
by a candidate for the degree, Master of Science, and acceptable as
meeting the thesis requirements for this degree; but without implying
that the conclusions reached by the candidate are necessarily the
conclusions of the major department.
Thesis Adviser
HeacV°of the Major Department
4 ,
ii 1:ii I b r!!
•
ACKNOWLEDGEMENTS
The writer wishes to expr ess his appreciation to the individuals
who have given ot their time and thought in mald.ng t his study possible:
to the administration of Brookings Hi gh School for permi.ssion to conduct
this study; to Mr. Norman Johnson, Director of Pbysica1 Education, for
his assistance; to subjects used in this experiment for their cooperation;
to m:,- advisor, Dr. Campbell Snowberger, for his suggestions; and to
fellow graduate students for their help in testing.
,, C. R. R.
; . .,
.. ·
iii ..

CHAPTER
I.
II .
III.
IV.
v.
TABLE OF CONTENTS
'.lHE PROBLEM • • • . . . . . . . . . . . . . . . . . . . Introduction . . . . . . . . . . . . . . . . . . . . Statement of the Problem . . . . . . . . . . . . .
RELATED LITERATURE . . . . . . . . . . • • • . . . . . . Strength Testing • • . . . . . . . . . . . . . . . Motor Educability Testing . . . . . • • • . . . • . • • .
PROCEDURE . . . . . . . • . . . . . . . . . . . . 'lhe Sample . . . • • . . . . .
/ . . . • . . . . . . . . .
Collection of Data . . . . . . . . . . . . . . . The Physical Education Progr ams . . . . . . . . . . . . The Testers. . . . . . . . .
I . . . . . . . • . .
TREA ™ENT OF THE DATA • . . . . . . . . . . . . . . . . Analysis of Individual Results . . . . . . . . . . . . . Comparison of Range and Variability • . . . . . . . Comparison of Mean Gains . . . . . . . . . . . . . . . .
. . . . . . Statistical Signif'icance of Mean Gains
SID•.il'l.!ARY, CONCLUSIONS, AND IMPLICATIONS . . . . . . . . . . Summaxy of Results . . . . . . . . . . . . . . . . . . Conclusions. . . . . . . . . . . . . . . . . . . • . . . Implications
LI TERA '!URE CITED
. . . . . . . . . . . . . . . . . . . . . . . . . . . . . . . . . . . . . . . . . .
¥ ,
iv
.. J-:,
PAGE
1
1
6
7
11
17
19
19
21
34
36
38
38
40
41
42
45
46
46
46
48
LIST OF TABLES
TABLE PAGE
I . Raw Scores of Experimental and Control Groups i n Initial and Final Tests of Physical Fitness and Motor Educability . 39
II. Range of Scores of Experimental and Control Groups in Initial and Final Tests of Physical Fitness and Motor Eclucabili ty . . . . . . . . • • . . • • . . . . . . .
I II . Standard Deviations of Exper:ilnental and Control Groups in Initial and Final Tests of Physical Fitness and
. . . 40
Motor Educability • • • • • • • • • • • • • • • • • • • • • 41
J.V. Significance of Nean Gains of Experimental and Cont r ol Groups in Physical Fitness I ndex ••• • •••••• 44
V. Significance of Mean Gains of Experimental and Control Groups in Moto·r Educability • • • • • • • • • • • • • • • • 44
V

LIST OF FIGURE.5
FIGURE
1. Height and Weight. . . . . . . . . . . . . . 2 . Grip Strength Test . . . . . . . . . . . . . . . . . . . . 3. Back Lift Test . . . . . . . . . . . . . . . . . . . . . 4. Leg Li.ft Test . . . . . . . . . . . . . 5. Push- Up Test . . . . . . . . . . . . . . . . . . . . . 6. Lung Capacity Test . . . . . . . . . . . . . . . . . . 1. Pull-Up Test . . . . . . . . . . . . . . . . . . . . . 8. Metheny Simplified Mat
/ . . . . . . . . . . . . . . . .
9. Means of Both Groups in P.nysical Fitness Index And Motor
PAGE
22
23
25
27
28
29
31
32
Educability Before and After Exer cise • • • • • • • • • • 43
; ..
vi

CHAPTER I
THE PROBLEM
Introduction
According to Cu.reton1, a physically fit person is one who has the
ability to participate in strenuous activities over l ong periods of time.
Physical fitness involves such factors as heredity, good health, good
hygienic habits, adequate amount of strength and endurance, and the
correction of remedial defects. A physically fit person, therefore, is
one who is free 1)-om handicapping infection, disease, or defects; is
proper~ nourished; practices wholesome mental hygiene; and possesses
sufficient strength, endurance, skill, and knowledge to perform success
fully t he services required in wholesome physical activity.
Physical fitness is considered as one component of total fitness .
It does not include all of the aspects of emotional fitness, mental fitness,
·or social fitness, which are other components of the l arger tenn, total
fitness . In emotional fitness the power of thought is paramount- -solving
problems, rationalizing, making choices, memorizing and computing. In
social :fitness adaptability to the group and to particular :friends is
important. -Physical fitness is related to these other phases of fitness
in addit ion to being important for itself. A high quality in all com
ponents of total. fitness is desired for all of our people.
1T. K. Cureton, ~sical Fit ness APpraisaJ. ~ Guidance, (St. Louis: C. V. Hesby Company, 1947 , P• 18.
The Joint Committee of the American Medical Association and the
American Association for Health, Physical Education and Recreation has
defined a physically fit per son as one having" ••• e nough strength,
speed, agility, endurance, and slcill to accomplish the maximwn tasks
that t he day may bring. u2
2
The Unit ed States Office of Education3 r eports t hat without
vigorous physical activity in the developmental period of youth, optimum
body functioning is impossible. Physical activity is the only known
means for developing the ability to engage in activities demanding sus
tained effort. Due to differences among individuals there is no one way
in which all persons can develop the same degr ees of s trength, endurance
and skill.
During r ecent years t here has been a growing conviction among
physical. educators that a high degree of physical £itness is essential.
for all people in our land. This conviction has been brought about by
several t hings . The first of these is t hat o~r country learned with
amazement that a high percentage of the men examined for military service
dur ing World War I were rejected because they were not physical.ly fit .4
2John Coe.field and Robert Mccollum, 11A Case Study o;f 78 Freshman with Low Physical Fitnes s Indices, 11 (microcarded M. S. t hesis, University of Oregon, 1955), P• 1 •
.3united States O.f'.fice of Education, Physical Fitness ~ Students in Colleges and Universities, (Washington : U .s. Government Printing Office, 1943) , p . 62:-
4sarah Reidman, The Physiology 2f ~~Play, ( New York: The Dryden Press, 1950) , p.~o.

3
Little did people realize that many of these rejections could not be im
proved upon by physical education as many were from orthopedic, sensor,,
and other disabilities. A low quality 0£ physical i"itness was only a
minor part. Yet, this same criticism came with World War II and the
Korean War with statements from combat leaders attesting the fact. that
many lives had been lost s~ly because troops were not in proper condi
tion for their duties.
The matter of being physically fit is not just that of bniJding
Imlscles. Al though strengthening exercises are a ver:,. :i.n4)ortant part of
a developmental program, the results attained for the individual go
beyond this more apparent phase of the process. Along with increasing
strength accrue such other benefits as increased organic vigor, stamina,
poise, and an improved mental outlook. Many investigations during the
past twenty- five years have substantiated these assumptions. Thus, one
of the physical educator's prime duties is to increase his pupils'
muscular· strength, which is basic to all other growth and development .
In John Locke's "Some Thoughts Concerning Education," the .follow
ing statement is made by that great educator: "A sound mind in a sound
body is a short but full description of a happy- state in this world. He
that has these two has little else to wish for; and he that wants either
of them w.i.ll be but little better for anything else." Aristotle, also,
maintained that education must count on the sound physique of the educand.5
%obert Ulich, History ~ Educational. Thought, ( New York: American Book Company, 1950), P• 37.
•
4
The importance of. physical fitness was brought into focus recently
by the announcement of the results of the Kraus-Weber6 Tests administered
to 3,000 European children and over 4,000 American youth. All tests were
administered by the authors themselves and were completely standardized.
The findings indicated that fifty- seven per cent of the United States
youngsters tested failed one or more of the six tests :for muscular strength
and :flexibility, while only 8. 7 per cent of the European youngsters failed •.
It also showed that 44.3 per cent of the United States yo'Wlgsters failed
the one fiexibUity test, while o~ 7.8 per cent o:r the European young
sters failed. It also demonstrated that 35. 7 per cent of the United States
children failed one or more of the five strength tests, while only 1.1. ,,
per cent of the European youngsters failed.
As a direct result of this report, the President of the United
States, on June 18, 1956, called a conference on the fitness of American • -<
Youth held at the White House in Washington, D. C. This occasion was a
definite ·milestone in the history of physical. education in the United
States for two reasons; first, it amplified the importance of the problem,
and secondly, it was the first peacetime conference on physical. fitness
to be held.
The need for this conference can best be summarized. by quoting
parts of Vice-President Nixon ' s Keynote address.
We are not a nation of so~ies but we could become one 1.f proper precautions are not taken to provide the nonnal opportunity for physical health giving exercise .
The objective of an adequate physical f'itness program
6Hans Kraus and Ruth Hirschland, "Minimum Muscular Fitness Tests in Children," Research Quarterly, X'J:tl, May, 1954., PP • 178-186.

can be summed up 1n one word---participation. The superathlete i s not our primary concern; it is the boy or girl with ordinary physical abilities . Less than fifty per cent of t he boys and girls in our high schools have physical. education. Ninety-one per cent of the nation's 150, 000 elementary schools have no gymnasium. Forty per cent of those person's entering the armed forces in World War II were unable to swim as far as fifty feet .7
Objectives of physical education have been stated by many writers
in the field of physical education. A majority of these writ ers list
physical fitness, either directly, or indirectly, as one of the objectives
of physical education. However, in order to obtain evidence to sub
stantiate the realization of these objectives, one is confronted with a
great deal of superficial discussion in an effort to estimate values of
regular participation in a physical education program.
Staley has pointed out • •• "that in reviewing the literature
of physical education we find a vast array of statements or assumptions
that this program does contribute to pr oducing many desirable results. • •
yet when we look for the supporting evidence we find that it is singularl y
l.illlited, if not entirely lacki.ng. 118
This fact is also e:xpressed by Cureton in a l.etter to Major Thulin
. . . "there is no professional. field so badly 1n need of scientific
inf orrr.ation to show the effects produced by programs . Most of the
research is indirect at best and typified for restricted conditions
7American Association of Health, Physical Education, and Recreation, "Fitness of American Youth," Journal~ Health, Physical Education, and Recreation, XXVll, September, 1956, PP• 8- 9•
8s. c. Staley, "PhysicaJ. Education and Research," Physical Educator, IX, October, .1952, P• 73. •
' 6
in laboratories or limited to animal experiments, llherein the animals
lack the motivation, the training, and the heredi tal"Y background of
humans . 119
There is however, some published evidence which shows the desir
able effects of participation in regular programs o:£ physical training
and conditioning •10, 11 The evidence points to increases in muscular
strength, endurance, and organic efficiency.
Statement of the Problem - ---- -----The purpose of this study was to investigate changes i.n the
physical fitness, as measured by the Roger' s PhysicaJ. Fitness Index,
and the motor educability, as measured by the Johnson- Metheny Test,
of twenty-five ninth and tenth grade boys who were under two ditf erent
types of physical education programs for a period of ten weeks.
9nouglas H. Whittle, "Effects of El.ementary School Physical Education Upon Some Aspects of Physical, Motor, and Personality Development of Boys Twelve years of Age," (microcarded Ph. D. dissertation, University of Oregon, 1956), p. 2.
l OG. T. Adamson, "Effect of Systematic Overload on the Strength, Physical Fitness, and Physical Efficiency of Schoolboys," Journal of Physical Education, XLIV, November, 1952, PP• 109-112.
11John Coefield and Robert :tv'.1.eCollwn, "A Case Study of 78 Freshman with Low Physical Fitness Indices," (microcarded M. S . thesis, University o! Oregon, 1955).
-

7
CHAPTER II
RELATED LITERATURE
Strength Testing:
Rogers surmnarizes the opinion of physical educators and physio
l ogists when he writes concerning the necessity of strength in the bu.man
body.
The positive and very high relation of muscul ar strength to general health, physical fitness , or capacity for activity can hardly be questioned. With no strength there can be no physical activity; moreover, when muscular st rength is low, all other life functions are handicapped. One can hardly see as much, ,hear as much, meet a s many people, or contribute as much to social life when one is continually fatigued by the most necessary activities of life--eating, digestion, attention to environment, and t he physical movements incident upon travel from one gr oup of surroundings to another. The r elation of organic conditions is just beginning to be recognized; but experiences are multiplied which r eveal beyond per adventure, the truth of the following rule: "Practically every change in the condition or functi oning of the vital organs has a correspondingJhange in the condition or functioning of voluntary nniscle.
A review of the history of strength- testing r eveals the fact that
measures of strength have been employed to meet many divergent needs .
Clarke13 made a comparative analysis of a group of commonly used
objective strength tests and found from the results of the study that
there is a significant relationship between muscular strength and general.
motor ability, and that muscular strength is a major component of
physical fitness·. The correlation of muscular strength with general
12F. R. Rogers, "The Significance "of Strength Test s in Revealing Physical Condition, 11 Research Quarterly, V, October, 1934, pp . 43-46.
13if. Harrison Clarke, "Objective Strength Tests of Ai'fected Nuscle Groups Involved in Orthopedic Disabilities," Research Quarterly, XIX, May, 1948, pp . 118-J.47.

. .
8
motor ability is from . 85 to .90. In instances where a physical. fitness
criterion of 1.ong, hard, sustained muscular work and endurance is used,
muscuJ.ar strength tests are always significant. McCloy14 points out
that strength testing has two :unportant uses in physical education and
athletics; first, as an index of health or general physical. condition,
and, second, as a predictor of potential motor ability.
Strength-testing started in 1888 when Dudley A. Sargentl5 developed
a battery of tests designed to predict athletic ability-. This test.,
called the Intercollegiate Strength Test, consisting of ten items, was
used extensively in the early 19001 s but l~st prominence during the First
World War. In ).925 Frederick Rand Rogers16 revised the test., and de
veloped nonn tables for their intelligent use and interpretation. In
1931 McClor7 refined these computations and started investigations
concerned with va.1idating these tests to specliic needs.
Throughout the history of strength-testing there has been concern
as to what part of the body should be measured to get a true picture of
total body strength. There is no standardization in the measurement of
muscle groups between the majority of strength tasts. Wendler conducted
an analytical study of strength tests and made the following conclusions:
14c. H. McCloy, 11 The Apparent Importance of Arm Strength in · Athletics," Research Quarterly, V, March, 193h, PP• 183-198 •
15oudley A. Sargent., "Intercollegiate Strength Tests, 11 American Physical Education Rev:i.ew, II, December, l.897, p. 216.
l.6F. R. Rogers, "Physical Capacity Tests in the Administration of Physical Education," Contributions ~ Education, CLXXJ:ll, 1925, P • 214.
l7c. H. McCloy, "A New Method of Scoring Chiruung aDd Dipping," Research Quarterl:,::, IT, .December., 1931~ PP• 3-10.

9
1. 'I.he sum of the strengths of f our muscle groups--the thigh flexors, the l eg eA-tensors, the arm flexors, and the pector alis major--gives a highly reliable prediction of total strength of men.
2. '.Ihe deltoids and hand flexor s , plus the four groups for men, when properly c ombined, w.ill predict total strength of women 1dth appr oximately the same degr ee of r eliabilit y as the men I s battery does for men.
3. The above bat t6ries are almost as valuable for the prediction of t otal strength as the entire Intercollegiate St r ength Test and have the added advantage of requiring no expensive apparatus.18
Nwnerous studies have been made relating the effects of various
types of physical education pr ograms to the physical fitness and strength
of high school boys. G. T. Adamson19 conducted an experiment with a /
smalJ.. m.unber of boys-age 1h to 15 years-in secondary school. There were
two balanced groups of twelve boys in each section. Each group had three
physical education periods per week. The test group had an additional
overload program amounting to thirty minutes per week for one month.
Tne McCloy Athletic Str ength and Physical Effi ciency indices and the
Harvard five-minute step test were administered at the beginning and end
of the four-week period. The 'test group showed sta'tistically- signi..fi cant
gains over the control group in this study.
18Arthur Wendler, "An Analytical Study of Strength Tests Using the Universal Dynamometer, 11 Research Quarterly, VI, Supplement October, 1935, PP • 81-85.
19G. T. Adamson, 11E£fect of Systematic Overload on the St rength, Physical Fitness, and Physical E.f'ficiency of Schoolboys," Journal £! Physical Education, XLIV, November, 1952, PP• 109-112 • .

lO
Emil Rath20 used ninth grads boys to study effects of different
physical education programs on McCloys Strength Test, and confirms the
findings of Adamson. Rath used such skill measures as: basketball throw
for distance, j~ and reach, bar snap for distance, and the dodging run.
There were five high schools in the study. Each of four high schools had
a control group; three had a basic control group; and all had a test or
experimental group. The test gr oup followed a defi..'1.i te program. consist
ing of (1) a time run and variations; (2) rhythmic conditi oning exercises;
(3) basic events; and (4) game fundamentals . The control group varied from
school to school with no definite program. The basic control received. no
physical education but participated in military activities only-. The
conclusions verify a gener~ accepted fact - namely that the quantity
and kind of activities comprising a program determines its value for
physical development; and secondly, a program pl anned to do so can pro
duce a strong effici ent body. In general, Rath claims that greater
physical development seems to ~ve been achieved by the program used by
the test groups than by those in vogue in the individual. high schools
used by the control groups.
Kistler21 reported an experiment on the results of participation
of university men in an eight-weeks physical fitness progr am. The pur
pose of the study was to measure the amount of improvement which was
2~ mil Rath, "A Study of the Effects of Di.f.ferent Pnysical Education Programs on Strength Index of 9th Grade Boys," Re s earch Quarterly, XIII , June, 1942, PP• 169-177.
21J. w. Kist ler, 11A Study of the Results of 8 Weeks of Participation in a University Physical Fitness Program for Men," Research Quarterly, XV, March, 1944, PP • 23-28.
11
achieved in a program designed primarily to improve strength, endurance,
and agility - three elements of physical fitness. A battery of five tests
was used to measure the improvement of the 1,650 subjects. '.lhe five tests
consisted of the following: a five minute run for distance, an obstacle
course run for t:iJlle, a push-up test, a chinning test, and a sit-up test.
The percentage of subjects who improved ranged from .36 per cent in the
five minute run to 74 per cent in the push-up test . A surprising nu.-nber
of subjects retrogressed in their abilities during the training period.
The range of r etrogression was from 15 per cent in the chinning test to
21 per cent in the obstacle course run. In addition to those who retro
gressed in their.performance there was a considerable number of subjects
in which no change in performance was reported. T'ne range for this group
in which there was no change in performance was from 7 per cent in the
sit-~p test to 47 per cent in the five minute run. Of the total number of
subjects, 9.8 per cent improved in all five measures; 27 per cent :improved
in four measures; and 33 per cent improved in three measures . Kistler
concluded that the findings seemed to justify the statement that improv
ment may be achieved in physical fitness elements of strength, endurance,
and agility through a specific tra:ining program devoted to these elements.
Strength Testing:
Wendler's Total Strength Ind.ex:22 Wendler constructed a strength
index to evaluate a large battery of strength tests to determine for each
sex the muscle groups that are most valuable in predicting total strength.
The instrument used to measure f orty-seve~ different muscle groups was the
22viendler, loc. ill·

12
universal dynamometer. The criterion of strength was the sum of these
forty-seven strength measures. From this Wendler devised a short battery
which gave a high correlation with the original. forty-seven tests . This
short battery included; (1) the thigh extensors; (2) the leg extensors;
(3) the pectoralis major; (4) the arm flexors; (5) the anterior trunk
eA-tensors; and (6) the foot extensors. The short battery seemed to be the
most useful, but slightly less accurate. There are no norms for this test. ·
Clarke Strength ~:23 The Clarke Strength Test uses the tensio
meter for measuring the strength of muscle groups. Measurement can be
made from 5 to 300 pounds. The proper position of the joint for the
application of p~g force is specified for each test in the strength
measurement sequence. This adjustment tends to eliminate any compensatory
action of muscles. St rength tests can be given at many of the joints of
the body. Test reliabilities are hiP-.)1 by this method; however, there are .,
no norms available for this test.
Mac Curdy Strength ~: 2_4 MacCurdy devised a strength test
based on the formula: Power .,. Force X Velocity. He measured the force
by the strength of the legs, back, and arms, and the velocity by the
vertical jump. The Physical Capacity Index is then calculated by: The
Total Force (Sum of Strength Tests) X Vertical Jump divided by 100. T'ne
reliability of the index is high ( .93) . The correlation between the
23a . Harrison Clarke, "Improvement of Objective Strength Tests of Yruscle Groups by Cable-Tension Methods, 11 Research Quarterly, XXI, December, 1950, pp . 399-419 . .
2li:r,. A. Larson and R. D. Yocom, Mea-sur ement and Evaluation in Ph~sical, Health, and Recreat,ion Education, (St . Louis: C. V. MosbyCo., l9 l), PP• 84-85. -

13
Physical Capacity Score with Athletic Achievement is also .93. Norms are
not available for administration of this test to high school boys.
NcCloy 1s Strength Test:25 McCloy devised a new method of scoring
chinning and dipping which simplif'ied the computation of actual strength
from the munber of chins or dips and body weight. Wei ghts were added t o
the subject until chinning or dipping became an impossibility. Total
strength was then equal to the in.di vidual weight plus the maximwn weight
that would allow for only one chin or dip . This test seems somewhat
impractical.
Roger 's Strength Index (S. I.) and Physical Fitness Index (P.F.I.) : 26
This test consists of height and weight and seven tests: (1) lung capac
ity, (2) back strength, (3) leg strength, (4 and 5) right and left grip
strength, and (6 and 7) pull ups and push ups. The scores made by the
subject in each test are summed in order to get the· Strength Index (S.I.),
and the Physical Fitness Index (P. F .I. ) quotient may then be obtained by
dividing the achieved strength index by the normal. strength index for the
age and weight in question. 'lhe Strength Index (S.I.) indicates the
strength of the large voluntary muscles of the body-. It is used to
measure general athletic ability and to classify individuals into homo
geneous groups for team competiti on. The Physical Fitness Index (P.F .I. )
is frequently used to schedule ~ viduaJ.s into physical education classes
in accordance with their fitness for activity. It is also used to measure
25c. H. McCloy, 11A New Method of Scoring, Chinning and Dipping," Research Quarterly, IT, December, 1931, p •• e5.
26ii. Harrison Clarke, Auolication of Measurement to Health and Physical Education, (New York: Prentice-Hall, Inc., 2d. ed. 1950) , -PP• 155-J.68 .
2 1995 4 ff.j h>!S SOUTH DAKOTA STATE COLLEGE LIBRARY
14
physical fitness changes r esulting from activity. This test has a
validity of . 95. The basis for validation of the Roger ' s Physical Fit
ness Index consisted of a criterion measure of athletic ability which
incl uded the 100 yard dash, running broad jUlllp, running high jwnp, and
the standing bar vault. The Roger' s Physical Fitness Test was used in
the present investigation because of its popularity, because it has norms,
and because of the availability of equipment.
A critical analysis of this test by McCloy-27 demonstrates that the
arm strength formula accounts for about ninety per cent .of the test as a
measure of athletic ability. This arm strength is dynamic strength,
which is a more significant index of motor ability than static strength.
McCloy continues as follows:
In case the arms are well developed as to strength, the back and legs are usually aJ.so well developed. The individual develops his legs doing activities ~hich use the other muscles. The reverse however, is not necessarily true; for individuals who engage in running or jumping programs do not necessarily dev~lop the ams. The correlation between chinning strength alone and all the rest of the
8boey in a study in 'Which this
comparison was made was .91.2
Several other experiments have been conducted in the past that
have helped to make strength testing more val.id at the present time.
Carpenter29 found that the amount of strength registered by the leg lift
test is detennined to a large degree by the angle of pull.
27 c. H. Mc Cloy, "The Apparent Importance of Arm Strength in Athletics, n Research Quarterly, V, VJ.arch, 1934, PP• 183-198.
28Ibid, P• 193.
29A. Caroenter, "A Study of Angles in the Measurement of Leg Lift, 11
Research Quarterly, IX, October, 1938, PP• 70-72. .
;

15
Hunsiclcer30 found a significant correlation ( .58) between the rate of
chins and chinning strength . P0t-1eu31 states that t he push-ups and
pull-ups involve a considerable amount of skill and endurance as well as
strength. Martin and Rich32 indicated that where two individuals of equal
we i ght differ widely in muscular strength, it is due to at least four
.factors, namely: (1) actual amount of muscle tissue; (2) bodilzy' con
figuration; (3) muscle quality; and (4) muscle innervation.
Motor Educability Testing:
Two major developments in the history of motor educability testing
are worthy of note. The first of these was the discovery of the high
relationship ( .135 to .90) of muscular strength with motor performance.33
The second development was that of introducing scientific methods
of test constructi on into physical education. The works of Rogers,34
Brace,35 and CozensJ6 have served as a guide for the modern
30paul Hunsicker, n A Mechanical Analysis of Chinning, 11 ( un-published M. S. thesis, Springfield College, Springfield, Massachusetts, 1941) •
.31Elizabeth Powell, "The Present Status of Physical Indices," Research Quarterly, n , May, 1940, PP• 3-17.
32E. G. Martin and W. H. Rich, "Muscular Strength and Symmetry in Human Beings," American Journal .£f. Physiology, XLVII, 1918, PP • 20- 42 .
33F . R. Rogers, "Physical Capacity. Tests in the Administration of Pnysical Education, 11 Contributions 12, Education, CLXXIII, 1925.
34Ibid.
35n. K. Brace , Measuring ~ Ability, (New York: A. s. Barnes and Co., 1927) .
~. W. Cozens, The Heasur~ of General Athletic Ability~ College Men, (Eugene: University of Oregon Press, 1929) .

16
work of test construction in this area.
Larson and Yocom37 state that researchers interested in the
fundamental motor skills and their measurement and development must also
be concerned with the rate of l earning fundamental. skills (motor educability)
and the 1:iJnits of development of the skills (motor capacity). McCloy38 has
made an analysis of the constituents of motor educability and has in-
cluded the prerequisites for effective learning of motor skills to be the
following: nruscular strength, dynamic energy, agility, nex:i.bility,
peripheral vision, concentration, understanding of the mechanics of the
activity, and absence of disturbing complications.
The factors of fundamental motor ability are of two kinds:39
first, t hose factors that constitute the ability and, second, those factors
that aid or hinder performance of the ability.
The factors which constitute the ability are elements of motor
ability such as accuracy, agility, and coo:rdir.ation, and the fundamental
skills of ·motor ability such a~ running, jumping, and throwing.
T'ne factors which aid or hinder motor performances are such factors
as age, weight, height, and body build. These are some of the factors
which nru.st be considered when interpreting the results of motor perform
ances and must also be considered when norms are prepared. At the present
tiJne tests are not avai1able which correct all o! these various influences .
37L. A. Larson and R. D. Yocom, Measurement and Evaluation in Ph~sical, Health, ~ Recreation Education, (St. Louis: C. V. MosbyCo., 19 1), p . 188.
38c. H. McCloy, "A Preliminary Study of Factors in Motor Educability," Research Quarterly, XI, May, 1940, PP• 28-39.
·39 Larson and Yocom, ~- ill•, P• l.87 • •

17
The motor educability t ests represent a pioneer development in
the field of motor ability testing. Research has been done 1n motor learn
ing but a majority of it has been done with small Druscle sld.lls which do
not have a great relationship to physical education sld.lls. Morehouse40
has combined a knowledge of psychology and motor learning, and has
listed six objectives which will serve the individual in the mastery of
motor skills, and in the process of learning. These are: (1) improve
ment of timing; (2) reduction of extra useless movements; (3) a.djust.ment
of movements so that forces are applied directly; (4) muscle teamwork or
relaxation of non-working muscles during performance; (5) proper pacing
or distribution of effort; and (6) resolving of as many movements as
possible to a reflex level.
Types 2f Motor Educability Tests:
T'ne Brace Test :41 The Brace Test consists of twenty stunts,
graduated from shlple to the more c~lex. It is scored on a success
or failure basis with the total: successes constit-..iting the score. The
elements which seem to be measured in this test are: balance, coordina
tion, cont rol, agility, accuracy., and steadiness.
The Iowa Brace Test:42 McCloy has done considerable research -------in the stunt type tests and has used the Brace test as the foundation
for his research. He reduced the number of items in the Brace Test
4<>r,. E. Morehouse, "Recent Studies in Learning Factors of Motor Skills," Journal of Health, Ph~ical Education, and Recreation, XIV, January- February, 1948, PP • 57 O. -
41n. K. Brace., Measuring Motor Ability, (New York: A. S. Barnes and Co., 1927).
42c. H. McCloy, "An Analytical. Study of the Stunt Type Test as a Measure of Motor Educability.," Researc1"t Quarterlz, VIII, October, l937,
. pp. 46-55.

18
from twenty to ten. The ten arc divided into two batteries of five each.
The selected tests vary for each group of girls and boys of the elementary,
junior, and senior high school grades.
The Johnson ~:43 In 1932, Granville B. Johnson proposed a
simple test as a measure of native neuromuscular skill with the purpose
of sectioning students into homogeneous groups for instruction. This
test consisted of ten test items Which are as follows: straddle ju.mp,
stagger skip, stagger jump, forward skip, holding opposite foot from
behind, forward rolls, half turns right or le.ft, backward rolls, hall
turns right and le.rt, ..front and back roll conbination, and full turns
jumping . The test requires a canvas mat covered with a painted pattern
of lines and squares. Johnson also stated that the test has a reliabil
ity of . 97 and a validity of .69, although he did not state against
what criterion it was validated.
In 1935, Barton44 experimented with this test and with other
similar items on junior high school girls and concl.uded that the Johnson
type test was more accurate than the Brace45 type 0£ test £or measuring
motor educability, but that it required more time for administration. In
1936, Roads46 reported a s:iJTlil.ar conclusion for senior high school girls .
43a. B. Johnson, "Physical Skill Tests for Sectioning Classes in Homogeneous Units, 11 Research Quarterly, III, March, 1932, pp . 128-136.
~ertrude Barton, 11A Comparative Study of the Brace Type of Test and the Johnson Type of Test as Measures of Motor Educability in the Junior High School Girl, 11 (unpublished M.S. thesis, State University of Iowa, 1935) .
45Brace, loc. ~•
46iJ. M. Roads, "A Comparative Study of the Brace- Type of Test, and the Johnson-Type of Test as Measures of Motor Educability in the Senior High School Girl as Shown by Two Selected Criter:ia, " (unpublished M.S. thesis, State University of Iowa, 1936).
19
In 1937, Koob47 , using as his criterion of motor educability the number
of trials required for junior high school boys to learn a series of ten
tumbling stunts, found a correlation of . 97 between the Johnson test
and motor educability, and a correlation of .81 between the Johnson test
and the scores made on three track and field events. The results of
these three experimenters led to the conclusion that it was a good test
of motor educability, but that it would never attain the widespread
use it deserved because it required so long to administer.
The above conclusion prompted Eleanor Metheny-48 . to analyze the
items of the Johnson test and try to devise some method for reducing
the time required to administer the test. In this research, the test
was reduced to a battery of four items without loss of validity ( .97
correlation with the ten original Johnson test items). 11etheey found
that the difference in results between the two tests was not great enough .,
to justify the use of the additional six items included in the original
Johnson test. She therefore suggested the use of the following four
test items performed on a modified mat pattern: front roll, back roll,
jumping half turns, and jumping full turns for boys; and front roll,
back roll, and jumping half turns for girls.
This condensed form of the Johnson test was used as a measuring
instrument of motor educability in the present study because of its ·
ease of administration, its vaJ idity ( .69), and its reliability ( .97).
47 c. G. Koob, "A Study of the Johnson Skills Test as a Heasu.re of Motor Educability," (unpublished M.S. thesis, State University of Iowa , 1937). •
4~leanor Metheny, "Studies in the Johnson Test of Motor Educability," Research Quarterly, IX, December, 1938, PP• 105-11.4 •
•

20
CHAPTER III
PROCEDURE
Th!:, Sample
The sample consisted of twenty-five ninth and tenth grade boys
enrolled in the required physical education cl.asses at Brookings High
School during the 1956-1957 school year. The control group consisted
of thirteen boys, while the e;<per:ur.ental group contained twelve boys.
The two groups were chosen on the basis of the results of the
Roger's Physical Fitness Test administered prior to the beginning of
the program. A total of 67 boys were tested initial.ly, thirty- eight
in the class from which the experimental group was taken and twenty
nine in the class from which the control group was chosen. All
subjects obtaining a score below ninety in the test were chosen for
this investigation, and were further required to take the Johnson
Metheey Test. 'lhe results of this test indicated that eighteen from
the experimental class had received a score of bel ow ninety, and
thirteen from the control class had obtained a score of below ninety.
Of the original eighteen boys in the experimental group, two
IllOVed away, two others were dropped from physical education classes;
one was ill for three weeks, and one boy injured his hand in an accident.
The above six cases were elilllinated :from the study in order to
increase the reliability of the results. This lef't a total of twelve
boys in the experimental group and thirteen boys in the control group.
A comparison between the two groups of pupils indicated that
the mean age 0£ the experimental group was l .5 . 02 years as against 15.03 •
21
years in the control gr oup . further comparison indicated that the experi
mental gr oup consisted of six freshman and six sophomores of whom five
lived in a rural environment while seven lived in urban surroundings;
the control group consisted of nine freshman and four sophomores with
all except two living in Broolci.ngs. A comparison of absences indicated
that the experimental group had a total of eight absences with two
individuals being absent twice, rihile the control group had a total of
three absences, no one being absent more than once.
Collection of Data
Tne testing and scoring techniques for the Roger' s Physical
Fitness Index followed in accordance with those described by Clarke, L9
and the t echniques fort.he Johnson-Metheny Motor Educability Test
followed that of Metheny.SO T'ne various parts of these tests and the
order in which they were administered are described in detail in the
following paragraphs.
Rogers Physical Fitness Index:
Age, Height, Weight (Figure 1): Tne age, height, and weight of
each individual were recorded on individual forms . This was done with
gymnasiwn uni.forms on and the tennis shoes off.
Grip Strength (Figure 2): A hand dynamometer was used to
measure grip strength; both right and left hands were tested. The
tester placed the hand dynamometer in the subject's hand with the
49H. Harrison Clarke, Aoplication ot',,Measurement !£ Health and Physical Education, (2d. ed., New York: Prentice-Hall, Inc., 1950), PP • 155-168.
5~leanor Metheny, "Studies in the J ohnson Test of Motor Educability, n Re search Quarterly, IX, December, 1938, pp• 105-114.
J
\ •
\
-, I ~ ·: • • • 1 , I ,, } -/ .
l , ., ' 1/ n ,A/,/ ......... I
·, ' • ,}. : •• : ......... I' \
ol ~.- ,.·-r• \ czT· ,' ~,-\ ' J =11·,t I
Figure l. Age, Height and Weight
22
-:,,-...... -~ ~
I I l_ --
~ .__. b'xl-, ;.,; ;; !, I
,~· ~
-~
I I
,,
- , ·-:-
I r' , ( . , . ....,, ,~
\ , l
I i
·( f
) ,...,...., ' .
,.
- / / ·.~
I I
i
. ' •1 .. - , -, I i
. : I • r., ! ",
. t (
. ' --:---;-~_.,..,. -....,.'.
'\
/' , I , I
If'~ ·ll .... ,. - I ... ..__ ___ .. ,i
~~......_ ........ .-,_
• • ''4 '" ~
Figure 2. Grip Strength
/
23
24
dial facing the palm, in such a manner that the convex edge of the dyna
mometer was between the first and second joints of the fingers and the
rounded edge against the base of the hand. Each subject was encouraged
to bend the elbow and swing his arm in a downward s-weeping arc as he
squeezed the hand dynamometer. The hands were not allowed to touch
the body, or any object, while the test was being administered. The
right hand was tested first and then the left; the indicator was returned
to zero after each test.
~ Lift (Figure 3) : The back and l eg dynamometer was the instru
ment used for measuring the strength of both back and leg muscl.es. This
instrument measured the amount of weight lifted in pounds . In this study
the dynamometer was placed on a platform; the subject being tested t hen
placed his feet about six inches apart on the platfo:nn. Wit h t he f eet
in the proper position., the subject stood erect with the hands on the ~
front of the t hi ghs, finger s extended downward. The tester then hooked
the chain so that the bar level was just below the :finger tips of t he
subject . Each subject then grasped the handle f'irml.y at the ends of
the bar., with one palm forward. and one palm backward. In this position
of readiness to li.i't, the back was slight~ bent at the hi p s; t he l egs
were str aight with no bend at the lmee·s ; and the head was up lr.ith the
eyes directed straight ahead. At this point the subject merely- at~ted
to straighten out the back. The tester grasped the subject's hands
finnl.y during the lift so they would not slip off of the bar •
•

< '
t.
\' J'J . "- : '
\'~ -•~';. "--rl ,~· ·' ,': ,. ,. , , , \ I
-~
•
Figure 3. Back Lift Test
~ !} i I
I I
25

26
Le~ Lift Test (Figure 4): In the leg lift, the subject. placed his
feet in the same position as that of the back li:f't. The subject held
the bar so that it rested at the junction of the thighs and t.runk, while
the tester adjusted the belt. The subject then bent his knees slightly'
and the tester hooked the chain. Before the subject. was instructed to
lift, care was taken to make sure that the_ subject • s arms and back were
straight, the head erect, and the chest up. Maximum lifts occur when
the subject 1 s legs are nearl.y straight at the end 0£ the l.i:fting effort;
therefore, extreme care was taken to adjust the chain at t,he right leg
angle in order to obtain the maximUlll leg lift.
Push-!!E,__ Test (Figure 5): The push-up test was ~stared on
the regular gymnasium paral.lel bars. The bars were adjusted at approx
imately shoulder height. Each subj~ct stood at the end 0£ the parallel.
bars, grasping one bar in each hand. He then jumped to the front ..,
support position with arms straight ( this counts one). He then lowered
his body ·until the angle of the upper arm and £oreann was less than a
right angle, then pushed up to the straight-arm position ( this counted
two). This movement was repeated as many times as possible. lhe
subject was not permitted to jerk or to kick when executing the push- ups.
Lung Capacity~ (Figure 6): 'Ihe l.ung capacity was measured in
cubic inches with a wet spirometer. The spiroroeter was equipped with a
rubber hose of sufficient l ength so that subjects were not uncomfortable
in performing this requirement. An individual wooden mouthpiece was used
for each subject. Each subject took two deep breaths before the test. .
Then, after the .fullest possible i.nhal.ation, he slowly and steadily
.. -

-~ ' ~ /
- I . ~ \
!I.·;
-\ , I
/': ' ~It, . \ ,J. I { } ,
/ \ 11~;;;.- ~
. ~ :-", , j /~ \ }- 'I
' \ \1
/
/ ,,
. ,
/;
I I t I
f-Figure 4. Leg Li.f't Test.
..
27

/
I
,_ l ~- !
r .. -✓ I · ".J'l l
'- • - I
U;
/
\ l
t
j . .. ,.~z .,~ .. -.:;."'-· .. . ... "'
-· ~,... 1""' .. --· . # 'I •• ~.;,,...;,
' I
) f I
f l'
' ~ • ,. J
' .
;'
t . •,;,· ',r ' l' ,·. u \· · ..
!P~ Ii \ 1 ·,.
-· '":i _(.J:--. ,;
~ r _ __ ..._ _ _ ....,..,,_ ,_...,\ ~~
-~ I ,
• ()
Figure S. ?\'..~-Up Test
28

29
•, .. , .... , ~ .,, ,.
/
.,
. '
Figure 6. Lung Capacity Test.

30
exhaled while bending forward over the hose until all the air within his
control was expelled. 'lhe tester watched the indicator closely in order
to note "When it reached the highest point .
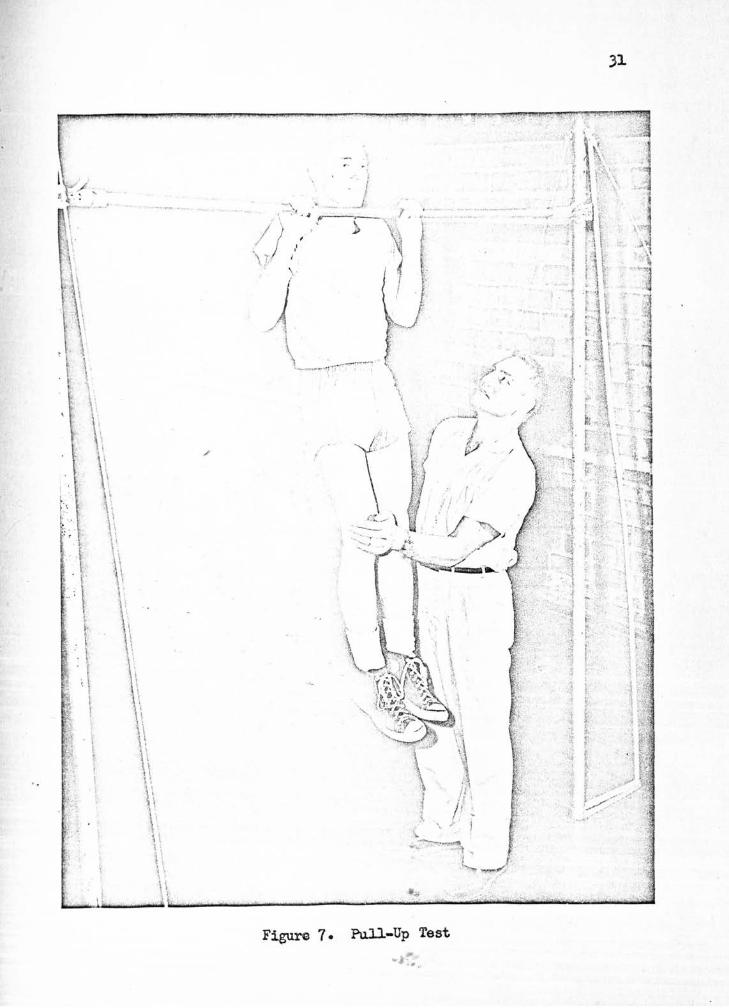
Pull-££ Test (Figure 7): In taking the pull- up test, each subject
hung from the bar by his hands, palms forward, and then chinned h:i..'11.s elf
a s many times as he could. The subjects were not pennitted to kick, t o
jerk, or to use a kip motion in performing chin-ups. HaJ.f-counts were
recorded on the pull-ups and push-ups if the subject did not pull all
the way up, if he did not straighten his arms completel y: when l.owering
the body or if he kicked, jerked, or ld.pped in p9r.formi.ng the movement .
/
Scoring of~ Physical Fitness Index: Scoring of the Physical
Fitness Index t ests were acconq:,lished in the following manner. Arm
strength was scored according to the following .formula; (push- ups + w
pull- ups) X (IO"" + H - 60). The strength 1.ndex was then determined by
adding together the scores made on each test :i.tem; l ung capaci ty, right
grip, lei't grip, back strength, ·leg strength, and arm strength. Nonn
charts have been prepared for the Physical Fitness Index based upon
sex, weight, and age. The Physical Fitness Index was then found :for
f th ;f ll . f __ , - PFI Achieved SI X l00. each subject by use o e o owing o.nuu..&4: • Nomal. SI
Johnson-Metheny- Test~ Procedure:
~ Mat (Figure 8): A lane twenty-four inches wide was marked.
down the center of a fifteen foot mat. This l.ane was divided into two
equal narrow lanes by a cent.er line, and int.o ten equal. parts lengthwise
by lines every eighteen inches. Tnese lin&s were al.ternat e~ 3/4 inches
... ..
. i
' l \ \
h i· ·.•
, ; . l
·t ' . I
-, , .. . I
-, ' · J . . •. ~ --- I . 1 \ , h
-~ l 1 t \
j \ --·----~·
. . ./. \t •
< ... ' \ • '\
'
/;~ -... . / l" ' . - . -~,, t
_-.J. .... / .....-!~ .,.- I / \; \ /. ~ · . , .
~\1 I>, . ~-r~::r· -.// , : ~ .... ..._ . ' ' , . .
• .... ;
Figure 7. Pull-Up Test
31

32
METHEN'I SIMPLIFIED MRT ·
H ~ · ,I ~ ,,.,.
r-,a:.t -~H- +
Figure 8 •
. ,,
-

wide and three inches wlde; the eighteen inch distance was measured to
the middle of the line in each case. On this mat the selected Johnson
Netheny test items were perfonned as follows.
33
Forward Roll : The performer executed two forward rolls in t he
entire twenty-four inch lane. The subject started the first forward
r oll with the f eet outside of the chart and the second forward roll with
the feet behind the middle three inch line. The first roll was per
formed within the limits of the first half of the lane (~ot going beyond
the middle three inch line); the second roll was performed within the
limits of the second half' - never touching or over -reaching the lanes.
Score : The tester counted five points :for each r ol l . Two
points were deducted for over-reaching the side line r ight or l ef't for
each roll and one point .for over-reaching the end limit on each r oll,
and five points for fai lure to perform a true roll.
Backward Roll: The performer executed t wo backward rolls in the
entire twenty-four inch 1.ane, one in each half of the l.ane. The pro
cedure and scoring were the same as that of the forward r oll.
Jumping ~ Turns : The half turns were performed in eit her
the right or left half of the lane, the heavy three inch lines
serving as the targets for the perfo:nner. The performer started
with the feet on the first three inch line . He then jumped 'With both
feet to the second three inch line, executing a half- tum either right
or left . He then jumped to the third three inch line, executing a half
turn in the opposite direction. He then COJ'.ltinued the l ength o:f the mat,
alternating directions o:f rotation.

34
Score: Two points were deducted for each jump in which the subject
did not land with both feet on the three inch 1.ine, or turned the wrong
way, or jumped out of the boundary, or all three.
Jwnping Full~: The perfonner started with the feet outside
the chart at about the center of the lane. He jumped to the second
rectangular space, executing a full turn with the body either right or
lei't. He continued across the mat, executing full turns, rotating in
the same direction, being sure to land on both feet in every second
rectangular space.
Score: The perfomance was scored as in the above, deducting
two points if the ,performer failed to land on both feet, overstepped
the square, turned too far or not far enough, or lost his balance bei'ore
starting the next jump.
After the initial tests were taken, twenty class periods fifty
.five minutes in length, were used to conduct two different physical
education programs. The last two periods in each class were utilized
to administer the Roger's Physical Fitness Index Tests and Johnson
Metheny Motor Educability Test to determine the improvement or retrogres
sion of each individual and the group.
The Physical Education Programs :
The two groups met every Tuesday and Thur sday at different hours,
the control group meeting at 11:00 A. M. while the experimental group
met at 1:00 P. M. Both groups were infonn.ed that they were a part of
an e.Y.periment and were encouraged toward maxinn.un effort at all tillles
during the ten week study.
. .
35
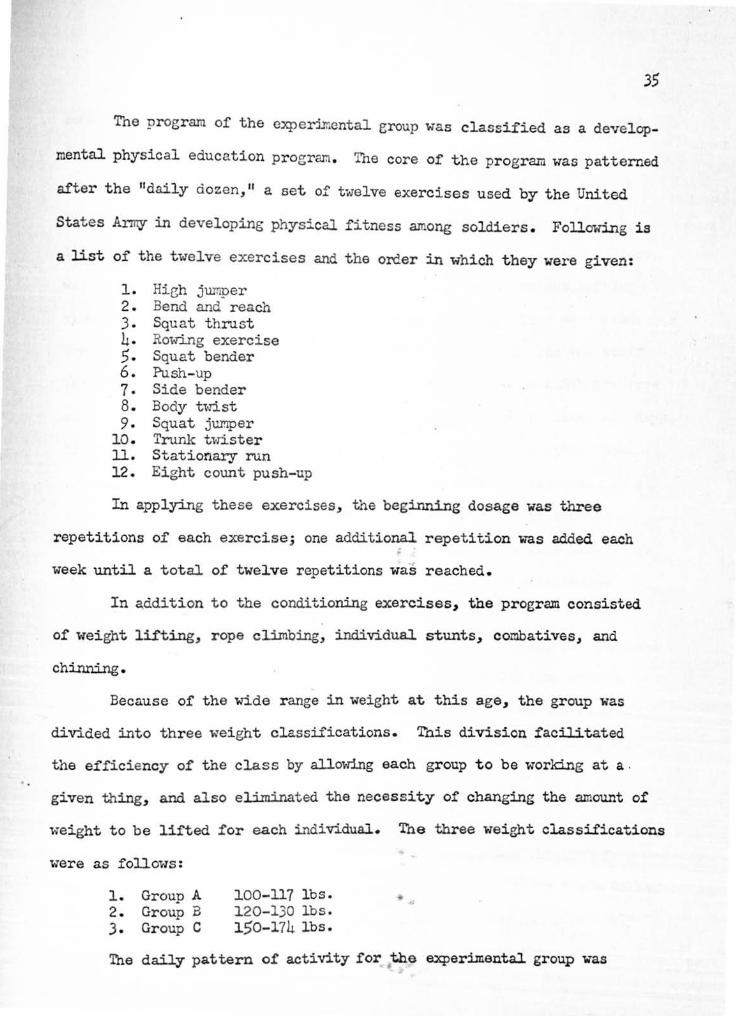
The program of the experimental eroup was classified as a develop
mental physical education program. The core of the program was patterned
after the "daily dozen, 11 a set of twelve exercises used by the United
States Army in developing physical fitness among soldiers . Following i .s
a list of the twelve exercises and the order in which they were given:
1. Hieh jumper 2. Bend and reach 3. Squat thrust 4. Rowing exercise 5. Squat bender 6 . Push-up 7. Side bender 8. Body twist 9. Squat jumper
10. TrurJc twister 11. Stationary run 12. Eight count push- up
In applying these exercises, the beginning dosage was three
repetitions of each exercise; one additional repetition was added each
week until a total. of twelve repetitions was reached.
In ~ddition to the conditioning exercises, the program consisted
of weight lilting, rope cl.imbing, individual stunts, col'Jbatives, and
chinning .
Because of the wide range in weight at this age, the group was
divided into three weight classifications. 'l"nis division facilitated
the efficiency of the class by allowing each group to be working at a .
given thing, and also eliminated the necessity of changing the amount of
weight to be lifted for each individual.. The three weight classifications
were as follows:
1. Group A 2 . Group :a 3. Group C
100-ll? l bs . 120-130 lbs. 1 50-174 lbs .
The daily pattern of activity for the experimental group was

somewhat repetitious. The first ten minutes of the class were allowed
for changing from str eet clothes into the proper attire :for physical
education class. Twenty minutes were required for the "daily dozen."
'lhe next fifteen minutes were given to group rotation between weight
lifting, rope climbing, combatives, stunts, and chinning. Each subject
was required to do eight repetitions of four different weight lifting
exercises each class meeting. '!he following four exercises were used:
the deep lmee bend, the two-arm press, the two-arm curl, and the stiff
legged dead weight lift. Each group was also required to climb the rope
each day. Combatives, stW1ts and chinning were engaged on alternate days.
Five minutes were/ allowed at each activity :for each gr oup; thus, each
individual was given ampl.e time to perform the required exercise . The
last :five to ten minutes were spent in some group activity such as
games of low organization or group relays. Ten minutes were all.owed at
the end of each period :for showering and changing back into street
clothes. ·
The program of the control. gro-1.1p was that o:f the regular physical
education classes. It allowed ten minutes :for changing i'rom street
clothes, ten minutes for exercises, and thirty minutes in the learning
of activities. The teaching units for the duration of this study were
those of basketball and volleyball.
The Testers
Assistance in Physical Fitness Index testing was obtained from
the graduate students in physical education at South Dakota State College • . All of these students were experienced testers as they had previously
administered the Roger' s Physical Fitness Index to all freshman lllale

37
students enrolled in physical education at South Dakota State College . In
the case of the Johnson-Metheny test all of the testing was done by the
author. In order to improve the objectivity, several practice sessions
were carried on before administering the test to the subjects in thi s
study. All testing was supervised by Dr. Campbell Snowberger, advisor
for graduate students in physica1 education at South Dakota State Col lege.
/
.,
•

38
CHAPTER IV
TREATI·lENT OF THE DATA
This chapter will be devoted to a presentation of t he results in
tabular and graphic form. '.lhe results are presented under the f ollO'Wing
headings: analysis of individual results, comparison of range and
variability, comparison of mean gains, and statistical significance ot
mean gains. The most notable findings appear in analyzing the statis
tical results.
Analysis of Individual Results : /
The test results and point improvement in each test for each
individual talcing part in the study can be found in Table 1.
An analysis of the data provided in Table I indicated that a
high score in the rootor educability test did not necessar..J.y indicate
a high score in the physical f i tness index. This was exemplified in the
cases of subject ten of the experimental group and subject six of' the
control group . These two i ndividuals received the h i ghest scor es in the
Johnson-Metheny Test , yet they were far from the top in the Roger's
Physical Fitness Index. This would tend to suggest that although
strength is an important factor in motor educability there are al.so
other elements involved. The improvement of these two subjects did
indicate, however, that as the physical .fitness index impr oved, motor
educability also improved.
There were three cases in the study which showed no relationship ..,
between a change in physical fitness index with that of motor e ducability •
.. -

39
TABLE I
RAW SCORES OF EXPERIMENTAL AND CONTROL GROUPS I N INITIAL AND FINAL TESTS OF PHYSICAL FITNESS AND MO'IOR EDUCABILITY
EJcperimental Group
Subject Initial Final PFI Initial Final. Motor PFI PFI Improve- Motor Motor Educability
ment Educabili ti Educabilit:t: Impr ovement
1 86 111 25 14 22 8 2 83 92 9 16 22 6 3 83 90 7 12 21 9 4 82 93 11 18 23 5 5 82 92 10 16 22 6 6 87 109 22 14 26 12 7 81 90 9 22 25 3 8 85 94 9 12 23 ll 9 65 101 36 14 24 10
10 64 87 23 23 34 11 ll 58 50 -8 6 6 0 12 54 73 19 20 24 4
.,
Control Group
l 83 93 10 23 25 2 2 82 86 4 22 23 l
3 75 71 -4 12 10 -2 4 74 91 17 20 24 4 5 71 85 14 19 24 5 6 71 78 7 29 36 7 7 69 88 19 16 18 2 8 68 66 -2 8 8 0 9 68 62 -6 14 23 9
10 68 88 20 16 16 0 .. ll 67 65 -2 23 26 3
12 64 74 10 14 18 4 13 63 63 0 4 4 0
40
These three cases were subjects nine, ten, and eleven of the control group.
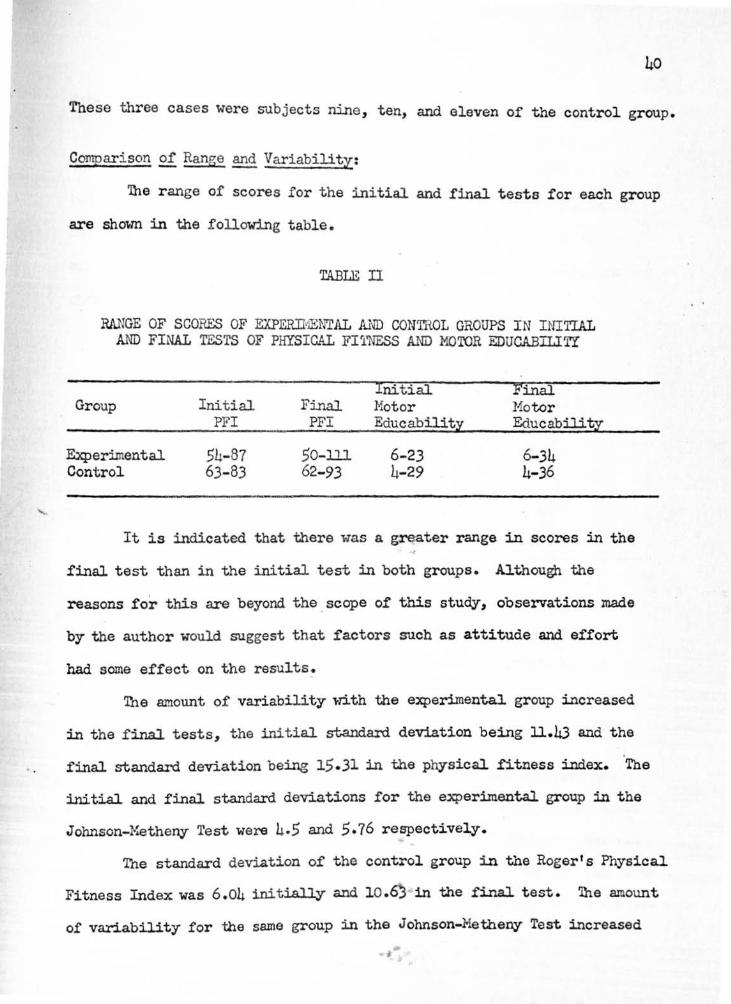
Comparison~ Range and Variabiliti:
'lhe range of scores for the initial and final tests for each group
are shown in the following table.
TABLE II
RANGE OF SCORES OF EX.PERTI·iliNTAL AND CONTROL GROUPS IN INITIAL AND FINAL TESTS OF PHYSICAL FI'l'NESS AND MOTOR EDUCABILITY
Initial Final Group Initial Final Motor Motor
PFI PFI Educability Educability
E.xperimental 54-87 50-lll 6-23 6-34 Control 63-83 62-93 4-29 4-36
It is indicated that there was a greater range in scores in the
final test than in the initial test in both groups. Although the
reasons for this are beyond the scope of this study, observations made
by the author would suggest that £actors such as attitude and effort
had some effect on the results.
'lhe amount of variability ~ti.th the experimenta1 group increased
in the f'inal tests, the initial st,andard deviation being 11.43 and the
final standard deviation being 15. 31 in the physi cal .fitness index. ·The
initial and final standard deviations for the experi1llental group in the
Johnson-Metheny Test were 4.5 and 5.76 respectively.
The standard deviation 0£ the control group in the Roger's Physical
Fitness Index was 6.04 initially and l 0.6)· in the £i.nal. test. 'lhe amount
of vari.abil.ity for the same group in the Johnson-Metheny Test increased

....
41
.from 6.1 in the first test to 8.3 in the final test.
Observation of the amounts of variability of the two groups in
the two tests indicated that there was an increase in variability for
both groups between the initiaJ. and final tests; however, the standard
deviation for the control group increased more than it did for the
experimental group. The standard deviations of' these two groups are
shown in Table III.
TABLE nr
STANDARD DEVIATIONS OF EXPERIHENTAL AND CONTROL GROUPS I N INITIAL AND FL'IAL TESTS OF PHYSICAL FITNESS .A.ND MO'roR EDUCABIL.1TY
Initial. Final Group Initial Final Motor Motor
PFI PFI Educability Educability
Experimental 11.43 15.31 4.50 5.76 Control 6.04 10 .63 6 .10 8 .30
Although the standard deviation values were not subjected to
strict statistical. evaluation, it might be hypothesized however, that
these differences were due to the nature of the two physical education
programs.
Comparison £!_ Mean Gains:
It is indicated that the mean improvement of the experimental
group in both tests was considerable. The mean of the initial physical
fitness index was 75.8 and that of the final. physical .fitness index was
90. 2 . 'Ihis indicated a mean gain of J.4.4 points during the ten-week study. ,,
Only one subject .from the exper:iJnental group .f'ailed to improve duriog the
study. _,-

'
This can be attributed to :iinproper attitude and a minimal amount of
effort on the subject ' s part (the author ' s observati ons) .
The r esults of the Johnson-,Metheny Test of Motor Educability with
the exper imental group indicated an initial mean of 15.5 and a final mean
of 22 .7. This resulted in a mean gain of 7.2 points for the group as a
whol e . Again one person failed to improve, that being t he same individual
who r egressed in the Roger's Physical Fitness Index.
The results of the Roger ' s Physical Fitness Index with the control
group showed ini ti.al and final means of 71 and 77 • 7 r esp~cti vely. This
demonstrated a mean improvement of 6.7 points; however, there was less
consistency with this group as four subjects r etr ogressed between the
initial and :final tests and one subject remained stationary.
Motor educability was more stable than physical fitness for the
control group, the initial mean being 17 and the final mean being 19.6
This resulted in a mean gain of 2 .6 points . One person retrogressed
and three additional subjects failed to improve. The initial and final
means in the two tests for both gr oups are rep resented graphically in
Figure 9, pa ge 43.
Statistical Significance .£!:. Mean~:
T'ne significance of the mean gains of the experimental and cont r ol
groups in the Roger' s Physical Fitness Index is shown in the :following
table . The boys in the experiiilental group had a mean gain of 14.4 points
from the original test to the end of the t r aining period. This gain was
highly significant beyond the . 01 level of confidence, the critical ratio
at this level being J.11 as compared to 4. 73~ the obtained critical ratio
for this group.

'·
43
MEflNS OF P/1 R/t!D J0HNSON-lfllHENY BEFORE /IND II/TEI? EJEl?C/SE
•
, - •-. ::;
I·
i.-
1:
r.:
,, --~ .
B
t I . t • t
- ..
-- __ ,· ~~- ·?·~~ '\
. ' . . • -·
. -~-
lXPEKIHENTRl G/lOllP
JOHNSON-HETHEJVY T£.JT ,€0GEl(:5 /'FI
...
. __.
,;,.
Ill U .. 40 ,S_O 40 76 ,, •• H•
,. ,. .. ,.. •
CONT!iOL G~OtJP
-Figure 9. I ..

TABLE J.V
SIGNIFICANCE OF MEAN GAINS OF EXPERIMENTAL AND CONTROL GROUPS IN PHYSICAL FITNESS INDEX
t ratio for Group Ini tial Final Mean t Level of Level of
Mean Hean Gain Ratio Signii'icance Significance
Exper:imental 75.8 90.2 14-4 4.73 .01 3.n Control 71.0 77.7 6.7 2.68 .05 2.18
The subjects in the control group had a mean gain o:f 6 . 7 points
during the ten-week study. This mean difference was signii'icant just
beyond the .05 level of confidence. This gives an indication that both
groups :improved in physical fitness as measured by the Roger ' s P'nysical
Fitness Index, but that the experimental group showed greater progress .
'Ihe significance of the mean gains of the two groups in the John
son-Metheny Test of Hotor Educability is ~9-0vm in the following table.
'Ihe mean gain of 7 .2 points for the experimental group was high.J.y
significant beyond the • 01 level of confidence • 'Ihis can be co.'llpared
to a mean gain of 2 .6 points for the control group, which did not reach
signif'icance at the .05 level. of confidence. It should be noted that
while both groups showed improvement in motor educabilit y, the rate of
acceleration for the experimental group was sJ.ightl.y superior.
TABLE V
SIGNIFICA..r.rCE OF MEAN GAINS OF EXPERJJ-1:EJJTAL AND CONTROL GROUPS IN MOTOR EDUCABILITY
t ratio for Group Initial Final. Mean t Level of Level of
Hean Mean Gain Ratio-,, Significance Significance
Experimental 15.5 22.7 7.2 .s.13 . 01 J . ll Control 17.0 19.6 2.6 1.51 . .05 2.J.8
45
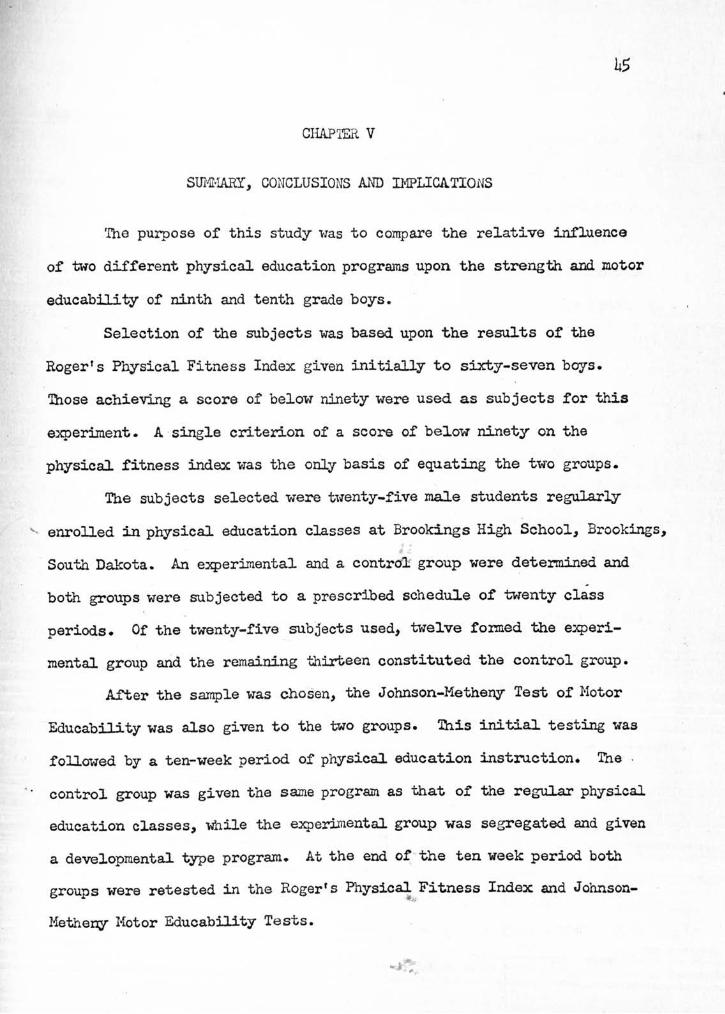
CHAPTER V
SUMMARY, CONCLUSIONS AND IMPLICATIONS
The purpose of this study was to compare the relative influence
of two different physical education programs upon the strength and motor
educability of ninth and tenth grade boys.
Selection of the subjects was based upon the results of the
Roger's Physical Fitness Index given initially to sixty- seven boys.
'lhose achieving a score of below ninety were used as subjects for this
experiment. A single criterion of a score of bel.ow ninety on the
physical fitness index was the only basis of equating the two groups.
The subjects selected. were twenty-five male students regularly
"- enrolled in physical education classes at Brookings High Schoo1, Brookings,
Sou th Dakota. An e:xperimenta1 and a control! group were determined and
both groups were subjected to a prescribed schedule of twenty class
periods. Of the twenty-five subjects used, twelve formed the experi
mental group and the remaining thirteen constituted the control group.
After the sample was chosen, the Johnson-Metheny Test of Noter
Educability was also given to the two groups. 'lhis initial. testing was
followed by a ten-week period of physical education instruction. The .
control group was given the same program as that of the regular physical
education classes, wile the experimental group was segregated and given
a deveJ.opmental type program. At the end of the ten week period both
groups were retested in the Roger's Physical Fitness Index and Johnson-.,,,
Methen;y Motor Educability Tests.

Sur1lll!3!Y of Results:
Statistical treatment utilizing the t test of significance was
applied to the findings . Tne results indicated that the mean gain for
the experiment al group was highly superior to that ot the control group,
extending beyond the .Ol level of confidence as compared to the control
gr oup which reached significa..,ce just beyond the .05 level of confidence.
'lhe superiority of the prescribed devel opmental program over the usual
physical education program appears to be clearly established.
Conclusions :
Although it is felt t hat this study is limited both in scope and
methodology, certain limited conclusions are apparent. An analysis of
the individual r esults indicated that through participation in a physi-
'· cal education program heavily designed for physical development, a
parallel :improvement in both muscular stre~ th and ability to learn new
skills talces place. It is also discernible that a developmental pro
gr am designed to str engthen body muscles has the greatest effect on t he
improvement of physical fitness and motor educability as measured by
the tests used in t his study. A comparison of t he range of scores of
the two gr oups seemed to indicat e that the devel opmental program was
more demanding of each individuaJ., thus a gr~ater distribution of scores.
Implications:
The benefits of a physicaJ. education pr ogram upon the impr ovement
in physicaJ. fitness and motor educability have certainly been brought
into a1-1areness by this st udy. Therefore, 4 t would seem that every
physicaJ. education program should include activities that contribute
to strengthening the large muscles of the !>ody• It would also seem

47
indicative from the r esults of this study that physical education, as a
definite program, should assume a position of equal. importance to any
other program in the school curriculum.
Further research utilizing more refined statistical. pr ocedures
and methodology would enhance the potentiality of this area of investi
gation. Specific controls such as carefully equated groups and additional
r efined measuring instrwnents would be a decided impr ovement in further
investigati on.
J . .,
lJ,;

'
48
LITERATURE CITED
BOOKS
Br ace, D. K., Measuring Motor Ability, New York: A. s. Barnes Company, 1927.
Clarke, H. Harrison, Application of Measurement to Health and Physical Education, New York: Prentice Hall, lnc. , 2d. ed., 1950.
----, Development of~ ~ - Strength Individual, St. Louis : Fred 1-iedart Products, Inc., l~L
Cozens, F . W. , ~ Measurement of General Athletic Ability in College ~, Eugene: University of Oregon Press, 1929.
Cureton, T. K., Physical Fitness Aopraisal ~ Guidance, St. Louis: c. V. Mosby Company, 1932.
Larson, L. A. , and Yoe-am, R. D., Measurement ~ Evaluation !!! Physical, Health and Recreation Education, St. Louis : Mosby and Company, 19.51. -
Reidman, Sarah R. , The Physiology: of~~ Play, Ne,-1 York: The Dryden Press, 1950.
Ulich, Robert, History of Educational 'Ihought, New York: American Book Company, 1950.
United States Office of Education, Physical Fitness £2! Students~ Colleges~ Universi~, Washington, D. C.: U. s . Government Printing Office, 1943.
PERIODICALS
Adamson, G. T., 11E.ffect o.f Systematic Overload on the Strength, Physical Fitness, and Physical Efficiency of Schoolboys, " Journal o:f · Phzsical Education, XLIV (November, 1952) , pp . 109-112. -
American Association of Health, Physical Education, and Recreation, "The President's Conference on Fitness o.f American Youth," Journal of Health, Physical Education, and Recreation, XXVII (Sep t ember, 1956) , pp• 8-12 • -
Carpenter, A. , 11 A Study o.f Angles in the 1-fa.asurement of Leg Lift, n Research Quarterly, IX (October, 19381 PP• 70-72. .. .

'·
49
Clarke, H. Harrison, " Improvement of Objective Strength Tests of Muscle Groups by Cable-Tension Methods, 11 Research Quarterly, XXI (December, 1950), pp . 399- 419 .
___ "Objective Strength Tests of Affected Hu.sole Groups Involved in Orthopedic Disabilities, 11 Research Quarterly, XIX (11ay, 1948) , pp . 118-147 .
Johnson, G. B., "Physical Skill Tests for. Sectioning Classes in Homogeneous Units, 11 Research Quarterly, III (March, 1932), pp . 128-136.
Kistler, J. w., "A Study of the Results of Eight Weeks of Participation in a University Physical Fitness Program for Men, 11 Research Quarterly, r-1 (March, 1944), pp . 23-28 .
Kraus, Hans and Hirschland, Ruth P ., 1114i.nimum Muscular Fitness Tests in Children," Research Quarterly, XXV (~ , 1954~ , PP • 178-186 .
Martin, E. G. and Rich, W. H., "Huscular Strengt."1 and Symmetry in Human Beings, 11 American Journal of Physiologz, XLVll (1918) , PP• 20-42 •
McCloy, C. H., 11A New Method of Scoring, Chinning, and Dipping," Research Quarterly, IV (December, 1931), pp . 3-10.
"An Analytical Study of the Stunt Type Test as a Measure of ---Hotor Educability," Research Quarterly, VIII (October, 1937),
pp. 46-55-
11A Preliminary Study of Factors in Motor Educability, 11
---Research Q,.1arterly, XI (¥.iay, 1940), pp. 28-39.
11'.the Apparent Importance of Arm Str~ngth in Athletics, 11
---Research Quarterly, V (March, 1934), PP• 183-198.
}Ietheny, Eleanor, nstudies in the Johnson Test of Motor Educability ," Research Quarterly, IX (December, 1938), pp. 105-114.
11orehouse , L. E., "Recent Studies in Learning Fact ors of Mo tor Skills," J ournal of Health, Physical Education, and Recreation, XIV (January-February, 1948), pp. 57-60:- -
Powell, Elizabet h , "The Present Status of P.aysical Indices," Research Quarterly, XI (May, 1940), PP• 3-17.
Rath, Emil, "A Study of t.i.e Effects o:r Different Physical. Education Programs on Strength Index of 9th Grade Boys," Research guarterly, XIII (June, 1942), PP• J.69-177.
w.J ,

50
Rogers , F . R., "Physical Capacity Tests in the Administration of Physical Education, 11 Contributions to Education, CLXXIII (1925) .
___ 11The Significance of Strength Tests in Revealing Physical Condition,11 Research Quarterl:'[, V (October, 1934), pp . 43- 46 .
Sargent, D. A. , 11 Intercollegiate Strength Tests, 11 American Physical Education Review, II (December, 1897), p . 216.
Staley, S . o., "Physical Education and Research, " Physical Educator, DC (October, 1952), p . 73.
Wendler, Arthur, "An Analytical Study of Strength Tests Usine the Universal Dynaino:neter, 11 Research Quarterlz, VI (Suppl ement October, 1935) , pp. 81- 35. -
¥U:SCELLA.NEOUS MATERIAL
Barton, Gertrude, 11A Comparative Study of the Brace Type o:f Test and the Johnson Type of Test as Measures of Motor Educability in the Junior High School Girl, 11 Unpublished M. S. thesis, State University of Iowa, 1935.
, Coefield , John Robert, and HcCollurn, Robert H. , "A Case Study Report of 78 University Freshman Men with Low Physical Fitness Indices," I1icrocarded M. S. thesis, University of Oregon, 1955.
Hunsicker, Paul, "A Mechanical Analysis of Chinning.,'' Unpublished M. S. thesis, Springfield College, 1941.
Koob, C. G., 11A Study of the Johnson Skills Test as a Measure of Motor Educability, 11 Unpublished M. S. thesis, State Univer sity of Iowa, 1937.
Roads, Hazel Marie, 11A Comparative Study of the Brace Type of Test and the Johnson Type of Test as Measures of Motor Educability in the Senior High School Girl as Shovm by Two Selected Criteria,n Unpublished N . S . thesis, State Universit y of Iowa, 1936 .
• Whittle, H. Douglas, "Effects of El ementary School Physical Education Upon Some Aspects of Physical, Motor, and Personality Development o:f Boys Twelve Years of Age, 11 Hicrocarded Ph. D. dissertation, University of Oregon, 1956.
ii,