comparative brain anatomy of lamniform sharks
TRANSCRIPT

DePaul University DePaul University
Via Sapientiae Via Sapientiae
College of Science and Health Theses and Dissertations College of Science and Health
Summer 8-25-2019
Comparative brain anatomy of lamniform sharks (Elasmobranchii: Comparative brain anatomy of lamniform sharks (Elasmobranchii:
Lamniformes) and its implications to function, behavioral ecology, Lamniformes) and its implications to function, behavioral ecology,
and evolution and evolution
Francesco Guzzo DePaul University, [email protected]
Follow this and additional works at: https://via.library.depaul.edu/csh_etd
Part of the Biology Commons
Recommended Citation Recommended Citation Guzzo, Francesco, "Comparative brain anatomy of lamniform sharks (Elasmobranchii: Lamniformes) and its implications to function, behavioral ecology, and evolution" (2019). College of Science and Health Theses and Dissertations. 335. https://via.library.depaul.edu/csh_etd/335
This Thesis is brought to you for free and open access by the College of Science and Health at Via Sapientiae. It has been accepted for inclusion in College of Science and Health Theses and Dissertations by an authorized administrator of Via Sapientiae. For more information, please contact [email protected].
Comparative brain anatomy of lamniform sharks (Elasmobranchii: Lamniformes) and its
implications to function, behavioral ecology, and evolution
A Thesis Presented in
Partial Fulfillment of the
Requirements for the Degree of
Master of Science
Summer 2019
By
Francesco Guzzo
Department of Biological Sciences
College of Science and Health
DePaul University
Chicago, Illinois

ii
Table of Contents
Table of Contents.............................................................................................................................ii
List of Tables..................................................................................................................................iv
List of Figures.................................................................................................................................iv
Acknowledgements..........................................................................................................................v
Abstract….......................................................................................................................................vi
I. INTRODUCTION........................................................................................................................1
II. MATERIALS AND METHODS................................................................................................4
A. SPECIMEN EXAMINED...............................................................................................4
B. EXAMINED VARIABLES…........................................................................................5
1. Brain Mass…………...........................................................................................5
2. Brain Organization………...…............................................................................6
3. Cerebellar Foliation Index…...............................................................................6
4. Encephalization Quotient….................................................................................7
C. PILOT STUDY…...........................................................................................................8
D. REGRESSION-BASED COMPARATIVE ANALYSES…........................................10
E. CHARACTER MAPPING…........................................................................................11
III. RESULTS................................................................................................................................12
A. DESCRIPTION OF BRAIN.........................................................................................12
1. General Observations..……...…........................................................................12
2. Brain Anatomy by Taxa.....................................................................................14
Mitsukurinadae………..…........................................................................14

iii
Odontaspididae………..............................................................................14
Pseudocarchariidae....................................................................................15
Megachasmidae……..................................................................................16
Alopiidae…................................................................................................16
Cetorhinidae…….......................................................................................17
Lamnidae…................................................................................................17
Scyliorhinidae (outgroup)..........................................................................18
B. REGRESSION-BASED COMPARATIVE ANALYSES............................................19
C. CHARACTER MAPPING............................................................................................20
IV. DISCUSSION..........................................................................................................................21
A. SOUCE OF VARIATION………………………………….......................................21
1. Sample-Based Variation..................................................................................21
2. Regression-Based Interspecific Variations......................................................23
B. FUNCTIONAL IMPLICATIONS………………………………………………...…23
1. General Background…………………………………………………………23
2. Telencephalon………………………………………………………..………24
3. Diencephalon…………………………………………………………...……25
4. Mesencephalon………………………………………………………………26
5. Metencephalon………………………………………………………………27
6. Myelencephalon……………………………………………………………...28
C. ECOLOGICAL IMPLICATIONS................................................................................28
1. Deep-water Sharks.............................................................................................28
2. Filter feeders......................................................................................................30

iv
3. ‘Weaponized’ Caudal Fins.................................................................................31
4. Thunniform Swimmers......................................................................................33
D. EVOLUTIONARY IMPLICATIONS..........................................................................33
V. CONCLUDING REMARKS....................................................................................................36
VI. LITERATURE CITED............................................................................................................41
List of Tables
Table 1. Pilot study examining changes in brain weights through fixation and preservation.......56
Table 2. Percent size of each of five brain regions relative to total brain size in pilot study........57
Table 3. Examined specimens and their variables compared with previous study........................58
Table 4. Percent size of each of five brain regions relative to total brain size in lamniforms.......59
List of Figures
Figure 1. Example of shark brain, brain terminology, and cerebellar foliation index...................60
Figure 2. Fifteen extant lamniform shark species…......................................................................61
Figure 3. Brain of each examined lamniform species in dorsal and lateral views.........................62
Figure 4. Regression of brain mass with body mass in examined lamniforms..............................63
Figure 5. Regression of foliation index with two brain variables in examined lamniforms..........64
Figure 6: Character mapping of three sets of brain variables onto published phylogenetic trees.65

v
Acknowledgements
The completion of this thesis would not have been possible if it were not for the
assistance of many individuals affiliated with DePaul University whom I would like to thank. I
would like to thank P. Sternes, R. Hacker, and R. Incandela for assisting with dissections and for
providing reading material instrumental for completing my thesis. My thesis committee
members, J. Bystriansky and E. Norstrom, for their time and guidance. My advisor, K. Shimada,
for all the patience and guidance he has provided to me. I also thank W. Aguirre for providing
formaldehyde and instructions for preserving specimens, and T. Sparkes and M. Silliker for
teaching what is expected in graduate school and how to write scientifically. I am indebted to the
staff of John T. Richardson Library at DePaul University for their help with 3D printing of the
brain specimen of Megachasma pelagios as well as the Department of Biological Sciences of
DePaul University for providing an environment that offered me endless opportunity for learning
and for organizing events that allowed me to present research to peers.
The completion of this project was an international effort and I would like to thank the
individuals from various institutions for contributing specimens or facilities for dissection and
data collection. They include: A. Suzumoto (BPBM); C. B. Dillman (CUMV); C. McMahan, S.
Mochel, and K. Swagel (FMNH); R. Feeney (LACM); H. Ito (Nippon Medical School,
Japan); G. Shinohara (NSMT); N. Yamamoto (Nagoya University, Japan); M. Burridge, C.
Dutton, E. Holm, and D. Stacey (ROM); B. Frable, H. Walker, and P. Hastings (SIO); L. Page
and R. Robins (UF); and M. Becker (William Paterson University, New Jersey). In addition, I
thank J. Ziesemer and L. Nerepil (Preferred Open MRI, Orland Park, Illinois) for assisting with
MRI scanning of the brain specimen of Megachasma pelagios.

vi
Abstract
Understanding the diversity of brain morphology is important to understand the evolution
of cognitive ability and how ecology and phylogeny have influenced the variation in brain
complexity. I examined the morphological variation of the brain in the shark order Lamniformes
based on museum specimens and literature. Where I illustrate a wide range of morphological
diversity in lamniform brains, my study shows that there is a strong positive correlation between
brain size and body size, and that sharks with a larger brain tend to have a more foliated
cerebellum, whereas the body weight over brain weight did not correlate with cerebellar
complexity. In addition, the brain size is found to be affected by ontogeny where younger
individuals tend to have larger brains than older conspecific individuals. I also demonstrate that
different sizes of different parts of the brain with different functions reflect different lifestyles.
Some ecological specializations are reflected in the brain anatomy of certain lamniforms, such as
adaptations to deep-water (Mitsukurina), filter feeding (Megachasma), tail-based prey hunting
(Alopias), and thunniform swimming (Lamnidae). My study also shows that more derived
lamniform taxa (e.g., Alopiidae, Cetorhinidae, and Lamnidae) have highly foliated cerebellum,
where limited foliation is regarded as plesiomorphic. Lamnids have relatively small brain,
whereas alopiids have a large brain, where a mid-sized brain can be interpreted as plesiomorphic.
My study represents the first investigation into the morphological variation and diversity of the
brain focusing on lamniforms and demonstrates how ecological factors such as habitat, diet, and
behavior drive brain evolution.

1
I. INTRODUCTION
The complex workings of the brain has fascinated and baffled scientists for centuries
where Santiago Ramón y Cajal, a pioneer neurobiologist, was the first to conduct a comparative
study on different regions of the human brain (Cajal, 1899). Exemplified by Cajal's work,
investigations into how the brain works are important because they help understanding how
sensations are made, how movement is coordinated, how memories are made and stored, and
how the organization of the brain shapes behavior (Gebauer et al., 2014; Russo et al., 2014; Hu
et al., 2016). However, a mere understanding of how the brain works does not explain the origin
of the brain as a functional organ, why do different animals have different types of brains, or
what effects different aspects of behavior, such as feeding, migration, or reproduction, may
impact the morphology of the brain (Jerison, 1973; Gittleman, 1986; Striedter, 2005). An
effective approach to begin answering these questions is by studying the evolution of brains and
how differences in ecology and behavior can shape the brain anatomy.
Sharks are a large group of cartilaginous fishes comprising over 500 extant species
(Weigmann, 2016) under two major groups (superorders) Squalomorphi and Galeomorphi
(Naylor et al., 2012) and representing one of the most well-studied vertebrate lineages. Sharks
have several unique adaptations, such as having jaws detached from their cranium (Compagno,
1999), undergoing continuous tooth replacement throughout their life (i.e., polyphyodont
dentition), and possessing large brains in relations to other vertebrates (Bauchot et al., 1976;
Northcutt, 1977, 1978; Striedter, 2005). Originating nearly 400 million years ago and having
survived several mass extinction (Compagno, 1977), the brains of sharks (Fig. 1) have become as
diverse as the sharks themselves (Masai, 1969; Okada et al., 1969; Northcutt, 1977, 1978;
2
Kruska, 1988; Ito et al., 1999; Yopak et al., 2007, 2019, Yopak and Montgomery, 2008; Yopak
and Frank, 2009). Understanding such diversity is important in helping to understand the
cognitive ability of sharks and how ecology and phylogeny have led to the variation in their brain
complexity. For example, one of the five basic regions in vertebrate brains, the mesencephalon
(Fig. 1B), is responsible for coordination of the eye as well as visual and auditory processing
(Kurkcuoglu, 2017), and a previous study has found a correlation between mesencephalon size
and the water depth that sharks are found in (Yopak and Lisney, 2012). The folding (foliation) of
another region of the brain, the metencephalon (specifically the cerebellum), ranges greatly from
none to having numerous deep groves in sharks (Fig. 1C: Yopak et al., 2007; Yopak and
Montgomery, 2008). The folds in the cerebellum increase the volume and surface area and allow
for greater fine motor control, faster reaction time, and better coordination of the body (Haier et
al., 2004; Montgomery and Perks, 2019)—thus, the higher the foliation, the higher the cerebellar
complexity and more derived the brain.
Yet, many aspects of the diversity and evolution of brain morphology of sharks remain
limited, unlike well-studied teleosts (Bauchot et al., 1977; Huber and Rylander, 1992; Kotrschal
and Palzenberger, 1992; Huber et al., 1997; Kotrschal et al., 1998). Previous studies have found
that sharks possess large brains relative to other vertebrates (e.g., Bauchot et al., 1976; Northcutt,
1977, 1978; Striedter, 2005). Within sharks, those in the Galeomophi are known to have larger
brains than those of Squalomorphi, where their brain mass increases positively with body mass
(Bauchot et al., 1976; Northcutt, 1977, 1978; Myagkov and Hirnforsch, 1991). Whereas the
influence of phylogeny on their brains had not been investigated until recently (Yopak et al.,
2007; Yopak and Montgomery, 2008; Yopak et al., 2019), many basic questions still remain

3
unanswered, including how ecology has played a role in the evolution of brain anatomy in sharks
through their phylogeny.
In this study, I examine the morphological variation of the brain across 14 of the 15
known extant species of a monophyletic shark order, Lamniformes (Fig. 2). Lamniformes is an
ideal group of sharks to conduct comparative studies because its members exhibit remarkable
ecological specializations (Ebert et al., 2013; Kim et al., 2013). For example, the goblin shark,
Mitsukurina owstoni, has a highly protrusive jaw apparatus evolved to quickly snap up prey,
whereas thresher sharks, Alopias spp., use their exceptionally elongate tail to stun prey
(Compagno, 1984, 2002; Oliver et al., 2013). Behaviorally, lamniform sharks are also diverse
with some species having geographically very large migration routes, such as the basking shark,
Cetorhinus maximus, whereas other species, such as the megamouth shark, Megachasma
pelagios, are known to show vertical diel migration (Nelson et al., 1997; Skomal et al., 2009;
Nasby-Lucas et al., 2019). Lamniforms also have a wide variety of prey species from small krill
consumed by C. maximus to large mammals fed by the white shark, Carcharodon carcharias
(Hallacher, 1977; Dudley et al., 2000; Tucker et al., 2019).
Here, I specifically examine the relative development of the brain size (encephalization),
the relative size differences among the five major brain regions (telencephalon, diencephalon,
mesencephalon, metencephalon, and myelencephalon: Fig. 1B), and the variation in cerebellar
folding within the metencephalon using the 'foliation index' developed by Yopak et al. (2007)
(Fig. 1C). Based on my results, I discuss the variation in brain attributes among samples and taxa
as well as functional implications of proportional size differences among the five brain regions
observed across different lamniform taxa. I also examine any relationship of my brain data with
published habitat (e.g., preferred depth), behavioral (e.g., feeding strategies and presence or

4
absence of migratory patterns), and physiological (ectothermic vs. endothermic) data to discuss
the ecological implications of observed variation of brain morphology in lamniform sharks. In
addition, I discuss the evolutionary implications of the observed variation by mapping my
quantitative brain data onto published phylogenetic trees to test whether or not more derived
species of lamniform sharks will have more complex brains.
II. MATERIALS AND METHODS
A. SPECIMEN EXAMINED
I directly observed preserved specimens of 13 lamniform species (Fig. 2) and one
carcharhiniform species, Scyliorhinus retifer (Carcharhiniformes: Scyliorhinidae), housed in the
following institution: Bernice P. Bishop Museum (BPBM) in Honolulu, Hawaii; Cornell
University Museum of Vertebrates (CUMV) in Ithaca, New York; Field Museum of Natural
History (FMNH) in Chicago, Illinois; Natural History Museum of Los Angeles County (LACM)
in Los Angeles, California; National Museum of Nature and Science (NSMT) in Tsukuba,
Ibaraki Prefecture, Japan; Royal Ontario Museum (ROM) in Toronto, Ontario; Scripps
Institution of Oceanography (SIO) in La Jolla, California; and University of Florida's Florida
Museum of Natural History (UF) in Gainesville, Florida. Except for Megachasma pelagios, the
brain in each shark was extracted from each specimen that was originally fixed in formaldehyde
and was subsequently placed in 70% alcohol for long-term preservation. The brain of M.
pelagios is the same specimen described by Ito et al. (1999), that was also originally fixed in
formaldehyde and is now preserved in alcohol at NSMT where no dissection was involved;

5
rather, besides simple external observations, digital data generated from magnetic resonance
imaging (MRI) were used to obtain additional data (see below). Although attempts were made to
obtain specimens of Cetorhinus maximus and Odontaspis noronhai for the purpose of this study,
they were not available due to their rarity in museum collections. However, I was able to obtain a
comparable set of brain data of C. maximus from literature (i.e., Kruska, 1988). Therefore, my
primary data set encompasses 14 of the 15 known extant lamniform species and all 10 extant
lamniform genera ('ingroup': Fig. 2), along with the brains of S. retifer (n = 2) for outgroup
comparison (see Fig. 1A for one of the two specimens). In addition, eight specimens of Squalus
acanthias (Squaliformes: Squalidae), that were caught off the coast of New Jersey, USA
(western Atlantic Ocean), were examined for a pilot study (see below) and are now deposited in
FMNH.
B. EXAMINED VARIABLES
1. Brain Mass
Except for Megachasma pelagios and Cetorhinus maximus, each brain (e.g., Fig. 1A, C)
was detached through dissection from the spinal cord caudal to the terminal end of the
myelencephalon marked by the tip of the fossa rhomboidea. Blood vessels, choroid plexa,
olfactory bulbs, peduncle, and connective tissue (e.g., meninges) were removed, whereas cranial
and sensory nerves were detached 3 mm from their base in order to preserve their positions for
future research. Each brain was then cut into the five major brain regions (i.e., telencephalon,
diencephalon, mesencephalon, metencephalon, and myelencephalon: Fig. 1B) for the purpose of
examining the brain organization and measuring a wet mass of each brain region. To remove

6
excess alcohol, I gave a dab with paper towel. Afterwards, each of the five brain regions was
weighed using a U.S. Solid 0.1 mg 120 × 0.0001 g laboratory analytical balance digital precision
scale based on the criteria used by Northcutt (1978), and all five weight values were
subsequently added together to find the total brain mass. Brain mass data for M. pelagios and C.
maximus were obtained from Ito et al. (1999) and Kruska's (1988) work, respectively.
2. Brain Organization
Except for Megachasma pelagios and Cetorhinus maximus, the measured weight of each
of the five major brain regions (see above) was divided by the total brain weight, giving the
proportion of each brain region in percentage. Comparable brain data for C. maximus were
obtained from Kruska's (1988) work. The brain specimen of M. pelagios that was originally
described by Ito et al. (1999) was not dissected into the five brain regions. Instead, MRI scanning
was conducted to generate three-dimensional (3D) digital data that were then utilized to create a
life-size plastic mold of the brain using a 3D injection mold printer. I then manually cut the mold
into the five brain regions using a heated razor blade and subsequently calculated the proportion
for each brain region represented by a sectioned mold by dividing its mold weight by the total
mold weight. Whereas the density of the plastic is uniform throughout the mold, the density of
the entire shark brain was also assumed to be uniform for the purpose of obtaining the needed
brain mass data for M. pelagios.
3. Cerebellar Foliation Index
Yopak et al. (2007) developed a five-tiered scale to describe the degree of foliation
observed externally on the cerebellum of the myelencephalon in sharks. I used the same scale,

7
the foliation index (FI) that ranges from 1 through 5, to describe the degree of folding in each
species of examined lamniforms (Fig. 2C). The FI is based on the length, depth, and number of
folds in the cerebellum. A FI of 1 is characterized by a cerebellum with no foliation resulting in a
smooth cerebellar surface. A cerebellum with a FI of 2 shows limited foliation where a few
shallow transverse grooves run parallel to one another without branching. A FI of 3 describes a
cerebellum with moderate foliation charactrized by shallow to moderately deep grooves that
show slight branching. A cerebellum with significant foliation formed by rather symmetical,
moderatly deep and branched grooves characterizes a FI of 4. A FI of 5 is assigned to an
extremely foliated cerebellum with deep branching grooves and distinctive multiple sections.
4. Encephalization Quotient
Whereas intelligence of animals is difficult to quantify, encephalization quotient (EQ)
allows for better interspecifc comparisons of different levels of cognitive ability associated with
behavioral complexity than the traditional method of simply measuring raw brain weight or brain
weight to body weight (Cairo, 2011). An EQ value was calculated for each lamniform shark
using the ratio of the actual brain size to its expected brain size for a given mass, using the
formula EQ = Ea/Ee, where Ea is the actual brain mass and Ee the expected brain mass (Jerison,
1973; in my study, Ea and Ee are referred to aBrW and eBrW, respectively). To calculate an
expected brain weight, I used Snell’s (1892) equation for simple allometry (Williams, 2002),
with equation E = axᵇ, where E is the expected brain mass, x the body mass, a an allometric
coefficient, and b the allometric component. To calculate EQ values, the body weight in fresh
state for each species was needed. The body mass data for specimens of Psuedocarcharias
kamoharai and Scyliorhinus retifer when captured were available from each respective museum

8
of origin. Data from the brain of Megachasma pelagios and Cetorhinus maximus in fresh state
were taken from Ito et al. (1999) and Kruska’s (1988) work, respectively. For other lamniform
taxa, I estimated the original body weight of each examined specimen using conversion
equations that show the relationship between the body weight (BoW) and total length (TL) in
literature: BoW = 2.02 × 10⁻⁸TL3.906 for Mitsukurina owstoni (Yano et al., 2007); BoW = 1.3 ×
10-4TL2.4 for Carcharias taurus (Goldman et al., 2006); BoW = 2.166 × 10⁻⁶TL3.189 for
Odontaspis ferox (Fergusson et al., 2007); BoW= 4.61 × 10⁻⁵TL2.494 for Alopias pelagicus (Liu et
al., 1999); BoW = 9.1069 × 10⁻⁶TL3.0802 for A. superciliosus (Kohler et al., 1996); BoW = 1.8821
× 10-4TL2.5188 for A. vulpinus; BoW = 7.5763 × 10⁻⁶TL3.0848 for Carcharodon carcharias (Kohler
et al., 1996); BoW = 5.2432 × 10⁻⁶TL3.1407 for Isurus oxyrinchus (Kohler et al., 1996); BoW =
4.4 × 10⁻⁵ TL2.875 for Lamna ditropis (Goldman and Musick, 2006); and BoW = 1.4823 ×
10-5TL2.9641 for L. nasus (Kohler et al., 1996). Because such a conversion equation is not
available for I. paucus to my knowledge, I generated my own conversion equation, BoW = 4.00
×
10-5TL2.7024, (r2 = 0.952) based a total of eight individuals of the species with reported TL
(range: 92–372.8 cm) and BoW (range: 5.2–351 kg) data, including two full-term embryos
(Guitart-Manday, 1966, 1975; Gilmore, 1983; Queiroz et al., 2007; Bustamante et al., 2009;
Wakida-Kusunoki and Ande-Fuente, 2012).
C. PILOT STUDY
A possible concern for this study is brain shrinkage that could have occurred because of
fixation in preserved specimens. However, Kruska (1988) found that the brain of the basking

9
shark (Cetorhinus maximus) shrunk uniformly across the five brain regions (Fig. 1B) after
alcohol fixation. To confirm Kruska’s (1988) observation and to take the possible shrinkage
factor into consideration for my study, I conducted an experiment as a pilot study on eight ‘fresh’
specimens of Squalus acanthias and treated them through typical fixation and preservation
processes for long-term storage of fish specimens in museums collections (Emmanuel et al.,
2012). First I extracted all eight brains with the same procedure described above and measured
each of their body mass (BoW), total length (TL), and brain mass in fresh state (FrBrW) (note
that the eight individuals were organized from the smallest TL to the largest TL in sequence and
were assigned consecutive catalogue numbers). Second, I submerged the brains completely in
10% formaldehyde for 10 days and measured the formaldehyde-treated brain mass (FoBrW) of
each specimen in order to measure any change as a result of specimen fixation. I then discarded
the formaldehyde and placed the brains in 70% ethanol for 10 days to measure the ethanol-
treated brain mass (EtBrW) in order to examine any effects of alcohol preservation on the shark
brains.
My experiment reveals that all the eight brain samples of Squalus acanthias (now
cataloged as FMNH 141885-1 through 141885-8) increased in mass by an average of 10.6%
through formaldehyde fixation and subsequently decreased in mass by an average of 35.5% after
ethanol preservation (Table 1). Because of the significantly large changes in brain weights that
warrant consideration for the preserved specimens I examined, I made an assumption that all the
preserved specimens I examined had also gone through an average of 35.5% decrease in brain
mass through their formaldehyde fixation and alcohol preservation processes and factored the
changes into their brain weight data. Once the putative amount of shrinkage was determined, I
then examined whether or not the brains of S. acanthias had shrunk uniformly across all brain

10
regions. For this examination, I cut four of the eight brain samples (FMNH 141885-2, 141885-4,
141885-6, and 141885-8) into the five brain regions and measured what proportion each brain
region comprised the total brain (Table 2; note that the other four brain samples were chosen to
be kept intact). I then compared my data to the comparable data for S. acanthias presented by
Yopak et al. (2007), who examined three brain samples in fresh state for the species. Because my
data and Yopak et al.’s (2007) data are very close (Table 2), I determined Kruska’s (1988)
observation that each brain shrunk uniformly across the five brain regions (Fig. 1B) to be valid,
allowing me to assume that it is also the case for the preserved specimens I examined.
D. REGRESSION-BASED COMPARATIVE ANALYSES
Based on my compiled data for the 14 lamniform species examined, I conducted three
separate regression analyses. For the first analysis, I obtained independent contrasts by log10
transformation of my brain mass and body mass data to allow regression with the brain mass in
terms of weight as the dependent variable, where positive scaling has been noted previously in
some other taxonomic orders of sharks (Bauchot et al., 1976; Northcutt, 1977, 1978; Myagkov
and Hirnforsch, 1991; Yopak et al., 2007, 2019; Yopak and Montgomery, 2008). My second
analysis entails a regression analysis between the cerebellar foliation index (FI) and 'brain size' in
the form of encephalization quotient (EQ) with FI as the dependent variable. My third regression
analysis also examines the relationship of FI with the 'brain size' but in terms of the effects of
body weight and brain weight where FI is the dependent variable like the second analysis. On my
second and third analyses is to examine if brain size increases as foliation increases and if raw
brain weights over raw body weights are a predictor of cerebellar foliation, respectively.

11
E. CHARACTER MAPPING
I employed character mapping (Harvey and Pagel, 1991) to examine the evolutionary
pattern of the brain through lamniform phylogeny using the scyliorhinid carcharhiniform,
Scyliorhinus retifer, as an outgroup. The EQ and FI for each of the ingroup (14 of the 15
lamniforms species examined) and outgroup species were mapped onto two separate published
phylogenetic trees. One of them is Compagno’s (1990) morphology-based tree that represents
the first proposed phylogenetic interrelationships of all extant lamniform species. Although
Compagno’s (1990) tree has some shortcomings (Shimada, 2005), subsequent morphology-based
phylogenetic studies (Shirai, 1996; Shimada, 2005; Stone and Shimada, in press) have shown
little conflict with Compagno’s (1990) tree topology. Another phylogenetic tree used for my
character mapping is a molecular-based tree presented by Martin et al. (2002). Martin et al.’s
(2002) tree includes all the lamniform genera with the most resolved depiction of their
interrelationships that are largely consistent with other molecular studies (e.g., Martin and
Naylor, 1997; Naylor et al., 1997, 2012; Heinicke et al., 2009). Morphology-based trees typically
differ significantly from molecular-based trees in the position of Carcharias, Odontaspis,
Pseudocarcharias, Megachasma, and Alopias, but both types of trees generally place
Mitsukurina as phylogenetically the most basal taxon among extant lamniforms and that
Cetorhinus and Lamnidae (Lamna, Isurus, and Carcharodon) form a derived monophyletic clade
(Stone and Shimada, in press). In my study, Scyliorhinus retifer is depicted as a sister to a clade
that includes all the lamniform taxa, where the sister relationship between Carcharhiniformes and
Lamniformes is well supported by a variety of phylogenetic studies of elasmobranchs (e.g.,

12
Shirai, 1996; Maisey et al., 2004; Human et al., 2006; Heinicke et al., 2009; Naylor et al., 2012;
da Cunha et al., 2017; Amaral et al., 2018).
III. RESULTS
A. DESCRIPTION OF BRAINS
1. General Observations
Figure 3 shows the brains of all 14 lamniform species examined (Fig. 2) in dorsal and left
lateral views, whereas the brain of Scyliorhinus retifer is illustrated in Figure 1A. Within
Lamniformes, the brain shape shows considerable variations, although interspecific similarities
within each family are also present. One noticeable difference is with Alopiidae in which all
Alopias spp. have a short, dorsoventrally thick myelencephalon, whereas the myelencephalon of
other lamniform taxa are long and thin. The myelencephalon of Megachasma pelagios is also
unique in that it is dorsoventrally thin but laterally broad compared to all other lamniform taxa.
Another noteworthy difference is with the brains of Odontaspis ferox and Pseudocarcharias
kamoharai in which they are anteroposteriorly elongated and laterally compressed compared to
all other lamniforms. When comparing the shape of the brains of Lamniformes (Fig. 3) with the
brain of Scyliorhinus retifer (Fig. 1A), one major difference is with the telencephalon where it is
triangular in S. retifer with several gyri towards its anterior end that are absent in all lamniforms.
Table 3 shows my primary quantitative data compared with the brain data presented by
Yopak et al. (2007) where the foliation index (FI) and encephalization quotient (EQ) are of
particular interests in my study. One notable difference between my study and Yopak et al.'s

13
(2007) report is with the FI of Alopias superciliosus in which Yopak et al. (2007) scored 4 for
the species, whereas I scored 5. However, it is noteworthy that all other assignments of FI values
are identical for species that were represented in both studies, including Scyliorhinus retifer.
Another difference is with some variation in EQ values. For example, my EQ values for
Carcharias taurus and Isurus oxyrinchus represented by juvenile specimens are substantially
larger than Yopak et al.'s (2007) data that were based on adult specimens. On the other hand, my
EQ values for Pseudocarcharias kamoharai and A. superciliosus are substantially smaller than
Yopak et al.'s (2007) data. Nevertheless, the overall relative quantitative relationships among
species in my study are similar to those of Yopak et al.'s (2007) study except for I. oxyrinchus
For example, the EQ values for C. taurus and Carcharodon carcharias are the smallest (<0.75),
those for Alopias spp. the highest (>1.00), and P. kamoharai in between those two extremes
(0.75‒1.00) in both studies. It is particularly noteworthy that A. vulpinus has largest EQ value
relative to all other lamniform taxa examined in both studies.
Table 4 shows the percent size of each of the five brain regions relative to the total brain
size of examined species compared with the percent values of comparable taxa reported by
Yopak et al. (2007). There are some minor differences between my data and Yopak et al.'s
(2007) data. For example, in Pseudocarcharias kamoharai, the mesencephalon is larger than the
myelencephalon in my study, whereas the former is smaller than the latter in Yopak et al.'s study.
In Alopias vulpinus and Scyliorhinus retifer, the metencephalon is larger than the
myelencephalon in my study, whereas the former is smaller than the latter in Yopak et al.'s
(2007) study. Nevertheless, the proportional relationships among the five brain regions (or 'brain
organization') as well as their quantitative values for each species in my study are overall very
similar to those of Yopak et al. (2007).

14
2. Brain Anatomy by Taxa
Mitsukurinidae—The specimen of Mitsukurina owstoni (FMNH 117742: 126.5 cm TL)
was calculated to have a body weight (BoW) of 3.28 kg. Its actual brain weight (aBrW) was 1.94
g with a FI of 3. Using the 35.5% weight reduction based on my pilot study (see above), the
expected brain weight (eBrW) was 2.63 g. Using the eBrW and Snell’s (1892) equation for
simple allometry, EQ was found to be 0.55 (Table 3). The brain organization of M. owstoni was
found to be 34.55% telencephalon, 8.76% diencephalon, 9.79% mesencephalon, 21.13%
metencephalon, and 25.77% myelencephalon (Table 4). The brain of M. owstoni was illustrated
by Garman (1913, plate 40) and Masai et al. (1973, figs. 1–8) in which its morphology conforms
to the specimen I examined.
Odontaspididae—The specimen of Carcharias taurus (FMNH 16136: 106 cm TL, was
calculated to have a BoW of 9.43 kg, whereas the BoW in Odontaspis ferox (BPBM 9335: 297
cm TL) was calculated to be 166.83 kg. The aBrW of C. taurus was measured at 3.58 g with a FI
of 3 (same FI value as Yopak et al., 2007: Table 3), whereas the aBrW of O. ferox was found to
be 6.81 g with a FI of 3. Using the 35.5% weight reduction from my pilot study (see above), the
eBrW for C. taurus was determined to be 4.85 g, whereas that for O. ferox was calculated to be
9.26 g. Using the eBrW and Snell’s (1892) equation for simple allometry, the EQ of C. taurus
and O. ferox was 0.57 (vs. 0.37 by Yopak et al., 2007) and 0.23, respectively (Table 3). The
brain organization of C. taurus was found to be 33.00% telencephalon, 10.70% diencephalon,
9.98% mesencephalon, 23.90% metencephalon, and 22.42% myelencephalon (Table 4). The
brain organization of O. ferox was found to be 22.80% telencephalon, 7.42% diencephalon,
14.54% mesencephalon, 18.90% metencephalon, and 36.34% myelencephalon (see Table 4 that
also included brain organization data of Yopak et al., 2007). The brain of C. taurus was

15
illustrated by Garman (1913, plate 41) in which its morphology conforms to the specimen I
examined. To my knowledge, the specimen of O. ferox depicted in Figure 3 represents the first
illustration of the brain of that species. The brain morphology of another species of Odontaspis,
O. noronhai, remains unknown.
Pseudocarchariidae—The two specimen of Pseudocarcharias kamoharai, BPBM 37113
(111 cm TL; 4.02 kg BoW) and FMNH 117474 (98.1 cm TL; 3.80 kg BoW), were examined and
their measurements were averaged where the average TL and BoW were 104.55 cm and 3.91 kg,
respectively. The aBrW of BPBM 37113 was found to be 3.05 g and that of FMNH 117474 2.76
g, averaging to an aBrW of 2.90 g with a FI of 2 (same FI value as Yopak et al., 2007: Table 3).
Using the 35.5% weight reduction from my pilot study (see above), the eBrW for BPBM 37113
was calculated to be 4.13 g and that for FMNH 117474 3.74 g, giving an average eBrW of 3.93
g. Using the average eBrW and Snell’s (1892) equation for simple allometry, the EQ was found
to be 0.75 (vs. 0.92 by Yopak et al., 2007: Table 3). The brain organization of P. kamoharai
(averages) was found to be 33.86% telencephalon (32.22% in BPBM 37113 and 35.50% in
FMNH 117474), 7.00% diencephalon (7.30% in BPBM 37113 and 6.70% in FMNH 117474),
21.37% mesencephalon (20.28% in BPBM 37113 and 22.46% in FMNH 117474), 17.68%
metencephalon (18.11% in BPBM 37113 and 17.25% in FMNH 117474), and 19.91%
myelencephalon (21.73% in BPBM 37113 and 18.09% in FMNH 117474) (see Table 4 that also
included brain organization data of Yopak et al., 2007). Lisney and Collins (2006, fig. 2b)
illustrated a brain of P. kamoharai in which its morphology conforms to the specimen I
examined.
Megachasmidae—The brain of Megachasma pelagios (NSMT-P 134785) comes from a
544-cm-TL individual originally illustrated and described by Ito et al. (1999). It came from an

16
individual that had a BoW of 1,040 kg, where Ito et al. (1999) also reported the aBrW of 19.80 g.
Whereas it has a FI of 2, its eBrW was not needed because the brain mass was taken when the
specimen was fresh. Using the aBrW and Snell’s (1892) equation for simple allometry, the EQ
was found to be 0.18 (Table 3), that marked the smallest brain among all the lamniforms
examined in my present study. The brain organization of M. pelagios was found to be 22.98%
telencephalon, 10.90% diencephalon, 13.75% mesencephalon, 12.22% metencephalon, and
40.15% myelencephalon (Table 4).
Alopiidae—The BoW for the specimen of Alopias pelagicus (FMNH 117473, 169.9 cm
TL), A. superciliosus (UF 178509, 200.7 cm TL), and A. vulpinus (SIO 64-804A, 144.80 cm TL)
was calculated to have 16.59, 55.36, and 14.06 kg, respectively. The aBrW of A. pelagicus was
8.03g with a FI of 5. The aBrW of A. superciliosus was found to be 13.41g with a FI of 5, that
differs from the findings by Yopak et al. (2007) who reported a FI of 4 (Table 3). My decision of
assigning a FI of 5 to A. supercilious stems from the fact that the cerebellum of A. supercilious is
1) more foliated than that of any of the taxa in the family Lamnidae (see below) with a FI of 4,
and 2) more similar to that of A. pelagicus and A. vulpinus that exhibit a longitudinal fissure and
distinctive cerebellar sections. The aBrW of A. vulpinus was 4.64 g with a FI of 5 (same FI value
as Yopak et al., 2007: Table 3). Using the 35.5% weight reduction from my pilot study (see
above), the eBrW for A. pelagicus, A. superciliosus, and A. vulpinus was calculated to be 10.88,
18.17, and 6.30 g, respectively. Using the eBrW and Snell’s (1892) equation for simple
allometry, the EQ of A. pelagicus, A. superciliosus, and A. vulpinus was calculated to be 1.45,
1.03, and 1.66 (vs. 1.28 for A. superciliosus and 1.71 for A. vulpinus by Yopak et al., 2007: Table
3). The brain organization of A. pelagicus was found to be 30.83% telencephalon, 2.20%
diencephalon, 17.00% mesencephalon, 30.42% metencephalon, and 19.55% myelencephalon

17
(Table 4). The brain organization of A. superciliosus was found to be 24.64% telencephalon,
3.41% diencephalon, 16.40% mesencephalon, 30.01% metencephalon, and 25.54%
myelencephalon (see Table 4 that also included brain organization data of Yopak et al., 2007).
The brain organization of A. vulpinus was found to be 26.40% telencephalon, 1.30%
diencephalon, 14.50% mesencephalon, 31.40% metencephalon, and 26.40% myelencephalon
(see Table 4 that also included brain organization data of Yopak et al., 2007). The brain of A.
superciliosus was illustrated by Lisney and Collins (2006, fig. 2a) and that of A. vulpinus by
Kajiura et al. (2010, fig. 2.9C [sic]) and Yopak and Lisney (2012, fig. 2a) in which each of their
morphology conforms to the brain of respective species I examined. I am not aware of any
published illustration of the brain of A. pelagicus, and if so, Figure 3 would represent the first
depiction of its morphology.
Cetorhinidae—Kruska (1988) examined and illustrated a brain of Cetorhinus maximus
that measured 375 cm TL and 385 kg BoW, and my brain data largely come from Kruska's
(1988) study. The aBrW measured by Kruska (1988) was 20.70 g, whereas I determined its FI to
be 4 based on Kruska's (1988) dorsal and lateral images of the brain (reproduced in Fig. 3). The
eBrW was not needed because the brain mass was taken in fresh state. Using the aBrW and
Snell’s (1892) equation for simple allometry, the EQ was found to be 0.33 (Table 3). The brain
organization of C. maximus was found to be 34.00% telencephalon, 5.00% diencephalon, 9.00%
mesencephalon, 30.00% metencephalon, and 22.00% myelencephalon (Table 4).
Lamnidae—The specimen of Carcharodon carcharias (LACM 56960-1, 209.25 cm
TL), Isurus oxyrinchus (SIO 55-85, 82.80 cm TL), I. paucus (FMNH 135411, 237.7 cm TL),
Lamna ditropis (FMNH 117475, 151.3 cm TL), and L. nasus (ROM 22751, 84.7 cm TL) was
calculated to have a BoW of 84.82, 4.36, 105.45, 81.37, and 5.89 kg, respectively, and an aBrW

18
of 10.16, 4.42, 12.37, 4.89, and 3.56 g, respectively. All species in this family had a FI of 4
(same FI value as Yopak et al., 2007, who included data from C, carcharias and I. oxyrinchus:
Table 3). Using the 35.5% weight reduction from my pilot study, the eBrW for C. carcharias, I.
oxyrinchus, I. paucus, L. ditropis, and L. nasus was calculated to be 13.77, 5.98, 16.76, 6.63, and
4.83 g, respectively, with the EQ of 0.49, 1.08, 0.56, 0.24, and 0.74, respectively (vs. 0.41 for C.
carcharias and 0.60 for I. oxyrinchus by Yopak et al., 2007: Table 3). The brain organization of
C. carcharias, I. oxyrinchus, I. paucus, L. ditropis, and L. nasus was found to be, respectively:
38.48, 37.57, 38.40, 25.20, and 28.15% telencephalon; 4.85, 4.03, 4.90, 4.10, and 3.27%
diencephalon; 16.58, 16.50, 18.40, 21.15, and 19.38% mesencephalon; 17.89, 20.50, 17.90,
26.85, and 27.15% metencephalon; and 22.20, 21.40, 20.40, 22.70, and 22.05% myelencephalon
(see Table 4 that also included brain organization data of C. carcharias and I. oxyrinchus by
Yopak et al., 2007). Brains of C. carcharias, I. oxyrinchus, and L. ditropis have been illustrated
in literature, including papers by Gilbert (1963, fig. 7), Demski and Northcutt (1996, figs. 1, 2),
Kajiura et al. (2010, fig. 2.9D [sic]), and Schaffer et al. (2013, fig. 1.1), where each of their
overall morphology conforms to the specimen of respective species I examined. I am not aware
of any published illustration of the brain of I. paucus or L. nasus, and if so, Figure 3 would
represent the first depiction of its morphology.
Scyliorhinidae (outgroup)—Two specimen of Scyliorhinus retifer (CUMV 45864-A,
33.6 cm TL; and CUMV 45864-B, 37.8 cm TL) were examined that had an average TL of 35.70
cm. According to the museum catalog, CUMV 45864-A and CUMV 45864-B had a BoW of
0.15 and 0.18kg, respectively, with an average BoW of 0.16 kg. The aBrW for CUMV 45864-A
and CUMV 45864-B was found to be 0.49 and 0.58 g, respectively, with an average aBrW of
0.53 g. Both specimens exhibited a FI of 1 (same FI value as Yopak et al., 2007: Table 3). Using

19
the 35.5% weight reduction from my pilot study (see above), the average eBrW was calculated to
be 0.72 g. Using the average eBrW and Snell’s (1892) equation for simple allometry, the average
EQ was found to be 0.78 (Table 3; note that EQ of this species was not reported by Yopak et al.,
2007). The brain organization of S. retifer (averages) was 48.67% telencephalon (49.07% in
CUMV 45864-A and 48.27% in CUMV45864-B), 8.30% diencephalon (7.33% in CUMV
45864-A and 9.27% in CUMV 45864-B), 10.28% mesencephalon (9.61% in CUMV 45864-A
and 10.95% in CUMV 45864-B), 16.69% metencephalon (16.58% in CUMV 45864-A and
16.80% in CUMV 45864-B), and 16.06% myelencephalon (17.41% in CUMV 45864-A and
14.71% in CUMV 45864-B) (see Table 4 that also shows Yopak et al.’s, 2007, data). The brain
of Scyliorhinus has been illustrated in literature, including the work on S. canicula by Ridet et al.
(1973, figs. 3, 4), showing nearly identical morphology observed in the specimens I examined.
REGRESSION-BASED COMPARATIVE ANALYSES
Figure 4 shows my regression analysis that investigates whether or not the brain mass has
any relationship with the body mass in lamniforms. The log10 transformed regression line with an
equation of y = 0.323x + 0.478 and r2 of 0.797 was found to be statistically significant (p ˂
0.0001), suggesting the presence of a strong positive correlation between brain size and body
size. The regression line shows that Mitsukurina owstoni, Carcharias taurus, Odontaspis ferox,
Pseudocarcharias kamoharai, Megachasma pelagios, Lamna ditropis, and L. nasus have a brain
smaller than expected for a shark of that respective size, whereas the overall brain size of all
three Alopias spp. as well as Carcharodon carcharias, Isurus oxyrinchus, and I. paucus is found
to be larger than expected for a shark of that respective size. On the other hand, my analysis
shows that Cetorhinus maximus has a brain mass expected for a shark of that size.

20
Figure 5 shows two regression analyses examining whether or not the FI-based cerebellar
complexity in lamniform sharks is depended by the brain size in terms of EQ (Fig. 5A) and
aBrW/BoW (Fig. 5B). The regression line between the EQ and FI with an equation of y = 1.490x
+ 2.644 and r2 of 0.434 (Fig. 5A) has a statistically significant (p = 0.0125) positive correlation,
meaning that sharks with a larger brain tend to have a more foliated cerebellum. On the other
hand, the regression line between the aBrW/BoW and FI (Fig. 5B) that has an equation of y =
0.265x + 3.617 and r2 of 0.007 shows no significance (p = 0.7803), suggesting that the body
weight over brain weight has no effect on the cerebellar complexity.
CHARACTER MAPPING
Figure 6 shows mapping of my FI and EQ data onto a morphology-based phylogenetic
tree (Fig. 6A) and a molecular-based phylogenetic tree of the order Lamniformes, both with
Scyliorhinus retifer as an outgroup (Fig. 6B) (note: explanation about ‘oEQ’ in Figure 6 provided
in Discussion below). Scyliorhinus retifer has an FI of 1, whereas all the lamniform taxa have FI
values of 2 or higher. On the other hand, the relative brain size in terms of EQ within
Lamniformes shows no apparent trends in both trees. The three species of Alopias have higher
EQ values relative to most other lamniforms, but sister taxa in many other clades (e.g., Isurus
and Lamna clades in both trees as well as the Pseudocarcharias-Megachasma clade in the
molecular-based tree), are represented by both low and high EQ values.

21
IV. DISCUSSION
A. SOURCES OF VARIATION
1. Sample-Based Variation
The comparison of FI data between my study and Yopak et al.'s (2007) study reveals that
FI values are remarkably consistent intraspecifically (Table 3) where the only minor difference
observed was for Alopias superciliosus (FI of 4 vs. 5: see above). On the other hand, whereas the
EQ for A. vulpinus and C. carcharias was similar between the two studies, the EQ for
Carcharias taurus, P. kamoharai, A. supercilious and I. oxyrinchus was noticeably different
(Table 3). Although calibrating an EQ value is sensitive to the body mass used, such intraspecific
differences in brain size could at least in part be attributed to the differences in ontogenetic age
among shark individuals examined, where the majority of the brain growth in vertebrates is
generally known to occur while an individual is still young (Dekaban and Sadowsky, 1978;
Leigh, 2004; Cofran, 2019). Yopak et al.’s (2007) specimens of C. taurus (152.4 kg BoW) and I.
oxyrinchus (n = 3 with an average of 186.53 kg BoW) were mature, whereas the specimens of
these two species in my study were very young (4.44 and 4.36 kg BoW, respectively). Using
such young specimens could result in larger brain sizes relative to the body sizes as the growth of
the body might simply not have caught up to the growth of the brain. Nevertheless, it is
noteworthy that taxa with higher EQ values in one data set are generally also higher in the other
data set relative to taxa with lower EQ values, suggesting that different EQ values for each
species are still collectively characterizing the brain size attribute for that species.

22
My data also show that similar effects of age differences could also be at play when
comparing the data interspecifically (Table 3). For example, my specimen of Isurus oxyrinchus
is much smaller than that of I. paucus, measuring 4.36 and 105.45 kg BoW, respectively, where
I. oxyrinchus has a substantially larger EQ value (1.08) than I. paucus (0.56). Similarly, the
specimen of Lamna nasus in this study is considerably smaller than that of L. ditropis, weighing
5.89 and 81.37 kg BoW, respectively, where L. nasus has a larger EQ value (0.74) than L.
ditropis (0.24). Because the two species are phylogenetically sisters and live in similar
environments (Compagno, 1990, 2002; Naylor et al., 2012; Ebert et al., 2013), one would expect
the EQ of both species of each genus to be similar. The discrepancies in my data appear to
suggest the possible presence of ontogenetic effects on brain size, but more samples are needed
to substantiate the degree to which ontogenetic differences impact EQ values.
Another source of variation in EQ values could be the amount of brain shrinkage. Kruska
(1988) noted that the brain of Cetorhinus maximus shrunk by 51% after alcohol preservation.
Such a large level of shrinkage would substantially affect the calibrated EQ. To compensate for
this shrinkage effect, I applied the assumption of the 35.5% reduction based on my pilot study
(Table 1) for adjustment to the brain mass data for specimens preserved in alcohol. Although the
35.5% reduction is considerably conservative than the 51% reduction observed by Kruska
(1988), it should be pointed out that Kruska's (1988) specimen of C. maximus represents the
largest brain among all the brain specimens I examined where it is likely that the shrinkage rate
may be higher than the remaining brain specimens that are smaller. The fact that the brain sizes
of specimens I examined in this study are equivalent or smaller than Kruska's (1988) specimen of
C. maximus, justifies that the 35.5% reduction is a reasonable, conservative proxy to the general
shrinkage rate for alcohol-preserved brains of typical lamniforms, if not all the chondrichthyans.

23
2. Regression-Based Interspecifc Variation
The log10 transformed regression was calculated to examine any correlation between
brain weight and body weight. Previous studies found that brain mass scales positively with body
mass in sharks (Bauchot et al., 1976; Northcutt, 1977, 1978; Myagkov and Hirnforsch, 1991;
Yopak et al., 2007, 2019; Yopak and Montgomery, 2008). The results of my regression analysis
(Fig. 4) suggest that such a positive scaling is also present in the order Lamniformes.
My regression analysis examining the relationship between FI and EQ shows a strong
positive correlation (Fig. 5A). This result is consistent with previous studies on mammalian
brains (Toro et al., 2008; Germanaud et al., 2012), suggesting that, at least for lamniforms, a
more foliated brain requires a larger metencephalon (cerebellum), thus increasing the overall
brain size in terms of EQ. Conversely, a less foliated brain would not need a larger brain.
My regression analysis showing body weight divided by the actual brain weight and how
it correlates with cerebellar foliation shows no correlations (Fig. 5B). This result indicates that
body size does not affect the degree of cerebellar foliation. This interpretation, in turn, suggests
that the size of the body is independent of the size of its brain at least in Lamniformes.
B. FUNCTIONAL IMPLICATIONS
1. General Background
Different parts of the brain (Fig. 1B) have different functions. For example, the
telencephalon, that largely consists of the cerebrum, is responsible for memory formation and
storage (Martin, 2003) including recognition of individuals (Gold et al., 2012). The
telencephalon is also for somatosensation (Berlucchi and Vallar, 2018) in response to stimuli like

24
temperature, pain, pressure, and vibration, and processes sensory information such as sound,
taste, smell, touch (Angel, 1977), and quite possibly electromagnetism as well. The diencephalon
relays sensory information among different brain regions and controls many
autonomic functions of the peripheral nervous system (Penfield, 1934). The mesencephalon,
which largely consists of the optic lobe, is responsible for coordination of the eye as well as
visual and auditory processing (Kurkcuoglu, 2017). The metencephalon that mostly consists of
the cerebellum controls and coordinates fine motor control and bodily movement (Haier et al.,
2004; Montgomery and Perks, 2019). The myelencephalon that largely consists of medulla
integrates afferent information from a variety of peripheral receptors and produces control
signals to effector organs for appropriate physiological responses (Ciriello et al., 1986). Based on
these region-specific functional differences, it is reasonable to assume that different sharks with
different lifestyles would have different types of brain organization.
2. Telencephalon
My brain organization data (Table 4) show that, among lamniforms, Carcharodon
carcharias and Isurus spp. have the largest telencephalon (ca. 38% of the total brain). Their large
telencephalon likely reflects their acute sense of smell, where their capacity to swim fast due to
regional endothermy (or heterothermy: Katz, 2002; see below for additional discussion) may be a
strategy to reach a distant food source detected through sensitive olfaction faster than most other
animals with similar diet preferences. On the other hand, Odontaspis ferox and Megachasma
pelagios have the smallest telencephalon (ca. 23% of the total brain) among lamniforms (Table
4). Whereas the possible explanation for the small telencephalon in M. pelagios is discussed
below, this fact for O. ferox is intriguing because the biology of the species is still poorly

25
understood (e.g., see Fergusson et al., 2007). It may indicate that O. ferox does not rely on smell
for prey capturing that is known to feed on small fish and invertebrates such as squid
(Compagno, 2002; Fergusson et al., 2007).
It is noteworthy that the scyliorhinid carcharhiniform, Scyliorhinus retifer, I examined for
comparison has even larger telencephalon than species of Carcharodon and Isurus, taking up as
much as almost 49% of the total brain (Table 4). Scyliorhinids are for the most part benthic
sharks that regularly feed on benthic fishes and invertebrates and hunt by searching crevices in
rocks using its acute sense of smell and ampullae of Lorenzini (Compagno, 1984; Ebert et al.,
2013). Their reliance on smell and electromagnetic signals is the likely driving factor for their
enlarged telencephalon, where it is worth pointing out that extant members of Lamniformes do
not include benthic forms equivalent to scyliorhinids.
3. Diencephalon
My brain organization data (Table 4) indicate that, among lamniforms, Carcharias taurus
and Megachasma pelagios, followed by Mitsukurina owstoni, have the largest diencephalon in
relation to the rest of the brain, whereas Alopias pelagicus and particularly A. vulpinus have the
smallest diencephalon. Carcharias, Megachasma, and Mitsukurina are all generally
characterized as sluggish swimmers (Compagno, 1984, 2002; Ebert et al., 2013). A larger
diencephalon observed in these sharks would mean that there would be more distance for sensory
information to travel within it, so the large diencephalon present in these sharks makes sense
because they do not require rapidly relaying sensory information within the brain or quickly
controlling autonomic functions of the peripheral nervous system. Likewise, A. pelagicus and A.
vulpinus exhibiting a small diencephalon makes sense because they are known to engage in rapid

26
and complex maneuvering of the body and caudal fin to hunt for prey (Aalbers et al., 2010;
Oliver et al., 2013: see below for further discussion on Alopias spp.). Their small diencephalon is
likely to minimize the traveling distance for rapid transmission of sensory information, including
enhanced autonomic functions.
4. Mesencephalon
My brain organization data (Table 4) show, within Lamniformes, that Pseudocarcharias
kamoharai has the largest mesencephalon relative to the rest of the brain, whereas the following
taxa also have a relatively large (>15%) mesencephalon: Alopias pelagicus, A. superciliosus,
Carcharodon carcharias, Isurus spp., and Lamna spp. Although the biology of P. kamoharai and
A. superciliosus is poorly understood, they together with A. pelagicus have large eyes relative to
their body (Compagno, 1984, 2002; Ebert et al., 2013), and the large mesencephalon that would
allow better eye coordination and visual processing in these sharks makes sense. All lamnids
(Carcharodon, Isurus, and Lamna) also have relatively large mesencephalon, suggesting that
they too have better eye coordination and visual acuity relative to other lamniforms presumably
aiding for hunting active prey (for their biology, see Compagno, 1984, 2002).
It is worth noting that, unlike A. pelagicus and A. superciliosus, A. vulpinus has a
relatively small mesencephalon. However, where A. pelagicus and A. superciliosus are
ectothermic, A. vulpinus is known to be endothermic to maintain its brain and eye muscles above
the ambient water temperature like lamnids (Dickson and Graham, 2004; Patterson et al., 2011).
Because warming of the brain and eye muscles has shown to improve reaction time (Fritsches et
al., 2005; Helfman et al., 2009), its endothermy may help increasing its visual acuity to
compensate for its relatively small size of the mesencephalon (see below for further discussion).

27
All other lamniform sharks (Mitsukurina, Carcharias, Odontaspis, Megachasma, and
Cetorhinus) are ectothermic with a relatively small (<15%) mesencephalon (Table 4), suggesting
that their visual reliance is comparably less than the aforementioned taxa.
5. Metencephalon
My brain organization data (Table 4) indicate that all Alopias spp. and Cetorhinus
maximus, followed by Lamna spp., have a large (>25%) metencephalon among lamniforms. The
enlarged metencephalon (or cerebellum) along with an exceptionally high FI value (FI of 5) in
Alopias spp. is likely associated with their complex hunting behavior to stun pray using their
caudal fin, requiring fine motor control of the body (Aalbers et al., 2010; Oliver et al., 2013: see
below for further discussion). On the other hand, the relatively large metencephalon in C.
maximus is rather puzzling because it is generally characterized as a slow-swimming shark.
However, its highly migratory behavior to search for food does demand significant body
movement (Skomal et al., 2009; Hueter et al., 2013), and it even exhibit breaching behavior
occasionally (Hayes et al., 2018), suggesting that C. maximus may have more active lifestyle
than it is typically perceived. The rather large metencephalon (ca. 27%) for Lamna spp. is
intriguing given that other lamnids (Carcharodon and Isurus) with a large telencephalon have a
relatively small metencephalon. This difference is also somewhat puzzling. However, because all
lamnids have regional endothermy (see above) that likely result in an increase in agility and
improved reaction time which in turn has been shown to increase the ability to receive and
synchronize information to and from the peripheral nervous system (Garg et al., 2013), it is
possible that the relatively small metencephalon in C. carcharias and Isurus spp. functions as
well as Lamna spp. and ectothermic taxa with a larger metencephalon (see below for further

28
discussion). It should be added that, among lamniforms, an exceptionally small (12%)
metencephalon is present in Megachasma pelagios that agrees well with its exceptionally
sluggish lifestyle (see Compagno, 2002, and references therein).
6. Myelencephalon
My data (Table 4) show that, among the lamniforms examined, Megachasma pelagios
has an exceptionally enlarged myelencephalon (40% of the total brain), followed by Odontaspis
ferox (36%), whereas all other lamniforms have a myelencephalon that takes up only 20–26% of
the total brain. Whereas the biology of both O. ferox and M. pelagios is still poorly known
(Fergusson et al., 2007; Watanabe and Papastamatiou, 2019), the exact significance of their large
myelencephalon is unclear where it is plausible that the condition may simply be due to smaller
sizes of their other brain regions because the brain organization in this study is measured based
on the proportions of the five brain regions relative to the total brain size.
C. ECOLOGICAL IMPLICATIONS
1. Deep-water Sharks
There have been numerous studies on the physiology and sensory specialization of deep-
water vertebrate species (e.g., Angel, 1997; Merrett and Haedrich, 1997; Douglas et al., 1998;
Wagner et al., 1998; Herring, 2000; Warrant, 2000; Warrant and Locket, 2004). However, the
question about exactly how neural characteristics on deep-water sharks have evolved in response
to the demands of the deep-water has remained largely unaddressed until recently. Yopak and
Montgomery (2008) examined 12 species of deep-water sharks and found that they all exhibit a

29
metencephalon with a low FI (1 or 2), small encephalization, and small telencephalon. However,
their study did not contain any deep-water sharks in the order Lamniformes.
Although about half of the 15 extant lamniform species (Fig. 2) are reported from water
depth equal to, or greater than, 1,000 m (Weigmann, 2016), Mitsukurina owstoni is one taxon
generally characterized as a deep-water lamniform (e.g., Ebert et al., 2013) that has been
captured at depths of 1,300 m (Weigmann, 2016). Yet, my data (Tables 3, 4) show two strikingly
differences from Yopak and Montgomery’s (2008) observations on deep-water non-lamniform
sharks. First, M. owstoni has a metencephalon with a FI of 3 (Table 3). Second, the
telencephalon is large, making up about one-third (34%) of the total brain mass (Table 4). One
likely explanation for the rather well-foliated metencephalon and large telencephalon in M.
owstoni is its highly specialized mode of detecting and capturing its prey (i.e., primarily teleosts,
but also some invertebrates, such as squids, decapods, and isopods: Yano et al., 2007).
Mitsukurina owstoni uses its elongated rostrum (Fig. 2) covered in ampullae of Lorenzini to
accurately detect the position of prey electromagnetically under the rostrum (Compagno, 1984,
2002). When prey is detected, M. owstoni then protracts its highly kinetic jaws with great speed
to capture the prey item (Nakaya et al., 2016). In addition, M. owstoni has an enlarged nasal
apparatus (Masai et al., 1973) that also explains the rather large telencephalon. Therefore, the
expansion of telencephalon for enhanced olfaction and electromagnetic sensitivity in M. owstoni,
coupled with its rather well-foliated cerebellum to enhance motor control (e.g., Haier et al.,
2004) for rapid jaw protraction, represents a unique alternative mode of brain-wise deep-water
adaptation in sharks. Such an adaptation of M. owstoni is considered vital for its survival in the
dark waters, particularly considering its sluggish swimming mode (see Nakaya et al., 2016).

30
2. Filter Feeders
There are three extant species of filter-feeding sharks: Rhincodon typus
(Orectolobiformes: Rhincodontidae), Megachasma pelagios, and Cetorhinus maximus, all of
which grow to immense sizes (Ebert et al., 2013). The brain of each of the three filter feeders has
been studied previously (Kruska, 1988; Ito et al., 1999; Yopak and Frank, 2009). However, my
present study represents the first to compare all three.
Yopak and Frank (2009) found that Rhincodon typus has a small brain, with a large
telencephalon, and a highly foliated and large metencephalon. Rhincodon typus and C. maximus
have large migration routes and migrate where food is in high quantities (Skomal et al., 2009;
Hueter et al., 2013), and Yopak and Frank (2009) attributed the large telencephalon to the social
and migratory behaviors exhibited by both species in which the similarity in their brain
organization to be the result of convergent evolution. Because the telencephalon, among its other
functions (see above), plays a role in memory formation (Martin, 2003), their need to remember
feeding grounds may also explain for their enlarged telencephalon.
In contrast, the brain organization of Megachasma pelagios is drastically different from
that of Rhincodon typus and Cetorhinus maximus. Most notably, the telencephalon and
metencephalon of M. pelagios are the smallest, or one of the smallest, among all the lamniform
taxa, whereas its diencephalon and myelencephalon are the largest in proportion among all the
lamniforms I examined (Table 4). In fact, the size of its myelencephalon marks the largest
proportion observed in any shark to date (e.g., see Northcutt, 1978; Kruska 1988; Yopak et al.,
2007, 2019; Yopak and Montgomery, 2008). These differences are striking because they show
no sign of convergent evolution of M. pelagios with the other two filter-feeding sharks (see
Yopak and Frank, 2009). At least based on one acoustic telemetry study, M. pelagios is known to

31
be a vertical migrator that moves between shallow waters at night (12–25 m) and deep waters
(120–166 m) during the days (Nelson et al., 1997; Watanabe and Papastamatiou, 2019), and
unlike R. typus and C. maximus (Compagno, 1984, 2002; Ebert et al., 2013), M. pelagios has
never been found aggregated in groups. In addition, although it has a worldwide geographic
distribution, M. pelagios is found most frequently caught or sighted along the Asian coasts where
they represent some of the biologically richest regions in the world (Grassle and Maciolek, 1992;
Fujikura et al., 2010). Taking these pieces of information into account, the small telencephalon
and metencephalon in M. pelagios may be the reflection of its solitary behavior with limited
social behavior and its preferred habitat where food is readily available all year long not
requiring the need for memorizing the best feeding grounds. The exact significance of the
exceptionally large diencephalon (except for a longer distance for neural signal to travel: see
above) and myelencephalon is uncertain, but the condition may simply be the consequence of
exceptionally small telencephalon and metencephalon as their sizes in this study are measured
based on their proportions to the total brain size.
3. ‘Weaponized’ Caudal Fins
Alopias spp. have brains distinct from all other brains in the order Lamniformes. The
most notable differences are the large, highly foliated metencephalon (Tables 3, 4; see also
Yopak et al., 2007, whose study included A. superciliosus and A. vulpinus, but not A. pelagicus).
It is known that the larger metencephalon with the higher cerebellar foliation a brain has, the
more volume with more surface area there is in the metencephalon, that in turn indicates a
greater capacity for fine, accurate motor control (Haier et al., 2004). One likely explanation for
the highly foliated metencephalon is the unique, and exceptionally complex prey hunting

32
behavior directly observed at least in A. pelagicus and A. vulpinus in which they use their
elongated caudal fin to stun small schooling fish (Aalbers et al., 2010; Oliver et al., 2013). It is
worth pointing out that the only other family of sharks that exhibit a FI of 5 is Sphyrnidae
(Sphyrna spp.: hammerhead sharks) with unique laterally protruded eyes (Yopak et al., 2007).
The high cerebellar complexity in sphyrnids may be attributed to their highly unique head
morphology that provides high maneuverability with enhanced visual field and increased surface
area and density for ampullae of Lorenzini (Kajiura, 2001; Kajiura and Holland, 2002; Kajiura et
al., 2003; McComb et al., 2009), and it is also physically used in capturing and handling prey
such as batoids (rays) (Chapman and Gruber, 2002).
It is noteworthy that Alopias vulpinus is the only member of Alopiidae with the ability to
warm its brain and eye muscles above the ambient water temperature (Goldman, 2002; Dickson
and Graham, 2004; Patterson et al., 2011). Where higher temperatures have been shown to
improve reaction time and increase the ability to receive and synchronize information to and
from the peripheral nervous system (Garg et al., 2013), the warming of the eyes and eye muscles
has been shown previously to improve the resolution of the image the eyes that capture
(Fritsches et al., 2005; Helfman et al., 2009). Alopias vulpinus also possesses the largest brain in
terms of EQ among all the lamniform sharks examined (1.66‒1.71: Table 3). Although sphyrnid
sharks with a comparable FI value (see above) have even larger brain (EQ of 2.64‒3.29: Yopak
et al., 2007) than A. vulpinus, unlike ectothermic sphyrnids, the fact that A. vulpinus has regional
endothermy in the brain makes the brain of A. vulpinus quite possibly the most derived and
efficient of all sharks, or at least certainly within Lamniformes.

33
4. Thunniform Swimmers
The family Lamnidae (Carcharodon, Isurus, and Lamna) comprises five extant species
that show regional endothery capable of keeping the brain warm (Block and Carey, 1985; Wolf
et al., 1988; Goldman, 1997; Goldman et al., 2004). Facilitated by their regional endothermy,
lamnids employ high-speed thunniform swimming and achieve their propulsory power with their
caudal fin (Donley and Shadwick, 2003; Wilga and Lauder, 2004; Watanabe et al., 2015, 2019).
These sharks are all wide-ranging, migratory species that hunt very active, agile prey, such as
scombrid and salmonid teleosts, and even pinnipeds, and cetaceans for C. carcharias (e.g.,
Compagno, 2002; Watanabe et al., 2019; Tucker et al., 2019, and references therein). My study
shows that those five species have a relatively complex brain, all marked by a FI of 4 (Table 3).
However, when only the EQ value of the largest examined individual for each lamnid species is
used for comparison (i.e., 0.41 for C. carcharias; 0,60 for I. oxyrinchus; 0.56 for I. paucus; 0.24
for L. ditropis, and 0.74 for L. nasus: Table 3), it becomes evident that the brain of lamnids can
be characterized overall as small to mid-size within Lamniformes. Lamnids exhibit regional
endothermy which allows them to heat their brain and eyes well above the ambient water
temperature compensates their relatively small brain size increasing the ability to receive and
synchronize information to and from the peripheral nervous system, which in turn improves
reaction time (Garg et al., 2013).
D. EVOLUTIONARY IMPLICATIONS
The distribution of mapped FI values onto the morphology-based and molecular-based
trees (Fig. 6) does not necessarily favor one tree over the other, but it does show some distinct

34
evolutionary patterns regardless of the trees. For example, more derived lamniform taxa,
particularly Alopiidae (Alopias), Cetorhinidae (Cetorhinus), and Lamnidae (Carcharodon,
Isurus, and Lamna), have high (4 or 5) FI values compared to other taxa in each tree. Where all
the lamniform taxa have a FI value of 2 or higher, a FI of 1 in Scyliorhinus retifer is noteworthy
because it can be argued that a FI of 1 is a plesiomorphic condition, where lamniforms evolved at
least some degree of cerebellar complexity as an apomorphic condition.
In contrast, there is no apparent trends in the relative brain size in terms of EQ within
Lamniformes in both tree, and an EQ of 0.8 for Scyliorhinus retifer represents the approximate
middle value of the total range of EQ values seen in lamniforms (0.2‒1.7) (Fig. 6). However,
because EQ values are found to be affected by ontogenetic growth where younger individuals
tend to have larger brain than older individuals relative to the body size (see above), I
reexamined my data against Yopak et al.’s (2007) data to take an EQ value derived from the
largest sample (by BoW) for each species (Table 3). For example my specimen of Carcharias
taurus was represented by a 9.43-kg individual, whereas Yopak et al.’s sample of the same
species was 152.4 kg. This suggests that my sample was substantially younger than Yopak et
al.’s sample, so I chose to map the EQ value based on Yopak et al.’s sample for C. taurus.
Besides C. taurus, the reexamination resulted in changes in the EQ value for the following
additional species: Alopias superciliosus, Carcharodon carcharias, and Isurus oxyrinchus.
Although not perfect, this new data set minimizing inclusions of extremely young individuals is
considered to be the most ‘optimized encephalization quotient’ (oEQ) represented by the largest
possible sample for each species in which multiple EQ values are available.
The distribution of mapped oEQ values onto the morphology-based and molecular-based
trees (Fig. 6) does not necessarily favor one tree over the other, but the oEQ values do reveal

35
certain trends that were not evident based only on my EQ values (Fig. 6). For example, all the
lamnid species (Carcharodon carcharias, Isurus spp., and Lamna spp.) have an oEQ of ≤0.7,
whereas all the Alopiids (Alopias spp.) have an oEQ of ≥1.3. Although a rather large discrepancy
between L. ditropis and L. nasus in oEQ remains from EQ, the oEQ (or EQ) of 0.7 for L. nasus is
likely an exaggerated value for the species, because the value was taken from a specimen that
was substantially smaller (younger) than that of L. ditropis. The evolutionary pattern for other
taxa in both trees is largely unclear, but because they all have an oEQ of ≤0.8, including
Scyliorhinus retifer, lower (i.e., ≤0.8) oEQ values are considered plesiomorphic where
exceptionally high oEQ values seen in Alopias spp. are clearly apomorphic. It is also worth
noting that the oEQ of 0.8 for S. retifer represents the approximate middle value of the total
range of oEQ values (0.2‒1.7). If the oEQ of 0.8 is considered to be plesiomorphic, then it is
possible to argue that lamniforms developed two evolutionary pathways in terms of oEQ—one
group (Alopias spp.) attained enlarge the brain (high oEQ) and the other (all other lamniforms)
evolved towards having smaller brain (low oEQ)—where both diverging trends can be regarded
as two alternative apomorphies in this interpretation.
Both the morphology-based and molecular-based trees (Fig. 6) indicate that regional
endothermy in Alopias vulpinus evolved independent of that in Lamnidae (see also Ferrón,
2017). Because these sharks can keep the brain and eyes warm above the ambient water
temperature (Goldman, 2002; Dickson and Graham, 2004; Patterson et al., 2011), their warm
brains and eye muscles allow for improved reaction time, However, whereas A. vulpinus has a
higher FI (5) than Lamnidae (FI of 4), the fact that A. vulpinus has the largest brain (oEQ of 1.7)
than any other lamniform shark, that brains of lamnids are relatively small (oEQ of ≤0.7), and
that A. vulpinus and lamnids are the only extant endothermic sharks, suggests that A. vulpinus
36
arguably has the most derived brain among extant lamniforms, and quite possibly not only
among extant elasmobranchs, but even among all the extant chondrichthyans.
V. CONCLUDING REMARKS
There are over 500 species of extant sharks (Weigmann, 2016), where they have evolved
their brains as diverse as the sharks themselves through nearly 400 million years of history (e.g.,
Yopak et al., 2007, 2019; Yopak and Montgomery, 2008; Yopak and Frank, 2009). Whereas
understanding such diversity is critical for understanding the evolution of their cognitive ability
and how ecology and phylogeny have influenced the variation of their brain complexity, many
aspects of the diversity and evolution of brain morphology remain poorly understood. In this
study, I examined the morphological variation of the brain across 14 of the 15 known extant
species of a monophyletic shark order, Lamniformes, which exhibit remarkable ecological
specializations (e.g., Ebert et al., 2013). I specifically examined the relative brain size
(encephalization), the relative size differences among the five major brain regions, and the
variation in cerebellar foliation with the goal to investigate the implications to function,
behavioral ecology, and evolutionary variations observed in brain morphology.
Based on preserved museum specimens as well as published sources, my primary data set
consisted of 14 of the 15 known extant lamniform species represented by all 10 extant lamniform
genera. I also examined two brain samples of scyliorhinid carcharhiniform, Scyliorhinus retifer,
for comparison as an outgroup. In addition, I examined eight fresh specimens of squalid
squaliform, Squalus acanthias, for a pilot study to examine the possible shrinkage of brain
specimens due to preservatives used, specifically formaldehyde and ethanol. My experimental

37
pilot study revealed that the brain samples of S. acanthias increased in mass by an average of
10.6% through formaldehyde fixation, followed by an average of 35.5% mass decreased after
ethanol preservation. Therefore, all the preserved specimens I examined in this study were also
assumed to have gone through an average of 35.5% decrease in brain mass that was necessary to
extrapolate the original brain mass in fresh state. In addition, using the brains of S. acanthias, I
also determined that they had shrunk uniformly across all brain regions.
A wide range of morphological diversity was found among the 14 lamniform species
examined. Based on my quantitative data, I conducted three separate regression analyses that
would examine different brain attributes among them. My first analysis was statistically
significant (p ˂ 0.0001), suggesting that there is a strong positive correlation between brain size
and body size. My second analysis was also statistically significant (p = 0.0125), suggesting that
sharks with a larger brain tend to have a more foliated cerebellum. My third analysis was not
statistically significant (p = 0.7803), suggesting that the body weight over brain weight has
practically no effect on the cerebellar complexity.
The comparisons of my data with a previously published dataset (i.e., Yopak et al., 2007)
indicated that EQ values are affected at least in part by ontogeny where younger (smaller)
individuals have larger brains in terms of EQ than older (larger) individuals of the same species
likely associated with negative allometry of the head relative to the body. Nevertheless, I found
that taxa with higher EQ values in one data set are generally also higher in the other data set
relative to taxa with lower EQ values, indicating that different EQ values for each species still
collectively characterize the brain size of that species. However, my data also showed that
similar ontogenetic effects may also be at play when comparing the data interspecifically. In
addition, the amount of brain shrinkage among different samples could be another source of
38
variation in EQ values where the brain mass reduction could have been slightly greater or lesser
than my assumed 35.5% reduction.
Different parts of the brain have different functions that may reflect different lifestyles.
My data showed that, among lamniforms, Carcharodon carcharias and Isurus spp. have the
largest telencephalon that likely reflects their acute sense of smell, whereas Odontaspis ferox and
Megachasma pelagios have the smallest telencephalon indicating that they likely do not rely on
smell for prey capturing. The largest diencephalon in relation to the rest of the brain was found in
sluggish swimmers, such as Mitsukurina owstoni, Carcharias taurus, and Megachasma pelagios,
that do not require rapid relaying of sensory information within the brain or quick
autonomic responses through the brain region. The smallest diencephalon was found in Alopias
pelagicus and A. vulpinus that require rapid neural signal transmission for their unique tail-based
hunting behavior. Pseudocarcharias kamoharai, A. pelagicus, A. superciliosus, Carcharodon
carcharias, Isurus spp. and Lamna spp. have a large mesencephalon in relation to the rest of the
brain, suggesting that these sharks have better eye coordination and visual acuity relative to other
lamniforms. Alopias spp. have an enlarged metencephalon likely associated with their complex
hunting behavior, whereas M. pelagios possesses an exceptionally small metencephalon
consistent with its sluggish swimming. A large myelencephalon is present in M. pelagios and O.
ferox, but its biological significance is uncertain at the present time.
Some ecological specializations are reflected in the diversity of brain anatomy seen in
certain lamniforms, such as adaptations to deep-water, filter feeding, tail-based prey hunting, and
thunniform swimming. For example, Mitsukurina owstoni has a metencephalon with a moderate
cerebellar foliation, and its telencephalon is enlarged, likely related to enhanced olfaction and
electromagnetic sensitivity in the dark coupled with enhance motor control for rapid jaw

39
protraction to compensate its sluggish swimming. Unlike the other two filter-feeding sharks,
Rhincodon typus and Cetorhinus maximus, Megachasma pelagios has a small telencephalon and
metencephalon likely reflecting its solitary behavior with limited social and migratory behaviors.
Alopias spp. have a large, highly foliated metencephalon, indicating a greater capacity for fine,
accurate motor control required for their complex tail-based prey hunting behavior. The brain of
lamnids (Carcharodon, Isurus, and Lamna) are relatively small within Lamniformes, but it is
likely that their regional endothermy allows them to heat their brain and eyes well above the
ambient water temperature to compensate their relatively small brain size.
I employed character mapping on a morphology-based tree and a molecular-based tree in
order to examine the evolutionary pattern of the brain through lamniform phylogeny using the
scyliorhinid carcharhiniform, Scyliorhinus retifer, as an outgroup. Whereas my data did not favor
one tree over the other, it did show some distinct evolutionary patterns regardless of the trees.
For example, more derived lamniform taxa, particularly Alopiidae (Alopias), Cetorhinidae
(Cetorhinus), and Lamnidae (Carcharodon, Isurus, and Lamna), were found to have highly
foliated cerebellum, where limited foliation is regarded as plesiomorphic. After optimizing my
brain size data by incorporating published data, all the lamnid species (Carcharodon carcharias,
Isurus spp., and Lamna spp.) were found to have relatively small (or mid-sized) brain, whereas
all the alopiids (Alopias spp.) were found to have a large brain, where a mid-sized brain can be
interpreted as a plesiomorphic condition. Although the functional efficiency of the smaller brains
in lamnids is likely compensated by their warming through regional endothermy, convergently
evolved regional endothermy in A. vulpinus may arguably have the most derived brain of all
among all the extant chondrichthyans.
40
Because fresh samples of lamniforms are generally difficult to come by due to their
general rarity or their typically large sizes, one major limitation of the type of investigation I
employed in this study is the small sample size for each species. Another limitation with
collection-based studies on shark brains that requires further investigation is a better
understanding of the effects of their formaldehyde fixation and alcohol preservation.
Nevertheless, my present study is significant because it is the first of its kind to examine the
morphological variation and diversity of the brain across almost all the known extant species of
Lamniformes and relate to its possible function, ecology, and evolution. This study demonstrates
how ecological factors such as habitat, diet, and behavior drive brain evolution.

41
VI. LITERATURE CITED
Aalbers, S. A., D. Bernal, and C. A. Sepulveda. 2010. The functional role of the caudal fin in
the feeding ecology of the common thresher shark Alopias vulpinus. Journal of Fish
Biology 76:1863‒1868.
Amaral C. R. L., F. Pereira, D. A. Silva, A. Amorim, and E. F. de Carvalho. 2018. The
mitogenomic phylogeny of the Elasmobranchii (Chondrichthyes). Mitochondrial DNA
Part A 29:867–878.
Angel, A. 1977. Processing of sensory information. Progress in Neurobiology 9:1–122.
Angel, M. V. 1997. What is the deep sea? p. 2–37. In: Deep-Sea Fishes. D. J. Randall, and A. P.
Farrell (eds.). Academic Press, San Diego, California.
Bauchot, R., M. L. Bauchot, R. Platel, and J. M. Ridet. 1977. The brains of Hawaiian tropical
fishes: brain size and evolution. Copeia 1977:42–46.
Bauchot, R., R. Platel, and J. M. Ridet. 1976. Brain-body weight relationships in Selachii.
Copeia 1976:305–310.
Berlucchi, G., and G. Vallar. 2018. The history of neurophysiology and neurology of parietal
lobe. Handbook of Clinical Neurology 151:3–30.
Block, B. A., and F. G. Carey. 1985. Warm brain and eye temperatures in sharks. Journal of
Comparative Physiology 156:229‒236.
Bustamante, C., F. Concha, F. Balbontin, and J. Lamilla. 2009. Southernmost record of
Isurus paucus (Manday, 1966) (Elasmobranchii: Lamnidae) in the southeast Pacific
Ocean. Revista de Biologia Marina Y Oceanografia 44:523–526.
Cairo, O. 2011. External measures of cognition. Frontiers in Human Neuroscience 5:108–117.

42
Cajal, S. R. Y. 1899. Comparative Study of the Sensory Areas of the Human Cortex. Clark
University, Worcester, Massachusetts.
Chapman, D. D., and S. H. Gruber. 2002. A further observation of the prey-handling behavior
of the great hammerhead shark, Sphyrna mokarran: Predation upon the spotted eagle ray,
Aetobatus narinari. Bulletin of Marine Science 70:947–952.
Ciriello, J., M. M. Caverson, and C. Polosa. 1986. Function of the ventrolateral medulla in the
control of the circulation. Brain Research Reviews 11:359–391.
Cofran, Z. 2019. Brain size growth in Australopithecus. Journal of Human Evolution 130:72–82
Compagno, L. J. V. 1977. Phyletic relationships of living sharks and rays. American Zoologist
17:303–322.
Compagno, L. J. V. 1984. FAO species catalogue. Sharks of the world. An annotated and
illustrated catalogue of shark species known to date. Food and Agriculture Organization
Fisheries Synopsis Number 125 4:1–655.
Compagno, L. J. V. 1990. Relationships of the megamouth shark, Megachasma pelagios
(Lamniformes: megachasmidea), with comments on its feeding habits. National Oceanic
and Atmospheric Administration Technical Report, National Marine Fisheries Service
90:357–379.
Compagno, L. J. V. 1999. Endoskeleton, p. 69–92. In: Sharks, Skates and Rays: The Biology of
Elasmobranch Fishes. W. C. Hamlett (eds.). Johns Hopkins University Press, Baltimore,
Maryland.
Compagno, L. J. V. 2002. Sharks of the world: an annotated and illustrated catalogue of shark
species known to date. Volume 2. Bullhead, mackerel and carpet sharks
(Heterodontiformes, Lamniformes and Orectolobiformes). Food and Agriculture

43
Cunha, D. B. da, L. F. da Silva Rodrigues-Filho, and J. B. de Luna Sales. 2017. A review of
the mitogenomic phylogeny of the Chondrichthyes. Intech Open, Chapter 6, p. 113–126.
DOI: 10.5772/intechopen.70028.
Dekaban, A. S., and D. Sadowsky. 1978. Changes in brain weights during the span of human
life: relation of brain weights to body heights and body weights. Annals of Neurology
4:345–356.
Demski, L. S., and R. G. Northcutt. 1996. The brain and cranial nerves of the white shark: an
evolutionary perspective, p. 121–130. In: The Biology of Carcharodon carcharias. A. P.
Klimley, and D. Ainley (eds.). Academic Press, San Diego.
Dickson, K. A., and J. B. Graham. 2004. Evolution and consequences of endothermy in fishes.
Physiological and Biochemical Zoology 77:998–1018.
Donley, J. M., and R. E. Shadwick. 2003. Steady swimming muscle dynamics in the leopard
shark Triakis semifasciata. Journal of Experimental Biology 206:1117–1126.
Douglas, R. H., J. C. Partridge, and N. J. Marshall. 1998. The eyes of deep-sea fish: lens
pigmentation, tapeta, and visual pigments. Progress in Retinal and Eye Research 17:597–
636.
Drew, M., W. T. White, D. Dharmadi, A. V. Harry, and C. Huveneers. 2015. Age, growth,
and maturity of the palegic thresher Alopias pelagicus and the scalloped hammerhead
Sphyrna lewini. Journal of Fish Biology 86:333–354.
Dudley, S. F. J., M. D. Anderson-Reade, G. S. Thompson, and P. B. McMullen. 2000.
Concurrent scavenging off a whale carcass by great white sharks, Carcharodon
carcharias, and tiger sharks, Galeocerdo cuvier. Fishery Bulletin 98:646–649.

44
Ebert, D. A., S. Fowler, and L. J. V. Compagno. 2013. Sharks of the World: A Fully
Illustrated Guide. Wild Nature Press, Plymouth, New Hampshire.
Emmanuel, A., M. Frimpong, and L. Henebry. 2012. Short-term effects of formalin and
ethanol fixation and preservation techniques on weight and size of fish eggs. Transactions
of American Fisheries Society 141:1472–1479.
Fergusson, I. K., K. Graham, and L. J. V. Compagno. 2007. Distribution, abundance, and
biology of the smalltooth sandtiger shark Odontaspis ferox (Risso, 1810) (Lamniformes:
Odontaspididae). Environmental Biology of Fishes 81:207–228.
Ferrón, H. G. 2017. Regional endothermy as a trigger for gigantism in some extinct
macropredatory sharks. PLoS ONE 12:e0185185.
Fritsches, K. A., R. W. Brill, and E. J. Warrant. 2005. Warm eyes provide superior vision in
swordfishes. Current Biology 15:55–58.
Fujikura, K., D. Lindsay, H. Kitazato, S. Nishida, Y. Shirayama. 2010. Marine Biodiversity
in Japanese waters. PLoS ONE 5:e11836.
Garg, M., H. Lata, L. Walia, and O. Goyal. 2013. Effect of aerobic exercise on auditory and
visual reaction times: A prospective study. Indian Journals of Physiology and
Pharmacology 57:138–145.
Garman, S. 1913. The Plagiostomia (Sharks, Skates and Rays). Memoirs of the Museum of
Comparative Zoology, Harvard College, Cambridge, Massachusetts.
Gebauer, L., J. Skewes, G. Westphael, P. Heaton, and P. Vuust. 2014. Intact brain processing
of musical emotions in autism spectrum disorder, but more cognitive load and arousal in
happy vs. sad music. Frontiers in Neuroscience 8:192–202.
45
Germanaud, D., J. Lefèvre, R. Toro, C. Fischer, J. Dubois, L. H. Pannier, and J. F.
Mangin. 2012. Larger is twistier: Spectral analysis of gyrification (SPANGY) applied to
adult brain size polymorphism. Neuroimage 63:1257–1272.
Gilbert, P. W. 1963. The visual apparatus of sharks, p. 283–326. In: Sharks and Survival, P. W.
Gilbert (ed.). D. C. Heath and Company, Boston.
Gilmore, G. 1983. Observations on the embryos of the longfin mako, Isurus paucus, and the
bigeye thresher, Alopias superciliosus. Copeia 1983:375–382.
Gittleman, J. L. 1986. Carnivore brain size, behavioral ecology, and phylogeny. Journal of
Mammalogy 67:23–36.
Gold, J. M., P. J. Mundy, and B. S. Tjan. 2012. The perception of a face is no more than the
sum of its parts. Psychological Science. 23:427–434.
Goldman, K. J. 1997. Regulation of body temperature in the white shark, Carcharodon
carcharias. Journal of Comparative Physiology B 167:423‒429.
Goldman, K. J., S. Anderson, R. Latour, and J. A. Musick. 2004. Homeothermy in adult
salmon sharks, Lamna ditropis. Environmental Biology of Fishes 71:403–411.
Goldman, K. J., S. Branstetter, and J. A. Musick. 2006. A re-examination of the age and
growth of sand tiger sharks, Carcharias taurus, in western North Atlantic: the importance
of aging protocols and use of multiple back-calculation techniques. Environmental
Biology of Fishes 77:241–252.
Goldman, K. J., and J. A. Musick. 2006. Growth and maturity of salmon sharks (Lamna
ditropis) in the eastern and western North Pacific, and comments on back-calculation
methods. Fishery Bulletin 104:278–292.

46
Grassle, J. F., and N. J. Maciolek. 1992. Deep-sea species richness: regional and local diversity
estimates from quantitative bottom samples. American Naturalist 139:313–341.
Guitart-Manday, D. 1966. Nueva nombre para una especie de tiburon del genero Isurus
(Elasmobranchii: Isuridae) de aguas Cubanas. Poeyana, Serie A 15:1–9.
Guitart-Manday, D. 1975. Las presquerias pelagico-oceanicas de corto radio de accion en la
region noroccidental de Cuba. Serie Oceanologica, Academia de Ciencias de Cuba 31:1–
41.
Haier, R. J., R. E. Jung, R. A. Yeo, K. Head, and M. T. Alkire. 2004. Structural brain
variation and general intelligence. Neuroimage 23:425–433.
Hallacher, L. E. 1977. The feeding behavior of the basking shark (Cetorhinus maximus).
Environmental Biology of Fishes 2:297–298.
Harvey, P. H., and M. D. Pagel. 1991. The Comparative Method in Evolutionary Biology.
Oxford University Press, Oxford.
Hayes, E., B. J. Godley, M. Nimak-Wood, and M. J. Witt. 2018. Basking shark breaching
behavior observations west of Shetland. Marine Biodiversity Records 11:17 DOI:
10.1186/s41200-018-0151-4.
Heinicke, M. P., G. J. P. Naylor, and S. B. Hedges. 2009. Cartilaginous fishes
(Chondrichthyes), p. 320–327. In: The Time Tree of Life. S. B. Bedges, and S. Kumar
(eds.) Oxford University Press, Oxford.
Helfman, G. S., B. B. Collette, D. E. Facey, and B. B. Bowen. 2009. The Diversity of Fishes:
Biology, Evolution, and Ecology. Second Edition. Wiley-Blackwell, Chichester, West
Sussex.

47
Herring, P. J. 2000. Species abundance, sexual encounter, and bioluminescent signaling in the
deep-sea. Philosophical Transactions of the Royal Society B 355:1273–1276.
Hu, J., H. Tang, K. C. Tan, and L. Haizhou. 2016. How the brain formulates memory: A
spatio-temporal model research frontier. IEEE Computational Intelligence Magazine
11:56–68.
Huber, R., and M. K. Rylander. 1992. Brain morphology and turbidity preference in Notropis
and related genera (Cyprinidae, Teleostei). Environmental Biology of Fishes 33:153–165.
Huber, R., M. J. Van Staaden, L. S. Kaufman, and K. F. Liem. 1997. Microhabitat use,
trophic patterns and the evolution of brain structure in African cichlids. Brain Behavior
and Evolution 50:167–182.
Hueter, R. E., J. P. Tyminski, and R. D. L. Parra. 2013. Horizontal movements, migration
patterns, and population structure of whale sharks in the Gulf of Mexico and
northwestern Caribbean Sea. PLoS ONE 8:el01371.
Human, B. A., E. P. Owen, L. J. V. Compagno, and E. H. Harley. 2006. Testing
morphologically based phylogenetic theories within the cartilaginous fishes with
molecular data, with special reference to the catshark family (Chondrichthyes;
Scyliorhinidae) and the interrelationships within them. Molecular Phylogenetics and
Evolution 39:384–391.
Ito, H., M. Yoshimoto, and H. Somiya. 1999. External brain form and cranial nerves of the
megamouth shark, Megachasma pelagios. Copeia 1999:210–213.
Jerison, H. J. 1973. Evolution of the Brain and Intelligence. Academic Press, New York.
Kajiura, S. M. 2001. Head morphology and electrosensory pore distribution of
carcharhinid and sphyrnid sharks. Environmental Biology of Fishes 61:125–133.

48
Kajiura, S. M., A. D. Cornet, and K. E. Yopak. 2010. Sensory adaptations to the environment:
Electroreceptors as a case study, p. 393–434. In: Sharks and Thier Relatives II:
Biodiversity, Adaptive Physiology, and Conservation. J. C. Carrier, J. A. Musick, and M.
R. Heithaus (eds.) CRC Press, Boca Raton, Florida.
Kajiura, S. M., J. B. Forni, and A. P. Summers. 2003. Maneuvering in juvenile carcharhinid
and sphyrnid sharks: the role of the hammerhead shark cephalofoil. Zoology 106:19–28.
Kajiura, S. M., and K. N. Holland. 2002. Electroreception in juvenile scalloped hammerhead
and sandbar sharks. Journal of Experimental Biology 205:3609–3621.
Katz, S. L. 2002. Design of heterothermic muscle in fish. Journal of Experimental Biology
205:2251–2266.
Kim, S. H., K. Shimada, and C. K. Rigsby. 2013. Anatomy and evolution of heterocercal tail
in lamniform sharks. Anatomical Record 296:433–442.
Kohler, N. E., J. G. Casey, and P. A. Turner. 1996. Length-length and length-weight
relationships for 13 shark species from the western North Atlantic. National Oceanic and
Atmospheric Administration Technical Memorandum, National Marine Fisheries
Service, New England.
Kotrschal, K., and M. Palzenberger. 1992. Neuroecology of cyprinids: comparative,
quantitative histology reveals diverse brain patterns. Environmental Biology of Fishes
33:135–152.
Kotrschal, K., M. J. Van Staaden, and R. Huber. 1998. Fish brains: evolution and
environmental relationships. Reviews in Fish Biology and Fisheries 8:373–408.
Kruska, D. C. T. 1988. The brain of the basking shark (Cetorhinus maximus). Brain Behavior
and Evolution 32:353–363.

49
Kurkcuoglu, A. 2017. Mesencephalon; midbrain, p. 135–150. In: Human Anatomy: Reviews
and Medical Advances, A. M. Sisu (eds.). Intech, Rijeka, Croatia.
Leigh, S. R. 2004. Brain growth, life history, and cognition in primate and human evolution.
American Journal of Primatology 62:139–164.
Lisney, T. J., and S. P. Collins. 2006. Brain morphology in large pelagic fishes: a comparison
between sharks and teleosts. Journal of Fish Biology 68:532–554.
Liu, K., C. Chen, T. Liao, and S. Joung. 1999. Age, growth, and reproduction of the pelagic
thresher shark, Alopias pelagicus in the northwestern Pacific. Copeia 1999:68–74.
Maisey, J. G., G. J. P. Naylor, and D. J. Ward. 2004. Mesozoic elasmobranchs, neoselachian
phylogeny, and the rise of modern neoselachian diversity, p. 17–56. In: Mesozoic Fishes
III—Systematics, Paleoenvironments and Biodiversity. G. Arratia, and A. Tintori (eds.).
Verlag Pfeil, München.
Martin, A. P., A. T. Pardini, L. R. Noble, and C. S. Jones. 2002. Conservation of a
dinucleotide simple sequence repeat locus in sharks. Molecular Phylogenetics and
Evolution 23:205–213.
Martin, A. P., and G. J. P. Naylor. 1997. Independent origin of filter-feeding in megamouth
and basking sharks (order Lamniformes) inferred from phylogenetic analysis of
cytochrome b gene sequences, p. 39–50. In: Biology of Megamouth Shark. K. Yano, J. F.
Morrissey, Y. Yabumoto, and K. Nakaya (eds.) Tokai University Press, Tokyo.
Martin, J. H. 2003. Lymbic system and cerebral circuits for emotions, learning and memory, p.
383. In: Neuroanatomy: text and atlas. McGraw Hill Companies, New York, New York.
Masai, H. 1969. The brain patterns of sharks in relation to habit. Journal fűr Hirnforschung
11:347–365.

50
Masai, H., Y. Sato, and M. Aoki. 1973. The brain of Mitsukurina owstoni. Journal fűr
Hirnforschung 14:493‒500.
McComb, D. M., T. C. Tricas, and S. M. Kajiura. 2009. Enhanced visual fields in
hammerhead sharks. Journal of Experimental Biology 212:4010‒4018.
Merrett, N. R., and R. L. Haedrich. 1997. Deep-Sea Demersal Fish and Fisheries. Chapman
and Hall, London.
Montgomery, J., and K. Perks. 2019. Understanding cerebellum in vertebrate neuroethology:
From sensing in sharks and electric fish to motor sequences in movement and birdsong.
Behavioral Neuroscience 133:267–281.
Myagkov, N. A., and J. Hirnforsch. 1991. The brain sizes of living Elasmobranchii as their
organization level indicator. I. General analysis. Journal fűr Hirnforschung 32:553–561.
Nakaya, K., T. Tomita, K. Suda, K. Sato, K. Ogimoto, A. Chappell, T. Sato, K. Takano,
and Y. Yuki. 2016. Slingshot feeding of the goblin shark Mitsukurina owstoni (Pisces:
Lamniformes: Mitsukurinidae). Scientific Reports 6:27786. DOI: 10.1038/srep27786.
Nasby-Lucas, N., H. Dewar, O. S. Nishizaki, C. Wilson, J. R. Hyde, R. D. Vetter, J. Wraith,
B. A. Block, M. J. Kinney, T. Sippel, D. B. Holts, and S. Kohin. 2019. Movement of
electronically tagged shortfin mako sharks (Isurus oxyrinchus) in the eastern North
Pacific Ocean. Animal Biotelemetry 7:e12. DOI: 10.1186/s40317-019-0174-6.
Naylor, G. J. P., J. N. Caira, K. Jensen, K. A. M. Rosana, N. Straube, and C. Lakner. 2012.
Elasmobranch phylogeny: a mitochondrial estimate base on 595 species, p. 31–56. In:
Biology of Sharks and Their Relatives, Second Edition. J. C. Carrier, J. A. Musick, and
M. R. Heithaus (eds.). CRC Press, Boca Raton, Florida.

51
Naylor, G. J. P., A. P. Martin, E. G. Mattison, and W. M. Brown. 1997. Interrelationships of
lamniform sharks: testing phylogenetic hypotheses with sequence data, p. 199–218. In:
Molecular Systematics of Fishes. T. D. Kocher, and C. A. Stepien (eds.). Academic
Press, San Diego.
Nelson, D. R., J. N. McKibben, W. R. Strong, Jr., C. G. Lowe, J. A. Sisneros, D. M.
Schroeder, R. J. Lavenberg. 1997. An acoustic tracking of a megamouth
shark, Megachasma pelagios: a crepuscular vertical migrator. Environmental Biology of
Fishes 49:389‒399.
Northcutt, R. G. 1977. Elasmobranch central nervous system organization and its possible
evolutionary significance. American Zoology 17:411–429.
Northcutt, R. G. 1978. Brain organization in the cartilaginous fishes, p. 117–194. In: Sensory
Biology of Sharks, Skates, and Rays. E. S. Hodgson, and R. F. Mathewson (eds.). Office
of Naval Research, Arlington.
Okada, Y., M. Aoki, Y. Sato, and H. Masai. 1969. The brain patterns of sharks in relation to
habit. Journal fűr Hirnforschung 11:347–365.
Oliver, S. P., J. R. Turner, k. Gann, M. Silvosa, and D. T. Jackson. 2013. Thresher sharks
use tail-slaps as a hunting strategy. PLoS ONE 8:e67380.
Patterson, J. C., C. A. Sepulveda, D. Bernal. 2011. The vascular morphology and in vivo
muscle temperatures of thresher sharks (Alopiidae). Journal of Morphology 272:1353–
1364.
Penfield, W. 1934. The influence of the diencephalon and the hypophysis upon general
autonomic function. Canadian Medical Association Journal 30:589–598.

52
Queiroz, N., S. Araújo, P. A. Ribeiro, P. Tarroso, R. Xavier, and A. M. Santos. 2007. A first
record of longfin mako, Isurus paucus, in the mid-North Atlantic. Marine Biodiversity
Records 1:e34. DOI: 10.1017/S1755267206003484.
Ridet, J. M., R. Bauchot, and C. Delfini. 1973. L’encéphale de Scyliorhinus canicula (Linne,
1758) (Chondrichthyes, Selachii, Scyliorhinidae): Recherche d’une grandeur de reference
pour des études quantitatives. Cahies de Biologie Marine 14:11 –28.
Russo, R., H. J. Herrmann, and L. de Arcangelis. 2014. Brain modularity controls the critical
behavior of spontaneous activity. Scientific Reports 4:4312. DOI: 10.1038/srep04312.
Schaffer, P. A., B. Lifland, S. v. Sommeran, D. R. Casper, and C. R. Davis. 2013.
Meiningoencephalitis associated with carnobacterium maltaromaticum-like bacteria in
stranded juvenile salmon sharks (Lamna ditropis). Veterinary Pathology 50:412–417.
Shimada, K. 2005. Phylogeny of lamniform sharks (Chondrichthyes: Elasmobranchii) and the
contribution of dental characters to lamniform systematics. Paleontology Research 9:55–
72.
Shirai, S. 1996. Phylogenetic interrelationships of neoselachians (Chondrichthyes: Euselachii),
p. 9–34. In: Interrelationships of Fishes. M. L. J. Stiassny, L. R. Parenti, and G. D.
Johnson (eds.). Academic Press, San Diego.
Skomal, G., B. Zeeman, I. Stephen, J. H. Chisholm, E. L. Summers, H. J. Walsh, K. W.
McMahon, S. R. Thorrold. 2009. Transequatorial migrations by basking sharks in the
western Atlantic Ocean. Current Biology 12:1019–1022.
Snell, O. 1892. Die abhȁngigkeit des hirngewichts von dem kőrpergewicht und den geistigen
fȁhigkeiten. Archives of Psychiatry 23:436–446.

53
Stone, N. R., K. Shimada. In press. Skeletal anatomy of the bigeye sandtiger shark, Odontaspis
noronhai (Lamniformes: Odontaspididae), and its implications to lamniform phylogeny,
taxonomy, and conservation biology. Copeia.
Striedter, G. F. 2005. Principles of Brain Evolution. Sinauer Associates, Sunderland,
Massachusetts.
Toro, R., M. Perron, B. Pike, L. Richer, S. Veillette, Z. Pausova, and T. Paus. 2008. Brain
size and folding of the human cerebral cortex. Cerebral Cortex 18:2352–2357.
Tucker, J. P., B. Vercoe, I. R. Santos, M. Dujmovic, and P. A. Butcher. 2019. Whale carcass
scavenging by sharks. Global Ecology and Conservation 19:e00655. DOI:
10.1016/j.gecco.2019.e00655.
Wagner, H. J., E. Fröhlich, K. Negishi, and S. P. Collin. 1998. The eyes of deep-sea fish. II.
Functional morphology of the retina. Progress in Retinal and Eye Research 17:637–685.
Wakida-Kusunoki, A., and D. De Anda-Fuente. 2012. Presence of longfin mako shark Isurus
paucus (Chondrichthyes: Lamnidae) in the south-eastern Gulf of Mexico. Marine
Biodiversity Records, Tabasco, Mexico 5:e92. DOI: 10.1017/S1755267212000723.
Warrant, E. J. 2000. The eyes of deep-sea fishes and the changing nature of visual scenes with
depth. Philosophical Transactions of the Royal Society B 355:1155–1159.
Warrant, E. J., and N. A. Locket. 2004. Vision in the deep sea. Biological Reviews 79:671–
712.
Watanabe, Y. Y., K. J. Goldman, J. E. Caselle D. D. Chapman, and Y. P. Papastamatiou.
2015. Comparative analyses of animal-tracking data reveal ecological significance of
endothermy in fishes. Proceedings of the National Academy of Sciences 112:6104‒6109.

54
Watanabe, Y. Y., and Y. P. Papastamatiou. 2019. Distribution, body size and biology of the
megamouth shark Megachasma pelagios. Journal of Fish Biology 2019:1–7. DOI:
10.1111/jfb.14007.
Watanabe, Y. Y., N. L. Payne, J. M. Semmens, A. Fox, and C. Huveneers. 2019. Swimming
strategies and energetics of endothermic white sharks during foraging. Journal of
Experimental Biology 222:jeb185603. DOI:10.1242/jeb.185603.
Weigmann, S. 2016. Annotated checklist of the living sharks, batoids and chimaeras
(Chondrichthyes) of the world, with a focus on biogeographical diversity. Journal of Fish
Biology 88:837–1037.
Wilga, C. A. D., and G. V. Lauder. 2004. Biomechanics of locomotion in sharks, rays, and
chimeras, p. 139–164. In: Biology of Sharks and Their Relatives. J. C. Carrier, J. A.
Musick, and M. R. Heithaus (eds.) CRC Press, Boca Raton, Florida.
Williams, M. F. 2002. Primate encephalization and intelligence. Medical Hypotheses 58:284–
290.
Wolf, N. G., P. R. Swift, and F. G. Carey. 1988. Swimming muscle helps warm the brain of
lamnid sharks. Journal of Comparative Physiology B 157:709‒715.
Yano, K., M. Miya, M. Aizawa, and T. Noichi. 2007. Some aspects of the biology of the
goblin shark, Mitsukurina owstoni, collected from the Tokyo submarine canyon and
adjacent waters, Japan. Ichthyological Research 54:388–398.
Yopak, K. E., and L. B. Frank. 2009. Brain size and brain organization of the whale shark,
Rhincodon typus, magnetic resonance imaging. Brain Behavior and Evolution 74:121–
142.

55
Yopak, K. E., and T. J. Lisney. 2012. Allometric scaling of the optic tectum in cartilaginous
fishes. Brain Behavior and Evolution 80:108–126.
Yopak, K. E., T. J. Lisney, S. P. Collin, and J. C. Montgomery. 2007. Variation in brain
organization and cerebellar foliation in chondrichthyans: sharks and holocephalans. Brain
Behavior and Evolution 69:280–300.
Yopak, K. E., and J. C. Montgomery. 2008. Brain organization and specialization in deep-sea
chondrichthyans. Brain Behavior and Evolution 71:287–304.
Yopak, K. E., B. C. McMeans, C. G. Mull, K. W. Feindel, K. M. Kovacs, C. Lydersen, A. T.
Fisk, and S. P. Collin. 2019. Comparative brain morphology of the Greenland and
pacific sleeper sharks and its functional implications. Scientific Reports 9:10022. DOI:
10.1038/s41598-019-46225-5.

56
Table 1. Experiment as pilot study demonstrating changes in brain weights in eight samples of
Squalus acanthias (Squaliformes: Squalidae) after fixation using 10% formaldehyde from fresh
condition, followed by preservation in 70% ethanol. Abbreviations in listed sequence: FMNH,
FMNH catalog number; BoW, body mass; TL, total length; FrBrW, fresh brain weight; FoBrW,
formaldehyde-treated brain weight; Fo%CfFr, percent weight change of formaldehyde-treated
brain from fresh brain; EtBrW, ethanol-treated brain weight; Et%CfFr, percent weight change of
ethanol-treated brain from fresh brain.
———————————————————————————————————————
FMNH BoW (kg) TL (cm) FrBrW (g) FoBrW (g) Fo%CfFr (%) EtBrW (g) Et%CfFr (%)
———————————————————————————————————————
141885-1 0.87 67.8 2.59 2.98 +15.05 1.47 -43.24
141885-2 0.99 67.2 3.26 3.72 +14.11 2.29 -29.75
141885-3 1.07 70.2 3.53 3.81 +8.11 2.22 -37.11
141885-4 1.07 71.8 3.64 3.97 +9.07 2.29 -37.11
141885-5 1.41 73.6 3.87 4.21 +8.79 2.34 -39.53
141885-6 1.54 74.2 4.03 4.55 +12.90 2.76 -31.51
141885-7 1.61 81.2 4.03 4.35 +7.94 2.72 -31.51
141885-8 1.57 82.7 4.06 4.41 +8.62 2.71 -33.25
–––– –––– –––– –––– ––––––––––––– –––– –––––––––––––
Average 1.27 73.6 3.64 4.00 +10.57 ±2.74SD 2.31 -35.50 ±4.54SD
———————————————————————————————————————

57
Table 2. Pilot study showing percent size of each of five brain regions relative to total brain size
(100%) of four samples of squalid squaliform, Squalus acanthias, compared with percent values
of S. acanthias from Yopak et al. (2007, table 2). Abbreviations in listed sequence: Tel,
telencephalon; Die, diencephalon; Mes, mesencephalon; Met, metencephalon; Mye,
myelencephalon (see Fig. 1B).
———————————————————————————————————————
Specimen Tel Die Mes Met Mye Total
———————————————————————————————————————
This study
FMNH 141885-2 31.29 6.44 16.70 16.45 29.12 100
FMNH 141885-4 31.80 6.10 15.30 17.50 29.30 100
FMNH 141885-6 30.54 6.07 15.20 18.20 29.99 100
FMNH 141885-8 31.56 6.65 14.50 17.47 29.82 100
––––– ––––– –––– ––––– ––––– ––––––
Average (n = 4) 31.30 6.32 15.43 17.41 29.56 100.02
Yopak et al.'s (2007) study
Unspecified (n = 3) 31.26* 6.65* 15.02* 17.66* 29.43* 100.02*
———————————————————————————————————————
* average of three samples
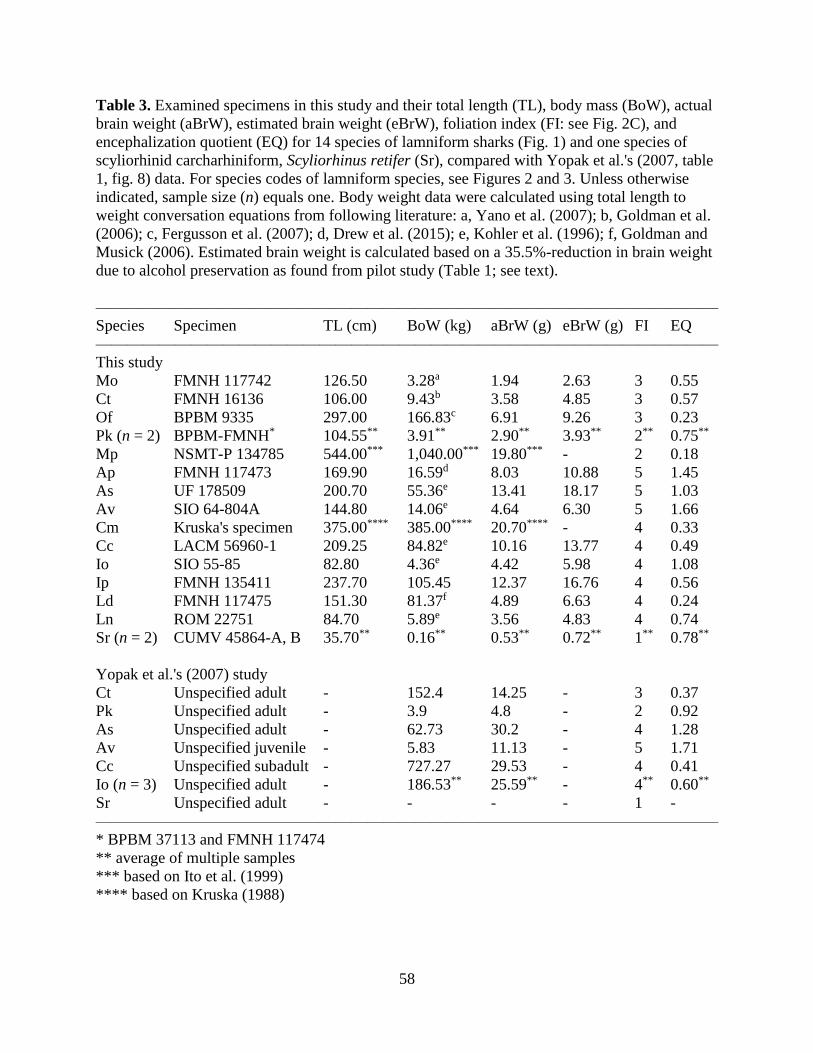
58
Table 3. Examined specimens in this study and their total length (TL), body mass (BoW), actual
brain weight (aBrW), estimated brain weight (eBrW), foliation index (FI: see Fig. 2C), and
encephalization quotient (EQ) for 14 species of lamniform sharks (Fig. 1) and one species of
scyliorhinid carcharhiniform, Scyliorhinus retifer (Sr), compared with Yopak et al.'s (2007, table
1, fig. 8) data. For species codes of lamniform species, see Figures 2 and 3. Unless otherwise
indicated, sample size (n) equals one. Body weight data were calculated using total length to
weight conversation equations from following literature: a, Yano et al. (2007); b, Goldman et al.
(2006); c, Fergusson et al. (2007); d, Drew et al. (2015); e, Kohler et al. (1996); f, Goldman and
Musick (2006). Estimated brain weight is calculated based on a 35.5%-reduction in brain weight
due to alcohol preservation as found from pilot study (Table 1; see text).
———————————————————————————————————————
Species Specimen TL (cm) BoW (kg) aBrW (g) eBrW (g) FI EQ
———————————————————————————————————————
This study
Mo FMNH 117742 126.50 3.28a 1.94 2.63 3 0.55
Ct FMNH 16136 106.00 9.43b 3.58 4.85 3 0.57
Of BPBM 9335 297.00 166.83c 6.91 9.26 3 0.23
Pk (n = 2) BPBM-FMNH* 104.55** 3.91** 2.90** 3.93** 2** 0.75**
Mp NSMT-P 134785 544.00*** 1,040.00*** 19.80*** - 2 0.18
Ap FMNH 117473 169.90 16.59d 8.03 10.88 5 1.45
As UF 178509 200.70 55.36e 13.41 18.17 5 1.03
Av SIO 64-804A 144.80 14.06e 4.64 6.30 5 1.66
Cm Kruska's specimen 375.00**** 385.00**** 20.70**** - 4 0.33
Cc LACM 56960-1 209.25 84.82e 10.16 13.77 4 0.49
Io SIO 55-85 82.80 4.36e 4.42 5.98 4 1.08
Ip FMNH 135411 237.70 105.45 12.37 16.76 4 0.56
Ld FMNH 117475 151.30 81.37f 4.89 6.63 4 0.24
Ln ROM 22751 84.70 5.89e 3.56 4.83 4 0.74
Sr (n = 2) CUMV 45864-A, B 35.70** 0.16** 0.53** 0.72** 1** 0.78**
Yopak et al.'s (2007) study
Ct Unspecified adult - 152.4 14.25 - 3 0.37
Pk Unspecified adult - 3.9 4.8 - 2 0.92
As Unspecified adult - 62.73 30.2 - 4 1.28
Av Unspecified juvenile - 5.83 11.13 - 5 1.71
Cc Unspecified subadult - 727.27 29.53 - 4 0.41
Io (n = 3) Unspecified adult - 186.53** 25.59** - 4** 0.60**
Sr Unspecified adult - - - - 1 -
———————————————————————————————————————
* BPBM 37113 and FMNH 117474
** average of multiple samples
*** based on Ito et al. (1999)
**** based on Kruska (1988)

59
Table 4. Percent size of each of five brain regions relative to total brain size (100%) of 14
species of lamniform sharks and one species of scyliorhinid carcharhiniform, Scyliorhinus retifer
(Sr), compared with percent values of comparable taxa from Yopak et al. (2007, table 2). For
species codes of lamniform species, see Figures 1 and 3. Unless otherwise indicated, sample size
(n) equals one. Abbreviations in listed sequence: Tel, telencephalon; Die, diencephalon; Mes,
mesencephalon; Met, metencephalon; Mye, myelencephalon (see Fig. 1B).
———————————————————————————————————————
Species Tel Die Mes Met Mye Total
———————————————————————————————————————
This study
Mo 34.55 8.76 9.79 21.13 25.77 100
Ct 33.00 10.70 9.98 23.90 22.42 100
Of 22.80 7.42 14.54 18.90 36.34 100
Pk (n = 2) 33.86* 7.00* 21.37* 17.68* 19.94* 99.85*
Mp 22.98 10.90 13.75 12.22 40.15 100
Ap 30.83 2.20 17.00 30.42 19.55 100
As 24.64 3.41 16.40 30.01 25.54 100
Av 26.40 1.30 14.50 31.40 26.40 100
Cm 34.00** 5.00** 9.00** 30.00** 22.00** 100
Cc 38.48 4.85 16.58 17.89 22.20 100
Io 37.57 4.03 16.50 20.50 21.40 100
Ip 38.40 4.90 18.40 17.90 20.40 100
Ld 25.20 4.10 21.15 26.85 22.70 100
Ln 28.15 3.27 19.38 27.15 22.05 100
Sr (n = 2) 48.67* 8.30* 10.28* 16.69* 16.06* 100*
Yopak et al.'s (2007) study
Ct 30.57 11.42 9.47 25.28 23.26 100
Pk 33.13 6.88 20.42 16.04 23.54 100.1
As 27.19 3.15 16.19 32.09 21.39 100.1
Av 26.79 1.66 15.60 30.60 33.02 107.67***
Cc (n = 3) 38.86* 5.57* 14.28* 17.66* 23.63* 100*
Io (n =3) 37.70* 3.35* 18.18* 17.03* 23.74* 100*
Sr 40.70 8.14 13.95 17.44 19.77 100
———————————————————————————————————————
* average of multiple samples
** based on Kruska (1988)
*** sum based on questionable data

60
Figure 1. Example of shark brain (A), brain anatomy and terminology (B), and cerebellum-based
varialble examined in this study (C). A, brain of scyliorhinid carcharhiniform, Scyliorhinus
retifer (chain catshark; CUMV 45864: scale = 1 cm) in dorsal (top) and left lateral (bottom)
views. B, schematic drawings of brain of S. retifer (cf. Fig. 2A) illistrating five major regions
(telencephalon, diencephalon, mesencaphlon, metencaphalon, and myelencephalon in different
shades) and specific brain terminology used in this study. C, five shark brains in dorsal view (not
to scale) illustrating five tiers of cerebellar complexity in terms of 'foliation index' (FI: 1‒5)
devised by Yopak et al. (2007), where from left to right, Scyliorhinus retifer (FI =1),
Megachasma pelagios (FI = 2), Mitsukurina owstoni (FI = 3), Isurus paucus (FI = 4), and
Alopias vulpinus (FI = 5).

61
Figure 2. Fourteen (shaded in gray) of 15 known extant lamniform species examined in this
study, along with their species codes in parentheses (scale = 50 cm: drawings after Compagno,
1984; Shimada, 2005). Common name of each species with its family in parentheses in
illustrated sequence: Mo, goblin shark (Mitsukurinidae); Ct, sandtiger shark (Odontaspididae);
Of, smalltooth sandtiger (Odontaspididae); Odontaspis noronhai, bigeye sandtiger
(Odontaspididae); Pk, crocodile shark (Pseudocarchariidae); Mp, megamouth shark
(Megachasmidae); Ap, pelagic thresher (Alopiidae); As, bigeye thresher (Alopiidae); Av,
common thresher (Alopiidae); Cm, basking shark (Cetorhinidae); Cc, white shark (Lamnidae);
Io, shortfin mako (Lamnidae); Ip, longfin mako (Lamnidae); Ld, salmon shark (Lamnidae); Ln,
porbeagle (Lamnidae).

62
Figure 3. Dorsal (top) and lateral (bottom) views of brain in each of 14 extant lamniform species
(scale = 1 cm), along with their species codes in parentheses (see caption of Fig. 2 for their
common names and families). Illustrated specimens: Mo, FMNH 117742; Ct, FMNH 16136; Of,
BPBM 9335; Pk, FMNH 117474; Mp, NSMT-P 134785; Ap, FMNH 117473; As, UF 178509;
Av, SIO 64-804A; Cm, images from Kruska (1988, fig. 3: reproduced with permission by Karger
Publisher); Cc, LACM 56960-1; Io, SIO 55-85; Ip, FMNH 135411; Ld, FMNH 117475; Ln,
ROM 22751.

63
Figure 4. Log10 regression between body mass and brain mass in terms of weight in 14 species
of lamniform shark (for species codes, see Figs. 2, 3).

64
Figure 5. Regression between brain size (EQ) and cerebellar foliation (FI) in 15 species of extant
lamniform sharks (A), and that between actual brain weight (aBrW) divided by body weight
(BoW) of the shark and FI (B) (for species codes, see Figs. 2, 3).

65
Figure 6. Foliation index (FI), encephalization quotient (EQ), and ‘optimized’ encephalization
quotient (oEQ: see text) mappend onto morphology-based (A) and molecular-based (B)
phylogenetic trees of extant lamniforms (for species [sp.] codes, see Figs. 2, 3) and scyliorhinid
carcharhiniform, Scyliorhinus retifer (Sr), as outgroup (see text for sources of phylogenetic trees;
see Table 3 for raw data where EQ and oEQ values are rounded to one decimal in this figure;
asterisk [*] indicates likely deviation due to young individual).