comparative analysis on the growth … analysis on the growth performance of catfish (clarias...
TRANSCRIPT

American Journal of Research Communication www.usa-journals.com
Omeru, et al., 2016: Vol 4(6) 89
COMPARATIVE ANALYSIS ON THE GROWTH PERFORMANCE OF CATFISH (Clarias Gariepinus) FED WITH EARTHWORM AS A
REPLACEMENT OF FISH MEAL
OMERU, E. D. AND SOLOMON, R. J.
Department Of Biological Sciences, Faculty of Science, University of Abuja, Abuja-Nigeria
ABSTRACT
Growth performance of African catfish Clarias gariepinus fed with earthworm fish meal
investigated along with Coppens commercial fed as control for three months. A group of 15
fishes/m2 with 0.400 ± 0.03kg were shocked in three circular tanks labeled A, B and C (50cm x
30cm x 26cm). Tank A was fed 100% Coppens, ( moisture 8.3%, crude protein 45%, crude fiber
1.5%, Ash 9.5%, and Crude lipid 12%). Tank B, earthworm and fish meal at the ratio of
(70.30%) (moisture 8.05%, crude protein 39.94%, crude fiber 11.25%, Ash 6.15%, and crude
lipid 12%) and Tank C at the ratio of (50:50) (moisture 5.35%, crude protein 39.02%, crude fiber
11.00%, Ash 6.75%, and crude lipid 10%). The fishes were fed 4% of their body weight twice
daily, 7am-8am in the morning and 5pm-6pm in the evening. The fingerling stocked were
between 2.0 cm in length and 0.4 g in weight. The result however showed Tank B having the
highest growth rate of (47.44g) followed by Tank A (46.16g) and Tank C having the lowest
value (45.47g). the analysis done using a One-way ANOVA showed no significant difference
(p˃0.05) for food conversion efficiency (FCE) and survival rate (SR). However, there was a
significant difference (p˂0.05) in mean growth rate, weight gain, growth rate, and specific
growth rate. Based on these findings, earthworm is recommended on the bases of affordability as
a substitute for Coppens commercial feed for the feeding of Clarias gariepinus.
{Citation: Omeru, E. D.; Solomon, R. J. Comparative analysis on the growth performance of
catfish (Clarias Gariepinus) fed with earthwork as a replacement of fish meal. American
Journal of Research Communication, 2016, 4(6): 89-125} www.usa-journals.com, ISSN: 2325-
4076.

American Journal of Research Communication www.usa-journals.com
Omeru, et al., 2016: Vol 4(6) 90
1.0 INTRODUCTION
BACKGROUND OF THE STUDY
Fish is an important and the cheapest source of animal protein and account for about 37%
of Nigeria total protein requires (FAO, 2002). Fish provides approximately 16% of the animal
protein consumed by the world population (FAO, 1997). It is particularly an important protein
source in require where livestock is relatively scarce.
Billions of people mostly in developing countries depend on fish as a primary source of
animal protein (FAO, 2000). FAO estimated that by the year 2010, demand of fish will increase
by 13.5%-18.5% or to about 105-110% millions metric tons (FAO, 2000). Further increase in
capture fisheries are not anticipated under the current global condition (Ounham et al., 2001).
Faturoti (1999) noted that recent trends all over the world pointed to a cleared in landing from
capture fisheries which are all indicator that fish stock have approached or even exceeded point
of maximum sustainable yield. The food and agriculture organization recommended that an
individual takes 3 series per capture of animal protein per day for sustainable growth and
development. However, the animal protein consumption in Nigeria is less than 8g per person per
day which is a far cry from the FAO polonium recommendation. The rapid growth of Nigeria
population has lead to insufficiency in supply of animal protein source food consequently also
lead to tremendous efforts resulting in increasing animal production. Fish is a major source of
animal protein source and an essential food item in diet of many people in Nigeria. Fish is also a
good source of Thiamine, Riboflavin, Vitamin A and D, Phosphorus, Calcium, and Iron. It is
also very high in polyunsaturated fatty acids which are important in lowering blood diolestral
level, it is therefore suitable for complementing high carbohydrate diets typical of low income
group in Nigeria (Areola, 2008). Apart from being food, fish is also an important source of
income to many people in developing countries including Nigeria. FAO (1996) confirms that as
much as 5% of the African population have 35million people depending wholly or partly on
fisheries sector for their livelihood.
Traditionally, Nigeria can be classified as a country of fishermen existing in the Niger
Benue river system i.e the Lake Chad, the Kianji Lake and the vast lower Niger region.
American Journal of Research Communication www.usa-journals.com
Omeru, et al., 2016: Vol 4(6) 91
However, the importance of fish in the diet of Nigeria further significantly increased after the
Sahara drought of 1971 to 1979. This drought which greatly decimated the cattle population put
the price of livestock virtually in affordable in the majority of Nigeria. This trend thus triggered
an increase in the demand for fish alternative source of animal protein (Anadu et al., 1993).
Fish farming has become a worldwide practice and has been for years. Increase aquaculture
production is clearly needed to meet this demand in the third millennium because capture
fisheries are at capacity of showing perception decline due to over fishing, habitat destination
and pollution (World Bank, 2005). Aquaculture therefore remains the only viable alternative for
increasing fish production in order to meet the protein demand of people (Omotoyin, 2007). One
of the aquaculture is the increase in the production aid growth rate of fish that will meet the
demand of increase population.
Catfish of the family Claridae comprise the most commonly cultivated fishes in Nigeria, the
growth of aquaculture in Nigeria is now largely being boosted by a steady rise in catfish culture,
inadequate availability of seed stocking and feed use to be major problems. The favoured catfish
species in Nigeria aquaculture includes Clarias gariepinus, Heterobranchus bidorsalis and
Clarias nigrodigitatus. Heterobranchus species is the more commonly cultured fish in the South
eastern parts of Nigeria. Africa catfish is popular in the market and has great potentials to boost
the rapidly growing Nigeria aquaculture.
Clarias gariepinus is generally considered to be one of the most important tropical fresh
water fish species for aquaculture whose aquaculture potential have been documented (Dada and
Wanah, 2003). Bruton (1979) pointed out that C.gariepinus has also high fecundity rate, grows
faster, tolerates high density and environmental extremes. It also acdepts wide range of natural
and artificial food and adapts to a variety of feeding modes in expanded niches.
Clarias gariepinus is generally considered one of the most important tropical species of the
aquaculture. It has an almost pan-African distribution ranging from the mili to West Africa and
from Algeria to Southern Africa. They also occur in Asia Minor (Isreal, Syria and South of
Turkey).
American Journal of Research Communication www.usa-journals.com
Omeru, et al., 2016: Vol 4(6) 92
Clarias gariepinus at various geographical locations bears different values. It is called
Clarias lazera in Northern and central Africa, Clarias gariepinus in South Africa (Viveen, et al.,
1985). Clarias gariepinus is characterized with nated skin and dougate with fairly long dorsal aid
anal fins. The dorsa fin has 61-80 soft rays and anal fin has 45-65 soft rays. They have strong
pectoral fins with spines that over serrated on the outer side (Tangels, 1986). It posses nasal and
maxillary barbells and somewhat smallish eyes, their coloring is dark frey or black dorsally and
green coloured ventrally. Adult possess a dark longitudinal lies on either side of the head.
However, this is absent in young fish the head is large, depressed and heavily boned. The mouth
is quiet large and subternuials (Shoelton, 1993 and Teugels 1986). In C.garipinus , exchange of
respiratory gases i.e oxygen and carbohydrate takes place through the gills. Like other mudfish,
it has accessory breathing carborescent organs which enable the fish not only live in stagnant
pools but to travel over damp ground. Clarias gariepinus differs from other catfish in having an
auxiliary breathing organs in this special pochet attached to the second and fourth gillarches and
are responsible for the ability of Clarias gariepinus to live out of much longer than other catfish
(Haylor, 1993.).
Earthworm
Earthworms also called night crawlers are very important animal that aerate the soil with
their burning action and enrich the soil. Soil can have as many as 1000, 000 worms per acre.
Earthworms are more than just fish bait. They are the main contributors to enriching and
improving soil per plants, animals and even humans. Earthworms create tunnels in the soil by
burning which aerates the soil to allow air water and nutrients to reach deep within the soil.
Earthworms eat the soil which has organic matter such as decaying vegetation or leaves. Plants
cannot use this organic matter directly. After organic matter digested the earthworm release
waste from their bodies called casting. Earthworm has been found to be a good source of protein
(Sogbesan and Ugumba 2008, Kostecka and Pax=czka 2006, Guererro 1983, Hilton 1983, Tacon
et al., 1983) and its usage as fish bait is well known in fishing (Omorinkoba, et al., Segun, 1987).
Earthworms with an important high protein component are used to feed pigs, rabbit and as
dietary supplement for fish species (Mason et al., 1992, Sabine 1986, Stafford and Tacon 1985,
Akiyama et al., 1984). The high reproductive rate and biomass production of earthworm species
make it ideally suited to worm meal production.

American Journal of Research Communication www.usa-journals.com
Omeru, et al., 2016: Vol 4(6) 93
Biology of Earthworm
Earthworms are classified in the kingdom Animalia, phylum Annelida or Annelids and
class Citellata, Annelida in Latin meaning a little rings, scientific name lumbricus terrestris. The
earthworm while primitive has well developed nervous circulation, digestive, excretory,
muscular and reproduction system. The most noticeable external feature is the ringing or
segmentation of the body which involves nearly all of the internal structure.
The first section of the earthworm consists of the mouth and the prostomium, a lobe
which serves as a covering for the mouth and as a wedge to force open tracks in the soil into
which the earthworm may brew. Small like structures called setae are located on segments. The
worms lack of protruding structures other than setae facilitates efficient burrowing. In addition,
various glands secrete a lubricating mucus which aids movement through the earth and helps to
stabilize burrows and cast. Earthworms breathe through their skin. Have no lungs if the skin
dries out, they cannot breath and will die. It has five pairs of ear. The rest of the inside of an
earthworm is filled with intestines which digests its food. Mature worms have clitellum the
enlarged segments in the middle of the earthworm the reproductive parts of worms. Terretris are
hermaphrodites, it takes two worms to mate and reproduce. Earthworms are omnivorous and cell
utilize many materials in the soil as food including plant remains and occasionally animal
remains. Lumbricus can outstand considerable starvation and lumbricus terrestris at least a water
loss of up to 70% of the body weight, some species can withstand total immersion in water for
many weeks.
Benefits of Earthworm
Having established their efficiency in converting organic substances to composts, they are
widely used in vermicomposting for waste management, production of soil amendment and other
uses. The conversion of organic waste into vermicomposting started in the United State and
United Kingdom in the 1980s (Guerrero, 2009). Whole or portions of earthworms are
traditionally used as fish bait in the United State. Their commercial production or permaculture
for fish bait was stated in the 1950. (Guerrero, 2009). Worms are excellent source of animal feed

American Journal of Research Communication www.usa-journals.com
Omeru, et al., 2016: Vol 4(6) 94
protein essential amino acids, fats, vitamins, and mineral for livestock’s and fish chemical
analysis of the body tissues of earthworm show the following composition, protein 60-70% fat,
7-10%, carbohydrates 8-20% and minerals 2-3%. It is recommended for processing into
vermiheal, a dried and pulverized feed preparation. They can be used in removing soil pollutants
through bioremediation. Heavy metals and other pollutants can be taken up by the earthworms
and removed from the soil, a process called vermireme diatom.
They serve as pharmaceutical products for the treatment of human diseased. There are many
reports that these worms and body extracts have been used for the treatment of numerous human
disease in China and other Asian countries. Studies conducted by Ang-lopez (2006) revealed that
earthworms are used as sulphuric medicine in Philippines. They also confirmed the anti-blood
clothing action of a crude extract from marshed earthworms used by an indigenous group in
western Asia to thin the blood in the elderlis bact. In 1986 an enzyme called lumbrocuse which
dissolves blood cloths in the human blood streams was isolated by a Japanese scientist. The
breathing has been up into use through the manufacture and commercialization of dietary
products.
They can be processed into human food. They have been used as such by natives of Africa,
Japan, China, New Guinea and New Zealand. In 1999, Guerrero and Martin reported that meat
ball dishes prepared from pure earthworm and 50% earthworm meal and 50% pork were equally
palatable as pure pork. A food supplement was developed from Africa, night crawler with the
same anticoagulant properties as in imported products.
Disadvantages of Earthworm
The annelid worms are not wholly beneficial (Darwin, 1881) reported that they start under
large stones, pavements and buildings where the soil underneath is moist. When their burrows
collapse, these stones and structures tilt and sink.. Additionally, earthworm cast destroys the
aesthetic in lawns and mossy landscape in Bonsai as well as deprive of sunlight the covered
vegetation. Various agriculture problem have also been reported this justifies the promotion
knowledge of vermis in the Philippines. They are also found damaging the roots of germinated
seeds (Marqez, 2005). Belonging either to the genus pheretima or metaphor, these worms are
considered non-native or invasive alien species (Joshi 2006).
American Journal of Research Communication www.usa-journals.com
Omeru, et al., 2016: Vol 4(6) 95
They can degrade rice fields due to soil perforation. According to Hentein et al., (1985).
Soilo engineers are not always welcome and constructing dikes to contain the water. This effort
is counteracted by the soil engineers which include the earthworms.
LITERATURE REVIEW
Fish perform all their bodily function in water because fishes are totally dependent upon
water to breath, feed, from, excrete waste, maintain salt balance, to reproduce and withstand the
physical and chemical qualities of water is critical to successful aquaculture to a great extent,
water determines the success or failure of an aquaculture operation (Ladon, 2000). The average
growth rate for aquaculture has been 8.9% per year since 1970 compared to only 1.2% per
capture fisheries and 2.8% for terrestrial formed meal production over the same period. In 2002,
the total contribution of aquaculture towards total world fish requirement was 29.9% (FAO,
2004). The reason for exceptional growth rate in aquaculture is mainky due to marine stock
depletion.
In 2001, the fisheries scientists Reg Watson and Daniel Pauly expressed concerns in a letter
to nature that China was ever reporting its catch from wild fisheries in 1990 (Watson, et al.,).
Aquaculture is a known food production enterprise in Africa and has become established in a
number of countries. However, in order to realize the full potential of aquaculture technologies
that increase intensification of production making it accessible to the poor and majority of the
Africa population through the use of cultural resource systems such as food plain, rivers and
small water bodies and develop production and marketing strategies that allow farmers to
respond better to changing consumer demand. Aquaculture will contribute effectively in meeting
the high demand of protein in the diet of the average Nigeria (Anadu, et al., 1993). Fish nutrition
has always been a major aspect of research in aqua-feed operations. For fish culture project, the
optimum dietary requirement at a reduced production cost is essential in order to achieve
maximum profit. The major prerequisite for successful fish farming is the availability of suitable
artificial feeds formulated from locally available cheep ingredients that will supply adequate
nutritional requirement for fishes cultured (Lovell, 1980). One of such ingredient is fish meal,
which has been used extensively as a valuable source of rice protein in aqua feed. This is because
of it hither to unrivaled properties in terms of biological value digestible energy and excellent
array of amino acid component when compared with other commercially available protein source

American Journal of Research Communication www.usa-journals.com
Omeru, et al., 2016: Vol 4(6) 96
(Lovell, 1981; Eyo, 2003). However, its protein contrition by weight (50-75%) in aqua-feed
formulation is slightly lower than those contributed by poultry feather meal (60-84%) and blood
meal (80-86%) (Adikwu, 1991; NRC 1993, Eyo 2003), it is believed that fish diet represent the
greatest single high cost item in fish farm operations (Olomola 1990, Falaye 1992, Mohauty and
Dashim 1993, Olvera-Nora 1996) and contributing between 40-60% the recurrent cost. This
increases the cost of producing and reduced the profit margin and high price tag for consumers.
Additionally, fish meal is scarce and expensive (Eyo, 1985).
The major clarias species are the most preferred farmed fish species in africa because of the
fast growth rate and higher acceptability of the consumer (Sogbesan, 2006). Clarias gariepinus
is very popular to fish farmers for high market price, fast growth rate, good food conversion
ratio, resistance to diseases infection and ability to withstand adverse paid conditions especially
low oxygen content and high turbidity. The culture of Clarias gariepinus dry as seed for fish
production is becoming increasingly essential as the fish is contributing to the food abundance
and nutritional benefit to the family health, income generation and employment opportunities
(Bamidele, 2007).
The qualitative nutritional requirement of fish provide relevant information and nutrient
feeds of fish species in order to supply adequate amount of these nutrient in formulated diet for
optimum fish performance (Falaye, 1992). With the exception of water and energy the dietary
nutrient requirements of all aquaculture species can be considered under five different nutrient
groups, protein, lipids, carbohydrates, vitamins and minerals. The science of aquaculture
nutrition and feeding is concerned with the supply of these dietary nutrient to fish or shrimp
either directly in the form of an exogenous artificial diet or indirectly through the increase
production of natural live food organisms within the water body in which the fish or shrimp are
cultured (FAO, 1987), feed alone has been estimated to account for between 40-70% the cost of
intensive aquaculture operation (Pathmasothly, 1983, Olvera Nora, 1996).
Therefore reducing feed cost is a major challenge in aquacultutre nutrition protein is the
most expensive ingredient in a balance fish ratio. This is because protein is an important
component in the diet of man and prominent completion for essential raw materials for animal
feed industries. Experimental studies showed that fingerlings of different species of Clarias
gariepinus have different growth performance and different feed utilization efficiency under

American Journal of Research Communication www.usa-journals.com
Omeru, et al., 2016: Vol 4(6) 97
different culture system. It was observed that hybrids exhibits a high degree of cannibalism and a
resulting high individual growth rate with a corresponding low production yield due to a high
mortality rate (Vander, Waal 1978). The feeding of Heteroclarias fingerlings on earthworm is
readily available free from mains of completion and had been accredited to its high quality
protein with amino acid profile showing its biological value to be superior to soybean and
groundnut cake.
Dietary protein is the only source of nitrogen for constructing amino acids and proteins in
fish. The protein requirement of fish depends on the composition and ratio of amino acids. Fish
are fed higher percentage of protein in their diets than land animals but they have lower energy
daily requirement of 100g of body weight for maximum growth of channel catfish decreased
significantly as size increase from 1.64kg for 3g fish to 0.45kg for 260g fish (Mangalik, 1986).
Soybean meal is currently the major protein source for catfish feeds in the United States. The
protein has a favourable amino acid profile for channel catfish (NRC, 1993) but substituting fish
meal into soya beans meal-grain diets for catfish improves growth.
The growth rate in fishes is highly variable and depends upon a number of environmental
factors such as temperature amino of dissolved oxygen ammonia, salinity photoperiod, degree of
composition, quality of food taken, age and the state of Maturity of the fish, temperature is one
of the most important environmental factors and along with other factors influences growth rate.
Thus, optimum food consumption for maximum growth is temperature dependent. For example,
level depends on temperature and by itself is also an important factors affecting growth rate of
fishes. Possibly, the fish is deprived of extra aerobic energy required for growth and reproduction
if dissolved oxygen falls in high concentration, well slow down the growth rate.
Energy is one of the most important parts of the diet and feeding standard for many
animals are based on energy needs, feed intake for catfish may be more a function of how much
feed they are allowed to have rather than energy concentration in the strictly regulated by dietary
energy, balance of dietary energy is important when formulating catfish feed (Jantrarotai, 1994).
Moreover, if dietary energy content is too high, catfish may not eat as much as expected
resulting in low intake of essentials nutrients. The absolute energy requirement for catfish are
unknown, the estimates that are available have been made by measuring weight gain or protein
American Journal of Research Communication www.usa-journals.com
Omeru, et al., 2016: Vol 4(6) 98
gain of catfish feed diets known contents of energy (Hossain, et al., 1998), Hentein, et al., ).
Energy requirements for catfish, which have generally been expressed as a ratio of digestible
energy (DE) to crude protein range from 31.0 t0 50.2kg-1. Based on current knowledge, a DE/P
ratio from 35.6 to 39.8kg-1 is adequate for used in commercial catfish feeds, increase the DE/P
ratio of catfish diets above this range will increase fat deposition band reduce processed yield
and in contrast if the energy value is too low the fish will grow slowly (Nematipour, et al.,
1992a).
2.0 MATERIALS AND METHOD
Aquarium and Treatment
Three circular aquarium ,for 30L capacity, 50cm x 30cm x 26cm were used for the trials
under laboratory conditions, the aquariums were obtained from Gwagwalada market and
transported to the biological science garden, University of Abuja. There were 3 treatments with
different stocking densities designated A, B, and C, each aquaria were stocked with 15 catfish
fingerlings respectively. The catfish stocked in each aquaria vary in size, ranging from 0-10cm
and 10-20g to avoid cannibalism. No prophylactic treatment was given before acclimation.
Fishes were acclimated for seven days in the biological science garden.
The initial weight, length, mean length and mean weight were recorded and the fishes were
starved for 24hrs to empty their gut conten in preparation for the experiment. The aquariums
were covered with mosquito net to prevent fingerlimgs from jumping out, intrusion of insects
and other bodies (Lizards, geckos etc).
Formulation of Fish Feed
Large amount of fully grown earthworms Lumbricus terrestis were obtained during the
rainy season when they range freely and brought into the laboratory. The earthworms were
washed and cleaned using blotting paper. They were sacrificed by introducing them into boiling
water squashed. Ingredients such as groundnut cake 20g, cornflower 20g, rice bran 20g, eggs 70g
and brewer’s yeast 30g were added to the earthworms and mixed together, pap was used as a
banding agent. The mixture was pelleted wet; the pellets were put in trays and sun dried. The
fingerlings were fed 4% of their body weight twice daily, morning 8am and evening 6pm. Tank
American Journal of Research Communication www.usa-journals.com
Omeru, et al., 2016: Vol 4(6) 99
A was fed Coppen fish feed, Tank B was fed experimental diet1 (Earthworm and fish meal 70%,
30% respectively and Tank C was fed experimental diet 2 (Earthworm and fish meal 50%, 50%).
The fish weight was taken using a weighing balance OHAUS 2000 model. The fingerlings were
weighed in one per each. The standard length of the fish was taken to the nearest cm with the aid
of a measuring ruler.
Methodology for Proximate Analysis
Proximate analysis is a method for the quantitative analysis of the different macronutrients.
It is also the portioning of compounds in a feed into categories based on their chemical
properties. This categories includes lipid and nitrogen free extracts (digestible carbohydrates).
Moisture
This is essential for controlling moisture in powdered food aid sample to avoid contamination
during storage.
Crude Lipids
This is applicable for the determination of crude fat in dried storages and mixed feeds.
Crude Protein
This is applicable to fish, fish products and fish by products. It is used to determine the protein
level in food.
Ash
This consists of oxidizing all organic matter in a weighed sample of the material by incineration
and determining is the weight of the products and other materials with low carbohydrate content.
Physiological Parameters
Some physiological parameters and environmental factors like temperature, dissolved,
oxygen, hydrogen ion concentration, Ammonia and nitrate. Temperature was measured using the
mercury in glass thermometer, dissolved oxygen was measured by collecting water sample from
American Journal of Research Communication www.usa-journals.com
Omeru, et al., 2016: Vol 4(6) 100
aquarium to determine the dissolved oxygen content using the water analysis kit Ph, Ammonia
and nitrate was measured using the comb II strips.
Growth Parameters
1.Mean Weight Gain %. Calculated as
MWG = Final mean weight x 100
Initial mean weight
2. Mean Length Gain %. Calculated as
MLG = Final mean length x 100
Initial mean length
3. Specific Growth Rate. Calculated as
SGR = 1Nwt – LnWt x 100
T
Where WT = Final Weight
Wt = Initial weight
T = Time interval (Solomon 2006)
Ln = Natural log
4. Food Conversion Efficiency. Calculated as
FCE = Weight gain x 100
Feed intake
5. Mean Growth Rate. Computed using Standard Equation
MGR = W2 – W1 x 100 x 1
0.5 (W1 W2) 1
Where W1= initial weight
American Journal of Research Communication www.usa-journals.com
Omeru, et al., 2016: Vol 4(6) 101
W2= final weight
t = period of time
0.5 = constant
6. Survival rate (SR); This was calculated by the total amount of fish stocked and total amount
of fish harvested in percentage.
SR= total number of fish harvested x 100
Total number of fish stocked
(Akinwole et al., 2006)
7. Length – weight relationship
W = aLb……………… (1)
a. Log W= Log a + b Log L……… (2)
Where W = weight of the fish (g)
L = Standard length of Fish (cm)
a = Constant
b = an exponent.
LeCren (1951)
b. Condition Factor
K = W x 100 ………. 3
L
Worthington and Richard (1930)
Where k = condition factors
W = weight (g)
L = standard length (cm).

American Journal of Research Communication www.usa-journals.com
Omeru, et al., 2016: Vol 4(6) 102
3.0 RESULTS
TABLE 1: PRODUCTION PARAMETERS FOR TREATMENT (A)
Parameters
Initial week
Wk one
Wk two
Wk three
Wk four
Wk five
Wk six
Wk seven
Wk eight
Wk nine
Wk ten
Wk elev.
Wk twelve
Total
Gross total weight (g)
15.22
20.82
26.15
29.19
36.23
39.27
45.31
50.38
55.42
61.45
67.51
73.49
79.61
600.05
Mean weight (g)
1.01 1.38
1.74
1.94
2.41
2.61
3.02
3.32
3.69
4.09
4.5 4.89
5.3 39.9
Gross total length (cm)
28.9 31.48
37.21
42.31
49.37
54.43
59.49
65.51
70.56
76.61
81.42
87.41
92.55
777.25
Mean length (cm)
1.92 2.09
2.48
2.82
3.29
3.62
3.96
4.36
4.7 5.1 5.42
5.82
6.17 51.75
Weight gain (g)
0 0.37
0.36
0.2 0.47
0.2 0.41
0.3 0.37
0.4 0.41
0.39
0.41 4.29
Length gain (cm)
0 0.17
0.39
0.34
0.47
0.33
0.34
0.4 0.34
0.4 0.32
0.4 035 4.25
Gross specific growth rate (g)
0 1.94
0.7 0.22
0.33
0.1 0.14
0.09
0.07
0.07
0.05
0.04
0.04 3.79
Food conversion eff. %
0 9.25
0.09
0.05
11.75
0.05
10.25
7.5 9.25
10 10.25
9.75
10.25
88.44
Mean growth rate
0 0.28
0.057
0.063
0.019
0.019
0.011
0.007
0.006
0.005
0.003
0.003
0.002
0.471
Survival rate
100 100 100 100 100 100 100 100 100 100 100 100 90 1290
Total 2860.2
American Journal of Research Communication www.usa-journals.com
Omeru, et al., 2016: Vol 4(6) 103
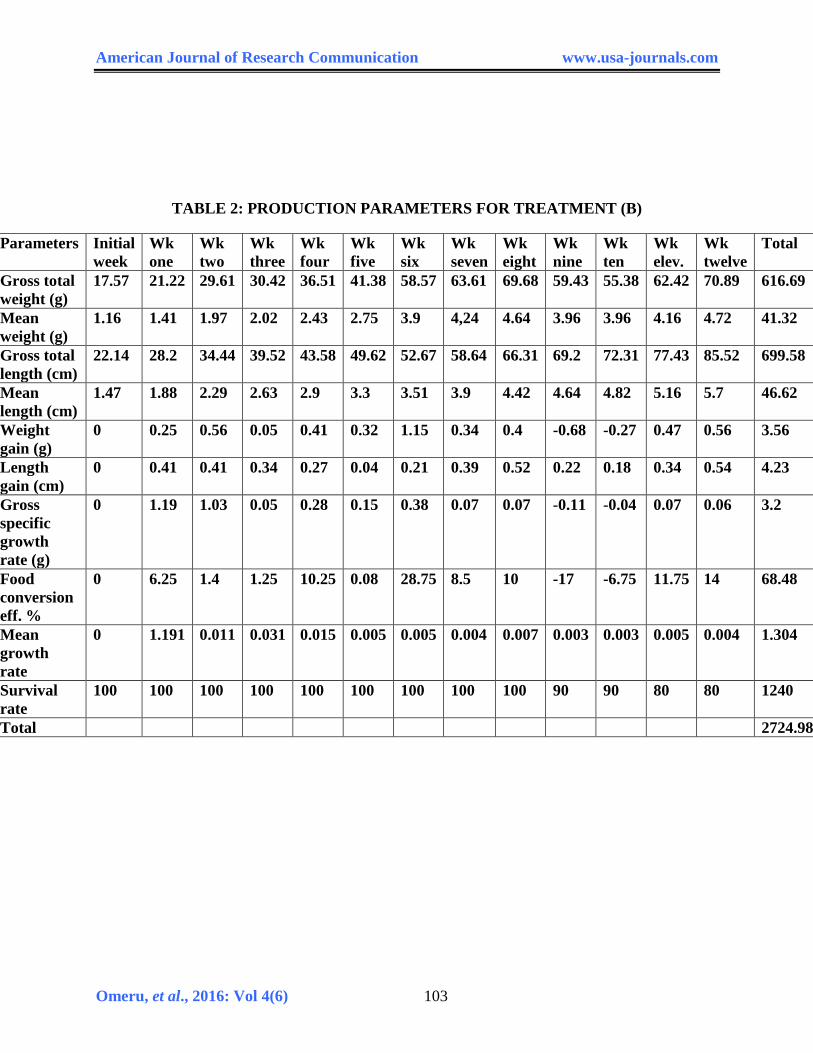
TABLE 2: PRODUCTION PARAMETERS FOR TREATMENT (B)
Parameters Initial week
Wk one
Wk two
Wk three
Wk four
Wk five
Wk six
Wk seven
Wk eight
Wk nine
Wk ten
Wk elev.
Wk twelve
Total
Gross total weight (g)
17.57 21.22 29.61 30.42 36.51 41.38 58.57 63.61 69.68 59.43 55.38 62.42 70.89 616.69
Mean weight (g)
1.16 1.41 1.97 2.02 2.43 2.75 3.9 4,24 4.64 3.96 3.96 4.16 4.72 41.32
Gross total length (cm)
22.14 28.2 34.44 39.52 43.58 49.62 52.67 58.64 66.31 69.2 72.31 77.43 85.52 699.58
Mean length (cm)
1.47 1.88 2.29 2.63 2.9 3.3 3.51 3.9 4.42 4.64 4.82 5.16 5.7 46.62
Weight gain (g)
0 0.25 0.56 0.05 0.41 0.32 1.15 0.34 0.4 -0.68 -0.27 0.47 0.56 3.56
Length gain (cm)
0 0.41 0.41 0.34 0.27 0.04 0.21 0.39 0.52 0.22 0.18 0.34 0.54 4.23
Gross specific growth rate (g)
0 1.19 1.03 0.05 0.28 0.15 0.38 0.07 0.07 -0.11 -0.04 0.07 0.06 3.2
Food conversion eff. %
0 6.25 1.4 1.25 10.25 0.08 28.75 8.5 10 -17 -6.75 11.75 14 68.48
Mean growth rate
0 1.191 0.011 0.031 0.015 0.005 0.005 0.004 0.007 0.003 0.003 0.005 0.004 1.304
Survival rate
100 100 100 100 100 100 100 100 100 90 90 80 80 1240
Total 2724.984
American Journal of Research Communication www.usa-journals.com
Omeru, et al., 2016: Vol 4(6) 104
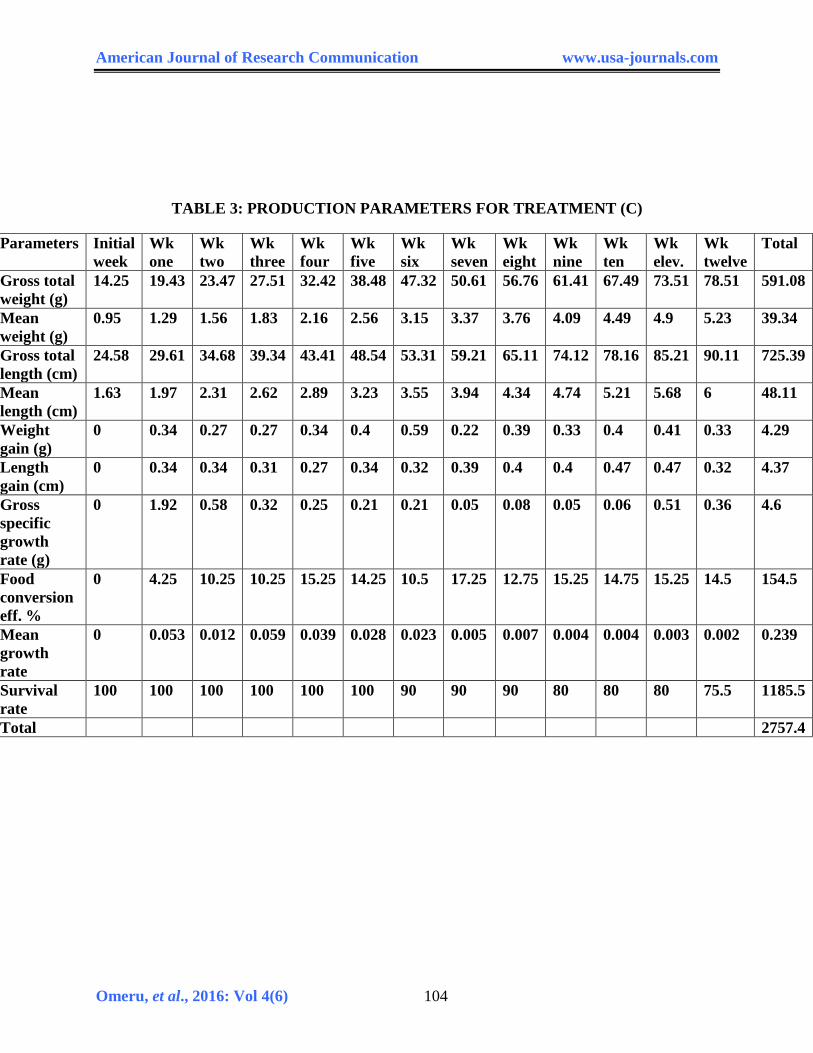
TABLE 3: PRODUCTION PARAMETERS FOR TREATMENT (C)
Parameters Initial week
Wk one
Wk two
Wk three
Wk four
Wk five
Wk six
Wk seven
Wk eight
Wk nine
Wk ten
Wk elev.
Wk twelve
Total
Gross total weight (g)
14.25 19.43 23.47 27.51 32.42 38.48 47.32 50.61 56.76 61.41 67.49 73.51 78.51 591.08
Mean weight (g)
0.95 1.29 1.56 1.83 2.16 2.56 3.15 3.37 3.76 4.09 4.49 4.9 5.23 39.34
Gross total length (cm)
24.58 29.61 34.68 39.34 43.41 48.54 53.31 59.21 65.11 74.12 78.16 85.21 90.11 725.39
Mean length (cm)
1.63 1.97 2.31 2.62 2.89 3.23 3.55 3.94 4.34 4.74 5.21 5.68 6 48.11
Weight gain (g)
0 0.34 0.27 0.27 0.34 0.4 0.59 0.22 0.39 0.33 0.4 0.41 0.33 4.29
Length gain (cm)
0 0.34 0.34 0.31 0.27 0.34 0.32 0.39 0.4 0.4 0.47 0.47 0.32 4.37
Gross specific growth rate (g)
0 1.92 0.58 0.32 0.25 0.21 0.21 0.05 0.08 0.05 0.06 0.51 0.36 4.6
Food conversion eff. %
0 4.25 10.25 10.25 15.25 14.25 10.5 17.25 12.75 15.25 14.75 15.25 14.5 154.5
Mean growth rate
0 0.053 0.012 0.059 0.039 0.028 0.023 0.005 0.007 0.004 0.004 0.003 0.002 0.239
Survival rate
100 100 100 100 100 100 90 90 90 80 80 80 75.5 1185.5
Total 2757.4
American Journal of Research Communication www.usa-journals.com
Omeru, et al., 2016: Vol 4(6) 105
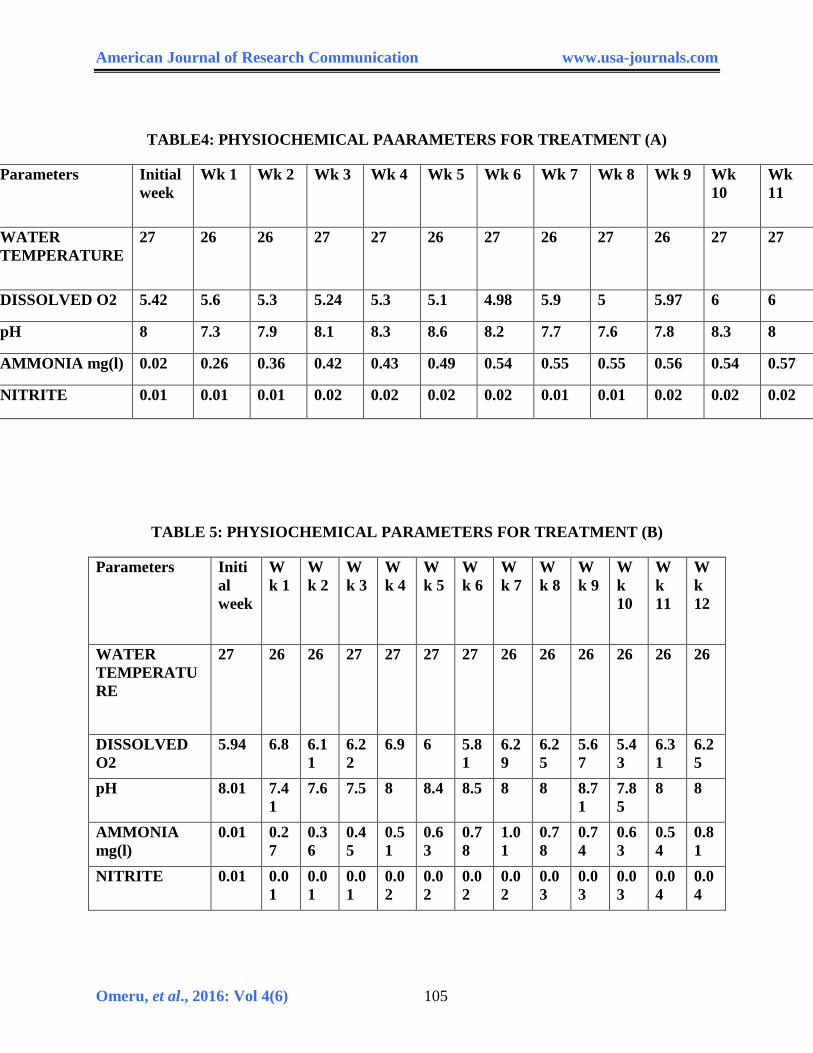
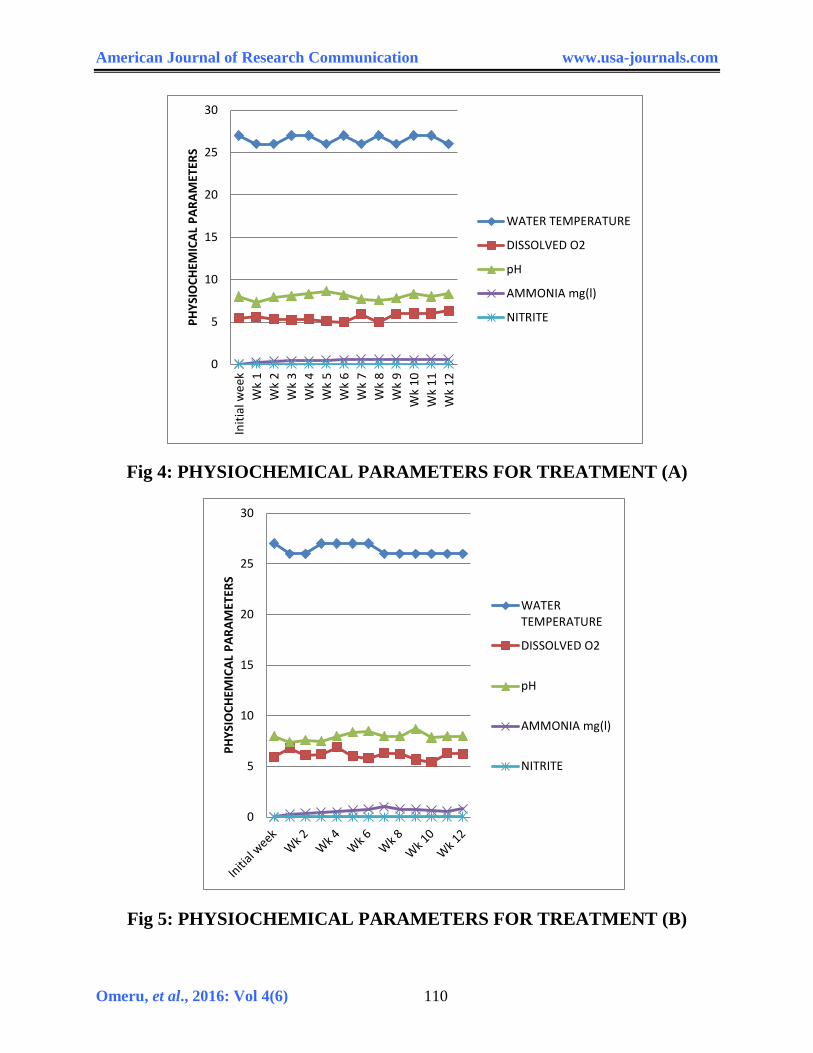
TABLE4: PHYSIOCHEMICAL PAARAMETERS FOR TREATMENT (A)
Parameters Initial week
Wk 1 Wk 2 Wk 3 Wk 4 Wk 5 Wk 6 Wk 7 Wk 8 Wk 9 Wk 10
Wk 11
WATER TEMPERATURE
27 26 26 27 27 26 27 26 27 26 27 27
DISSOLVED O2 5.42 5.6 5.3 5.24 5.3 5.1 4.98 5.9 5 5.97 6 6
pH 8 7.3 7.9 8.1 8.3 8.6 8.2 7.7 7.6 7.8 8.3 8
AMMONIA mg(l) 0.02 0.26 0.36 0.42 0.43 0.49 0.54 0.55 0.55 0.56 0.54 0.57
NITRITE 0.01 0.01 0.01 0.02 0.02 0.02 0.02 0.01 0.01 0.02 0.02 0.02
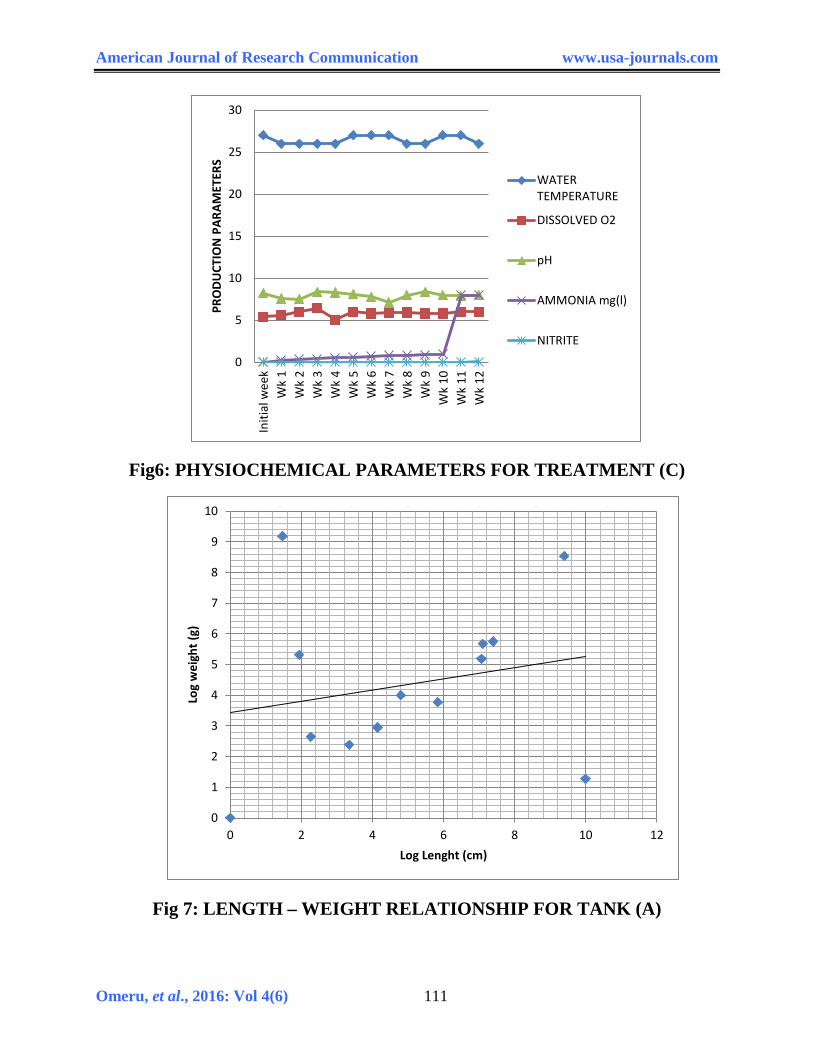
TABLE 5: PHYSIOCHEMICAL PARAMETERS FOR TREATMENT (B)
Parameters Initial week
Wk 1
Wk 2
Wk 3
Wk 4
Wk 5
Wk 6
Wk 7
Wk 8
Wk 9
Wk 10
Wk 11
Wk 12
WATER TEMPERATURE
27 26 26 27 27 27 27 26 26 26 26 26 26
DISSOLVED O2
5.94 6.8 6.11
6.22
6.9 6 5.81
6.29
6.25
5.67
5.43
6.31
6.25
pH 8.01 7.41
7.6 7.5 8 8.4 8.5 8 8 8.71
7.85
8 8
AMMONIA mg(l)
0.01 0.27
0.36
0.45
0.51
0.63
0.78
1.01
0.78
0.74
0.63
0.54
0.81
NITRITE 0.01 0.01
0.01
0.01
0.02
0.02
0.02
0.02
0.03
0.03
0.03
0.04
0.04
American Journal of Research Communication www.usa-journals.com
Omeru, et al., 2016: Vol 4(6) 106
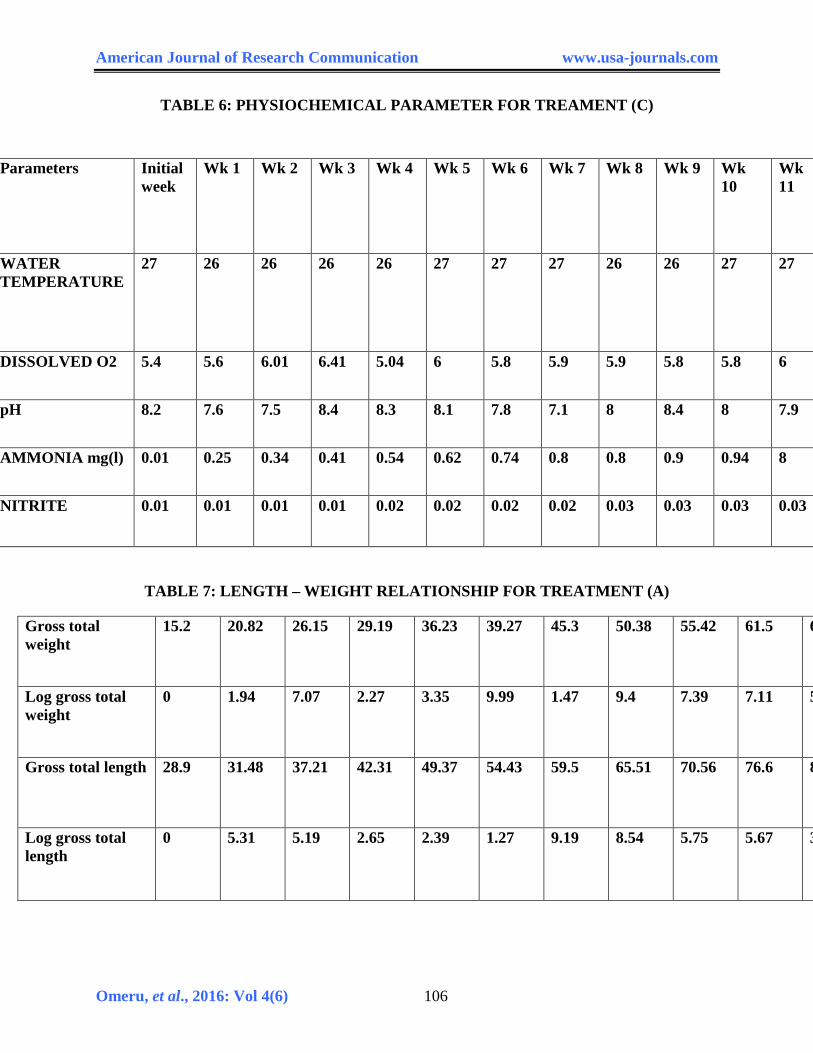
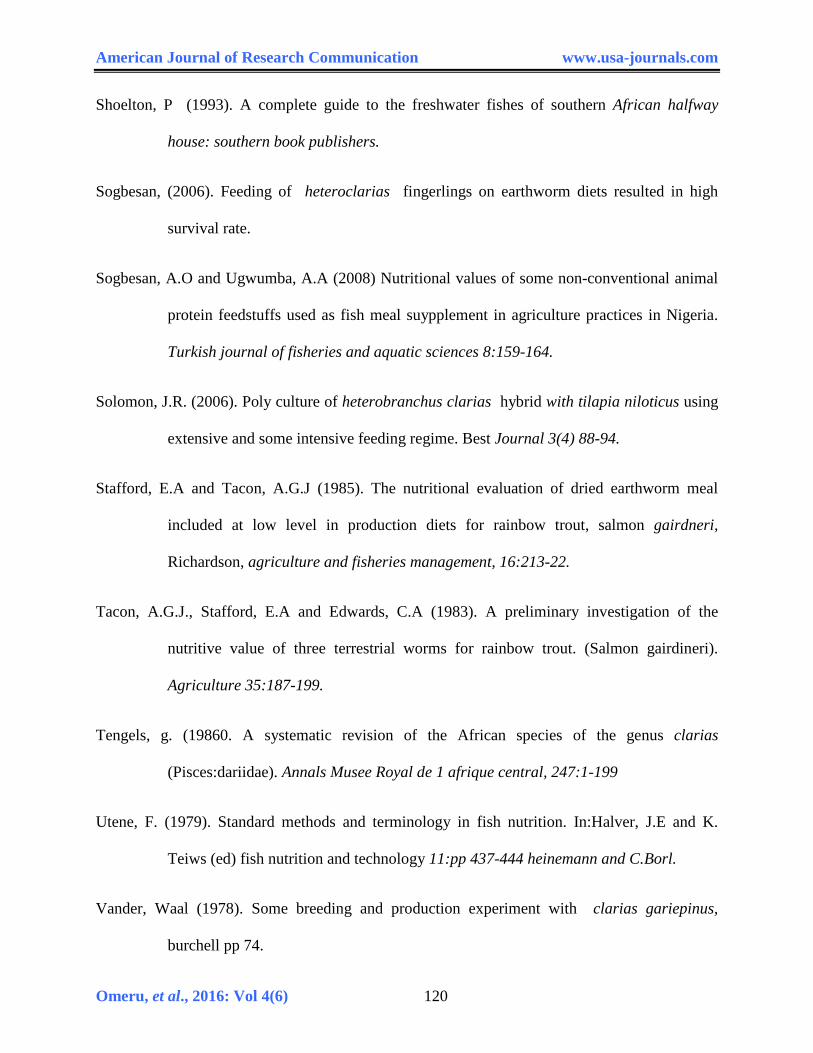
TABLE 6: PHYSIOCHEMICAL PARAMETER FOR TREAMENT (C)
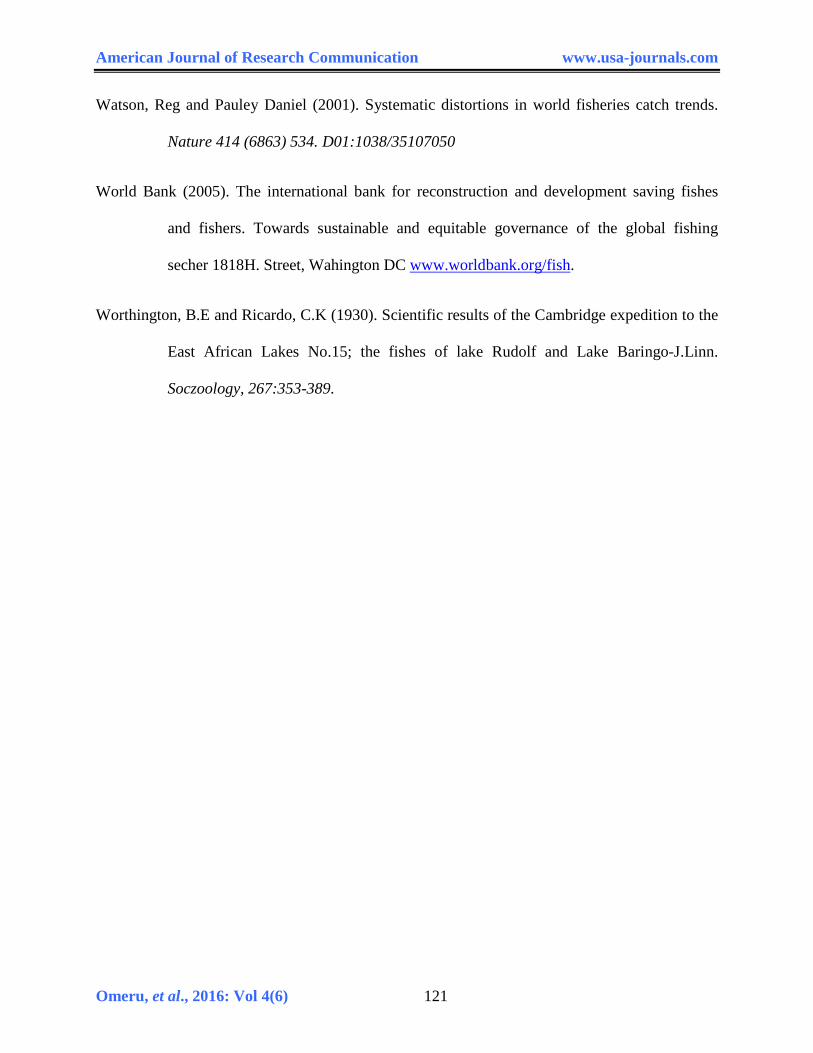
TABLE 7: LENGTH – WEIGHT RELATIONSHIP FOR TREATMENT (A)
Gross total weight
15.2 20.82 26.15 29.19 36.23 39.27 45.3 50.38 55.42 61.5 6
Log gross total weight
0 1.94 7.07 2.27 3.35 9.99 1.47 9.4 7.39 7.11 5
Gross total length 28.9 31.48 37.21 42.31 49.37 54.43 59.5 65.51 70.56 76.6 8
Log gross total length
0 5.31 5.19 2.65 2.39 1.27 9.19 8.54 5.75 5.67 3
Parameters Initial week
Wk 1 Wk 2 Wk 3 Wk 4 Wk 5 Wk 6 Wk 7 Wk 8 Wk 9 Wk 10
Wk 11
WATER TEMPERATURE
27 26 26 26 26 27 27 27 26 26 27 27
DISSOLVED O2 5.4 5.6 6.01 6.41 5.04 6 5.8 5.9 5.9 5.8 5.8 6
pH 8.2 7.6 7.5 8.4 8.3 8.1 7.8 7.1 8 8.4 8 7.9
AMMONIA mg(l) 0.01 0.25 0.34 0.41 0.54 0.62 0.74 0.8 0.8 0.9 0.94 8
NITRITE 0.01 0.01 0.01 0.01 0.02 0.02 0.02 0.02 0.03 0.03 0.03 0.03
American Journal of Research Communication www.usa-journals.com
Omeru, et al., 2016: Vol 4(6) 107
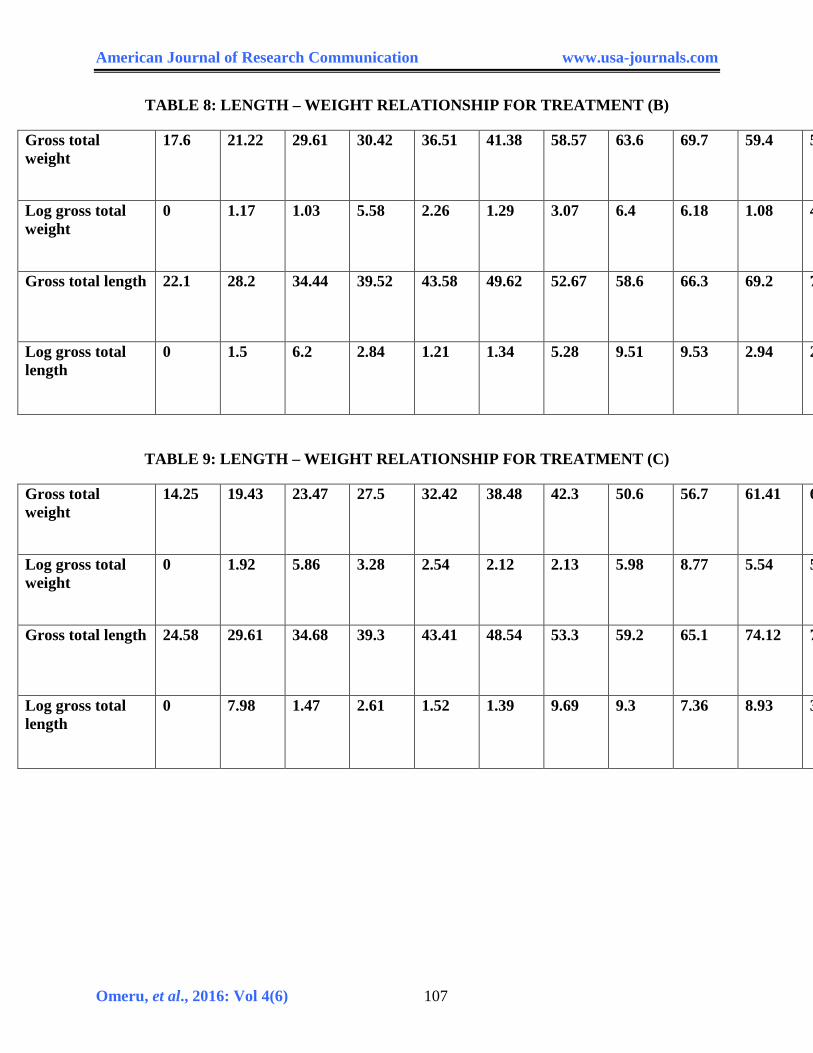
TABLE 8: LENGTH – WEIGHT RELATIONSHIP FOR TREATMENT (B)
Gross total weight
17.6 21.22 29.61 30.42 36.51 41.38 58.57 63.6 69.7 59.4 5
Log gross total weight
0 1.17 1.03 5.58 2.26 1.29 3.07 6.4 6.18 1.08 4
Gross total length 22.1 28.2 34.44 39.52 43.58 49.62 52.67 58.6 66.3 69.2 7
Log gross total length
0 1.5 6.2 2.84 1.21 1.34 5.28 9.51 9.53 2.94 2
TABLE 9: LENGTH – WEIGHT RELATIONSHIP FOR TREATMENT (C)
Gross total weight
14.25 19.43 23.47 27.5 32.42 38.48 42.3 50.6 56.7 61.41 6
Log gross total weight
0 1.92 5.86 3.28 2.54 2.12 2.13 5.98 8.77 5.54 5
Gross total length 24.58 29.61 34.68 39.3 43.41 48.54 53.3 59.2 65.1 74.12 7
Log gross total length
0 7.98 1.47 2.61 1.52 1.39 9.69 9.3 7.36 8.93 3

American Journal of Research Communication www.usa-journals.com
Omeru, et al., 2016: Vol 4(6) 108
TABLE 10: ANALYSIS OF LENGTH – WEIGHT RELATIONSHIP
Tanks
No of Weeks
A
b
r
K
Sign. O
A
12
3.4
4.3
0.212
0.022
+3.1
B
12
1.4
1.92
0.608
0.030
±2.09
C
12
2.6
1.63
0.364
0.026
±2.29
Fig 1: PRODUCTION PARAMETERS FOR TREATMENT (A)
0
10
20
30
40
50
60
70
80
90
100
Initi
al w
eek
Wk
one
Wk
two
Wk
thre
e
Wk
four
Wk
five
Wk
six
Wk
seve
n
Wk
eigh
t
Wk
nine
Wk
ten
Wk
elev
.
Wk
twel
ve
PRO
DUCT
ION
PAR
AMET
ERS
(WEI
GHT
AN
D LE
NG
HT)
Gross total weight (g)
Mean weight (g)
Gross total length (cm)
Mean length (cm)

American Journal of Research Communication www.usa-journals.com
Omeru, et al., 2016: Vol 4(6) 109
Fig 2: PRODUCTION PARAMETERS FOR TREATMENT (B)
Fig 3: PRODUCTION PARAMETERS FOR TREATMENT (C)
0
10
20
30
40
50
60
70
80
90
Initi
al w
eek
Wk
one
Wk
two
Wk
thre
eW
k fo
urW
k fiv
eW
k six
Wk
seve
nW
k ei
ght
Wk
nine
Wk
ten
Wk
elev
.W
k tw
elve
Gross total weight(g)
Mean weight (g)
Gross total length(cm)
Mean length (cm)
0
10
20
30
40
50
60
70
80
90
100
PRO
DU
CT
IOIN
PA
RA
ME
TE
RS
(WE
IGH
T
AN
D H
EIG
HT
) Gross total weight(g)
Mean weight (g)
Gross total length(cm)
Mean length (cm)
American Journal of Research Communication www.usa-journals.com
Omeru, et al., 2016: Vol 4(6) 110
Fig 4: PHYSIOCHEMICAL PARAMETERS FOR TREATMENT (A)
Fig 5: PHYSIOCHEMICAL PARAMETERS FOR TREATMENT (B)
0
5
10
15
20
25
30
Initi
al w
eek
Wk
1W
k 2
Wk
3W
k 4
Wk
5W
k 6
Wk
7W
k 8
Wk
9W
k 10
Wk
11W
k 12
PHYS
IOCH
EMIC
AL P
ARAM
ETER
S
WATER TEMPERATURE
DISSOLVED O2
pH
AMMONIA mg(l)
NITRITE
0
5
10
15
20
25
30
PHYS
IOCH
EMIC
AL P
ARAM
ETER
S
WATERTEMPERATURE
DISSOLVED O2
pH
AMMONIA mg(l)
NITRITE
American Journal of Research Communication www.usa-journals.com
Omeru, et al., 2016: Vol 4(6) 111
Fig6: PHYSIOCHEMICAL PARAMETERS FOR TREATMENT (C)
Fig 7: LENGTH – WEIGHT RELATIONSHIP FOR TANK (A)
0
5
10
15
20
25
30
Initi
al w
eek
Wk
1W
k 2
Wk
3W
k 4
Wk
5W
k 6
Wk
7W
k 8
Wk
9W
k 10
Wk
11W
k 12
PRO
DUCT
ION
PAR
AMET
ERS
WATERTEMPERATURE
DISSOLVED O2
pH
AMMONIA mg(l)
NITRITE
0
1
2
3
4
5
6
7
8
9
10
0 2 4 6 8 10 12
Log
wei
ght (
g)
Log Lenght (cm)

American Journal of Research Communication www.usa-journals.com
Omeru, et al., 2016: Vol 4(6) 112
Fig. 8. LENGTH-WEIGHT RELATIONSHIP FOR TANK (B)
Fig 9:LENGTH-WEIGTH RELATIONSHIP FOR TANK (C)
0
2
4
6
8
10
12
0 2 4 6 8 10 12 14
Log
wei
ght (
g)
Log length (cm)
0
2
4
6
8
10
12
0 1 2 3 4 5 6 7 8 9 10
Log
wei
ght (
g)
Log length (cm)

American Journal of Research Communication www.usa-journals.com
Omeru, et al., 2016: Vol 4(6) 113
4.0 DISCUSSION, CONCLUSION AND RECOMMENDATION
Physiochemical parameter such as atmospheric temperature, water temperature, pH, dissolved
oxygen and biological oxygen (mg/l) were determined for abnormal concentration of any of
these physiochemical parameters may have been the cause of the fish death. However,
numeration and density stress are additional parameters for fish death thus high survival rate and
cannibalism were observed in treatments with higher stocking densities.
The atmospheric and water temperature recorded during the study period ranged between
26% to 320 and 250 to 28% respectively, water and atmospheric temperature readings in all the
treatment (A, B, and C) was within a permissible between range thus shows that the readings
lose within a required or tolerable ranged for the culture of catfish. Swann et al., (1990) recorded
the normal range of temperature for culture of catfish, Clarias gariepinus and Heteroclarias
were between 230 – 320 c.
The pH (hydrogen ion concentration) record for the thus treatments ranged from between 67
and 73 have resulted to the different stocking densities, the results demonstrated that
concentration of dissolved oxygen in all the three treatments were alkaline and within the
permissible between ranges (6.0 – 9.0) for culture of catfish. High level can be influenced by the
selection of some of the water qualities parameters (Akinwole and Fatiroti, 2006).
TEMPERATURE: The temperature readings in all the treatments were within the same range
(26-270 ) this shows that the reading were within the tolerable range for the culture of catfishes as
recommended by (Swarm et al., 1990), the acceptable range of temperature for Clarias
gariepinus is between 23-320 c.

American Journal of Research Communication www.usa-journals.com
Omeru, et al., 2016: Vol 4(6) 114
NITRITE: Over the period of production, the nitrite level did not reach significant that could
affect the fish’s health or growth. It was higher in treatment C (0.003mg/l) while lower in the
remaining treatments. Nitrite levels greater than 0.06mg/l are considered toxic for the culture of
catfish Clarias gariepinus as recommended by the Federal Ministry of Environment (2006).
AMMONIA : high concentration of Ammonia occurred towards the end of production period
which could be attributed to increase in biomass. The concentration was within tolerable range
(Eding et al., 2001) which stated that the value less than 8.8mg/l are considered tolerable for the
culture of catfish Clarias gariepinus.
Discussion
Carbohydrate either of cereal or tuber in fish feed acts as both structural and energy
component which have some influence on the rate of growth of fish provided all other
physiological requirement are satisfied. The growth pattern revealed that Clarias gariepinus
performed best in diet C66. In the present study, the best growth performance and nutrient
utilization was recorded in fish fed 56% level of whole earthworm.
This implies that high inclusion levels of “whole earthworm” in the diet of catfish Clarias
gariepinus enhanced growth rate.The difference in growth observed between the experimental
diets are indication of the variation in the feed utilization. The acceptance by catfish Clarias
gariepinus indicates that replacement of earthworm could be more better than any other fish
meal. Mean while tank C has mean weight gain (0.33g), mean length gain (0.32cm) table 1, 2
and 3. The specific growth rate for the three tanks are: A (0.04), B (0.06) and C (0.36).
Percentage survival was higher in treatment A (90%), B (80%), and C (75%). The highest
mortality was recorded in treatment C, this may be due to handling stress as most of it occurs

American Journal of Research Communication www.usa-journals.com
Omeru, et al., 2016: Vol 4(6) 115
after the weekly samplings and the reduced oxygen level towards the end of the production
period.
The performance of growth in Clarias gariepinus was statistically analyze using the one
way ANOVA. The analysis shows a significant difference p=0.170; p-value 999; df=129; f crit
1.94; appendix 4 treatment B no significany difference (df=129; f=128; p-value=1.000 crit=
1.94, p˃0.5% Appendix 5) treatment C had no significant difference (df=129, f=148, p-
value=1.000, f crit=1.94, p˃0.05 Appendix 6)
Length-weight relationship
The length – weight relationship of fish is an important fishery management tool. Its
importance is pronounced in estimating the average weight at a given length group (Beyer,
1987).
The difference in weight for all sampled batches may be due to the individual condition factor.
The maximum weight was recorded in tanks B 47.43g (slope) values were given all maximum
values for b were recorded as 4.3, 1.92 and 1.63 respectively.
Thus when b is not equal to 3, algometric pattern of growth occur, which could be positive if
˃ 3 or negative if ˂ 3. The pattern, tank B negative algometric pattern and tank C negative
algometric pattern also.
CONCLUSION
Based on the result obtained in this study, inclusion of whole earthworm meal in the diet of
catfish Clarias gariepinus enhanced growth and survival of the fish, hence fish farms can

American Journal of Research Communication www.usa-journals.com
Omeru, et al., 2016: Vol 4(6) 116
therefore take advantage of this ingredient as a replacement for more expensive formulating feed
for fish in aquaculture.
REFERENCES
Adikwu, I.A (1991). The development of complete diet from local feedstuffs and industrial
wastes for the culture of tilapia: Oreochromia nilotichus in Nigeria. Technical report
for the international foundation for science 5.11 Grel, lurogotan,Stockholm/8wedy.
Akinama, T., Murai T., Hirasawa, Y. and Nose T. (1984).Supplementation of various meals to
fish meal diet for salvon fry. Agriculture 37:217-222
Akinwole, A. and E.O Faturoti (2006). Biological performance of African catfish Clarias
gariepinus cultured in recirculating system in Ibadan. Agriculture engineering 36:18-
23.
Anada, O.I and C.O Nwokoye (1993). Effects of stocking density on the growth of the common
carp. Journal of aaquatic sciences, 8:61-68.
Areola, O Folute (2008). Welcome address by the national president fisheries society of Nigeria
(FISCON) at the opening ceremony of the 23rd annual conference of FISCON at the
banquet hall, Arewa house, Kaduna state on 27th October, 2008.
Bamidele, O.O (2007). Introduction to fish farming in Nigeria. Published by University of
Ibadan press, Ibadan Nigeria (ppl-5)

American Journal of Research Communication www.usa-journals.com
Omeru, et al., 2016: Vol 4(6) 117
Beyer, J.E (1987). On length-weight relationship computing the mean weight of the fish of a
given length class. Fish byte 5(1): pp1 1-13
Bruton, N.M (1979) the breeding biology and early development of Clarias gariepinus in lake
sibiya, South Africa with review of breed in species of subgenus clarias : trans 200.
Sci. London 35. Pp 1-45
Dada A.A and Wonah, C. (2003) production of exotic Clarias gariepinus at varying stocking
density in outdoor ponds. Journal of aquatic science 18(i): pp21-24
Darwin C. (1881). The formation of vegetable mould. Through the action of worms with
observations of their habits. London: john Murrecy. Retrieved may 27 2011.
Falaye, A.E (1992). Utilization of afro-industrial wastes as fish feed-stuffs in Nigeria.
Proceeding of the 10th annual conference of FISCON pp42-57.
FAO (1987). Nutrition and feeding of farmed fish and shrimp a training named food and
agriculture organization of the United Nations, Brazil. June 1989.
FAO (1996). Food for all poor issued on the occasion of the world food summit in rome, FAO
Rome, p 64.
FAO, (1997). Review of the state of world agriculture, FAO fisheries circular. Pp886:15,Rome,
Italy.
FAO, (2002). Projected population and fish demand and supply in Nigeria.

American Journal of Research Communication www.usa-journals.com
Omeru, et al., 2016: Vol 4(6) 118
FAO, (2004). The state of world fisheries and agriculture (SOFIA) 2004. FAO corporate
document repository. FAO fisheries department Rone: food and agriculture
organization of the United Nations 153pp.
Faturoti, E.O (1999) fisheries potential and investment opportunities in Nigeria paper presented
at the fisheries society for Nigeria (FISCON), investors workshop half at the NIOMR
Lagos April, 22, 1999.
Guerrero R.D. (2009). Vermnicompost and vermimeal production. MARID agribusiness
technology Guide 22p.
Guerrero, R.D. (1983). The culture and use of perioxy excavates as protein resource in the
Philippines in: J.E Satchell (ed). Earthworm ecology, chapman and hall, London:309-
319.
Ladon, Swann (2000). A fish farmers guide to understanding water quality, department of animal
sciences Illinois. Indiana Sea grant programme. Purdue University.
LeCren, E.D. (1951). The determination of the age and growth of the perch from the opercular
bone-j. Anim Ecol, 16;188-204. S
Lovell, R.T. (1981). How important is fish meal in fish foods. Agriculture magazine, May-June
7.4:35-37.
Lovell, R.T. (1987). Growing popularity of tilapia culture increase. The important of nutrition.
Agriculture magazine 3:1-7.1

American Journal of Research Communication www.usa-journals.com
Omeru, et al., 2016: Vol 4(6) 119
Mason, W,T., Rothamann, R.W and Deguinme, J.F. (1992). Culture of earthworms for bait or
fish food florida cooperative extensive service. Institute of food and agricultural
sciences, University of Florida 1053, pp.1-4.
Monhauty, S.N and Dashim, S.P (1993). Evaluation of azollacarolimina for inclusion in carp
diet. Journal of agriculture research 27:163-173.
NRC, (1993). National Research Council. Nutrient requirement of fish. Washington DC;
National Academic Press.
Olomola, A. (1990). Capture fisheries and agriculture in Nigeria. A comparative economic
analysis. African rural social science series reportr, No. 13 Ibadan, Nigeria:
University Press Ltd.
Olvera-Nora M.A (1996). The dietary protein requirement of catchlasma synspillum fry.
Agriculture research, 27:163-173.
Omorinkoba, W.S and Bankole, N.O. (1985). A preliminary report on earthworm culture for
sport fishing in Kainji lake research institute (KLRI) reservoirs. KLRI animal report
1986, 62-65.
Omotosin ,O.B (2002). Introduction to fish farming in Nigeria printed by royal bird ventures
Mushin-Lagos pp1-50.
Sabine, J.R. (1986). Earthworm as a source of foods and drugs in earthworm ecology from
Darwin to vermiculture, chappnam and Hall, London, New York, pp. 285-296.
Segun, O.A. (1978). Earthworms from Ile-Ife, western Nigeria. J. Natural history. 12:13-31.
American Journal of Research Communication www.usa-journals.com
Omeru, et al., 2016: Vol 4(6) 120
Shoelton, P (1993). A complete guide to the freshwater fishes of southern African halfway
house: southern book publishers.
Sogbesan, (2006). Feeding of heteroclarias fingerlings on earthworm diets resulted in high
survival rate.
Sogbesan, A.O and Ugwumba, A.A (2008) Nutritional values of some non-conventional animal
protein feedstuffs used as fish meal suypplement in agriculture practices in Nigeria.
Turkish journal of fisheries and aquatic sciences 8:159-164.
Solomon, J.R. (2006). Poly culture of heterobranchus clarias hybrid with tilapia niloticus using
extensive and some intensive feeding regime. Best Journal 3(4) 88-94.
Stafford, E.A and Tacon, A.G.J (1985). The nutritional evaluation of dried earthworm meal
included at low level in production diets for rainbow trout, salmon gairdneri,
Richardson, agriculture and fisheries management, 16:213-22.
Tacon, A.G.J., Stafford, E.A and Edwards, C.A (1983). A preliminary investigation of the
nutritive value of three terrestrial worms for rainbow trout. (Salmon gairdineri).
Agriculture 35:187-199.
Tengels, g. (19860. A systematic revision of the African species of the genus clarias
(Pisces:dariidae). Annals Musee Royal de 1 afrique central, 247:1-199
Utene, F. (1979). Standard methods and terminology in fish nutrition. In:Halver, J.E and K.
Teiws (ed) fish nutrition and technology 11:pp 437-444 heinemann and C.Borl.
Vander, Waal (1978). Some breeding and production experiment with clarias gariepinus,
burchell pp 74.
American Journal of Research Communication www.usa-journals.com
Omeru, et al., 2016: Vol 4(6) 121
Watson, Reg and Pauley Daniel (2001). Systematic distortions in world fisheries catch trends.
Nature 414 (6863) 534. D01:1038/35107050
World Bank (2005). The international bank for reconstruction and development saving fishes
and fishers. Towards sustainable and equitable governance of the global fishing
secher 1818H. Street, Wahington DC www.worldbank.org/fish.
Worthington, B.E and Ricardo, C.K (1930). Scientific results of the Cambridge expedition to the
East African Lakes No.15; the fishes of lake Rudolf and Lake Baringo-J.Linn.
Soczoology, 267:353-389.
American Journal of Research Communication www.usa-journals.com
Omeru, et al., 2016: Vol 4(6) 122
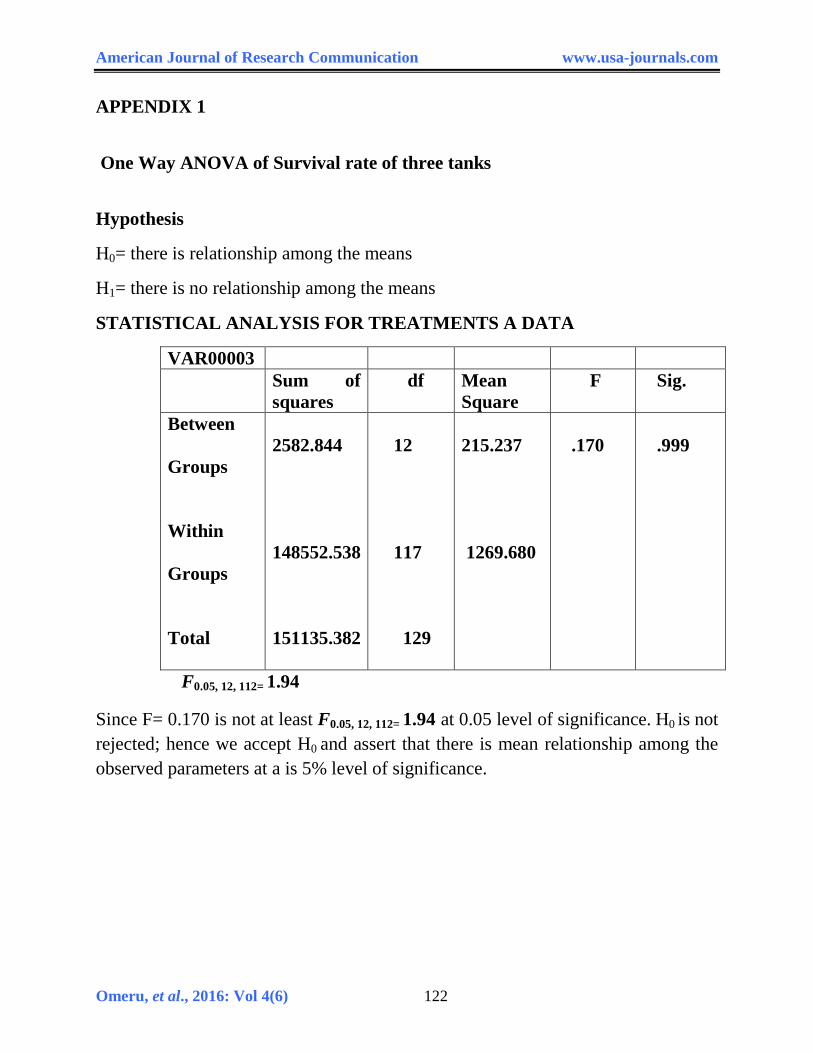
APPENDIX 1
One Way ANOVA of Survival rate of three tanks
Hypothesis
H0= there is relationship among the means
H1= there is no relationship among the means
STATISTICAL ANALYSIS FOR TREATMENTS A DATA
VAR00003 Sum of
squares df Mean
Square F Sig.
Between Groups Within Groups Total
2582.844 148552.538 151135.382
12 117 129
215.237 1269.680
.170
.999
F0.05, 12, 112= 1.94
Since F= 0.170 is not at least F0.05, 12, 112= 1.94 at 0.05 level of significance. H0 is not rejected; hence we accept H0 and assert that there is mean relationship among the observed parameters at a is 5% level of significance.
American Journal of Research Communication www.usa-journals.com
Omeru, et al., 2016: Vol 4(6) 123
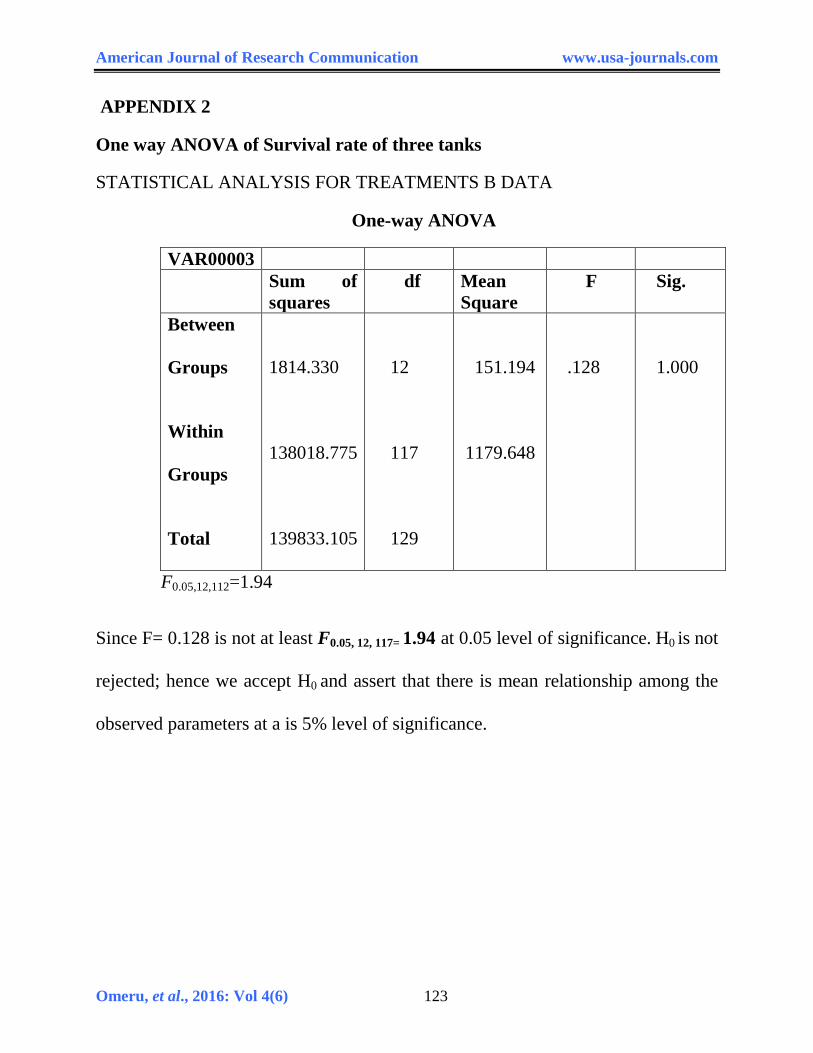
APPENDIX 2
One way ANOVA of Survival rate of three tanks
STATISTICAL ANALYSIS FOR TREATMENTS B DATA
One-way ANOVA
VAR00003 Sum of
squares df Mean
Square F Sig.
Between Groups Within Groups Total
1814.330
138018.775
139833.105
12
117
129
151.194
1179.648
.128
1.000
F0.05,12,112=1.94
Since F= 0.128 is not at least F0.05, 12, 117= 1.94 at 0.05 level of significance. H0 is not
rejected; hence we accept H0 and assert that there is mean relationship among the
observed parameters at a is 5% level of significance.
American Journal of Research Communication www.usa-journals.com
Omeru, et al., 2016: Vol 4(6) 124
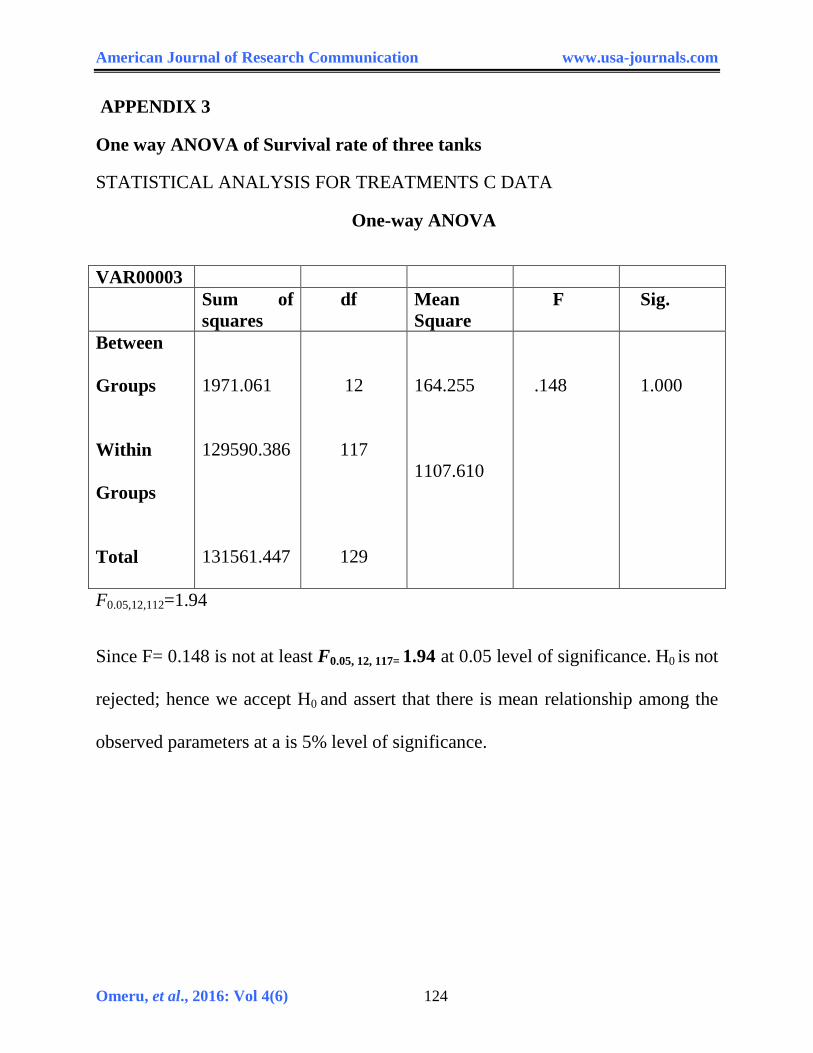
APPENDIX 3
One way ANOVA of Survival rate of three tanks
STATISTICAL ANALYSIS FOR TREATMENTS C DATA
One-way ANOVA
VAR00003 Sum of
squares df Mean
Square F Sig.
Between Groups Within Groups Total
1971.061
129590.386 131561.447
12
117
129
164.255
1107.610
.148
1.000
F0.05,12,112=1.94
Since F= 0.148 is not at least F0.05, 12, 117= 1.94 at 0.05 level of significance. H0 is not
rejected; hence we accept H0 and assert that there is mean relationship among the
observed parameters at a is 5% level of significance.

American Journal of Research Communication www.usa-journals.com
Omeru, et al., 2016: Vol 4(6) 125
APPENDIX 4
Table Composition of Formulated Feeds: Earthworms percentage
Items
Weight (g)
Percentage
Fish Meal 400g 28.6
Earthworm 400g 28.6
Corn 250g 28.6
Rice bran 200g 14.3
Groundnut cake 120g 8.6
APPENDIX 5
Proximate Analysis of the Three Tanks
A B C
Crude protein 45 39.94 39.02
Moisture 8.3 8.05 5.35
Crude fibre 1.5 11.25 11.00
Ash 9.5 6.15 6.75
Crude lipid 12 12 10