comparative analysis of the burden of injury and … comparative analysis.pdfcomparative analysis of...
TRANSCRIPT
6 · Burden of Injury and Illness at Work in Selected Contries and Regions
Comparative Analysis of the Burden of Injury and
Illness at Work in Selected Countries and Regions
JUKKA TAKALA1, PÄIVI HÄMÄLÄINEN2, NOORA NENONEN3,KEN TAKAHASHI4, ODGEREL CHIMED-OCHIR5, JORMA RANTANEN6
1 Workplace Safety and Health Institute, Ministry of Manpower, Singapore2 Ministry of Social Affairs and Health, Tampere, Finland3 Tampere University of Technology, Tampere, Finland4 University of Sydney, Asbestos Diseases Research Institute, Concord Clinical School 5 University of Occupational and Environmental Health, Department of Environmental Epidemiology, Japan6 University of Helsinki, Finland
AbstractDeveloped countries have made tremendous progress in Workplace Safety and Health in terms of reducing the burden of occupational injuries caused by accidents. Developing countries and transition economies experience both high injury and illness risks at work. There is a clear need to look more carefully at the long latency diseases and disorders caused by work. In order to have a baseline for priority setting and future work, a better picture of the burden caused by work is needed. Data on both fatalities and non-fatal outcomes, attributable fractions based on the exposure-outcome relationship, Labour Force Surveys including ad hoc modules on workplace injuries and ill-health and data from several comparable countries have been obtained, modified, adapted, and used. Comparisons between countries are not straightforward but an effort has been made to compare numbers and rates. Globally there were 2.3 million work-related deaths in 2011. While cancers (666,000 deaths) and cardiovascular diseases (827,000 deaths) kill much more workers than injuries (353,000 deaths), the number of Years of Lives Lost to work-related injuries is still very high as those injured were much younger than, for example, those who died from work-related cancers. Various estimates indicated that largely comparable numbers exist for work-related cancer, while other work-related diseases, disorders and injuries were less comparable due to non-coverage of some and poor coverage of others. For major countries and regions, China had 173,000 work-related cancer deaths while the European Union (EU28) had 103,000. China’s workforce is around three times bigger but also younger than that of EU28. China had an estimated 99,000 injury deaths at work while EU28 had 4,700 such deaths. For smaller comparable countries, Hungary had 96 fatal
Corresponding author: Jukka Takala Workplace Safety and Health Institute, Ministry of Manpower, Singapore E-mail: [email protected]
Received:1st June 2017Accepted: 14th June 2017

Central European Journal of Occupational and Environmental Medicine 2017; 23 (1-2); · 7
occupational injuries, 3,986 work-related disease deaths, totalling 4,082 deaths. Singapore had 115 fatal occupational injuries based on compensation records, and an estimated one work-related suicide and 1,323 fatal work-related diseases totalling 1,439 fatal work-related injuries and illnesses. Hungarian and Singaporean burden and fatal work-related disease cases and rates of work-related diseases were comparable taken the size of workforce. Fatal injury rates in these countries are at the same level than in most Western European countries and Japan and are among the 20 safest countries globally. Of individual factors causing deaths asbestos appears to be the most significant one with an estimated 237,000 (184,000 – 290,000) work-related deaths. In workers’ self-reported surveys carried out in 2007-2008, Hungarian and Singaporean non-fatal injury rates were also comparable. Later surveys showed increasing non-fatal trends and compensation sources indicated lower fatality trends. Background data for calculations and comparative tables are presented in separately available datasets by WHO regions and country and based on the 2014 ILO study. The authors concluded that health disorders at work are much less comparable than fatal injuries across countries and regions. Future studies can improve the estimates but there is no reason to wait for further research to start taking action to reduce both injuries and illnesses. Many work-related diseases, such as occupational cancers can be eliminated by reducing the exposures. Applying a mindset of Vision Zero and Zero Harm at work is needed for eliminating or radically reducing the burden of injuries and illnesses from work.
Key Words: work-related diseases and deaths, workplace injuries and ill-health, cancer, mesothelioma, occupational injuries, asbestos, DALY
INTRODUCTION
Over the years, developed countries have done well to reduce occupational injuries (Hämäläinen et al., 2005; Hämäläinen et al., 2009), despite having an increasingly complex environment.
As seen in many developed countries, the health component of workplace safety and health is rapidly increasing in importance compared to the safety component. The relatively higher importance of health is caused by improvements in safety and by reduction of the number of workers in hazardous industries. In developed countries, another major component in reducing accidents has been the shift in economic structures. Hazardous and labour intensive workplaces, such as those in manufacturing have decreased in developed countries and much of such work takes place in other locations, in particular, in Asia. It is common that in developed countries more than two thirds of all workers are already working in service occupations. The processes of mechanization, automation and prefabrication are also foreseen to contribute to jobs less exposed to injuries. However, a majority of the population is exposed to “new and emerging” work risks related to long-term health effects, such as psychosocial factors.
This paper reviews latest global and country numbers of occupational accidents and work-related illnesses in 2014 and spin-off data of selected countries and regions.
8 · Burden of Injury and Illness at Work in Selected Contries and Regions
The objectives of this paper include:
a) Create a better understanding of short and long-term health risks caused by work and of the expected serious consequences;
b) Based on recent estimates compare data from available sources to understand the magnitude of various occupational problems and disorders, based on indicators commonly used. Analysis of existing estimates from different countries and regions and differences between countries and estimates would provide a roadmap for setting priorities;
c) Identify the main targets for the elimination and reduction of exposures to negative workplace factors causing long-term serious outcomes and deaths related to work, and
d) Provide facts and evidence for priority action related to WSH policies, strategies, regulatory measures, enforcement, engagement and building of a mindset and culture of total workplace health and well-being at work.
MATERIALS AND METHODS*
Sources of data on the burden of injuries and illnesses at workWe reviewed employment figures, mortality rates, occupational burden of diseases and injuries, reported accidents, surveys on self-reported occupational illnesses and injuries, attributable fractions, economic cost estimates of work related injuries and ill-health, and the most recent information on the problems from published papers, documents, and electronic data sources of international and regional organizations, in particular ILO, WHO, EU and ASEAN, institutions, agencies, and public websites.
Occupational injuries and work-related illnesses While it is difficult to compare national data related to occupational injuries due to differences in legal and compensation criteria, the comparison between the number of fatal injuries (accidents) is easier and, although not completely, it is relatively comparable when the recording criteria, denominators and economic structures are well documented. Usually fatal injuries are expressed per 100,000 employed population in national statistics, or per 1 million working hours which may be converted to 100,000 full time employed.
Some international and regional organizations collect such data, notably the International Labour Organization (ILO), the World Health Organization (WHO) and the European Union (EU). In addition, research mechanisms and published scientific papers complement these sources. Data collection systems for these still vary so their comparability has limitations. Using a combination of these sources, a selection of such data is presented in Figures 1 and 2. For example, Singapore had 2.3 fatal injuries per 100,000 employed in 2010. These numbers exclude fatal commuting injuries between home and work and injuries that took place in work-related traffic on public roads and other public traffic according to Health and Safety Executive
*The data bases used for this paper are accessible on the homepage of the Central European Journal of Occupational and Environmental Medicine (www.omfi.hu/cejoem/)

Central European Journal of Occupational and Environmental Medicine 2017; 23 (1-2); · 9
report (HSE, 2014) based on EU’s Eurostat numbers. The after removal of fatalities arising from work-related traffic injuries enables comparison. The best countries included major countries such as United Kingdom with 0.74 fatal injuries per 100,000 employed and Germany 0.9 per 100,000. Hungary was slightly safer than Singapore, when using numbers from the WSH Institute regular reports. Comparative global outcomes are based also on ILO estimates (ILO, 2014) as sources for global data. Data including work-related traffic will significantly increase the rates (up to double of those presented).
Figure 1. Standardized incidence rates (per 100,000 workers) of fatal accidents at work for 2011 (Eurostat 2014), Singapore and World rates are not standardized by economic structures.
The standardized numbers in Figure 1. included adjustments based on average industry structures in the EU. Countries that have a relatively high level of activity in high-risk industries or construction work would otherwise show much higher rates as compared to those with a high service industry component even though within each economic sector, their safety levels and rates would be equal to those in another country. Singapore’s rate and ILO global rates are not standardized and reflect a different level of more hazardous economic activities. Fatal injury rates in industrialized countries are gradually going down partly due to a shift in the countries’ economic structure from dangerous sectors to less risky ones, such as the service sector, and partly due to better leadership, management and efforts in safety and health, see Figure 1. Figure 2 from Singapore illustrates the trend in many industrialized countries where fatal occupational injuries have become gradually a smaller problem.

10 · Burden of Injury and Illness at Work in Selected Contries and Regions
Figure 2. Singapore Fatal Injury Rate Performance
Occupational disease is usually understood to be a disorder or illness included in the designated list of diseases at work where employment injury compensation is legally defined. Inclusion in such list is influenced by both evidence of work-relatedness and by administrative, financial and political arguments by the government or region concerned. In reality, the number of illnesses covered depends on the countries’ development, political commitment and financial capacity. A disease, such as stress or musculoskeletal disorder may be included in a list of occupational diseases in a country while not included in a list of another country. The concept of occupational injuries is usually much better defined as compared to occupational diseases.
Work-relatedness is a gradual component that may vary between obvious and commonly agreed to barely detectable. Often the work-relatedness is measured by the population attributable fraction (AF).
Past studies on work-related illnesses, and often including injuries, have been carried out in several countries, and globally. These have been based on the attributable fraction method and cover a varying number of illnesses and diseases. The AF method is well described by e.g. Nurminen and Karjalainen (Nurminen et al., 2001). Some attributable fractions were modified using values by Rushton (Rushton et al., 2012).
Methods and data sources for the estimates related to fatal outcomesMethods used in collecting data for the ILO estimates were using sources in addition to ILO, from WHO and Global Burden of Disease (GBD) of the Institute of Health Metrics and Evaluation (IHME). The method and obtained results are explained elsewhere (Hämäläinen, 2010; Lim et al., 2012; Nenonen et al., 2014; Takala et al., 2014a; GBD, 2016). The denominator in fatal injury rates is usually the number of employed persons. However, in other cases, the full labour force or data on the total population by age groups had been used. In many developing

Central European Journal of Occupational and Environmental Medicine 2017; 23 (1-2); · 11
countries, the number of those formally employed is a small fraction of all who work in the country as self-employed, subsistence farmers, and those working in the informal sectors, and were usually not properly captured in the statistics. Globally, the labour force size may also be an underestimate in some countries as large numbers of those below 15 years of age work, starting from as young as under ten years, and a sizable number of those beyond any retirement age must work for survival. The same applies to collecting data on injury incidents.
Table I.Summary of ILO method and data sources
Estimates of work-related deaths Methods/ Data Sources
a) Total number of deaths due to work injuries
Number. of fatal injuries reported to the ILO and member States- Included fatal injuries, injury rates, work-related traffic
fatalities,- suicide, but excluded fatalities via commuting to work and
back,- As ILO data includes data from a limited number of countries,
those countries where no information was available were grouped in specific regions, such as WHO groups and sub-groups, and fatal injury rates per 100,000 employed of one or several countries that had produced injury rates, were used as proxy values,
- To improve the accuracy, separate injury rates were used for 1) agriculture and fishing, 2) industry including construction, and 3) service sector. This balances the potential differences between reporting proxy countries and non-reporting countries.
b) Total number of deaths due to work- related diseases
All-cause mortality data from the World Health Organization- Breakdown by diseases and groups of diseases- Breakdown by gender and age groups
Applied disease-specific AFs to the all-cause mortality data in 2015.
The AFs were largely referenced from the Nurminen (Nurminen et al., 2001) paper, with some replaced by more recent AFs. The reference epidemiological studies and their source industries and occupations to which the AFs were derived were also reviewed. When no systematic data existed from elsewhere on the number and share of exposed workers, figures for similar occupations from Nurminen were used. Certain conditions were applied to exclude non-work-related deaths. For instance, children were excluded by using only deaths between the specific age groups.
c) Total number of intentional injuries due to work
Applied AF in Nurminen 2001 data complemented by that of Rushton (Rushton et al., 2012) to mortality data from WHO
d) Total number of suicides due to work
Applied AF in Nurminen 2001 data complemented by that of Rushton to mortality data from WHO

12 · Burden of Injury and Illness at Work in Selected Contries and Regions
RESULTS
OverallAn estimated 2.3 million deaths occurred annually across the countries for reasons attributed to work according to ILO estimates. The biggest mortality burden came from work-related diseases, accounting for 2 million deaths whilst the remainders were due to occupational injuries.
The GBD 2015 Study reported 1,086,000 deaths, of which 204,000 from occupational injuries and 882,000 from diseases caused by selected occupational risks. The main reasons for the differences were that the GBD process does not yet count circulatory and cardiovascular, communicable, neuropsychiatric conditions, genitourinary system diseases at work.
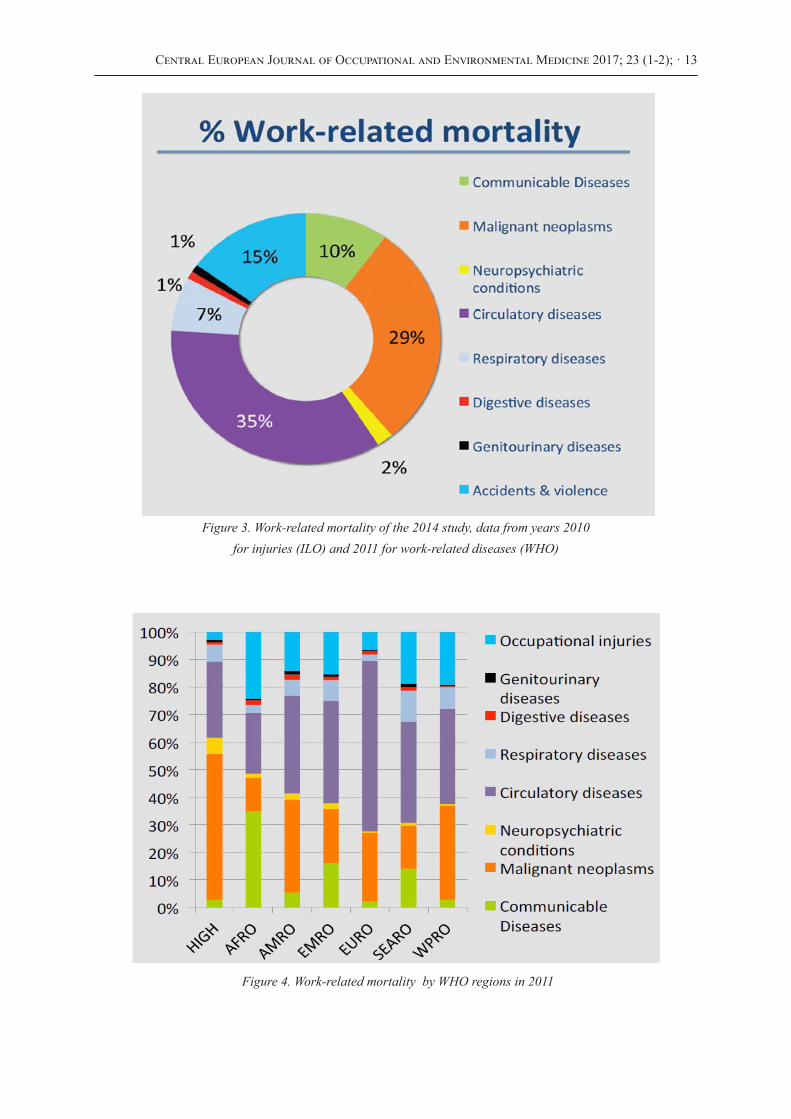
Globally, cardiovascular (circulatory) diseases at 35% and cancers at 29% were the top illnesses responsible for 2/3 of deaths from work-related diseases, followed by occupational injuries at 15% and infectious diseases 10%. Occupational cancer counted for 666,000 deaths in 2011 in ILO estimates, and 489,000 by the GBD 2015. The main reason for the difference is that the GBD 2015 study covered selected IARC List 1 – confirmed carcinogens – only while the ILO estimates covered also IARC List 2A cancers – probable carcinogens. There is a slow but gradually increasing trend in the coverage of IARC Lists where probable carcinogens are moved into the confirmed carcinogens list when enough scientific evidence is gathered. For example, diesel exhaust was only recently added to the IARC List Class 1, while the exposures and related cancers had been there for decades earlier.
Industrialized countries (WHO High Income Region) had a higher burden from cancers, at 53% and a much smaller attribution from accidents and infectious conditions each at 3%. This reflects the average life expectancy in the High Income Economies, typically the share of cancers – and work-related cancers – will increase when life expectancy goes up. The African region of WHO had the highest relative share of work-related communicable diseases. The Western Pacific Region estimates are dominated by China and the South East Asian estimates are dominated by India. The European Union estimate for occupational cancer deaths is 103,000. The corresponding number of the GBD 2015 Study was 75,279 deaths based on selected carcinogens. The Dutch National Institute for Public Health and the Environment (RIVM) reported 80,000 deaths caused by chemical carcinogens, while neither covering UV and ionising radiation, specific work processes, shift work nor sedentary work (Jongeneel et al., 2016). Taken the missing components these results would be in the same magnitude as the ILO estimates. The ILO corresponding cancer number for EU28 caused by only hazardous substances in 2011 was 55,600. This was obtained through the EU28 share of all cancers caused by chemical carcinogens globally (ILO, 2014; Nenonen et al., 2014).
Central European Journal of Occupational and Environmental Medicine 2017; 23 (1-2); · 13
Figure 3. Work-related mortality of the 2014 study, data from years 2010for injuries (ILO) and 2011 for work-related diseases (WHO)
Figure 4. Work-related mortality by WHO regions in 2011
14 · Burden of Injury and Illness at Work in Selected Contries and Regions
Tabl
e II
. Fa
tal i
njur
ies a
t wor
k (o
ccup
atio
nal a
ccid
ents
) inc
ludi
ng a
nd e
xclu
ding
thos
e re
late
d to
traffi
cin
sele
cted
cou
ntri
es a
nd r
egio
ns, a
bsol
ute
num
bers
(N*)
and
fata
l inj
ury
rate
(N*/
100,
000)
Year
& T
ype/
Are
aSi
nga-
pore
aFi
nlan
dbG
er-
man
ybSp
ainb
U.K
.bE
U15
bE
U28
cE
U28
/IL
Oad
d
Chi
na,
Gvt
2013
d
Chi
na,
IHM
E/
GB
D20
13
Chi
na,
ILO
20
10d
ILO
/W
orld
dG
BD
/IH
ME
e
Rat
e, 2
011-
13, e
xcl.
traffi
c@w
ork
2.3
0.75
0.94
2.16
0.74
1.39
2.0
2.15
11.0
i5.
0i
N*,
201
1 ex
cl. t
raffi
c@w
ork
6126
f19
4
N*,
201
0-11
, inc
l. tr
affic@
wor
k80
g28
507
365
~650
h2,
910
4,10
34,
692
69,4
3431
,715
99,1
97
352,
800i
159,
000i
a Si
ngap
ore
WSH
Sta
tistic
s, W
SH In
stitu
teb
EURO
STAT
num
bers
refe
rred
by
the
Hea
lth a
nd S
afet
y Ex
ecut
ive,
U.K
. web
pag
e: h
ttp://
ww
w.hs
e.go
v.uk/
stat
istic
s/pd
f/fat
alin
juri
es.p
df (
acce
ssed
11.
9.20
14),
wor
k-re
late
d
traffi
c in
juri
es e
xclu
ded
, rat
e fo
r Fin
land
in y
ear 2
013
incl
udin
g w
ork-
rela
ted
traffi
c w
as 0
.8/1
00,0
00 w
orke
rs, i
n Si
ngap
ore
1.8/
100,
00 in
201
4.c
EURO
STAT
Fat
al A
ccid
ents
at W
ork
by E
cono
mic
Act
ivity
18
July
201
4, in
clud
es ro
ad tr
affic
at w
ork,
web
pag
e ht
tp://
epp.
euro
stat
.ec.
euro
pa.e
u/st
atis
tics_
expl
aine
d/in
dex.
ph
p/H
ealth
_and
_saf
ety_
at_w
ork_
stat
istic
s (
acce
ssed
11.
9.20
14)
d Se
e en
d no
te re
fere
nces
refe
rrin
g to
ILO
Glo
bal E
stim
ates
201
4 (T
akal
a et
al.
2014
; Nen
onen
et a
l., 2
014)
, adj
uste
d: in
clud
es a
ll em
ploy
ed a
nd ro
ad tr
affic
at w
ork,
and
G
over
nmen
t of C
hina
(Gov
ernm
ent o
f Chi
na, 2
014)
see
http
://w
ww.
stat
s.gov
.cn/
engl
ish/
Pres
sRel
ease
/201
402/
t201
4022
4_51
5103
.htm
l e
Insti
tute
of H
ealth
Met
rics,
GBD
Cau
se P
atte
rns,
Occ
upat
iona
l Risk
s, Ra
te, B
oth
sexe
s, G
loba
l, we
b pa
ge:
http
://vi
zhub
.hea
lthda
ta.o
rg/g
bd-c
ause
-pat
tern
s/
(acc
esse
d 18
.09.
2015
)f
Stat
istic
s Fin
land
, Offi
cial
Sta
tistic
s of F
inla
nd (O
SF):
Occ
upat
iona
l acc
iden
t sta
tistic
s [e-
publ
icat
ion]
. IS
SN=
1797
-954
4. 2
011.
Hel
sink
i: St
atis
tics F
inla
nd [r
efer
red:
11.
9.20
14].
Acc
ess m
etho
d: h
ttp://
ww
w.st
at.fi
/til/t
tap/
2011
/ttap
_201
1_20
13-1
1-27
_tie
_001
_en.
htm
l an
d ht
tp://
ww
w.st
at.fi
/til/t
tap/
2011
/ttap
_201
1_20
13-1
1-27
_tau
_001
_fi.h
tml
g W
ork-
rela
ted
traffi
c fa
talit
ies i
nclu
ded,
seam
en a
nd o
ther
ass
igne
d w
orke
rs’ f
atal
ities
exc
lude
d, a
ll in
juri
es c
ompe
nsat
ed w
as 1
15h
The
Roya
l Soc
iety
for t
he P
reve
ntio
n of
Acc
iden
ts: “
Arou
nd o
ne th
ird o
f fat
al a
nd se
riou
s roa
d cr
ashe
s inv
olve
som
eone
who
was
at w
ork.
“ In
201
2: 1
754
road
fata
litie
s al
toge
ther
, of
whi
ch 1
/3 is
mor
e th
an 5
00, w
eb p
age:
http
://w
ww.
rosp
a.co
m/fa
qs/d
etai
l.asp
x?fa
q=29
6
(acc
esse
d 11
.9.2
014)
i Fo
r the
Glo
bal B
urde
n of
illn
ess a
nd in
juri
es th
e de
nom
inat
or is
cal
cula
ted
for t
otal
pop
ulat
ion
and
conv
erte
d to
cov
er la
bour
forc
e in
201
1 (3
,200
,509
,548
mill
ion)

Central European Journal of Occupational and Environmental Medicine 2017; 23 (1-2); · 15
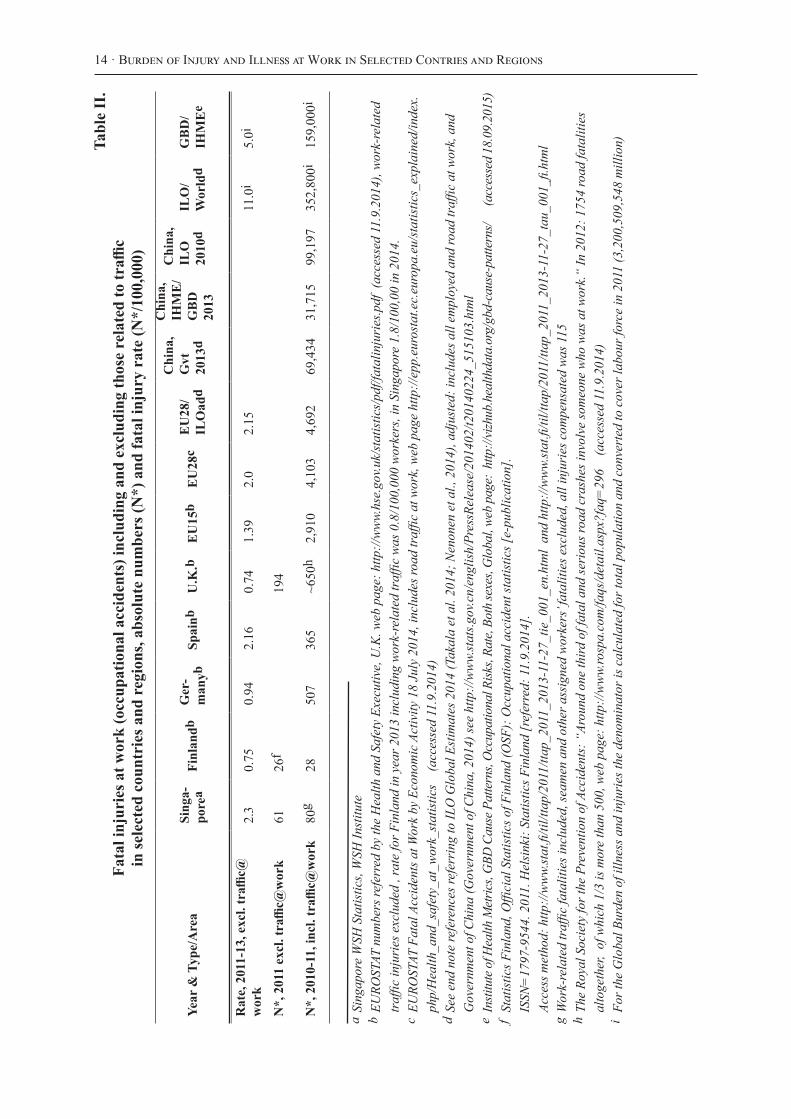
Occupational injuriesA more detailed comparison of the injury rates is presented in Table II. A wide difference exists in estimates between ILO (ILO, 2014), GBD (Lim et al., 2012) and Chinese Government’s own reports (Government of China, 2014). While the numbers of GBD 2015 (GBD, 2015) have gone gradually up – 36,004 deaths in 2015 – it is still far from the Chinese Government’s own reports, which are unlikely to be over-reported. It is understood that the Chinese reported deaths do not include the sizable number of subsistence farmers as the reference group, which could increase the number of deaths in China to beyond the ILO estimate.
However, the global number of deaths caused by injury risks or occupational risk factors was 481,429 deaths in GBD 2010, 159,000 in GBD 2013, and 203,677 in GBD 2015 within the global community at work. The ILO estimate has been in the range of 350,000 injury deaths, the latest release from 2014 was 352,769. The latest GBD number appears to be based on raw data from ILO occupational rates from ILO Statistics of which most rates are from industrialized and other “safer” countries due to lack of reporting from most countries – 85 % of the Member States – including the most populous countries in the world. The method on occupational injury estimates used in the GBD process is not easily verifiable and repeatable with present level of data transparency and lack of inclusion and reference population criteria that were used, while the numbers conflict with many officially reported numbers, such as those in China. The GBD 2015 Study would give a rate 2.76/100,000 of full population. This would mean that Portugal has a higher injury risk than India, Austria is riskier than China, and Ireland has a higher injury risk than the average world rate. None of those are likely to be true. Occupational injury risk in many developing countries and sectors is ten to twenty times of those in some of the high income economies.
Table III. Number of estimated deaths in Hungary and the European Union in 2011
Disease or disorder European UnionHungary* WHO EURO as reference
Work-related circulatory diseases 53,419 2,639
Work-related cancer 102,527 1,072
Work-related communicable diseases 5,000 86
Respiratory diseases 12,079 102
Other work-related disorders 14,467 87
All work-related diseases 187,492 3,986
Fatal occupational injuries 4,692 96
Total occupational mortality 192,184 4,082
If EU28 is used as a reference there would be 1808 occupational cancers

16 · Burden of Injury and Illness at Work in Selected Contries and Regions
Tabl
e IV
.W
ork-
rela
ted
illne
sses
and
inju
ries
in p
ast s
tudi
es, a
nnua
l fat
al n
umbe
rs N
* an
d fa
tal r
ates
N*/
100
,000
em
ploy
ed
Yea
r &
type
/are
aSi
ngap
ore
Finl
andj
Uni
ted
Stat
esSp
ain
U.K
.N
ew Z
eala
ndH
unga
ryE
U28
, IL
O a
djus
ted
ILO
Wor
ldn
GB
D W
orld
N*,
all
fata
l inj
urie
s and
ill
ness
es, n
atio
nal e
st.
1 43
91
810
j49
000
k16
100
l13
000
m70
0-1
000
-n/
an/
an/
a
N*,
all
fata
l inj
urie
s and
ill
ness
es, I
LO
Est
imat
e of
20
14n
2 40
02
075
119
500
17 9
3524
400
1 81
24
263
192
200
352
769
1 97
9 00
020
4,00
088
2,00
0
Em
ploy
men
t and
la
bour
forc
e, IL
O m
ill.
1.85
o3.
09
2.45
139.
0618
.46
28.9
42.
183.
84.
321
8.05
2 22
1.63
3 20
0.51
3 31
2.26
5 (2
013)
Fata
l Illn
ess r
ate,
N*/
100
000
empl
d.-I
LO
Est
imat
e-N
atio
nal E
stim
ate
77.7
42.8
73.9
82.2
j85
.935
.297
.287
.284
.3n/
a83
.132
.1-4
5.9
105.
4188
.189
.1n/
a
N*,
ann
ual f
atal
inju
ries
, na
tiona
l est
. 201
0-14
m55
+14p
82 j
(16)
6 2
00 3
38 q
172
~100
96r
n/a
n/a
n/a
N*,
ann
ual f
atal
inju
ries
, IL
O e
st. 2
010-
14n
5543
4 69
034
217
211
896
4,69
235
2 76
9n/
a
N*,
ann
ual f
atal
inju
ries
, G
BD
est
.35
635
702
878
322
6214
38
041
n/a
203
677u
Inju
ry r
ate
N*/
100
000
wor
kers
-IL
O E
stim
ate,
201
0-N
atio
nal E
stim
ate
(late
st)
-GB
D 2
015
Est
im.s
1.78
2.23
1.90
1.7
64.
1j (0.
75)
2.5
7
3.37
4.46
4.10
1.85
1.8
3k4.
76
0.59
0.59
1.11
5.4
1 4
.59
2.84
2.54
2.54
r3.
78
2.15
n/a
3.69
15.8
8/11
.02
n/a
n/a
n/a
n/a
6.15
N*,
fata
l occ
up. c
ance
rs,
natl.
int.
GB
D 2
015/
ILO
s
388+
194t
184/
1 31
383
9j64
9/1
135
19 0
00k
32 8
28/6
5 40
09
500
3 86
9/9
807
8 01
018
326
/13
330
237-
425
605/
991
n/a
608/
1 07
2+ u
n/a
75 2
79/1
02 5
0048
8 69
0/66
6 00
0s,u48
8 69
0/66
6 00
0v
N*
occ.
lung
can
cer
and
mes
othe
l. de
aths
cau
sed
by
asbe
stos
GB
D 2
013
estim
. A
RL
C/
Mes
/All
GB
D 2
015
estim
.v
105+
30w
56/4
/61v
10
8/12
/121
208+
42j
374+
106j
436/
80/5
18
483/
103/
591
10 0
00x
2207
2/26
19/2
4829
2440
2/26
89/2
7260
n/a
2702
/349
/307
725
97/3
58/2
979
2 22
3+19
37
8797
/197
5/10
854
1439
6/29
56/1
7654
n/a
336/
72/4
1044
6/10
3/55
7
n/a
319/
32/3
55
36 5
51+1
0 37
2y
4707
1/79
83/5
5487
5646
1/96
64/6
6900
107
000
-112
000
z
Rev
.est
imat
es, s
ee
Tabl
e V.
bel
ow16
6774
/252
12/1
9425
215
4601
/228
22/1
8022
5
Central European Journal of Occupational and Environmental Medicine 2017; 23 (1-2); · 17
Tabl
e IV
.W
ork-
rela
ted
illne
sses
and
inju
ries
in p
ast s
tudi
es, a
nnua
l fat
al n
umbe
rs N
* an
d fa
tal r
ates
N*/
100
,000
em
ploy
ed
Yea
r &
type
/are
aSi
ngap
ore
Finl
andj
Uni
ted
Stat
esSp
ain
U.K
.N
ew Z
eala
ndH
unga
ryE
U28
, IL
O a
djus
ted
ILO
Wor
ldn
GB
D W
orld
N*,
all
fata
l inj
urie
s and
ill
ness
es, n
atio
nal e
st.
1 43
91
810
j49
000
k16
100
l13
000
m70
0-1
000
-n/
an/
an/
a
N*,
all
fata
l inj
urie
s and
ill
ness
es, I
LO
Est
imat
e of
20
14n
2 40
02
075
119
500
17 9
3524
400
1 81
24
263
192
200
352
769
1 97
9 00
020
4,00
088
2,00
0
Em
ploy
men
t and
la
bour
forc
e, IL
O m
ill.
1.85
o3.
09
2.45
139.
0618
.46
28.9
42.
183.
84.
321
8.05
2 22
1.63
3 20
0.51
3 31
2.26
5 (2
013)
Fata
l Illn
ess r
ate,
N*/
100
000
empl
d.-I
LO
Est
imat
e-N
atio
nal E
stim
ate
77.7
42.8
73.9
82.2
j85
.935
.297
.287
.284
.3n/
a83
.132
.1-4
5.9
105.
4188
.189
.1n/
a
N*,
ann
ual f
atal
inju
ries
, na
tiona
l est
. 201
0-14
m55
+14p
82 j
(16)
6 2
00 3
38 q
172
~100
96r
n/a
n/a
n/a
N*,
ann
ual f
atal
inju
ries
, IL
O e
st. 2
010-
14n
5543
4 69
034
217
211
896
4,69
235
2 76
9n/
a
N*,
ann
ual f
atal
inju
ries
, G
BD
est
.35
635
702
878
322
6214
38
041
n/a
203
677u
Inju
ry r
ate
N*/
100
000
wor
kers
-IL
O E
stim
ate,
201
0-N
atio
nal E
stim
ate
(late
st)
-GB
D 2
015
Est
im.s
1.78
2.23
1.90
1.7
64.
1j (0.
75)
2.5
7
3.37
4.46
4.10
1.85
1.8
3k4.
76
0.59
0.59
1.11
5.4
1 4
.59
2.84
2.54
2.54
r3.
78
2.15
n/a
3.69
15.8
8/11
.02
n/a
n/a
n/a
n/a
6.15
N*,
fata
l occ
up. c
ance
rs,
natl.
int.
GB
D 2
015/
ILO
s
388+
194t
184/
1 31
383
9j64
9/1
135
19 0
00k
32 8
28/6
5 40
09
500
3 86
9/9
807
8 01
018
326
/13
330
237-
425
605/
991
n/a
608/
1 07
2+ u
n/a
75 2
79/1
02 5
0048
8 69
0/66
6 00
0s,u48
8 69
0/66
6 00
0v
N*
occ.
lung
can
cer
and
mes
othe
l. de
aths
cau
sed
by
asbe
stos
GB
D 2
013
estim
. A
RL
C/
Mes
/All
GB
D 2
015
estim
.v
105+
30w
56/4
/61v
10
8/12
/121
208+
42j
374+
106j
436/
80/5
18
483/
103/
591
10 0
00x
2207
2/26
19/2
4829
2440
2/26
89/2
7260
n/a
2702
/349
/307
725
97/3
58/2
979
2 22
3+19
37
8797
/197
5/10
854
1439
6/29
56/1
7654
n/a
336/
72/4
1044
6/10
3/55
7
n/a
319/
32/3
55
36 5
51+1
0 37
2y
4707
1/79
83/5
5487
5646
1/96
64/6
6900
107
000
-112
000
z
Rev
.est
imat
es, s
ee
Tabl
e V.
bel
ow16
6774
/252
12/1
9425
215
4601
/228
22/1
8022
5
A fu
ll da
tase
t of t
he st
udy m
ade f
or th
e ILO
(Int
erna
tiona
l Lab
our O
ffice
, 201
4) is
sepa
rate
ly a
vaila
ble.
Ful
l met
hodo
logy
of t
he d
atas
et a
nd IL
O st
udy i
s exp
lain
ed in
the p
ast p
aper
s.
j Ye
ar 2
001,
see
refe
renc
e (N
urm
inen
et a
l.,20
01),
late
st 2
013
asbe
stos
rela
ted
374+
106,
16
fata
l acc
iden
ts b
y w
age
earn
ers i
n 20
13, 0
.75/
100,
000
wor
kers
, in
clud
es w
ork-
re
late
d tr
affic
(Sta
tistic
s Fin
land
)k
Year
199
7, se
e re
fere
nce
(Ste
enla
nd, 2
004)
l Ye
ar 2
004,
see
refe
renc
e (G
arcí
a-G
omez
, 201
5)m
2012
-201
3, o
ccup
atio
nal c
ance
r and
chr
onic
lung
dis
ease
sn
Year
201
0 fo
r fat
al in
juri
es a
nd 2
011
for f
atal
wor
k-re
late
d di
seas
es (I
LO)
o Ye
ar 2
010
Sing
apor
e nu
mbe
rs a
re se
para
te fo
r res
iden
t em
ploy
ed p
opul
atio
n: 1
.85
mill
from
tota
l em
ploy
ed p
opul
atio
n 3.
09 m
ill.
p Ye
ar 2
010
the
road
traffi
c fa
talit
ies w
ere
not y
et o
ffici
ally
reco
rded
, hen
ce 5
5 is
exc
ludi
ng th
em, n
atio
nal d
ata
toda
y in
clud
es th
ese
q Ye
ar 2
010
base
d on
Eur
osta
tr
Year
201
0 Eu
rost
at
s Ye
ar 2
013,
GBD
http
://viz
hub.
heal
thda
ta.o
rg/g
bd-c
ompa
re/ (
acce
ssed
201
6 11
10)
, ILO
Year
201
1. G
BD W
orld
bas
ed o
n G
BD 2
015
data
. Lim
ited
occu
patio
nal r
isk fa
ctors
cove
red
by G
BD.
t Ye
ar 2
010,
den
omin
ator
: res
iden
t em
ploy
men
t (1.
85 m
illio
n) +
fore
ign
empl
oym
ent =
tota
l em
ploy
men
t (3.
09 m
illio
n)u
Year
2013
, All
trach
eal, b
ronc
hus a
nd lu
ng ca
ncer
deat
hs at
tribu
tabl
e to o
ccup
atio
nal r
isks w
as 26
8 890
, tota
l occ
upat
iona
l can
cer d
eath
s 304
,000
. Hun
gary
see T
able
III fo
r can
cer d
eath
sv
Year
2013
, All t
rach
eal, b
ronc
hus a
nd lu
ng ca
ncer
deat
hs at
tribu
tabl
e to o
ccup
atio
nal r
isks w
as 26
8 890
, tota
l occ
upat
iona
l can
cer d
eath
s 304
,000.
GBD
2015
: 488
,690 o
ccup
atio
nal c
ance
r dea
ths
w Y
ear 2
013,
tent
ative
estim
ate m
ade b
y aut
hors
in 2
015,
GBD
201
5 es
timat
es co
ver A
sbes
tos R
elated
Lun
g Ca
ncer
(ARL
C), M
esot
helio
ma
(Mes
), Al
l asb
esto
s rela
ted o
ccup
atio
nal d
eath
s (Al
l)x
Year
200
5 U
SA C
DC
quo
ted
by C
ente
r for
Pub
lic In
tegr
ity, s
ee h
ttp://
ww
w.ic
ij.or
g/si
tes/
icij/
files
/dan
gers
inth
edus
t_1.
pdf (
acce
ssed
201
4 09
15)
y Ye
ar 2
013.
See
refe
renc
e (T
akal
a, 2
005a
) z O
ld W
HO
– IL
O e
stim
ates
, pre
sent
est
imat
es in
Tab
le V
b en
clos
ed, b
ased
on
WH
O a
nd IA
RC st
udie
s.
18 · Burden of Injury and Illness at Work in Selected Contries and Regions
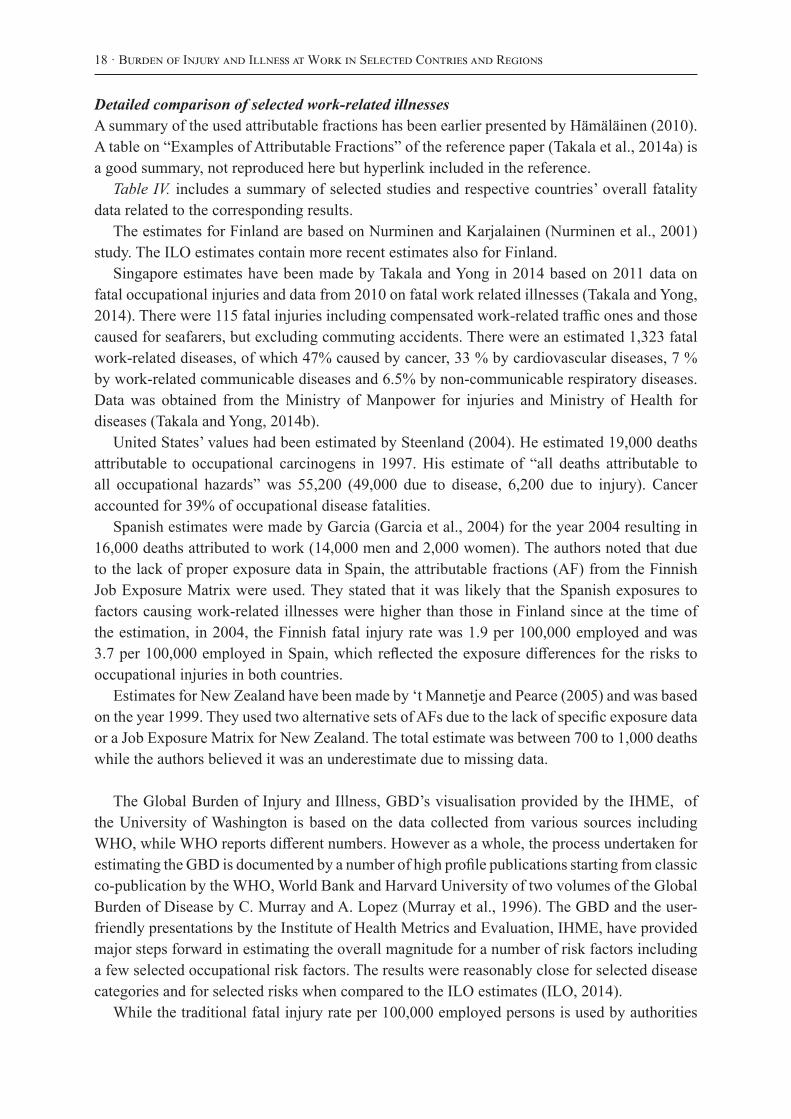
Detailed comparison of selected work-related illnessesA summary of the used attributable fractions has been earlier presented by Hämäläinen (2010). A table on “Examples of Attributable Fractions” of the reference paper (Takala et al., 2014a) is a good summary, not reproduced here but hyperlink included in the reference.
Table IV. includes a summary of selected studies and respective countries’ overall fatality data related to the corresponding results.
The estimates for Finland are based on Nurminen and Karjalainen (Nurminen et al., 2001) study. The ILO estimates contain more recent estimates also for Finland.
Singapore estimates have been made by Takala and Yong in 2014 based on 2011 data on fatal occupational injuries and data from 2010 on fatal work related illnesses (Takala and Yong, 2014). There were 115 fatal injuries including compensated work-related traffic ones and those caused for seafarers, but excluding commuting accidents. There were an estimated 1,323 fatal work-related diseases, of which 47% caused by cancer, 33 % by cardiovascular diseases, 7 % by work-related communicable diseases and 6.5% by non-communicable respiratory diseases. Data was obtained from the Ministry of Manpower for injuries and Ministry of Health for diseases (Takala and Yong, 2014b).
United States’ values had been estimated by Steenland (2004). He estimated 19,000 deaths attributable to occupational carcinogens in 1997. His estimate of “all deaths attributable to all occupational hazards” was 55,200 (49,000 due to disease, 6,200 due to injury). Cancer accounted for 39% of occupational disease fatalities.
Spanish estimates were made by Garcia (Garcia et al., 2004) for the year 2004 resulting in 16,000 deaths attributed to work (14,000 men and 2,000 women). The authors noted that due to the lack of proper exposure data in Spain, the attributable fractions (AF) from the Finnish Job Exposure Matrix were used. They stated that it was likely that the Spanish exposures to factors causing work-related illnesses were higher than those in Finland since at the time of the estimation, in 2004, the Finnish fatal injury rate was 1.9 per 100,000 employed and was 3.7 per 100,000 employed in Spain, which reflected the exposure differences for the risks to occupational injuries in both countries.
Estimates for New Zealand have been made by ‘t Mannetje and Pearce (2005) and was based on the year 1999. They used two alternative sets of AFs due to the lack of specific exposure data or a Job Exposure Matrix for New Zealand. The total estimate was between 700 to 1,000 deaths while the authors believed it was an underestimate due to missing data.
The Global Burden of Injury and Illness, GBD’s visualisation provided by the IHME, of the University of Washington is based on the data collected from various sources including WHO, while WHO reports different numbers. However as a whole, the process undertaken for estimating the GBD is documented by a number of high profile publications starting from classic co-publication by the WHO, World Bank and Harvard University of two volumes of the Global Burden of Disease by C. Murray and A. Lopez (Murray et al., 1996). The GBD and the user-friendly presentations by the Institute of Health Metrics and Evaluation, IHME, have provided major steps forward in estimating the overall magnitude for a number of risk factors including a few selected occupational risk factors. The results were reasonably close for selected disease categories and for selected risks when compared to the ILO estimates (ILO, 2014).
While the traditional fatal injury rate per 100,000 employed persons is used by authorities

Central European Journal of Occupational and Environmental Medicine 2017; 23 (1-2); · 19
around the world and by the ILO, it would be more appropriate to use the full labour force numbers in calculating the global rates of health disorders collected using the WHO methodology. Diseases with long latencies may cause deaths well beyond the usual working careers, such as asbestos caused mesothelioma or lung cancer, which may cause a death more than 20 years after the worker retired. This will modify the denominator population from which the deaths are obtained and counted. However, the real population size and the fraction exposed has been much smaller when the actual exposures took place, say 20 to 50 years earlier, due to population growth all over the world. The rate/100,000 population may provide reasonably relevant data for comparative analysis and are better than absolute numbers. In some cases the reference population is the total population.
The GBD-IHME visualisations have listed a limited number of health risk factors causing deaths: key risks are occupational carcinogens, asthmagens, injuries and particulates. The Disability Adjusted Life Years (DALYs) cover a selected number of further risks at work, in particular ergonomic risk factors consisting of low back and neck pain. Many job exposures are still missing, such as further carcinogens, in particular, IARC List 2A Probable carcinogens, and cancer sites, all circulatory diseases at work, psychosocial factors at work and communicable diseases at work. Furthermore, working children, self-employed and subsistence farmers/fishermen are not covered or cannot be identified.
The figures for deaths caused by occupational carcinogens presented in the GBD IHME visualisations in 2015, was reasonably close with those estimates made elsewhere. The ILO global estimate for occupational cancer was 666,000 deaths while the GBD 2015 outcome was 488,691 for the IARC 1 listed carcinogens and in essence largely coming by asbestos related cancer deaths. United States had 32,828 occupational cancer deaths and the United Kingdom, highest in Europe, had 18,326 occupational cancer deaths. The European Union 28 countries (EU28) had altogether 75,279 deaths in GBD 2015 Study, while the ILO estimate was 103,000 and the relatively new RIVM Institute Report on chemical carcinogens only came to 79,700 deaths. A comprehensive 2001 study in Finland resulted in 839 occupational cancer deaths while the IHME latest estimate in 2015 had 649 caused almost exclusively by asbestos. The Finnish Cancer Registry reports that there has been an increasing number of manifestations of mesothelioma, in 2013 there were 106 deaths, and 95 cases in average for some 10 years in a working population of 2.45 million workers in 2007-2011 (Santonen et al., 2014). Some 85% of mesothelioma cases have been compensated while some 65% of all asbestos related diseases have been compensated. In effect, asbestos related lung cancer has a fairly low level of compensation even in developed countries as it is difficult to show that asbestos has been the main cause. Lung cancer forms the biggest component of occupational cancers in practically any country, more than 50% of all occupational cancer cases and deaths were related to lung cancer. Underreporting of the work-relatedness is also expected to be high. Latest information from McCormack et al. (2013) report that chrysotile – the most commonly used asbestos today – causes as many as 6.1 lung cancers in average (a range of 3.6 – 10.5) against one mesothelioma when mesothelioma cases were used as a proxy for asbestos exposure.

20 · Burden of Injury and Illness at Work in Selected Contries and Regions
Globally, the WHO estimated in the past that there are 107,000 deaths related to occupational exposure to asbestos (WHO, 2014) and the EU/ILO had estimated roughly the same or 112,000 deaths. All lately reported numbers are considerably higher and continue to rise. The GBD 2013 burden data for occupational cancer – mainly caused by asbestos – was 304,000 deaths (Forouzanfar et al., 2013) and the GBD 2015 was 489,000.
The difference between GBD and ILO numbers concerning occupational cancer was most likely caused by
1) asbestos related mesothelioma numbers are under-estimated based on latest reports from all reporting countries and WHO data, non-reporting country estimates need thorough reconsideration based on asbestos consumption;
2) Asbestos-related lung cancer deaths are still under-estimated when mesothelioma is used as a proxy for asbestos exposure;
3) A selected set of carcinogens have been so far used by IHME/GBD, a larger number of further carcinogens, agents such as radon, or carcinogenic processes and jobs, such as welding, need to be covered;
4) A selected number of cancer sites and target organs have been used.
Taking these factors into account the two estimates are relatively close. Using the recent global estimate in Tables Va and Vb of 38,400 annual global asbestos-related mesothelioma deaths (Chimed-Ochir et al., 2016) of which 36,400 are work-related based on Rushton’s AF=0.949 (Rushton et al., 2012), and an estimated 6.77 times the number of mesothelioma deaths for lung cancer deaths or 177,400 asbestos related lung cancer (ARLC) deaths at work. Together ARLC, mesothelioma, ovary and larynx cancers, and asbestosis cause annually between 258,078 (lower estimate using GBD data) and 304,841 deaths (Table Vb high estimate). Of these some 183,800 – 289,600 are work-related globally, (Table Vb). Other cancers, such as stomach, colorectal and pharynx cancers may add to the toll.
A full dataset of the study made for the ILO (ILO, 2014) is separately available. Full methodology of the dataset and ILO study is explained in the past papers. (Nenonen et al. 2014; Takala et al, 2014a; Takala, 2005; Hämäläinen et al., 2006; 2007; 2009; Driscoll et al., 2005).

Central European Journal of Occupational and Environmental Medicine 2017; 23 (1-2); · 21
Table Va.
Estimated Global Mesothelioma Deaths (Annual N*), based on WHO data
Extrapolation method Reported Global Non-reported, adjusted Global China / EU28
(1) Best estimate, asbestos consumption, adjusted 15,011* 23,377
(2) Estimates based on asbestos use
All GBD 2015 and best estimates 32,373 (IHME) - 38,400 (new) China: 4,512 (GBD/IHME 2015 all)
Work AFmeso.work=94.9%, (Rush-ton et al., 2012) 22,822 (IHME) - 36,400 (new) EU28: 11,404
(GBD/IHME 2015 all)
(3) Reported/Estimated by continent, employment and asbestos adjusted, other EU estimates, all
15,011 21,247 – 23,377
EU: 8,363 (Odgerel, Takahashi et al., 2016), allEU: 10,368 (Takala, 2015), all
* Reported N in 59 countries, estimated M in 172 countries, (Takahashi et al.,2015, Chimed-Ochir et al., 2016)
Table Vb.
Asbestos related lung cancer and other asbestos related deaths (Takala)
Methods of estimated lung can-cer death using mesothelioma as a proxy for asbestos use
Lung cancer / mesothelioma rate
Asbestos related lung, other cancer (and other asbestosis) deaths
World China/EU28
McCormack, Peto et al. (2013) average estimate using chrysotile, lung cancer, all, GBD 2015 Study
6.1 197,475
McCormack, Peto et al. (2013), low – high estimates, lung cancer, all, GBD
2.0 – 10.0 64,746 – 323,730
Nurminen, Karjalainen (2001) using mixed fibres, asbestos expo-sure verified by lung tissue fibre counting, lung cancer, all, GBD
3,525 137,475
GBD based rate on global asbes-tos-related lung cancer and meso-thelioma at work: 154,601/22,822 = 6.77436, GBD, (2015)
6.77 177,423work–283,221work based on GBD/IHME 2015work
Area meso/ARLC/Ova/LaryEU28 9,664/56,461/335/440China 2,477/24,405/294/199Earth 22,822/154,601/1397/1405
Ovary and larynx cancers, GBD, (2015)
2,802work
Asbestosis, GBD, (2015) 3,597work
Global asbestos death, work: 183,822 – 289,621; Mid-point 236,700All asbestos exposed, global: 258,078 – 304,841; Mid-point 281,500

22 · Burden of Injury and Illness at Work in Selected Contries and Regions
Asbestos is the cause of some 54-85% of lung cancer globally and lung cancer in turn counts for 54-75 % of all occupational cancer cases. Many of the cancers are hitting predominantly males while breast and ovary cancers at work cause a particular burden to women.
The picture of the burden at work becomes more gender balanced if not just deaths are counted but rather work-related Years of Lost Life (YLLwork) and Years Lived with Disability (YLDwork). Long term disabilities caused by musculoskeletal and mental disorders are expected to affect the female population (GBD, 2017) more seriously.
Non-fatal injuries and illnesses at workA common method to identify non-fatal injuries is to use an additional module as a part of labour force surveys carried out regularly in many countries and regions. Based on such surveys where data is obtained through interview surveys or self-reporting households can be also used to estimate the level of under-reporting of official statistics. Countries where the reported rate of non-fatal injuries is high have usually much more minor injuries reported. The results from such surveys on non-fatal injuries and illnesses at work can be summarized as follows:
Table VI.Injuries caused by occupational accidents in selected countries
including one day or longer absence (Eurostat, 2009)
Country/Region Injuries by occupational accidents (% of the workforce)
Work-related ill-health(% of the workforce)
Finland 6.3 24.5
Sweden 5.1 14.3
Denmark 4.9 12.9
France 5.4 -
EU average 3.2 8.6
Hungary 1.0 5.8
Singapore 5.4 10.0
The rate may also be obtained for compensable injuries, which in many countries includes accidents that cause an absence of work for 4 days or more.
The relationship between serious and less serious outcomes of occupational injuries and illnesses
Drawing a combined picture of both lives lost and burden of disabilities needs an accurate picture of the severity distribution of the injury and illness burden. Figure 5 shows the two pyramids for both injuries (accidents) and illnesses at work.

Central European Journal of Occupational and Environmental Medicine 2017; 23 (1-2); · 23
Figure 5. Division of fatal and non-fatal injuries and illnesses in relation to one fatal case in Singapore and selected reference populations, smaller pyramid illustrates occupational injuries and the larger one illnesses.
DISCUSSION
The figures presented may not be the exact true verifiable figures. There are notable differences in various estimates. The GBD 2015 release estimates from the year 2015 exercise point out to generally lower estimates compared to those of the International Labour Office. The most important reasons are the selected coverage of various diseases and disorders. The latest GBD global estimate was 488,000 occupational cancer deaths and 1,086,000 for all selected occupational risks. This is lower than that of 666,000 reported by the ILO on occupational cancer and about a half of all risks identified by the ILO. Major occupational risks remain unreported by the GBD estimate, or reported under risks other than occupational risks, in particular, heart and other circulatory diseases caused by work-related factors, selected cancers, communicable diseases, and work-related fractions of a large number of other diseases. Examples of missing occupational risk factors include shift work, mineral oils, solar radiation, painting, chemical exposures, long working hours, second-hand (environmental) tobacco smoke and engine exhaust for circulatory diseases. Furthermore, most AFs are largely based on data in 2001 when e.g. only 28 of the presently known some 50 cancers were taken into account. IARC lists have been expanded as well. COPD AFs are today known to be clearly higher.
24 · Burden of Injury and Illness at Work in Selected Contries and Regions
All of these figures point to limited compensation criteria and practices in reporting countries and to under-reporting situations and limited understanding of work-relatedness, especially to deaths due to work-related illnesses in the baseline national data. Fatal injuries are clearly better recognized and reported in developed countries as compared to work-related illnesses. The estimates presented in our tables are influenced by the assumptions taken and limited by the availability and quality of data and evidence available for the AFs used. For example, the lower than expected mesothelioma numbers in many parts of the world may be caused by
a. Under-diagnosing, misdiagnosing and non-diagnosing of the disease. Without proper knowledge and investigation measures based on proper (Helsinki) criteria this is easy to misclassify. The symptoms may not be distinguished from those of lung cancer. Even many EU countries, such as Spain and Bulgaria have had a poor record of mesothelioma cases, 93-99% under-reporting so very few are reported/compensated (Garcia-Gomez et al., 2015; Vangelova et al., 2016).
b. In the developing world asbestos use started late, clearly later than in Europe, USA and Japan. In Singapore the peak is expected to be some ten years later than in Western countries and Australia/New Zealand. As a result the diseases and deaths are just now appearing and increasing.
c. Due to b) above practically all asbestos used has been chrysotile resulting into relatively less mesothelioma cases and consequently much higher number of lung cancers.
d. Some exposed workers may have been moving from the country of exposure and may not be aware of the exposures earlier in their working life.
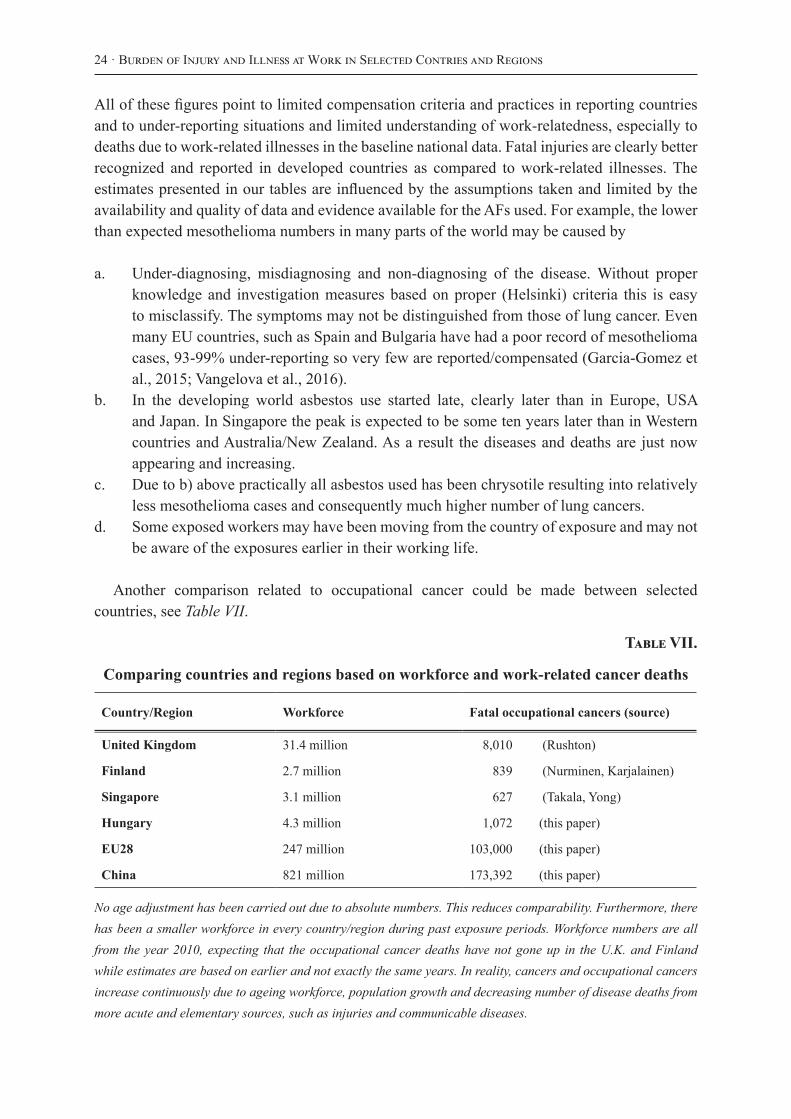
Another comparison related to occupational cancer could be made between selected countries, see Table VII.
Table VII.
Comparing countries and regions based on workforce and work-related cancer deaths
Country/Region Workforce Fatal occupational cancers (source)
United Kingdom 31.4 million 8,010 (Rushton)
Finland 2.7 million 839 (Nurminen, Karjalainen)
Singapore 3.1 million 627 (Takala, Yong)
Hungary 4.3 million 1,072 (this paper)
EU28 247 million 103,000 (this paper)
China 821 million 173,392 (this paper)
No age adjustment has been carried out due to absolute numbers. This reduces comparability. Furthermore, there has been a smaller workforce in every country/region during past exposure periods. Workforce numbers are all from the year 2010, expecting that the occupational cancer deaths have not gone up in the U.K. and Finland while estimates are based on earlier and not exactly the same years. In reality, cancers and occupational cancers increase continuously due to ageing workforce, population growth and decreasing number of disease deaths from more acute and elementary sources, such as injuries and communicable diseases.

Central European Journal of Occupational and Environmental Medicine 2017; 23 (1-2); · 25
Detailed exposure data in the form of job exposure matrix (JEM) would definitely make the results more accurate and effort in this direction are being made in Singapore, in particular, for carcinogens in building and maritime sectors that are the major exposed groups. While details of exposures are not systematically available, it is expected that exposures are not radically different from equal jobs in other developed countries for most jobs. The processes, procedures, working methods, tools and machinery are evolving in parallel to other developed countries. Service occupations are not different in Singapore from those in Finland and the U.K.
The human metabolic reactions to exposures and related negative outcomes are unlikely to be different if jobs and exposures are comparable all over the world. The possible differences in estimating exposures and the number of exposed workers, however, include the size of various economic sectors, such as the construction sector. Furthermore climate makes a difference. More could also be done to obtain Asian-based epidemiological evidence for risk estimates of exposures and outcomes. The attributable fractions (AF) referenced, while commonly cited and used widely in related studies, could be confounded by their underlying research populations and reference economies. An example is the AF used for females in communicable diseases, at 32.5, which was influenced by a study on tuberculosis (TB) cases among healthcare professionals in Finland. As TB incidence in Finland is very much lower (at <10 per 100,000) than Singapore’s 40.9 per 100,000 (Ministry of Health Singapore, 2012) the outcomes observed and inferences made in the Finnish study may point to occupational exposures, but the case may not be so clear for Singapore’s healthcare professionals. Equally malaria cases in Finland are predominantly work-related due to Finnish worker population exposures in various jobs in endemic areas of developing countries. The exposure conditions in Singapore may be different.
As such, there lie opportunities for further regional epidemiological research, education and communication of “invisible deaths”, and to advocate more strongly for prevention measures and actions to be taken to protect the occupational health of the workforce. Furthermore, reliable data is not available from most economies in the world, which makes also global comparisons difficult. As a result the estimates vary widely from each other. For example, the number of injuries has been announced in China by the Government and other estimates are given for comparison:
69,434 deaths reported by Chinese authorities for 2013 (Government of China, 2014) while the size of the reference population is not clear;
31,715 deaths by IHME in 2013, which appears to be based on the average reported sectoral ILO Statistics of deaths/100,000 (GBD, 2015b). The reporting countries are mostly industrialized ones and this number would indicate that China’s fatal accident rate is at the same magnitude level as that of USA or Austria, see http://www.ilo.org/ilostat (accessed 15 Dec 2015);
99, 197 by the ILO in 2010, based on ILO Statistics, sectoral details and proxy accident rates, when no data provided by countries to ILO, see dataset separately available and references (Lim et al., 2014; Hämäläinen et al. 2014; ILO, 2014). It is likely that the difference between ILO estimates and the Chinese own statistics may be originated by the large rural agricultural labour force – often self-employed and self-sustaining
26 · Burden of Injury and Illness at Work in Selected Contries and Regions
farmers – that has been taken into account in the ILO study, while not usually covered by compensation and statistics in most countries.
These deviations of different estimates are likely to be cross-cutting through many or most countries in the world. For example, the United Kingdom does not record occupational injuries in work-related road traffic, and such numbers need to be estimated. There are also a number of groups differently covered, such as defence forces (in peaceful jobs), uniformed workers, subsistence farmers, seamen and fishermen on-board ships and vessels, dispatched workers working for an enterprise or organization located in one country, but the actual workplace is located elsewhere in another country. Informal sector is not covered at all by definition and the size of grey economy varies widely.
For work-related illnesses there are also uncertainties. While the ad hoc household or self-reporting surveys should cover all groups uniformly, the understanding of work-relatedness by survey respondents is affected by the compensation criteria in a country, which in turn varies widely between the EU member States, and even more globally. Ideally, the household survey results could be validated by official records while that can be done only in a very limited number of countries reliably due to limited official records. The reference populations do not generally cover younger than 25 years and over 75 years age groups leaving out the more than hundred million child workers and those who have to work at advanced ages.
Better knowledge of recognising and diagnosing work-related diseases and placing emphasis on reporting, recording and registering occupational injuries and diseases would need a major effort in most countries globally.
While the attributable fractions are expected to be similar for many economic sectors and jobs, conditions are never the same even in the same country. The technological processes and human metabolism are not much different, but questions of open air production in tropical circumstances or winter conditions in temperate climate countries have an impact on outdoor exposure qualities and quantities. Salary level and, methods of payment, cultures of various groups, have favoured labour intensive processes in certain sectors instead of mechanization and prefabrication. The use of higher number of unskilled workers increases also the number of those exposed as compared to countries with high worker remuneration levels.
Nevertheless, we consider that such comparisons are useful for identifying the magnitude of exposures resulting in serious outcomes. The question is not whether the numbers presented are exactly correct or the number of deaths is 10-20% higher or lower, rather we should consider whether these identified problems are sufficiently big to start considering better methods to eliminate and reduce exposures to various hazards. Traditionally, injuries are more easily identified and their causes detected than illnesses. Long latency diseases and disorders make it difficult to link the original exposures and causes of the problems to the disease or disorder.
We also propose to start recording and calculating the Years of Lost Life at work (YLLwork), Years Lived with Disability (YLDwork) and Disability adjusted Life Years (DALYwork) at work

Central European Journal of Occupational and Environmental Medicine 2017; 23 (1-2); · 27
in addition to just counting the numbers of deaths, diseases and injuries. When concentrating only on serious and immediate problems, debilitating other problems may be poorly identified even though their prevalence could be high and consequences serious in terms of long absences from work, reduced workability, and early retirement due to disability. Back pain and other musculoskeletal problems and stress-related psychosocial factors are likely to be major burden to the workforce and the economy.
CONCLUSIONS
The number of deaths caused by work-related illnesses is more than ten times that of deaths caused by occupational injuries in most countries in the world The scale of these numbers is nevertheless far too high and, moreover, preventable with present day methods. While this often reflects the historical exposures in the past, much remains to be done to further eliminate and reduce such exposures today. Better and more systematic exposure knowledge is the next step in that direction. Immediately, more emphasis on a level playing field is needed. Improved compensation and insurance systems will create interest and incentive to eliminate the risks, as that will place companies, organizations, economic sectors and countries on a more equal footing. Competent risk assessment would provide not just better data but is a key for risk prevention. Those companies and organizations creating high risks need to be held accountable for providing preventive measures and for covering the high compensation costs. A Vision Zero and Zero Harm mindset and a comprehensive view of creating and maintaining a healthy workforce in a safe workplace for the whole working life is the goal.
REFERENCES
CHIMED-OCHIR, O., TAKAHASHI K., SORAHAN, T., DRISCOLL, T., FITZMAURICE, C., YOKO-O, M., et al. (2017). Estimation of the global burden of mesothelioma deaths from incomplete national mortality data. Occ. Env. Med. (accepted and in print, July 2017).
DRISCOLL, T., TAKALA, J., STEENLAND, K., CORVALAN, C., and FINGERHUT, M. (2005). Review of estimates of the global burden of injury and illness due to occupational exposures. Am. J. Ind. Med. 48:491–502 (2005).
EUROSTAT (2009). Statistics in focus 63 2009. European Commission, Luxembourg 2009. Available at: https://osha.europa.eu/en/safety-health-in-figures/eurostat-labour-force-survey-2007
FOROUZANFAR, M.,H., ALEXANDER, L., et al. (2013). Global, regional, and national comparative risk assessment of 79 behavioural, environmental and occupational, and metabolic risks or clusters of risks in 188 countries, 1990–2013: a systematic analysis for the Global Burden of Disease Study 2013. The Lancet 386(10010):2287-323. Internet tool: GBD Compare http://vizhub.healthdata.org/gbd-compare/ Accessed 13 December 2015.
28 · Burden of Injury and Illness at Work in Selected Contries and Regions
GARCÍA, A.M., MERINO, R.G., and VICENTE LÓPEZ MARTÍNEZ, V. (2004). Estimación de la mortalidad atribuible a enfermedades laborales en España, 2004. Rev Esp Salud Pública 2007;81:261-270, N.°3 Mayo-Junio 2007. Available at: http://scielo.isciii.es/scielo.php?pid=S1135-57272007000300003&script=sci_arttext
GARCÍA-GOMEZ, M., MENÉNDEZ-NAVARRO, A., and LÓPEZ, R.C. (2015). Asbestos-related occupational cancers compensated under Spanish National Insurance System, 1978-2011. IJOEH Vol.21 no.1, DOI 10.1179/2049396714Y.0000000087. Available at: http://www.ncbi.nlm.nih.gov/pubmed/25335827
GBD (2015a). Mortality and Causes of Death Collaborators. Global, regional, and national life expectancy, all-cause mortality, and cause-specific mortality for 249 causes of death, 1980-2015: a systematic analysis for the Global Burden of Disease Study 2015. Lancet 2016;388:1459-544. See details from http://vizhub.healthdata.org/gbd-compare/
GBD (2015b). Methodological Appendix. Supplement to GBD 2013 Risk Factors Collaborators. Global, regional, and national comparative risk assessment of 79 behavioural, environmental and occupational, and metabolic risks or clusters of risks in 188 countries, 1990–2013: a systematic analysis for the Global Burden of Disease Study 2013. Lancet 2015; published online Sept 11. http://dx.doi.org/10.1016/S0140-6736(15)00128-2. Supplem. http://www.thelancet.com/cms/attachment/2036387443/2051453995/mmc1.pdf see page 26 on Occupational risks.
GBD (2017). Project Visualization software and data, Institute of Health Metrics and Evaluation University of Washington. Available at: http://vizhub.healthdata.org/gbd-compare/Accessed on 23 May, 2017.
GOVERNMENT OF CHINA (2014). Statistical Communiqué of the People’s Republic of China on the 2013 National Economic and Social Development, item XII. Resources, Environment and Work Safety. National Bureau of Statistics of China. Available at: http://www.stats.gov.cn/english/PressRelease/201402/t20140224_515103.html
HSE, (2014). Health and Safety Executive, U.K. Based on EUROSTAT numbers referred by the HSE web page: http://www.hse.gov.uk/statistics/pdf/fatalinjuries.pdf. Accessed on 11 September 2014, latest data, see: http://www.hse.gov.uk/statistics
HÄMÄLÄINE, P., TAKALA, J., and SAARELA, K.L. (2006). Global estimates of occupational accidents. Safety Sci. 44:137–156.
HÄMÄLÄINEN, P., TAKALA, J., and SAARELA, K.L. (2007). Global estimates of fatal work-related diseases. Am. J. Ind. Med. 50(1):28–41.
HÄMÄLÄINEN, P., SAARELA, K.L., and TAKALA, J. (2009). Global trend according to estimated number of occupational accidents and fatal work-related diseases at region and country level. J. Safety Res. 40(2):125–139 (2009).

Central European Journal of Occupational and Environmental Medicine 2017; 23 (1-2); · 29
HÄMÄLÄINEN, P. (2010). Global Estimates of Occupational Accidents and Fatal Work-Related Diseases. Doctoral dissertation, Publication 917, Tampere University of Technology, Finland, 2010. Available at: http://dspace.cc.tut.fi/dpub/bitstream/handle/123456789/6818/hamalainen.pdf?sequence=1 Accessed on 11 September 2014
ILO (2014). International Labour Office, Safety and Health at Work, A Vision for Sustainable Prevention. XX World Congress for Safety and Health at Work, 24-27.08.2014. ILO Geneva, available at: http://www.ilo.org/wcmsp5/groups/public/---ed_protect/---protrav/---safework/documents/publication/wcms_301214.pdf
JONGENEEL, W.P., EYSINK, P.E.D., THEODORI, D., HAMBERG-VAN REENEN, H.H., and VERHOEVEN, J.K. (2016). Work-related Cancer in the European Union. National Institute for Public Health and the Environment, Ministry of Health, Welfare and Sport, The Netherlands. Available at: http://goo.gl/7usdEP. Accessed on 23 May 2017. ‘T MANNETJE, A., and PEARCE, N. (2005). Quantitative estimates of work-related deaths, diseases and injury in New Zealand. Scand J Work Environ Health 2005;31(4):266-276.
MCCORMACK, V., PETO, J., BYRNES, G., STRAIF, K., and BOFFETTA, P. (2013). Estimating the asbestos-related lung cancer burden from mesothelioma mortality. Available at: http://www.ncbi.nlm.nih.gov/pmc/articles/PMC3273352/. Accessed on 16 May 2013.
MINISTRY OF HEALTH, SINGAPORE (2012). Communicable Disease Report 2012, available at: http://www.moh.gov.sg/content/moh_web/home/Publications/Reports/2013/Communicable_Diseases_Surveillance_in_Singapore_2012.html. Accessed on 16 September 2014.
MURRAY, C.,J.,L., and LOPEZ, A.D. (ed.) (1996). The Global Burden of Disease – A comprehensive assessment of mortality and disability from diseases, injuries, and risk fraction in 1990 and projected to 2020. Volume I. The Harvard School of Public Health, World Health Organisation, and World Bank. 990 p., 1996.
LIM, S.S., VOS, T., FLAXMAN A.D., et al.(2012). A comparative risk assessment of burden of disease and injury attributable to 67 risk factors and risk factor clusters I 21 regions, 1990-2010: a systematic analysis for the Global Burden of Disease Study 2010. Lancet 2012; 380: 2224-60, Institute of Health Metrics and Evaluation web site: http://vizhub.healthdata.org/gbd-cause-patterns. Accessed on 23 May 2017.
NATIONAL BUREAU OF STATISTICS OF CHINA, (2013). Statistical Communiqué of the People's Republic of China on the 2013 National Economic and Social Development, Chapter XII. Resources, Environment and Work Safety, available at: http://www.stats.gov.cn/english/PressRelease/201402/t20140224_515103.html, Accessed 13 Dec.2015.

30 · Burden of Injury and Illness at Work in Selected Contries and Regions
NENONEN, N., HÄMÄLÄINEN, P., TAKALA, J., SAARELA, K.L., YONG, E., LIM, S.L., et al. (2014). Global Estimates of Occupational Accidents and Fatal Work-related Diseases. Data from ILO and WHO, 2010 and 2011. Report to the ILO, Tampere, Singapore, Geneva 2014, DOI: 10.13140/2.1.2864.0647, web page http://goo.gl/aaJY9r, Accessed on 23 May 2017.
RUSHTON, L., HUTCHINGS, S.J., LEA FORTUNATO, L., YOUNG, C., EVANS, G.S., BROWN, T., et al (2012). Occupational cancer burden in Great Britain, Br J Cancer 107: S3-S7.
SANTONEN, T., and OKSA, P. (eds.) (2014). Memorandum from the Occupational Cancer Working Group. Finnish Institute of Occupational Health. ISBN 978-952-261-369-1. See: http://www.ttl.fi/en/publications/Electronic_publications/Documents/Memorandum_Cancer_2013.pdf (accessed on 15 September 2014), and private communication with Dr Kari Kurppa.
STEENLAND, K. (2004). Rollins School Public Health, Emory University, Atlanta, Ga. USA. 2004, available at: http://www.occupationalcancer.ca/wp-content/uploads/2011/03/Steenland.pdf, Accessed on 14 September 2014.
STRAIF, K. (2008). The burden of occupational cancer. Occup Environ Med 65:787-788.
TAKAHASHI, K., DRISCOLL, T., and TAKALA, J. (2015). Presentation at the Ramazzini Days’ Conference, Carpi, Italy, 24 Oct 2015, available at: http://www.collegiumramazzini.org/download/2015/sat/2bTakahashi2.pdf, Accessed on 29 May 2017.
TAKALA, J. (2005). ILO Introductory Report: Decent Work-Safework. XVII World Congress on Safety and Health at Work, Orlando Florida. Available at: http://goo.gl/ZC6OQD and http://ohsa.org.mt/Portals/0/docs/intrep_05.pdf, Accessed 23 May 2017.
TAKALA, J., HÄMÄLÄINEN, P., SAARELA, K.L., LOKE, Y.Y., MANICKAM, K., TAN, W.J., et al. (2014a). Global Estimates of the Burden of Injury and Illness at Work in 2012. JOEH 11:326-337.
TAKALA, J., and YONG, E. (2014b). Mortality estimates of occupational injuries and ill health in Singapore. WSH Institute, Public Health and Occupational Medicine Conference, 2014 Singapore. Available at: https://goo.gl/RqvCKp, Accessed on 17 Nov 2016.
TAKALA, J., (2015a). Eliminating Occupational Cancer in Europe and Globally. ETUI Working Paper 2015.10 www.etui.org/Publications2/Working-Papers/Eliminating-occupational-cancer-in-Europe-and-globally, Accessed on 14 October 2015.
TAKALA, J. (2015b). Eliminating Occupational Cancer, Editorial, Industrial Health 53, 307-309.
VANGELOVA, K., and DIMITROVA, I., (2016). Asbestos exposure and mesothelioma incidence and mortality in Bulgaria. Rev Environ Health 31(2):203-9.

Central European Journal of Occupational and Environmental Medicine 2017; 23 (1-2); · 31
WHO (2014). Asbestos: Elimination of asbestos related diseases. See: http://www.who.int/mediacentre/factsheets/fs343/en/ Accessed on 15 September 2014