comparative analysis of phenolic acid profiles of rice ... · comparative analysis of phenolic acid...
TRANSCRIPT

430
POJ 7(6):430-437 (2014) ISSN:1836-3644
Comparative analysis of phenolic acid profiles of rice grown under different regions using
multivariate analysis
Soo-Yun Park
1, Jae Kwang Kim
2, So Young Lee
1, Sung-Dug Oh
1, Si Myung Lee
1, Jae-Seon Jang
3,
Chang-Ihn Yang4, Yong-Jae Won
4, Yunsoo Yeo
1,*
Soo-Yun Park and Jae Kwang Kim contributed equally to this work. 1National Academy of Agricultural Science, Rural Development Administration, Jeonju 560-500, Republic of
Korea 2Division of Life Sciences, Incheon National University, Yeonsu-gu, Incheon 406-772, Republic of Korea
3Department of Food & Nutrition, Gachon University, Yeonsu-gu, Incheon 406-799, Republic of Korea
4National Institute of Crop Science, Rural Development Administration, Suwon 441-857, Republic of Korea
*Corresponding Author: [email protected]
Abstract
This study was conducted to determine the content of phenolic acids in various rice cultivars and to evaluate the impact of genotype
versus environmental influence on the phenolic acid profiles of rice grains. Three forms of phenolic acids (free, esterified, and
insoluble-bound forms) were identified using gas chromatography–time-of-flight mass spectrometry (GC-TOFMS) in samples of
eight Korean rice cultivars (Oryza sativa L.) grown together at two different locations. The phenolic acid profiles were subjected to
data mining processes, including principal components analysis (PCA), partial least-squares discriminant analysis (PLS-DA), and
orthogonal PLS-DA (OPLS-DA). The results of OPLS-DA showed clear discrimination between the rice samples based on their
growing locations rather than by their genotypes. The major components that contributed to the separation between the two regions
were sinapic and ferulic acids in both free and bound forms. These results suggest that the phenolic acid composition in rice grains is
determined by environmental factors such as growing condition rather than by genetic factors. This study illustrates the utility of
metabolite profiling, combined with chemometrics, as a tool for identifying metabolic differences between crop samples from
different regions of cultivation.
Keywords: gas chromatography; OPLS-DA; Oryza sativa; PCA; phenolic acid; PLS-DA.
Abbreviations: GC-TOFMS_gas chromatography–time-of-flight mass spectrometry; MTBSTFA_N-(tert-butyldimethylsilyl)-N-
methyltrifluroacetamide; PCA_principal components analysis; PLS-DA_partial least-squares discriminant analysis; TBDMCS_tert-
butyldimethylchlorosilane.
Introduction
Phenolic compounds that possess an aromatic ring bearing one
or more hydroxyl substituents constitute a large class of plant
secondary metabolites that includes many different families of
aromatic metabolites such as phenylpropanoids, flavonoids,
phenolic acids, tannins, and lignins. These various substances
are essential for growth and reproduction in plants, and known
to play multifunctional roles in plant defense mechanisms
against injuries caused by insects, pathogens, and
environmental stresses (Dercks et al., 1990; Horax et al., 2005;
Mandal et al., 2010). Recent interest in phenolic acids has
increased greatly because of their radical scavenging activity,
which is determined by their hydrogen atom donating ability.
Many studies have shown a wide range of physiological
properties of these compounds such as antioxidant,
antiallergenic, antimicrobial, cardioprotective, and vasodilatory
properties (Pupponen-Pimiä et al., 2001; Vichapong et al.,
2010). Thus, interest is growing in investigating the phenolic
acid profiles of plant-derived foods including fruits, vegetables,
and cereal grains. Phenolic acids are produced in plants via
shikimic acid through the phenylpropanoid pathway. Naturally
occurring phenolic acids contain two distinguishing
constitutive carbon frameworks: the hydroxycinnamic and
hydroxybenzoic structures. The most commonly encountered
hydroxycinnamic acids are p-coumaric, caffeic, ferulic, and
sinapic acids. Hydroxybenzoic acids consist mainly of p-
hydroxybenzoic, protocatechuic, vanillic, and syringic acids
(Qiu et al., 2010). These compounds exist in plants in three
forms: free acids, esters, or acetal bonds to structural
components (e.g., cellulose, lignin), smaller organic molecules
(e.g., glucose, quinic, or maleic acids), or other natural products
(e.g., flavonoids, terpenes; Robbins, 2003). This diversity in
structures is one of the difficulties in determining phenolic
acids in aromatic plants, both qualitatively and quantitatively.
Recently, we determined the phenolic acid content in colored
rice grains using tert-butyldimethylsilyl (TBDMS)
derivatization and the gas chromatography–mass spectrometry
(GC-MS) technique in which compounds were analyzed as two
forms, free acids and esters (Park et al., 2012). However, the
content and composition of the three forms of phenolic acids in
rice grains of various varieties and from different growing
regions had not been evaluated. Biochemical profiling coupled
with chemometrics such as principal components analysis
(PCA), partial least-squares discriminant analysis (PLS-DA),
and orthogonal PLS-DA (OPLS-DA) allows for sample
431
Table 1. Environmental conditions at the growing locations in Korea.
Location Soil pH1) Temp (°C)2)
Rainfall (mm)2) Min Max Average
Gunwi 6.5 17.9 28.6 22.7 5.6
Suwon 6.3 20.6 28.8 24.3 11.0 1)
Value before planting. 2)Average per location from planting to harvest.
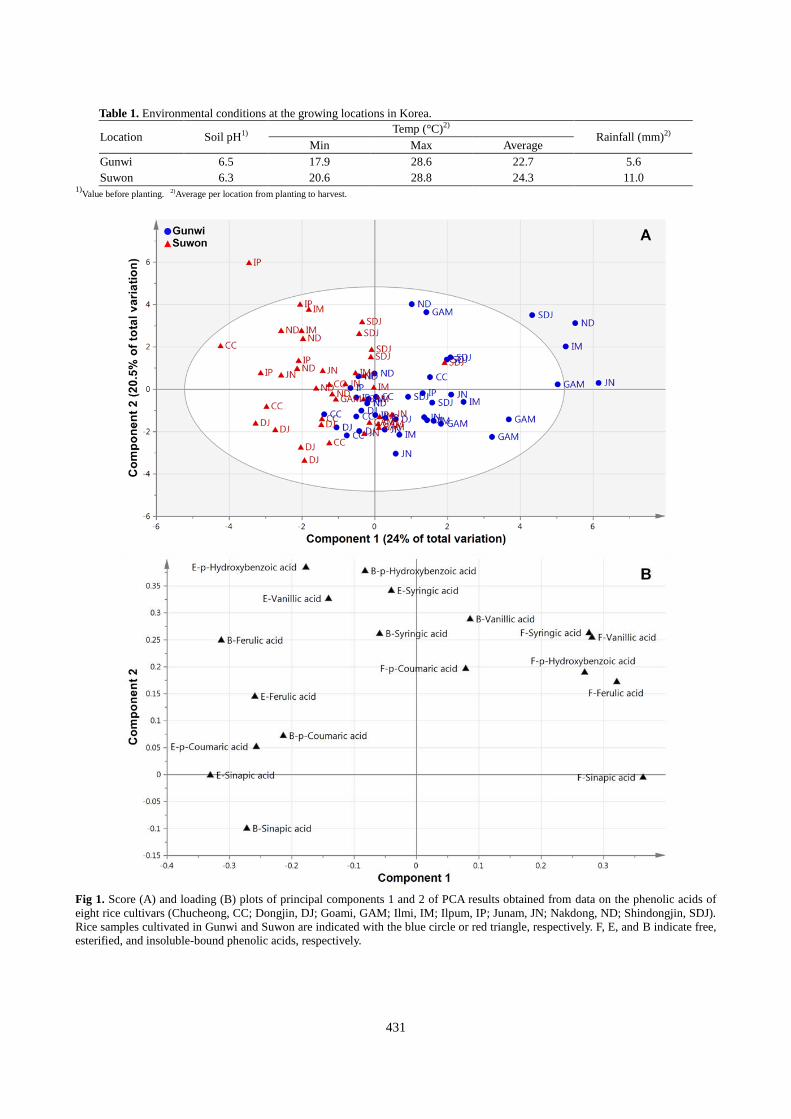
Fig 1. Score (A) and loading (B) plots of principal components 1 and 2 of PCA results obtained from data on the phenolic acids of
eight rice cultivars (Chucheong, CC; Dongjin, DJ; Goami, GAM; Ilmi, IM; Ilpum, IP; Junam, JN; Nakdong, ND; Shindongjin, SDJ).
Rice samples cultivated in Gunwi and Suwon are indicated with the blue circle or red triangle, respectively. F, E, and B indicate free,
esterified, and insoluble-bound phenolic acids, respectively.

432
classification of diverse biological status, origin, or quality.
Recently, metabolomics using diverse analytical instruments
such as GC-MS and proton nuclear magnetic resonance (1H
NMR) spectroscopy have been applied to determine the
geographical origin of various kinds of food, including beef
(Jung et al., 2010), kimchi (Kim et al., 2012), maize (Frank et
al., 2012), cabbage (Kim et al., 2013a), and mungbean (Kim et
al., 2013c). Therefore, this study aimed to determine the
content of phenolic acids in three forms (free, esterified, and
insoluble-bound forms) occurring in various rice cultivars
grown in different locations, and to identify the specific
chemical composition of rice samples depending on geographic
origin or genotypes, using GC-MS combined with
chemometrics. This study is the first to demonstrate the impact
of genotype versus environmental influence on the phenolic
acid profiles of rice grains. For a comparative investigation on
the impact of genotypes versus environmental influence on
phenolic acid profiles, eight Korean rice cultivars were grown
together under two different environmental conditions. The
compositional data obtained were then subjected to multivariate
statistical analyses (i.e., PCA, PLS-DA, OPLS-DA) to
determine the variation in phenolic acid profiles.
Results and Discussion
Assessment of phenolic acid profiles by PCA
PCA is the most common chemometric tool for extracting and
rationalizing information from any multivariate description of a
biological system (Ramadan et al., 2006), which has been used
to assess differences between plant varieties or genetically
modified (GM) plants and their non-GM counterparts at the
metabolome level (Kim et al., 2013d; Park et al., 2013b). The
quantitative data for the three forms of phenolic acids were
subjected to PCA to identify differences in phenolic acid
profiles among cultivars. The two highest-ranking components
accounted for 44.5% of the total variation within the data set,
which revealed no clear separation among the eight rice
cultivars. However, a small indication of separation between
Gunwi and Suwon samples was indicated by principal
component 1, accounting for 24% of the total variation (Fig.
1A). The major components responsible for separation between
the two growing locations were determined by analyzing the
corresponding loading plots. Variation was mainly attributable
to three forms of phenolic acids, of which the loading was
positive for all free phenolics and negative for all esterified and
bound phenolics, with the exception of bound vanillic acid (Fig.
1B). The loading plot indicated that the six phenolic acids in
free form existed at higher levels in rice samples grown in
Gunwi than in those grown in Suwon, and most esterified and
bound phenolics were lower in samples grown in Gunwi than
in those grown in Suwon. Previously, Mpofu et al. (2006)
showed large variation in phenolic acid concentrations of six
wheat genotypes grown at four locations in Canada, and
revealed that environmental effects were greater than genotypic
effects, and neither growing temperature nor rainfall from
anthesis to maturity was thought to be responsible for the
variation. Fernanez-Orozco et al. (2010) determined the
phenolic acid content and composition as three forms (free,
soluble conjugated, and bound phenolics) in 26 wheat
genotypes grown at four locations. In that study, the samples
grown in Hungary over three successive years showed a
significant correlation of temperature with the contents of free
phenolic acids, but no significant correlation were found
between total phenolic acid content and precipitation or
temperature. In the present study, although the environmental
variables, soil pH, temperature, and rainfall, were presented
(Table 1), more research is required to investigate the cause of
environmental effects for the content and composition of
phenolic acid in rice.
Difference analysis of phenolic acid profiles by PLS-DA and
OPLS-DA
PLS-DA is a supervised pattern recognition method that
separates groups of observations by rotating the PCA (Kim et
al., 2013b). In particular, PLS-DA is preferred to PCA for
sample discrimination because the dimension reduction
provided by PLS is guided explicitly by among-group
variability, here being rice varieties or growing locations,
where PCA was only capable of identifying gross variability
directions and incapable of distinguishing “among-group” or
“within-group” variability (Barker and Rayens, 2003; Brereton,
2009). Therefore, quantitative data for the phenolic acids were
subjected to PLS-DA to identify differences in the metabolite
profiles between the growing locations (Fig. 2A) or varieties
(Fig. 2B). The PLS-DA results revealed differences among the
rice samples according to their growing locations, but
clustering by genotype was observed only in ‘Chucheong’ and
‘Dongjin’ cultivars. The quality of the model was described
using the Q2 value that is defined as the proportion of variance
in the data predictable by the model and indicates the
predictability. If Q2 > 0.5, the model is considered to have good
predictive ability (Eriksson et al., 2001). The models had a Q2
of 0.235 for the variety and Q2 of 0.542 for the growing
location. These results suggest that the phenolic acid content of
rice grains was more affected by environmental factors such as
growing condition than by genetic factors, which is in
agreement with the results of recent studies investigating the
impact of genotypic difference versus environmental influence
on the metabolite profiles of maize and cabbage (Skogerson et
al., 2010; Frank et al., 2012; Kim et al., 2013a). The results of
comparative analyses using metabolite data from the samples
grown in different locations indicated that the environmental
impacts on the metabolic phenotype of maize and cabbage were
far more pronounced than the influences of genotypic
difference. The differences in metabolic composition caused by
environmental influences were previously demonstrated by
metabolite profiling of beef and kimchi in which the samples
from different countries could be discriminated by geographical
origin (Jung et al., 2010; Kim et al., 2012). This study is the
first to demonstrate the relative contribution of genotype and
environmental conditions to the phenolic acid profiles of rice
genotypes grown in different locations. OPLS-DA was
introduced as an improvement of the PLS-DA method to
discriminate between two groups (classes) using multivariate
data. In OPLS-DA, a regression model is calculated between
the multivariate data and a response variable that only contains
class information (Westerhuis et al., 2010). Like PLS-DA,
OPLS-DA is a supervised pattern recognition technique, but
has improved predictive quality because the structured noise is
modeled separately (Want et al., 2007). The OPLS-DA results
revealed a clear separation between rice samples on the basis of
growing location (Fig. 3A). The models had a Q2 of 0.605. The
contribution of variables in the projection could be explained
using variables important in the projection (VIP) scores. VIP is
a weighted sum of squares of the PLS weight, and a value
greater than 1 is generally used as a criterion to identify the
variables most important to the model (Kim et al., 2013b).
Among the phenolic acids analyzed, seven compounds had a
significant VIP value (>1) in which sinapic acid in free form
was the most important for creating a prediction of rice
classification (Fig. 3B).
433
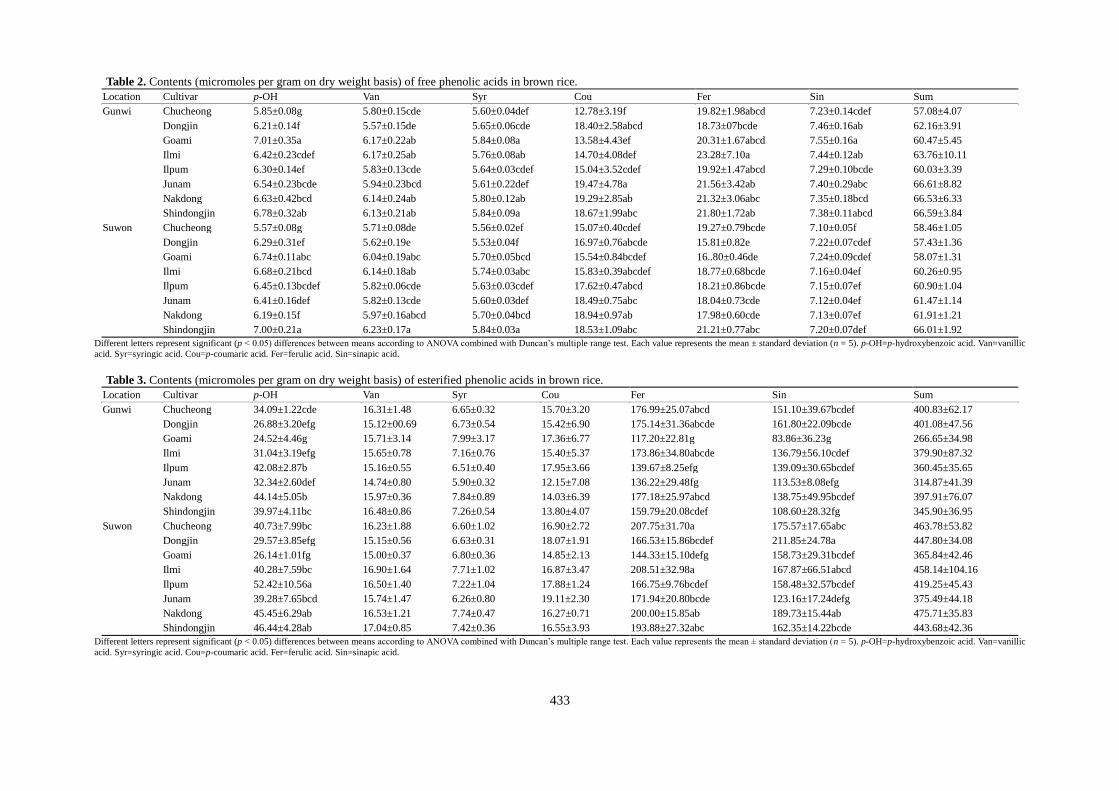
Table 2. Contents (micromoles per gram on dry weight basis) of free phenolic acids in brown rice.
Location Cultivar p-OH Van Syr Cou Fer Sin Sum
Gunwi Chucheong 5.85±0.08g 5.80±0.15cde 5.60±0.04def 12.78±3.19f 19.82±1.98abcd 7.23±0.14cdef 57.08±4.07
Dongjin 6.21±0.14f 5.57±0.15de 5.65±0.06cde 18.40±2.58abcd 18.73±07bcde 7.46±0.16ab 62.16±3.91
Goami 7.01±0.35a 6.17±0.22ab 5.84±0.08a 13.58±4.43ef 20.31±1.67abcd 7.55±0.16a 60.47±5.45
Ilmi 6.42±0.23cdef 6.17±0.25ab 5.76±0.08ab 14.70±4.08def 23.28±7.10a 7.44±0.12ab 63.76±10.11
Ilpum 6.30±0.14ef 5.83±0.13cde 5.64±0.03cdef 15.04±3.52cdef 19.92±1.47abcd 7.29±0.10bcde 60.03±3.39
Junam 6.54±0.23bcde 5.94±0.23bcd 5.61±0.22def 19.47±4.78a 21.56±3.42ab 7.40±0.29abc 66.61±8.82
Nakdong 6.63±0.42bcd 6.14±0.24ab 5.80±0.12ab 19.29±2.85ab 21.32±3.06abc 7.35±0.18bcd 66.53±6.33
Shindongjin 6.78±0.32ab 6.13±0.21ab 5.84±0.09a 18.67±1.99abc 21.80±1.72ab 7.38±0.11abcd 66.59±3.84
Suwon Chucheong 5.57±0.08g 5.71±0.08de 5.56±0.02ef 15.07±0.40cdef 19.27±0.79bcde 7.10±0.05f 58.46±1.05
Dongjin 6.29±0.31ef 5.62±0.19e 5.53±0.04f 16.97±0.76abcde 15.81±0.82e 7.22±0.07cdef 57.43±1.36
Goami 6.74±0.11abc 6.04±0.19abc 5.70±0.05bcd 15.54±0.84bcdef 16..80±0.46de 7.24±0.09cdef 58.07±1.31
Ilmi 6.68±0.21bcd 6.14±0.18ab 5.74±0.03abc 15.83±0.39abcdef 18.77±0.68bcde 7.16±0.04ef 60.26±0.95
Ilpum 6.45±0.13bcdef 5.82±0.06cde 5.63±0.03cdef 17.62±0.47abcd 18.21±0.86bcde 7.15±0.07ef 60.90±1.04
Junam 6.41±0.16def 5.82±0.13cde 5.60±0.03def 18.49±0.75abc 18.04±0.73cde 7.12±0.04ef 61.47±1.14
Nakdong 6.19±0.15f 5.97±0.16abcd 5.70±0.04bcd 18.94±0.97ab 17.98±0.60cde 7.13±0.07ef 61.91±1.21
Shindongjin 7.00±0.21a 6.23±0.17a 5.84±0.03a 18.53±1.09abc 21.21±0.77abc 7.20±0.07def 66.01±1.92
Different letters represent significant (p < 0.05) differences between means according to ANOVA combined with Duncan’s multiple range test. Each value represents the mean ± standard deviation (n = 5). p-OH=p-hydroxybenzoic acid. Van=vanillic
acid. Syr=syringic acid. Cou=p-coumaric acid. Fer=ferulic acid. Sin=sinapic acid.
Table 3. Contents (micromoles per gram on dry weight basis) of esterified phenolic acids in brown rice.
Location Cultivar p-OH Van Syr Cou Fer Sin Sum
Gunwi Chucheong 34.09±1.22cde 16.31±1.48 6.65±0.32 15.70±3.20 176.99±25.07abcd 151.10±39.67bcdef 400.83±62.17
Dongjin 26.88±3.20efg 15.12±00.69 6.73±0.54 15.42±6.90 175.14±31.36abcde 161.80±22.09bcde 401.08±47.56
Goami 24.52±4.46g 15.71±3.14 7.99±3.17 17.36±6.77 117.20±22.81g 83.86±36.23g 266.65±34.98
Ilmi 31.04±3.19efg 15.65±0.78 7.16±0.76 15.40±5.37 173.86±34.80abcde 136.79±56.10cdef 379.90±87.32
Ilpum 42.08±2.87b 15.16±0.55 6.51±0.40 17.95±3.66 139.67±8.25efg 139.09±30.65bcdef 360.45±35.65
Junam 32.34±2.60def 14.74±0.80 5.90±0.32 12.15±7.08 136.22±29.48fg 113.53±8.08efg 314.87±41.39
Nakdong 44.14±5.05b 15.97±0.36 7.84±0.89 14.03±6.39 177.18±25.97abcd 138.75±49.95bcdef 397.91±76.07
Shindongjin 39.97±4.11bc 16.48±0.86 7.26±0.54 13.80±4.07 159.79±20.08cdef 108.60±28.32fg 345.90±36.95
Suwon Chucheong 40.73±7.99bc 16.23±1.88 6.60±1.02 16.90±2.72 207.75±31.70a 175.57±17.65abc 463.78±53.82
Dongjin 29.57±3.85efg 15.15±0.56 6.63±0.31 18.07±1.91 166.53±15.86bcdef 211.85±24.78a 447.80±34.08
Goami 26.14±1.01fg 15.00±0.37 6.80±0.36 14.85±2.13 144.33±15.10defg 158.73±29.31bcdef 365.84±42.46
Ilmi 40.28±7.59bc 16.90±1.64 7.71±1.02 16.87±3.47 208.51±32.98a 167.87±66.51abcd 458.14±104.16
Ilpum 52.42±10.56a 16.50±1.40 7.22±1.04 17.88±1.24 166.75±9.76bcdef 158.48±32.57bcdef 419.25±45.43
Junam 39.28±7.65bcd 15.74±1.47 6.26±0.80 19.11±2.30 171.94±20.80bcde 123.16±17.24defg 375.49±44.18
Nakdong 45.45±6.29ab 16.53±1.21 7.74±0.47 16.27±0.71 200.00±15.85ab 189.73±15.44ab 475.71±35.83
Shindongjin 46.44±4.28ab 17.04±0.85 7.42±0.36 16.55±3.93 193.88±27.32abc 162.35±14.22bcde 443.68±42.36
Different letters represent significant (p < 0.05) differences between means according to ANOVA combined with Duncan’s multiple range test. Each value represents the mean ± standard deviation (n = 5). p-OH=p-hydroxybenzoic acid. Van=vanillic
acid. Syr=syringic acid. Cou=p-coumaric acid. Fer=ferulic acid. Sin=sinapic acid.

434
Fig 2. PLS-DA score plots separating samples according to
their growing locations (A) and cultivars (B). The results were
obtained from data on phenolic acids of eight rice cultivars
(Chucheong, CC; Dongjin, DJ; Goami, GAM; Ilmi, IM; Ilpum,
IP; Junam, JN; Nakdong, ND; Shindongjin, SDJ).
Phenolic acid profiles of rice grown in different locations
Six types of phenolic acids including p-hydroxybenzoic,
vanillic, syringic, p-coumaric, ferulic, and sinapic acids were
detected in three forms in all of the cultivars. The free phenolic
acid content of the eight rice cultivars grown in two different
locations are shown in Table 2. Predominant free-form
compounds were ferulic acid, followed by p-coumaric and
sinapic acids. Total content of the six free phenolics varied,
ranging from 57.08 to 66.61 μmol/g. The esterified phenolic
acids were identified from methanol-soluble fractions followed
by an alkaline hydrolysis. The major portion of the esterified-
form was composed of ferulic and sinapic acids, which
accounted for 78.8–88.0% of the total ester content in all
varieties (Table 3). This is consistent with the results of a
previous study regarding the contents of methanol-soluble
phenolics in rice grains (Park et al., 2012), which showed that
alkaline hydrolysis of the rice soluble fractions released the
major portion of total soluble phenolic acid in which dominant
compounds were ferulic and sinapic acids. The total level of
soluble phenolic esters was highest in the Suwon-grown
‘Nakdong’ cultivar (475.71 μmol/g) and lowest in the Gunwi-
grown ‘Goami’ cultivar (266.65 μmol/g).
Fig 3. (A) Score plot of principal components 1 and 2 from
OPLS-DA results obtained using data on the phenolic acids of
eight rice cultivars (Chucheong, CC; Dongjin, DJ; Goami,
GAM; Ilmi, IM; Ilpum, IP; Junam, JN; Nakdong, ND;
Shindongjin, SDJ). Rice samples cultivated in Gunwi and
Suwon are indicated with the blue circle or red triangle,
respectively. (B) Variable importance in the prediction (VIP)
value of variables from the OPLS-DA. The VIP value indicates
the relative influence of each compound to the grouping. F, E,
and B indicate free, esterified, and insoluble-bound phenolic
acids, respectively.
A noticeable difference between Gunwi- and Suwon-grown rice
was observed in the level of soluble-sinapic acid. The values of
free-sinapic acid in Gunwi-grown rice was higher than that in
Suwon-grown rice, whereas Suwon-grown rice contained
relatively higher levels of the esterified-sinapic acid compared
to Gunwi-grown rice. These results were consistent with the
findings from PCA loading plots (Fig. 1B), indicating that PCA
can be used to visualize complex data. Insoluble-bound
phenolic acids were extracted by the alkaline hydrolysis of
methanol-insoluble residues (Table 4). The total level of
insoluble phenolics was over twofold higher than that of
soluble-phenolics, which was highest in the Suwon-grown
‘Ilpum’ cultivar (1424.26 μmol/g) and lowest in the Gunwi-
grown ‘Ilmi’ cultivar (975.43 μmol/g). Among the six phenolic
acids analyzed, ferulic acid constituted the largest portion of
insoluble phenolics (79.6–84.7%), ranging from 761.45 to
853.19 μmol/g in Gunwi-grown rice and from 898.53 to
1176.95 μmol/g in Suwon-grown rice, which is in agreement
with the findings of Zhou et al. (2004), Qiu et al. (2010), and

435
Table 4. Contents (micromoles per gram on dry weight basis) of insoluble-bound phenolic acids in brown rice.
Location Cultivar p-OH Van Syr Cou Fer Sin Sum
Gunwi Chucheong 27.15±1.93def 24.55±2.25 12.95±1.08abc 82.41±24.99f 840.46±76.63cdef 35.36±4.02f 1022.88±96.81
Dongjin 25.60±1.54f 22.75±0.86 12.98±0.84abc 110.05±17.38bcde 847.76±119.54cdef 44.92±9.27bcd 1064.06±132.26
Goami 25.75±1.31f 23.37±1.03 12.62±0.97bcd 114.99±19.27abcd 761.45±113.77f 37.82±4.01def 976.00±133.38
Ilmi 26.77±1.02def 23.27±1.71 11.57±1.80d 85.43±11.15f 788.07±70.05ef 40.32±7.36cdef 975.43±82.50
Ilpum 31.68±0.95b 22.38±0.72 12.55±0.56bcd 93.37±16.34def 809.92±105.09ef 42.37±1.42cdef 1012.28±120.46
Junam 28.51±2.07cde 22.97±1.97 11.73±0.87cd 90.07±11.13ef 818.74±49.28def 34.94±3.60f 1006.95±54.52
Nakdong 30.90±2.14bc 23.51±0.90 12.55±0.53bcd 96.38±20.65cdef 853.19±175.70cdef 41.89±7.33cdef 1058.42±195.20
Shindongjin 28.50±2.72cde 23.68±2.42 12.44±1.32bcd 98.80±18.53cdef 810.27±85.80ef 37.00±3.49ef 1010.70±100.58
Suwon Chucheong 29.05±1.99bcde 22.58±2.74 13.09±0.56ab 90.18±8.76ef 1005.57±129.68bc 43.46±3.80cde 1203.93±139.00
Dongjin 24.99±1.20f 22.47±0.35 12.62±0.43bcd 119.50±8.58abc 905.20±88.16bcdef 57.23±3.02a 1142.02±100.55
Goami 26.55±0.86ef 22.81±0.72 12.68±0.27bcd 135.48±6.38a 898.53±73.46bcdef 55.14±2.54a 1151.20±81.35
Ilmi 29.17±2.48bcde 22.99±1.24 12.39±0.71bcd 101.42±8.52cdef 1034.20±74.57ab 44.55±3.79bcde 1244.72±84.58
Ilpum 35.06±3.62a 24.92±1.98 13.97±1.30a 127.25±32.36ab 1176.95±270.01a 46.13±9.30bc 1424.26±305.61
Junam 29.49±1.71bcd 23.13±1.24 11.98±0.45bcd 114.76±14.96abcd 984.49±106.94bcd 38.70±5.83cdef 1202.55±124.10
Nakdong 31.29±1.62b 23.20±0.97 12.68±0.61bcd 115.54±5.78abcd 951.89±56.43bcde 50.89±2.48ab 1185.50±62.70
Shindongjin 29.13±0.90bcde 23.04±0.64 12.45±0.43bcd 104.83±5.74bcdef 1001.38±66.99bc 45.51±1.75bc 1216.34±74.85 Different letters represent significant (p < 0.05) differences between means according to ANOVA combined with Duncan’s multiple range test. Each value represents the mean ± standard deviation (n = 5). p-OH=p-hydroxybenzoic acid. Van=vanillic
acid. Syr=syringic acid. Cou=p-coumaric acid. Fer=ferulic acid. Sin=sinapic acid.

436
Sompong et al. (2011). In these studies using various rice
varieties from Thailand, China, Sri Lanka, Australia, Canada,
and USA, ferulic acid was the most abundant phenolic acid in
the insoluble fractions for all the rice samples.
The total level of six phenolic acids including soluble and
insoluble phenolics was higher in Suwon-grown rice than that
of Gunwi-grown rice for all the rice cultivars analyzed. The
precipitation from planting to harvest was two-fold higher in
Suwon compared to that in Gunwi (Table 1). This is consistent
with the findings of Yu et al. (2003), who demonstrated that
irrigated plants had higher contents of phenolic acids in wheat
bran. The ‘Dongjin’ cultivar (1527.31 μmol/g) had the highest
phenolic acids among Gunwi-grown rice, and the ‘Ilpum’
cultivar (1904.43 μmol/g) had the highest phenolic acids
among Suwon-grown rice. This is the first study to determine
the content of phenolic acids in the three forms occurring in
Korean rice cultivars grown in different regions, which provide
valuable information regarding future genetic breeding
programs for rice containing health beneficial phenolic acids.
However, the significant environmental variation must be
considered. Further studies are needed to explore the effects of
individual environmental factors, such as chemical composition
in soil, pathogen, fertilizer, irrigation, solar radiation, etc. as
well as temperature and rainfall, on phenolic acid composition.
Materials and Methods
Rice sample preparation
Eight rice cultivars (Oryza sativa L. cv. Chucheong, Dongjin,
Goami, Ilmi, Ilpum, Junam, Nakdong, and Shindongjin) were
planted together at two locations in Korea: Suwon, Gyeonggi-
do and Gunwi, Gyeongsangbuk-do. Environmental conditions
of these locations are presented in Table 1. The levels of soil
pH before planting were very similar in both Gunwi and Suwon
fields. The plants were grown side-by-side in one field under
the natural conditions and same field management in 2012. The
average temperature during the growing and maturing periods
was slightly higher in Suwon than in Gunwi, whereas the
average rainfall in Suwon was almost two-fold higher
compared to that in Gunwi. Five biological replicates per
variety were harvested, and the whole grain (rough rice)
samples were dried to a final moisture content of 11–14%. Rice
samples were manually hulled and ground to obtain a fine
powder using a planetary mono mill (Pulverisette 6; Fritsch
GmbH, Idar-Oberstein, Germany). The powder was stored at –
80°C until analysis.
Phenolic acid extraction
Three forms of phenolic acids (free, esterified, and bound form)
were extracted according to the procedure described by Park et
al. (2013a), with slight modifications. The powdered samples
(0.1 g) were extracted twice by water-based sonication for 5
min at room temperature and incubation at 30°C for 10 min
with 1 mL of 85% methanol containing 2 g/L butylated
hydroxyanisole (BHA; Sigma-Aldrich, St. Louis, MO, USA).
After centrifugation at 13,000 rpm for 10 min at 4°C, the
combined extracts and residue were analyzed to determine the
quantities of soluble (the mixture of free and esterified forms)
and insoluble-bound phenolic acids, respectively. Fifty
microliters of 3,4,5-trimethoxycinnamic acid (100 µg/mL;
Wako Pure Chemical Industries, Osaka, Japan) was added as an
internal standard (IS), and the mixture was hydrolyzed with 1
mL 5 N NaOH at 30°C under nitrogen gas for 4 h. Each
hydrolyzed sample was adjusted to a pH of 1.5–2.0 with 6 M
HCl. With unhydrolyzed soluble fractions (free forms), all
extracts were extracted with ethyl acetate and evaporated in a
centrifugal concentrator (Eyela, Tokyo, Japan). Derivatization
of the extracts and GC-TOFMS procedure was performed
according to the method previously reported (Park et al.,
2013a). For quantification purposes, a standard stock solution
of six phenolics (ferulic, p-coumaric, p-hydroxybenzoic,
sinapic, syringic, and vanillic acids) and 3,4,5-
trimethoxycinnamic acid (used as an IS) was prepared in
methanol (100 µg/mL). Calibration samples, ranging from 0.01
to 10.0 µg, were prepared by mixing individual stock solutions
of the six phenolic acid standards. The level of esterified
phenolic acids was calculated from the level of soluble
phenolic acids by subtracting the level of free phenolic acids.
Statistical analyses
Experimental data were analyzed using analysis of variance
(ANOVA), and significant differences among the means were
determined by Duncan’s multiple-range test at a 95%
confidence level (SAS 9.2; SAS Institute, Cary, NC, USA).
Quantification data were subjected to PCA, PLS-DA, and
OPLS-DA using BioPAT-SIMCA version 13 (Umetrics, Umeå,
Sweden) to evaluate the differences among groups of
multivariate data. The data file was scaled with unit variance
scaling before all variables were subjected to the PCA, PLS-
DA, and OPLS-DA (Park et al., 2013b).
Conclusion
In this study, the compositional differences of the six phenolic
acids as free, esterified, and insoluble-bound forms were
demonstrated in eight Korean rice cultivars grown together at
two different locations. Differentiation of the phenolic acid
profile of rice samples was determined using PCA, PLS-DA,
and OPLS-DA, and a distinct separation was observed
according to their growing location rather than their genotypes.
These results suggest that the influences of environmental
factors have more impact than genetic background on the
phenolic acid composition of rice grains. The contents of
individual phenolic acids in different forms varied among rice
grains in which the insoluble-bound phenolic acids were the
most abundant form, followed by esterified and free forms. The
highest level of total phenolic acids was observed in the
‘Dongjin’ cultivar among Gunwi-grown rice, but the ‘Ilpum’
cultivar had the highest level of total phenolic acids among
Suwon-grown rice. This study suggests that metabolite
profiling coupled with chemometric analysis is an efficient tool
to identify metabolic differences between rice grains from
different regions of cultivation.
Acknowledgments
This study was supported by the National Academy of
Agricultural Science (Code PJ009654), Rural Development
Administration, Republic of Korea.
References
Barker M, Rayens W (2003) Partial least squares for
discrimination. J Chemometr. 17:166-173.
Brereton RG (2009) Chemometrics for pattern recognition. In:
validation and optimization, John Wiley & Sons Ltd, UK
Dercks W, Trumble J, Winter C (1990) Impact of atmospheric
pollution on linear furanocoumarin content in celery. J Chem
Ecol. 16:443-54.
437
Eriksson L, Johansson E, Kettaneh-Wold N, Wold S (2001)
Multi- and megavariate data analysis: principles and
applications, 2nd edn. Umetrics Academy, Sweden
Fernandez-Orozco R, Li L, Harflett C, Shewry PR, Ward JL
(2010) Effects of environment and genotype on phenolic
acids in wheat in the HEALTHGRAIN diversity screen. J
Agric Food Chem. 58:9341-9352.
Frank T, Röhlig RM, Davies HV, Barros E, Engel KH (2012)
Metabolic profiling of maize kernels-genetic modification
versus environmental influence. J Agric Food Chem.
60:3005-3012.
Horax R, Hettiarachchy N, Islam S (2005) Total phenolic
contents and phenolic acid constituents in 4 varieties of bitter
melons (Momordica charantia) and antioxidant activities of
their extracts. J Food Sci. 70:275-280.
Jung Y, Lee J, Kwon J, Lee KS, Ryu DH, Hwang GS (2010)
Discrimination of the geographical origin of beef by 1H
NMR-based metabolomics. J Agric Food Chem. 58:10458-
10466.
Kim J, Jung Y, Bong YS, Lee KS, Hwang GS (2012)
Determination of the geographical origin of kimchi by 1H
NMR-based metabolite profiling. Biosci Biotechnol Biochem.
76:1752-1757.
Kim J, Jung Y, Song B, Bong YS, Ryu DH, Lee KS, Hwang GS
(2013a) Discrimination of cabbage (Brassica rapa ssp.
pekinensis) cultivars grown in different geographic areas
using 1H NMR-based metabolomics. Food Chem. 137:68-75.
Kim JK, Choi SR, Lee J, Park SY, Song SY, Na J, Kim SW,
Kim SJ, Nou IS, Lee YH, Park SU, Kim HR (2013b)
Metabolic diffetentiation of diamondback moth (Plutella
xylostella (L.)) resistance in cabbage (Brassica oleracea L.
ssp. capitata). J Agric Food Chem. 61:11222-11230.
Kim JK, Kim EH, Lee OK, Park SY, Lee B, Kim SH, Park I,
Chung IM (2013c) Variation and correlation analysis of
phenolic compounds in mungbean (Vigna radiata L.)
varieties. Food Chem. 141:2988-2997.
Kim JK, Park SY, Lee SM, Lim SH, Kim HJ, Oh SD, Yeo Y,
Cho HS, Ha SH (2013d) Unintended polar metabolite
profiling of carotenoid-biofortified transgenic rice reveals
substantial equivalence to its non-transgenic counterpart.
Plant Biotechnol Rep. 7:121-128.
Mandal SM, Chakraborty D, Dey S (2010) Phenolic acids act
as signaling molecules in plant-microbe symbioses. Plant
Signal Behav. 5:359-368.
Mpofu A, Sapirstein HD, Beta T (2006) Genotype and
environmental variation in phenolic content, phenolic acid
composition, and antioxidant activity of hard spring wheat. J
Agric Food Chem. 54:1265-1270.
Park SY, Ha SH, Lim SH, Jung JY, Lee SM, Yeo Y, Kim JK
(2012) Determination of phenolic acids in Korean rice (Oryza
sativa L.) cultivars using gas chromatography-time-of-flight
mass spectrometry. Food Sci Biotechnol. 21:1141-1148.
Park SY, Lee JG, Cho HS, Seong ES, Kim HY, Yu CY, Kim JK
(2013a) Metabolite profiling approach for assessing the
effects of colored light-emitting diode lighting on the
adventitious roots of ginseng (Panax ginseng C.A. Mayer).
Plant Omics. 6:224-230.
Park SY, Lim SH, Ha SH, YeoY, Park WT, Kwon DY, Park SU,
Kim JK (2013b) Metabolite profiling approach reveals the
interface of primary and secondary metabolism in colored
cauliflowers (Brassica oleracea L. ssp. botrytis). J Agric
Food Chem. 61, 6999-7007.
Pupponen-Pimiä R, Nohynek L, Meier C, Kähkönen M,
Heinonen M, Hopia A, Oksman-Caldentey KM (2001)
Antimicrobial properties of phenolic compounds from berries.
J Appl Microbiol. 90:494-507.
Qiu Y, Liu Q, Beta T (2010) Antioxidant properties of
commercial wild rice and analysis of soluble and insoluble
phenolic acids. Food Chem. 121:140-147.
Ramadan Z, Jacobs D, Grigorov M, Kochhar S (2006)
Metabolic profiling using principal component analysis,
discriminant partial least squares, and genetic algorithms.
Talanta. 68:1683-1691.
Robbins RJ (2003) Phenolic acids in foods: an overview of
analytical methodology. J Agric Food Chem. 51:2866-2887.
Skogerson K, Harrigan GG, Reynolds TL, Halls SC, Ruebelt M,
Landolino A, Pandravada A, Glenn KC, Fiehn O (2010)
Impact of genetics and environment on the metabolite
composition of maize grain. J Agric Food Chem. 58:3600-
3610.
Sompong R, Siebenhandl-Ehn S, Linsberger-Martin G,
Berghofer E (2011) Physicochemical and antioxidantive
properties of red and black rice varieties from Thailand,
China, and Sri Lanka. Food Chem. 124:132-140.
Vichapong J, Sookserm M, Srijesdaruk V, Swatsitang P,
Srijaranai S (2010) High performance liquid chromatographic
analysis of phenolic compounds and their antioxidant
activities in rice varieties. LWT-Food Sci Technol. 43:1325-
1330.
Want EJ, Nordstrom A, Morita H, Siuzdak G (2007) From
exogenous to endogenous: the inevitable imprint of mass
spectrometry in metabolomics. J Proteome Res. 6:459-468.
Westerhuis JA, van Velzen EJJ, Hoefsloot HCJ, Smilde AK
(2010) Multivariate paired data analysis: multilevel PLSDA
versus OPLSDA. Metabolomics. 6:119-128.
Yu L, Perret J, Jarris M, Wilson J, Haley S (2003) Antioxidant
properties of bran extracts from “Akron” wheat grown at
different locations. J Agric Food Chem. 51:1566-1570.
Zhou Z, Robards K, Helliwell S, Blanchard C (2004) The
distribution of phenolic acids in rice. Food Chem. 87:401-406.