comparative analysis of mppt techniques for sepic based pv
TRANSCRIPT

International Journal of Engineering Works
ISSN-p: 2521-2419 ISSN-e: 2409-2770
Vol. 8, Issue 01, PP. 01-07, January 2021 https://www.ijew.io/
https://doi.org/10.34259/ijew.21.8010107
Authors retain all © copyrights 2021 IJEW. This is an open access article distributed under the CC-BY License, which permits
unrestricted use, distribution, and reproduction in any medium, provided the original work is properly cited.
Comparative Analysis of MPPT Techniques for SEPIC Based
PV System Amir Khan1, Muhammad Durri Aqil2, Naveed Malik3, Farhan Ullah4, Asfandyar Khalid5
1,3,4,5 Department of Electrical Energy System Engineering, US-Pakistan Center for Advanced Studies in Energy (USPCAS-E), UET Peshawar, Pakistan
2 School of Electrical and Control Engineering, Shaanxi University of Science and Technology, Xian, China
[email protected], [email protected], [email protected], [email protected], [email protected]
Received: 15 December2020, Revised: 25 December2020, Accepted: 01 January
Abstract— In this paper comparative analysis of maximum power point tracking techniques has been conducted to achieve highest magnitude of power from photovoltaic array. The algorithms proposed in this paper for extracting peak output from photovoltaic array are Perturb and Observe, Incremental Conductance, and Fuzzy Logic Control. There are some limitations with conventional converters i.e. Buck-Boost converter. When the operating voltage exceeds normal voltage as the voltage becomes high, the conventional converters fail to carry high voltage and current. Apart from this the ripple contents also increase abnormally due to the large impedance in the conventional converter. Similarly these converters cannot track maximum power point faster and effectively. In that case Single Ended Primary Inductor Converter (SEPIC) is the best choice instead of the conventional buck-boost converter, which is employed with the aim of extracting maximum output from the photovoltaic array. The aim of this study is to compare three MPPT techniques under varying environmental conditions with respect to maximum power extraction and speed of tracking time. SEPIC is used instead of conventional buck-boost converter in order to achieve maximum efficiency and less ripples. Also it can track maximum power point (MPP) faster than Buck-Boost Converter. Comparative analysis of three most extensively used MPPT techniques have been conducted in Simulink/Matlab.
Keywords— Maximum Power Tracking (MPPT), Photovoltaic
(PV), Perturbed and Observe (P&O), Incremental Conductance
(IC) and Fuzzy Logic Control (FLC)
I. INTRODUCTION
Global warming and energy policy is becoming a major issue on the global program during the last few years. Advanced nations are planning to act on climate change. For instance, Europe has scheduled to significantly reduce carbon dioxide emissions to at least 20% below 1990 levels and generate at least 20% of its power consumption from renewable power by 2020
[1]. In this respect, as it is a green source, it has a critical role. The only emissions related to PV seem to be from the manufacturing of their modules. They produce power from solar irradiation without producing greenhouse gas emissions. PV panels generate more energy for their production in their lifetime, which is around 25 years. They can be mounted in that regions if there is no other use, like towers and deserts. They can generate power for isolated areas in which electrical energy is unavailable. The first category of installations is regarded as an off grid system and is often the most cost-effective solution for supplying power in remote locations. However, plenty of the photovoltaic generation comes from grid tied systems in which the energy is supplied to the power grid. Moreover, it is an emerging sector in western countries like Germany, which is the most influential in the market in generating energy through photovoltaic from 2010. PV generation at the other hand is more expensive than other means because of the equipment’s needed. It is being encouraged by governments with incentives, anticipating the equipment to develop so that it becomes profitable in just the coming years [2]. Improving the efficiency in photovoltaic plants in order to enhance the energy generated is an important element as it will boost the income, thus lowering the price of electricity produced in order to come up to the price of the energy generated from extra resources.
There seem to be three key elements which influence the photovoltaic system's efficiency: panel’s efficiency (ranging from 9 to 15%), efficiency of the inverter that ranges from (95-98%), and lastly the efficiency of MPPT is about 98%. So by detecting the MPP with improved technique is more easier and simple method instead of improving the generation unit which is costlier and time consuming process [3]. MPPT control algorithms are essential since PV modules have nonlinear I-V characteristics with a common point where maximum power can be produced. This unique point varies with both panel temperature and the conditions for irradiance. Throughout the day, both conditions change and vary based on the season of the year. In addition, owing to varying the ambient factors like those of clouds, irradiation can alter quickly. The detection of MPP

International Journal of Engineering Works Vol. 8, Issue 01, PP. 01-07, January 2021
www.ijew.io
correctly is very essential for maximum power generation. A number of MPPT control techniques are already released in recent years [4]. They vary in several respects in sophistication, some needed sensors, and other may vary due to efficiency and cost. Furthermore, if one similar result can be achieved with a simpler and less costly, it is useless to use a costlier or more complex technique. This is why some of the methods suggested are not being used.
Photovoltaic cells directly convert sunlight into electrical energy [5]. Many commercial PV modules currently use two categories of PV cells: thin-film and crystalline silicon. The first category is known as PV’s 1st generation Consisting of monocrystalline and multicrystalline. These cells generate electricity from extremely sophisticated poly-silicon feedstock through crystalline silicon semiconductor material. The former are reliable than the latter, however they are not cost effective [6]. Similarly the second category of PV cell that is thin film is termed as PV’s 2nd generation. In which power is generated from semiconductor’s thin layers, Manufactured from copper indium di selenide, amorphus silicon, cu induim galium di silenide, cadmium tellurid. A PV cell circuit is revealed in the Error! Reference source not found. with a source of current which is connected parallel to diode, shunt and series resistances RS , RSH. There is a significant correlation among current Ig and irradiance i.e. the current Ig varies directly with irradiance.
Fig. 1 Equivalent circuit of PV Cell
II. MAXIMUM POWER TRACKING TECHNIQUES
The irradiance and temperature curves are the two most vital factors which intluence the output power characteristics of the PV system. And these two are momentarily maintained by solar irradiation and temperature. As discussed, there will be blunt changes in the values of solar radiation during the day as shown in Fig. 1. A typical solar panel converts only 30 to 40 percent of the incident solar irradiation into electrical energy. According to Maximum Power Transfer theorem, the power output of a circuit is maximum when the Thevenin impedance of the circu it (source impedance) matches with the load impedance. In this way, Maximum power point tracking technique is necessarily used to improve the efficiency of the solar panel.
A. Perturb and Observe (P&O)
Hill climbing is another name given to P&O because either term applies to the same approach established on how they are executed. It incorporates disturbances of the converter’s duty-
cycle and disturbance of coupling capacitor linking PV array and operating voltage of the power converter [7]. The P&O technique frequently increases or decreases the PV's voltage output across the terminals and relates the strength of the previous cycle gained across the current cycle. If the voltage is directly related to power as if one increase the other also rises, as a result device for controlling the position adjusts in that way; then the operating point moves in the reverse way. Once the current position of shift is identified, the current changes at a constant rate. Such level is a factor to be modified to allocate stability among rapid feedbacks through fewer consistent variation of the state.
Fig. 2 PV curve for P&O
A prevalent issue in P&O algorithm can be observed each
MPPT cycle is disturbed by the array terminal voltage; so once
the MPP is acquired, output power shifts towards the optimum,
owing to a reduction of energy in the scheme. That is
particularly exact in steady or gradually changing
environmental situations. A modified adaptive P&O technique by changing the step size of disturbance can be used to fix this
issue, in which an intelligent control regulator adjusts
the step size of disturbance to a broad level once the energy
shifts mainly owing to environmental variability in a wide
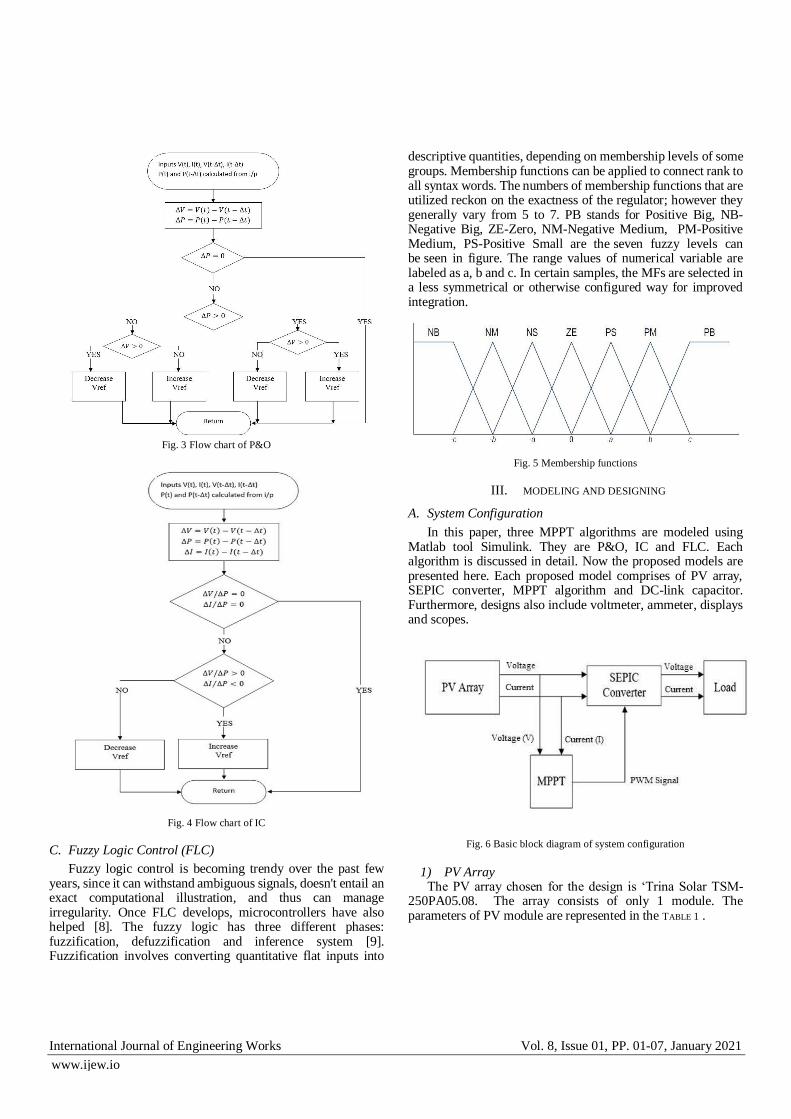
spectrum. The Flow chart of P&O can be viewed from the Fig.
3.
B. Incremental Conductance
The Slop of V-P becomes zero around MPP, that's the cause of Incremental conductance. The slop on the left side is positive while it becomes negative at the right.
∆𝑉/∆𝑃 =O at MPP
∆𝑉/∆𝑃> O LHS of the curve
∆𝑉/∆𝑃< O RHS of the curve
By comparing the increments in both voltage and power, MPP can be determined. Flow chart of the IC can be seen in the Fig. 4.
International Journal of Engineering Works Vol. 8, Issue 01, PP. 01-07, January 2021
www.ijew.io
Fig. 3 Flow chart of P&O
Fig. 4 Flow chart of IC
C. Fuzzy Logic Control (FLC)
Fuzzy logic control is becoming trendy over the past few years, since it can withstand ambiguous signals, doesn't entail an exact computational illustration, and thus can manage irregularity. Once FLC develops, microcontrollers have also helped [8]. The fuzzy logic has three different phases: fuzzification, defuzzification and inference system [9]. Fuzzification involves converting quantitative flat inputs into
descriptive quantities, depending on membership levels of some groups. Membership functions can be applied to connect rank to all syntax words. The numbers of membership functions that are utilized reckon on the exactness of the regulator; however they generally vary from 5 to 7. PB stands for Positive Big, NB-Negative Big, ZE-Zero, NM-Negative Medium, PM-Positive Medium, PS-Positive Small are the seven fuzzy levels can be seen in figure. The range values of numerical variable are labeled as a, b and c. In certain samples, the MFs are selected in a less symmetrical or otherwise configured way for improved integration.
Fig. 5 Membership functions
III. MODELING AND DESIGNING
A. System Configuration
In this paper, three MPPT algorithms are modeled using Matlab tool Simulink. They are P&O, IC and FLC. Each algorithm is discussed in detail. Now the proposed models are presented here. Each proposed model comprises of PV array, SEPIC converter, MPPT algorithm and DC-link capacitor. Furthermore, designs also include voltmeter, ammeter, displays and scopes.
Fig. 6 Basic block diagram of system configuration
1) PV Array The PV array chosen for the design is ‘Trina Solar TSM-
250PA05.08. The array consists of only 1 module. The parameters of PV module are represented in the TABLE 1 .
International Journal of Engineering Works Vol. 8, Issue 01, PP. 01-07, January 2021
www.ijew.io
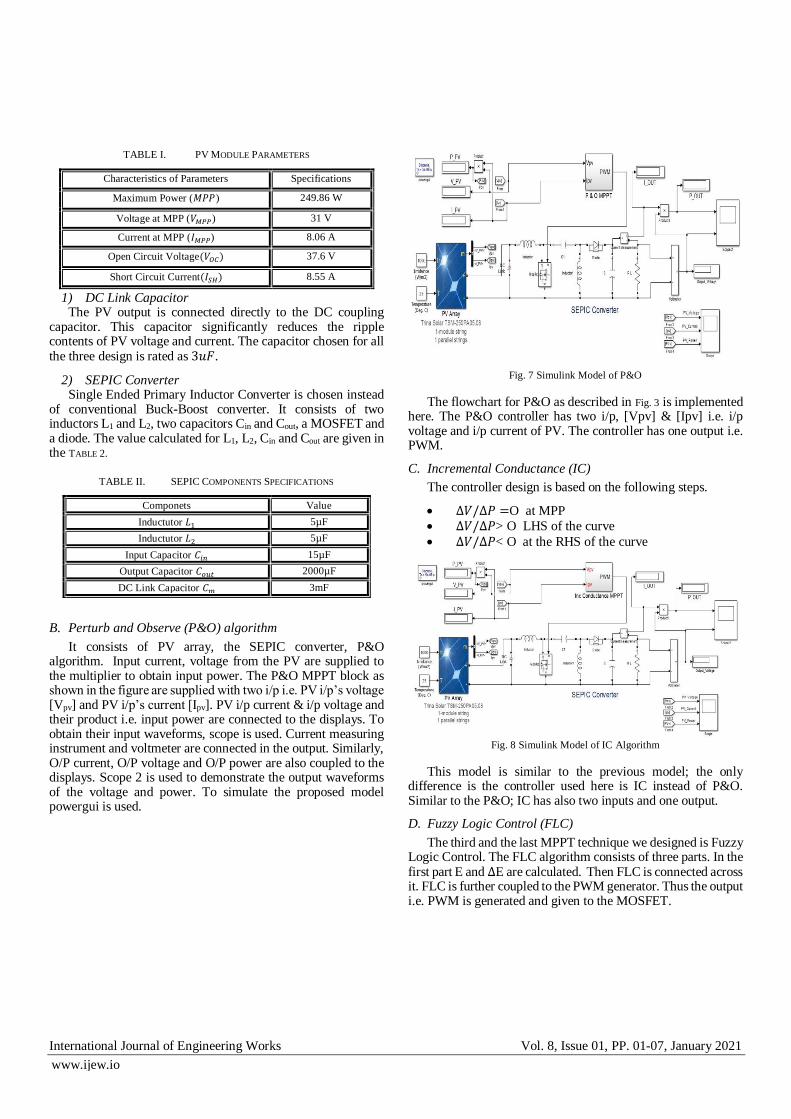
TABLE I. PV MODULE PARAMETERS
Characteristics of Parameters Specifications
Maximum Power (𝑀𝑃𝑃) 249.86 W
Voltage at MPP (𝑉𝑀𝑃𝑃) 31 V
Current at MPP (𝐼𝑀𝑃𝑃) 8.06 A
Open Circuit Voltage(𝑉𝑂𝐶) 37.6 V
Short Circuit Current(𝐼𝑆𝐻) 8.55 A
1) DC Link Capacitor The PV output is connected directly to the DC coupling
capacitor. This capacitor significantly reduces the ripple contents of PV voltage and current. The capacitor chosen for all the three design is rated as 3𝑢𝐹.
2) SEPIC Converter Single Ended Primary Inductor Converter is chosen instead
of conventional Buck-Boost converter. It consists of two inductors L1 and L2, two capacitors Cin and Cout, a MOSFET and a diode. The value calculated for L1, L2, Cin and Cout are given in the TABLE 2.
TABLE II. SEPIC COMPONENTS SPECIFICATIONS
Componets Value
Inductutor 𝐿1 5µF
Inductutor 𝐿2 5µF
Input Capacitor 𝐶𝑖𝑛 15µF
Output Capacitor 𝐶𝑜𝑢𝑡 2000µF
DC Link Capacitor 𝐶𝑚 3mF
B. Perturb and Observe (P&O) algorithm
It consists of PV array, the SEPIC converter, P&O algorithm. Input current, voltage from the PV are supplied to the multiplier to obtain input power. The P&O MPPT block as shown in the figure are supplied with two i/p i.e. PV i/p’s voltage [Vpv] and PV i/p’s current [Ipv]. PV i/p current & i/p voltage and their product i.e. input power are connected to the displays. To obtain their input waveforms, scope is used. Current measuring instrument and voltmeter are connected in the output. Similarly, O/P current, O/P voltage and O/P power are also coupled to the displays. Scope 2 is used to demonstrate the output waveforms of the voltage and power. To simulate the proposed model powergui is used.
Fig. 7 Simulink Model of P&O
The flowchart for P&O as described in Fig. 3 is implemented here. The P&O controller has two i/p, [Vpv] & [Ipv] i.e. i/p voltage and i/p current of PV. The controller has one output i.e. PWM.
C. Incremental Conductance (IC)
The controller design is based on the following steps.
∆𝑉/∆𝑃 =O at MPP
∆𝑉/∆𝑃> O LHS of the curve
∆𝑉/∆𝑃< O at the RHS of the curve
Fig. 8 Simulink Model of IC Algorithm
This model is similar to the previous model; the only difference is the controller used here is IC instead of P&O. Similar to the P&O; IC has also two inputs and one output.
D. Fuzzy Logic Control (FLC)
The third and the last MPPT technique we designed is Fuzzy Logic Control. The FLC algorithm consists of three parts. In the first part E and ∆E are calculated. Then FLC is connected across it. FLC is further coupled to the PWM generator. Thus the output i.e. PWM is generated and given to the MOSFET.
International Journal of Engineering Works Vol. 8, Issue 01, PP. 01-07, January 2021
www.ijew.io
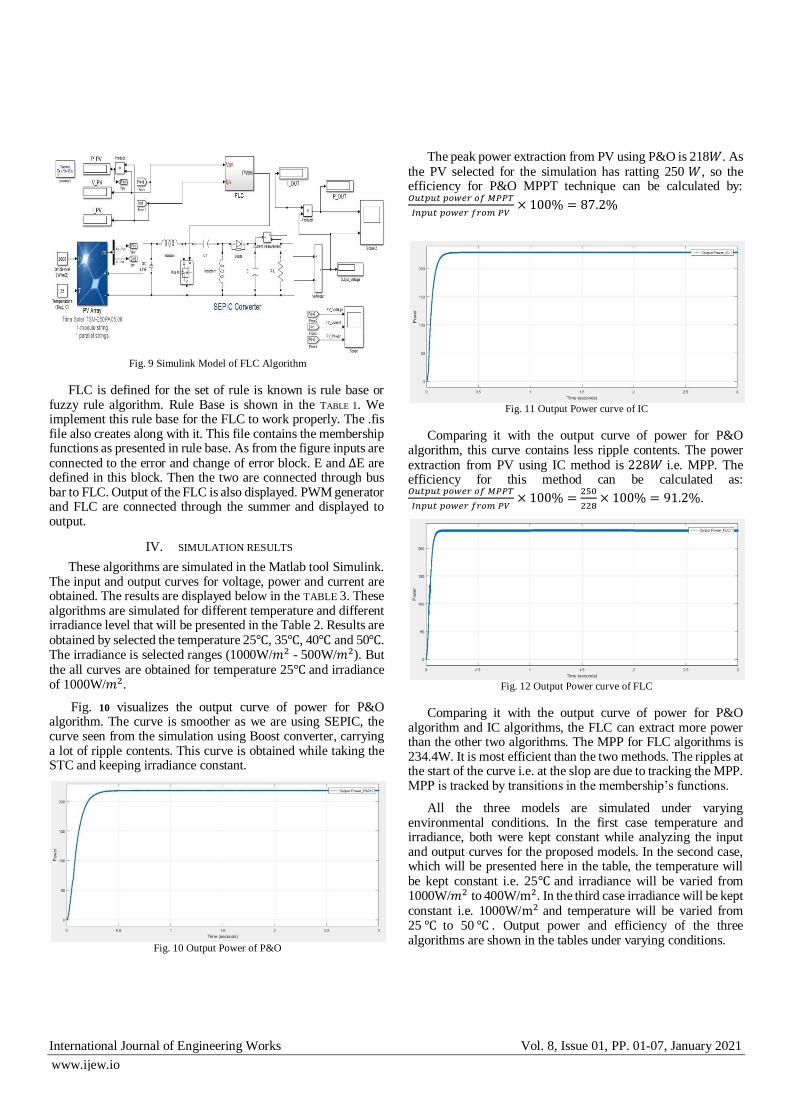
Fig. 9 Simulink Model of FLC Algorithm
FLC is defined for the set of rule is known is rule base or fuzzy rule algorithm. Rule Base is shown in the TABLE 1. We implement this rule base for the FLC to work properly. The .fis file also creates along with it. This file contains the membership functions as presented in rule base. As from the figure inputs are connected to the error and change of error block. E and ∆E are defined in this block. Then the two are connected through bus bar to FLC. Output of the FLC is also displayed. PWM generator and FLC are connected through the summer and displayed to output.
IV. SIMULATION RESULTS
These algorithms are simulated in the Matlab tool Simulink. The input and output curves for voltage, power and current are obtained. The results are displayed below in the TABLE 3. These algorithms are simulated for different temperature and different irradiance level that will be presented in the Table 2. Results are obtained by selected the temperature 25℃, 35℃, 40℃ and 50℃. The irradiance is selected ranges (1000W/𝑚2 - 500W/𝑚2). But the all curves are obtained for temperature 25℃ and irradiance of 1000W/𝑚2.
Fig. 10 visualizes the output curve of power for P&O algorithm. The curve is smoother as we are using SEPIC, the curve seen from the simulation using Boost converter, carrying a lot of ripple contents. This curve is obtained while taking the STC and keeping irradiance constant.
Fig. 10 Output Power of P&O
The peak power extraction from PV using P&O is 218𝑊. As the PV selected for the simulation has ratting 250 𝑊, so the efficiency for P&O MPPT technique can be calculated by: 𝑂𝑢𝑡𝑝𝑢𝑡 𝑝𝑜𝑤𝑒𝑟 𝑜𝑓 𝑀𝑃𝑃𝑇
𝐼𝑛𝑝𝑢𝑡 𝑝𝑜𝑤𝑒𝑟 𝑓𝑟𝑜𝑚 𝑃𝑉× 100% = 87.2%
Fig. 11 Output Power curve of IC
Comparing it with the output curve of power for P&O algorithm, this curve contains less ripple contents. The power extraction from PV using IC method is 228𝑊 i.e. MPP. The efficiency for this method can be calculated as: 𝑂𝑢𝑡𝑝𝑢𝑡 𝑝𝑜𝑤𝑒𝑟 𝑜𝑓 𝑀𝑃𝑃𝑇
𝐼𝑛𝑝𝑢𝑡 𝑝𝑜𝑤𝑒𝑟 𝑓𝑟𝑜𝑚 𝑃𝑉× 100% =
250
228× 100% = 91.2%.
Fig. 12 Output Power curve of FLC
Comparing it with the output curve of power for P&O algorithm and IC algorithms, the FLC can extract more power than the other two algorithms. The MPP for FLC algorithms is 234.4W. It is most efficient than the two methods. The ripples at the start of the curve i.e. at the slop are due to tracking the MPP. MPP is tracked by transitions in the membership’s functions.
All the three models are simulated under varying environmental conditions. In the first case temperature and irradiance, both were kept constant while analyzing the input and output curves for the proposed models. In the second case, which will be presented here in the table, the temperature will be kept constant i.e. 25℃ and irradiance will be varied from 1000W/𝑚2 to 400W/m2. In the third case irradiance will be kept constant i.e. 1000W/m2 and temperature will be varied from 25 ℃ to 50 ℃ . Output power and efficiency of the three algorithms are shown in the tables under varying conditions.

International Journal of Engineering Works Vol. 8, Issue 01, PP. 01-07, January 2021
www.ijew.io
TABLE III. MPPT EFFICIENCY UNDER VARYING IRRADIANCE
FLC is more efficient than IC and P&O MPPT techniques under varying irradiance keeping the temperature constant i.e. 25°C. The power extraction by FLC is 232.5W from a 250W solar panel at irradiance of 1000W/m2, while the power extracted by IC and P&O are 228W and 218.2W respectively. The efficiency of FLC is 93 and it increases as the irradiance level is goes on decreasing, this is the main advantage of FLC than the other two techniques. Similarly IC is more efficient than P&O as the power extraction by IC is more than power extracted by P&O. Similarly, the efficiency of these MPPT techniques at different temperature. From the table it is concluded that FLC is more efficient than P&O and IC methods. Also it can be concluded that efficiency decreases, as temperature increases.
TABLE IV. MPPT EFFICIENCY AT DIFFERENT TEMPERATURES
Fig. 13Comparison of the Output Power curves
It is concluded that FLC is more efficient than IC and P&O MPPT techniques at varying temperature. The power extraction by FLC is 232.5W from a 250W solar panel at 25°C, while the power extracted by IC and P&O are 228W and 218.2W respectively. Moreover, the efficiency of FLC at 25°C, 40°C and 50°C is 93%.
Final comparison of the three MPPT techniques on the basis of output power curves are shown in the Fig. 13. It can be concluded that FLC is more efficient than IC, which is further more efficient than P&O i.e. for the same input power, the power extraction by FLC is better than IC and P&O.
CONCUSLION
Fuzzy Logic Control (FLC) is the best MPPT technique than Perturb and Observe (P&O) and Incremental Conductance (IC). The Power extraction by FLC is 232.5 watts from the input power of 249.9 w. It is more efficient than the P&O and IC as the Efficiency of FLC is 93% and the tracking time is 1.2 seconds which the fastest time to track maximum power point (MPP) than the other two techniques.
TABLE V. COMPARISON ON THE BASIS OF POWER, EFFICIENCY AND
TRACKING TIME
REFERENCES
[1] Anonymous, “2020 climate & energy package,” Climate Action -
European Commission, 23-Nov-2016. [Online]. Available: https://ec.europa.eu/clima/policies/strategies/2020_en.
[2] “MITEI-The-Future-of-Solar-Energy.pdf.” .
[3] “18-DESIGN OF A SEPIC CONVERTER FOR SOLAR PV
SYSTEM.pdf.” .
[4] “Comparison of Photovoltaic Array Maximum Power Point Tracking Techniques - IEEE Journals & Magazine.” [Online]. Available:
https://ieeexplore.ieee.org/document/4207429.
[5] “Solar Cell Structure | PVEducation.” [Online]. Available:
http://www.pveducation.org/pvcdrom/solar-cell-operation/solar-cell-structure.
[6] S. Price and R. Margolis, “2008 Solar Technologies Market Report,” p.
131.
[7] M. A. G. de Brito, L. P. Sampaio, G. Luigi, G. A. e Melo, and C. A. Canesin, “Comparative analysis of MPPT techniques for PV
applications,” in 2011 International Conference on Clean Electrical Power (ICCEP), Ischia, Italy, 2011, pp. 99–104.
[8] “Comparative study of maximum power point tracking techniques for
hybrid renewable energy system.pdf.” .

International Journal of Engineering Works Vol. 8, Issue 01, PP. 01-07, January 2021
www.ijew.io
[9] A. F. Murtaza, H. A. Sher, M. Chiaberge, D. Boero, M. De Giuseppe, and
K. E. Addoweesh, “Comparative analysis of maximum power point tracking techniques for PV applications,” in INMIC, Lahore, Pakistan,
2013, pp. 83–88.
[10] “Power tracking techniques for efficient operation of photovoltaic array in solar applications – A review-2019.pdf.”
How to cite this article: Amir Khan, Muhammad Durri Aqil, Naveed Malik, Farhan Ullah, Asfandyar Khalid “Comparative Analysis of MPPT Techniques for SEPIC Based PV System”, International Journal of Engineering Works, Vol. 8, Issue 01, PP. 01-07, January 2021, https://doi.org/10.34259/ijew.21.8010107