comparative analysis of butter thermal behavior in
TRANSCRIPT

Food Sci. Technol, Campinas, 40(Suppl. 2): 597-604, December 2020 597/604 597
Food Science and Technology
OI: D https://doi.org/10.1590/fst.32019
ISSN 0101-2061 (Print)ISSN 1678-457X (Online)
1 IntroductionVegetable oils and animal fats contain lipid compounds
that are important in terms of nutrition and processing in food products (Akoh, 1998). Today, there are various types of vegetable oils and animal fats like milk fat whose chemical properties have been obtained through scientific research and development (O’Brien, 1998). Due to the relatively high price of milk fat compared to other fats and oils, milk fat is subjected to adulteration by replacement of cheaper animal fats or vegetable oils (Ntakatsane et al., 2013) and butter is not excluded in this regard and its detection methods have been studied (Deelstra et al., 2014). Vegetable oils and animal fats are complex compounds that contain a mixture of fatty acids and triacylglycerols (TAGs) (Tsimidou et al., 1987) which affected physical and chemical properties of oils and fats. The methods to check the authenticity of butter, even today, are internationally accepted as standard tests in spite of their low repeatability (Nogala-Kałucka et al., 2008). Recently, significant works have been performed on the authenticity of butter. One of the first methods is the analysis of fatty acid compounds using gas chromatography (GC). Given high variation in mass approximate percentage of butyric acid, it is difficult to provide qualitative and quantitative information on foreign fat in pure milk fat up to 20% (Molkentin & Precht, 1987; Glaeser, 2002). Therefore, due to high variability of fatty acids of milk, use of fatty acid composition is not sufficient in order for evaluation and fraud recognition (Derewiaka et al., 2011; Anklam & Lipp, 1997).
Differential Scanning Calorimetric (DSC) has been widely used in the study of oils and fats (Cebula & Smith, 1992). The DSC provides a detailed analysis of melting behavior of oils and fats (O’Brien, 1998). Differential Scanning Calorimetric has been tested for use in the assessment of authenticity of fats, in which crystallization curves have been initially recommended for this evaluation (Lambelet & Ganguli, 1983; Aktas & Kaya, 2001). The measurements based on crystallization curves have advantages such as avoiding problems associated with polymorphism of fats (Lambelet & Ganguli, 1983). By studying milk fat (Tomaszewska-Gras, 2013) it was found that the melting curve could also be better than crystallization curves to study this sample . Each curve of DSC is composed of three parts; the beginning of peak that shows melting of the first crystals, the top of peak that shows melting of all crystals and the end of peak that shows completion of a process (Farah et al., 2018). In milk fat, fatty acids and triacylglycerols make a lot of changes in the tissue properties. Each type of triacylglycerol scan can be converted to different forms of crystalline α, β and β’ from a less stable phase to a more stable phase. These phases are characterized by melting temperature and enthalpy (Heyen et al., 1999). There are not many researches in comparison with the feasibility of DSC crystallization and melting curves to monitor the presence of non-milk fats (Tomaszewska-Gras, 2016) but the results indicated the potential of DSC method because it is a sensitive, rapid and repeatable method for identifying oils and fats. In DSC, any change in the shape of the melting curve, identified the adulteration (Farah et al., 2018). Therefore, the evaluation
Comparative analysis of butter thermal behavior in combination with bovine tallowZahra NILCHIAN1, Mohamad Reza EHSANI1, Zahra PIRAVI-VANAK2* , Hossein BAKHODA3
a
Received 06 Dec., 2019 Accepted 27 Jan., 20201 Department of Food Science and Technology, Science and Research Branch, Islamic Azad University, Tehran, Iran2 Department of Food, Halal and Agricultural Products, Food Technology and Agricultural Products Research Center, Standard Research Institute – SRI, Karaj, Iran3 Department of Agricultural Mechanization, Science and Research Branch, Islamic Azad University, Tehran, Iran*Corresponding author: [email protected]
AbstractAssessment of butter authenticity in combination with animal fat is a major challenge. Changing the butter composition can affect crystallization and polymorphism properties. The purpose of this study was to evaluate the thermal behavior of butter combined with (0-15% w/w) bovine tallow using Digital Calorimetric Scanning, and to determine fatty acid profile and isothermal microstructure in order to complete DSC data. According to the statistical analysis, obtained L_Pseudo equations show that in the crystallization curve, with increase of bovine tallow percentage in the butter, the onset temperature of peak 1 and amount of heat released in peak 2 increased and the onset temperature of peak 2 decreased and peak 1 became wider. In the melting curves, with increase of bovine tallow percentage, the onset temperature of peaks 1 and 2 increased. Regarding the value of R2, the onset temperature of peak 2 in the melting curve had capability of estimation 78%. The crystal morphology of butter samples was different and with increased temperature, larger crystals were observed. In general, scans of calorimetric results revealed that DSC is a valuable method for studying butter in combination with animal fat and also can be utilized for distinguishing pure fat from adulterated one.
Keywords: butter; bovine tallow; DSC; fatty acids; isothermal microstructure.
Practical Application: Determination of butter authenticity in combination with bovine tallow.

Food Sci. Technol, Campinas, 40(Suppl. 2): 597-604, December 2020598 598/604
Thermal behavior of butter combined with bovine tallow
of butter thermal behavior in combination with bovine tallow is still very limited and in the present research, the behavior of melting and crystallization of butter in combination with bovine tallow and their relationship with fatty acids were studied.
2 Materials and methods2.1 Preparation of butter samples
Milk sample from Holstein calf, collected at the end of the third month of spring season, was used to prevent from fluctuation of season changes in milk fat compositions level. Preparation of pure butter and its fat extraction were done (Nilchian et al., 2020). To prepare treatments, butter fat was mixed with different percentages of bovine tallow based on statistical analysis (0, 1.18, 2.63, 4.40, 6.06, 7.50, 9.94, 12.38, 13.69 and 15%).
2.2 Evaluation of the percentage of fatty acids
Fat extraction from different treatments and then direct fatty acids methylation were performed. Fatty acids were analyzed according to gas chromatography (Nilchian et al., 2020).
2.3 Isothermal behavior of various butter treatments
To study the isothermal behavior of crystallization of various butter treatments, DSC was used at temperature of -60 °C to + 80 °C where the crystallization and melting kinetics varied by changing the triacylglycerols (American Oil Chemists’ Society, 2000).
2.4 Shape and crystalline structure
The crystal structure of the samples was examined in isothermal conditions using a polarized optical microscope equipped with a digital camera. For this, the samples were heated at 80 °C in an oven and kept at this temperature for 30 minutes to ensure that the fats were totally melted. A drop of melted fat was placed on a pre-heated microscope slide and covered with a pre-heated slipper coating. Slides were stored at -20, 10 and 20 °C for 5 hours. Then images were taken at 200x magnification, and analyzed (Zhang et al., 2013).
2.5 Statistical analysis
To examine authenticity percentage, experiments were designed by response surface methodology with statistical software of Design Expert 8. ANOVA in this methodology was used to evaluate significant differences, Adj R-Squared, CV% and L-Pseudo equations (significance levels at p < 0.05). For each treatment, experiments were repeated three times. This statistical method was used to predict authenticity optimal point.
3 Results and discussionAccording to statistical analysis, the addition of bovine tallow
fat revealed a significant difference at 95% level on the percentage of short and long chains saturated and mono-unsaturated fatty acids. Based on the results for each fatty acid in different butter treatments, C4:0, C6:0, C8:0, C10:0, C10:1, C11:0, C12:0, C14:0, C14:1, C16:0 and CLAc9t11 fatty acids decreased 0.52%, 0.62%, 0.47%, 0.79%, 0.12%, 0.03%, 0.92%, 7.05%, 0.86%, 28.77%, 0.43%, irrespectively, and
C17:0, C17:1, C18:0, C18:1C fatty acids raised 1.09%, 0.62%, 15.08%, 32.56%, irrespectively, with increase of the percentage of bovine tallow (up to 15%) in butter. Based on analysis carried out in this study, the composition of butter and bovine tallow fatty acids is similar, but their percentage is different. The increase of bovine tallow in butter has affected the composition of butter fatty acids in a way that the percentage of long-chain saturated and mono-unsaturated fatty acids in butter has increased. In this study, bovine tallow had a higher percentage of C17:0, C17:1, C18:0 and C18:1C fatty acids, which also affects the thermal behavior of its triacylglycerols. Therefore, by adding bovine tallow to butter, isothermal behavior of adulterated butter changes compared to that of pure butter.
The results for isothermal behavior of butter crystallization in combination with different percentages of bovine tallow are shown in Table 1. According to the statistical method, the effect of fat type on different parts of the crystallization curves was evaluated.
Review results indicated that addition of tallow fat had been a significant difference at 95% level in the onset temperature of peak 1 and 2, the temperature of peak 2 top and enthalpy changes of peak 2 in the crystallization curves. According to the statistical result for each of the four factors, the L_Pseudo equation was obtained (Table 2), showing that both fat types of tallow and butter have influenced the crystallization curve factors. Regarding the onset temperature of peak 1, it has been shown that added tallow fat had a greater effect on the rise of this temperature than butter did, and that with increase of bovine tallow in butter, the onset temperature of peak 1 has increased. In relation to the onset temperature of peak 2 and the temperature of peak 2 top, it has been shown that added tallow fat has a lesser effect on the rise of the amount of these two points than butter does, and that with increase of bovine tallow in the butter, the onset temperature of peak 2 and the temperature of peak 2 top decreased. Equation for the enthalpy changes of peak 2 revealed that added tallow fat has a greater effect on the rise of peak 2 enthalpy than butter does, and that with increase of percentage of bovine tallow in butter, amount of heat released in the peak 2 of crystallization has increased. Regarding the value of R2, it is determined that the onset temperature of peak 1, the onset temperature of peak 2, the temperature of peak 2 top and enthalpy changes of peak 2 in the crystallization curve cannot be estimated for bovine tallow added in butter. According to studies by other researchers, there is a difference between thermal properties of different vegetable oils, mainly due to difference in the distribution of TAG molecules (Breitschuh & Windhab, 1996). In other research, Jahurul et al. (2019) investigated the thermal properties of bambangan kernel fat and palm stearin in cocoa butter alternatives that the melting onset temperatures decreased and the crystallization onset temperatures increased (Jahurul et al., 2019).
According to the results from Table 1, difference between the onset temperature of peak 1 and the temperature of peak 1 top in the crystallization curve were also investigated (results not shown). Based on the statistical results, this difference was significant and with increased percentage of tallow into butter, the difference between the onset temperature of peak 1 and the temperature

Nilchian et al.
Food Sci. Technol, Campinas, 40(Suppl. 2): 597-604, December 2020 599/604 599
of peak 1 top has sharply increased and peak 1 expanded. The difference between the onset temperature of peak 1 and the temperature of peak 1 top has capability of estimation 85% about bovine tallow added to butter. The difference between the onset temperature of peak 2 and the temperature of peak 2 top in the crystallization curve were also studied. According to the statistical results, difference between the onset temperature of peak 2 and the temperature of the peak 2 top was significant and with increased percentage of tallow into butter, this difference increased but the effect of tallow on peak 1’s becoming wider was higher than that on peak 2. The difference between the onset temperature of peak 2 and the temperature of the peak 2 top did not have ability to estimate bovine tallow added in butter. In the results obtained from DSC, two main peaks are seen. At exothermic peaks, with increase of bovine tallow in butter, the onset temperature of peak 1 increased and butter sample was crystallized at a higher temperature and faster than pure butter was. With increase of bovine tallow in butter, the exothermic peak 2 was crystallized at a lower temperature than pure butter was in a way that distance between peaks1 and 2 increased. In other researches, the isothermal behavior of pure butter and its mixture with palm oil in various concentrations have also been investigated, where shape of curve as well as the position of the crystallization peaks have changed with increase of palm oil content and temperature of peak 1 and distance between peaks 1 and 2 increased (Tomaszewska-Gras, 2016). In the study of olein and stearin palm oil fatty acids, it was found that the presence of higher saturated fatty acids in the sample is accompanied by a wider exothermic peak due to the widespread distribution of triacylglycerol, resulting in higher content of crystallized fat with a higher melting point (Zhang et al., 2013). With increase of bovine tallow in butter, the enthalpy changes of the exothermic peak 2 have increased. As shown in other studies, it has been observed that components with a higher melting point display faster crystallization (Che Man et al., 1999). Other researchers detected the adulteration of caprine body fat at 5% level in bovine milk fat (ghee) using a DSC technique that the midrange temperature of isothermal curves was significantly different that displaced the crystallization region and indicated the presence of foreign fats (Upadhyay et al., 2017).
According to the quartic statistical model obtained for different parts of the crystallization curve, the effect of different percentages of bovine tallow on the onset temperature of peak 1 and 2, the temperature of peak 2 top and enthalpy changes of peak 2 in the butter samples was also obtained and the results have been shown in Table 3.
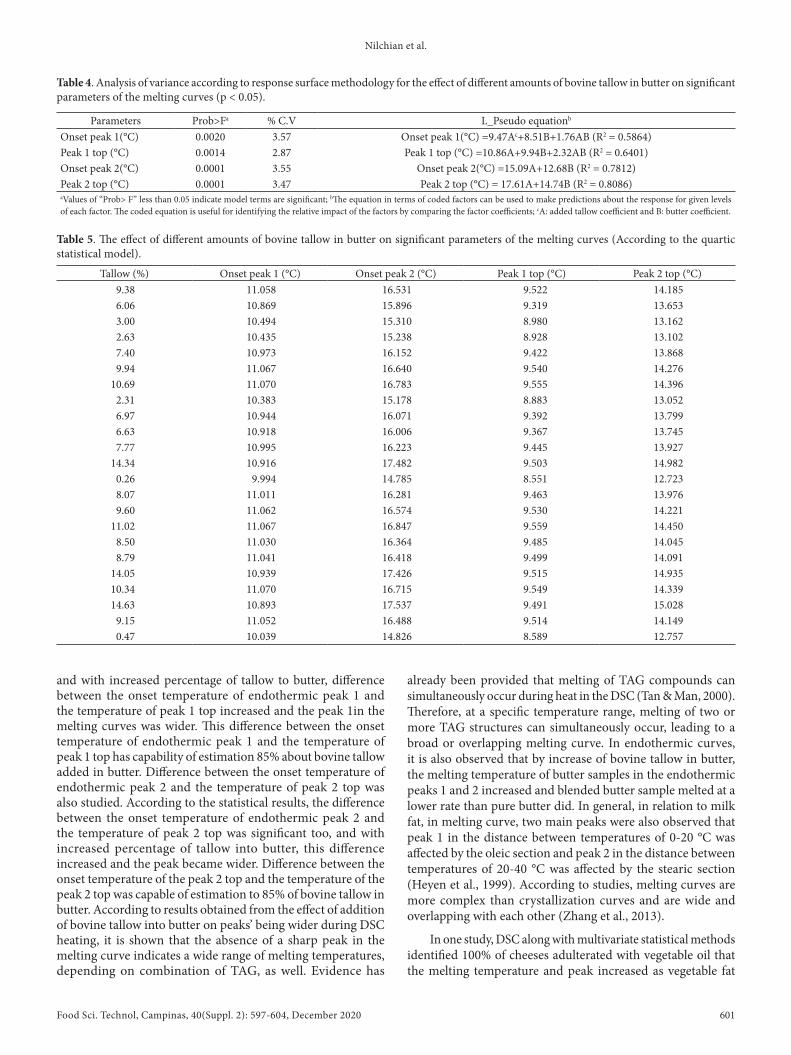
The isothermal behavior of butter melting in combination with different percentages of bovine tallow was shown in Figure 1.
According to statistical method, it has been shown that addition of tallow fat has a significant difference at 95% level in the onset temperature of peak 1 and 2 and in the temperature of peak 1 and 2 top in the melting curves. According to statistical result for each factor in the melting curves, the L_Pseudo equation is obtained (Table 4), showing that both fat types of tallow and butter have a positive effect on the melting curve factors. In relation to the onset temperature of peak 1 and 2, and the temperature of peak 1 and 2 top, it has been shown that added tallow fat has a greater effect on increase in the amount of these temperatures than butter does. Regarding the value of R2, the onset temperature of peak 2 and the temperature of peak 2 top in the melting curve have capability of estimation 78 and 80% about bovine tallow added to butter, respectively. In general, temperature of the melting curve peaks in the study of vegetable oils has shown a complex behavior (Tan & Man, 2000). Multiple endothermic peaks observed in DSC analysis of vegetable oils are due to unique features in distribution of TAG. In general, highly saturated TAGs are melted at higher temperatures compared to the highly unsaturated (Tan & Che Man, 2002).
According to the quardatic and linear statistical model obtained for peak 1 and 2, respectively, in the melting curve, the effect of different percentages of bovine tallow on the onset temperature of peak 1 and 2 and in the temperature of peak 1 and 2 top in the butter samples was also obtained and the results have been shown in Table 5.
According to the results of Figure 1, the difference between the onset temperature of peak 1 and the temperature of peak 1 top in the melting curves were also conducted (results not shown). According to the statistical results, this difference was significant
Table 1. Isothermal behavior of butter fat crystallization in combination with different percentages of bovine tallow.
Tallow (%) 0 1.18 2.63 4.4 6.06 7.5 9.94 12.38 13.69 15Onset peak1(°C) 18.12 15.27 18.18 15.46 14.95 16.76 18.35 18.40 17.15 21.62Onset peak2 (°C) 12.04 12.00 11.79 11.71 11.02 11.38 11.67 11.99 11.69 11.76Peak 2 top (°C) 5.67 4.34 3.15 5.00 3.48 4.10 4.80 5.32 5.02 4.63Enthalpy2 (J/g) 29.94 37.27 27.09 29.52 24.60 11.61 42.12 49.97 34.33 38.16
Table 2. Analysis of variance according to response surface methodology for effect of different amounts of bovine tallow in butter on significant parameters of crystallization (p < 0.05).
Parameters Prob>Fa %C.V L_Pseudo equationb
Onset peak 1(°C) 0.0003 6.69 Onset peak 1(°C) = 20.98Ac+18.02B-12.58AB (R2=0.6502)Onset peak 2 (°C) 0.0003 1.18 Onset peak 2 (°C) = 11.70A+12.03B-2.15AB+1.72AB(A-B)+4.96AB(A-B)2 (R2=0.7499)Peak 2 top (°C) 0.0009 10.63 Peak 2 top (°C) = 4.58A+5.53B-3.62AB+11.41AB(A-B) (R2=0.6410)Enthalpy 2 (J/g) 0.0038 21.01 Enthalpy 2(J/g) = -36.47A- 0.30B+53.38AB-66.26AB(A-B)-210.34AB(A-B)2 (R2=0.6007)aValues of “Prob> F” less than 0.05 indicate model terms are significant; bThe equation in terms of coded factors can be used to make predictions about the response for given levels of each factor. The coded equation is useful for identifying the relative impact of the factors by comparing the factor coefficients; cA: added tallow coefficient and B: butter coefficient.
Food Sci. Technol, Campinas, 40(Suppl. 2): 597-604, December 2020600 600/604
Thermal behavior of butter combined with bovine tallow
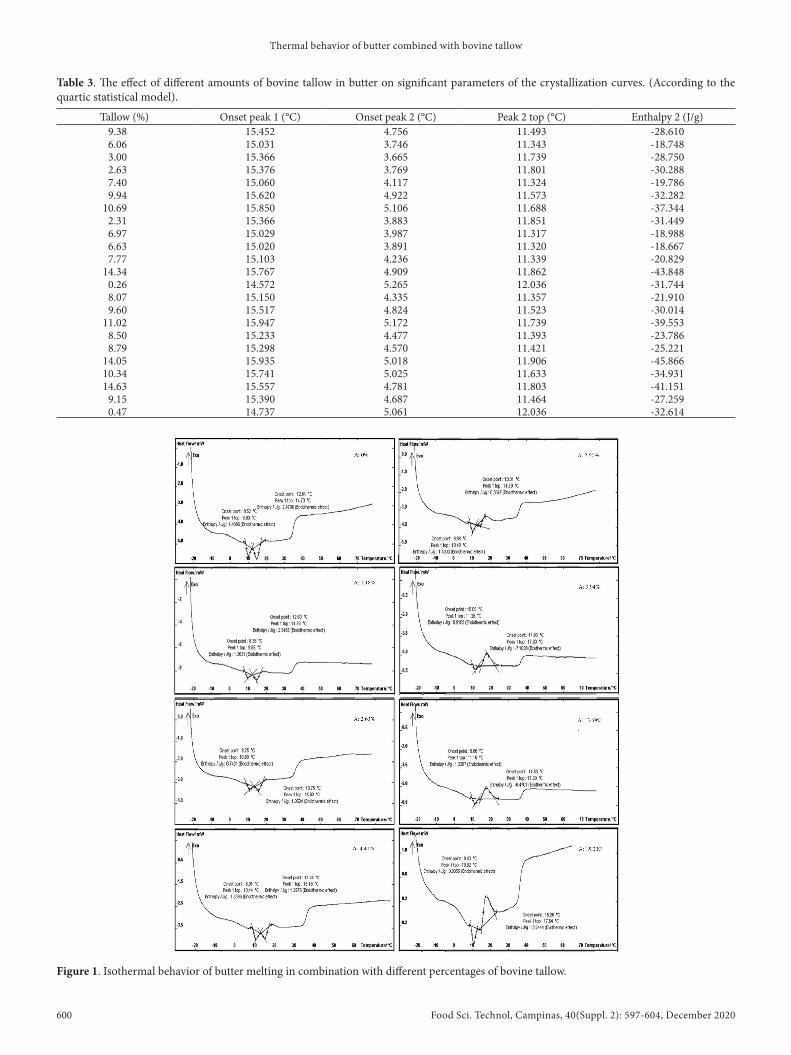
Table 3. The effect of different amounts of bovine tallow in butter on significant parameters of the crystallization curves. (According to the quartic statistical model).
Tallow (%) Onset peak 1 (°C) Onset peak 2 (°C) Peak 2 top (°C) Enthalpy 2 (J/g)9.38 15.452 4.756 11.493 -28.6106.06 15.031 3.746 11.343 -18.7483.00 15.366 3.665 11.739 -28.7502.63 15.376 3.769 11.801 -30.2887.40 15.060 4.117 11.324 -19.7869.94 15.620 4.922 11.573 -32.282
10.69 15.850 5.106 11.688 -37.3442.31 15.366 3.883 11.851 -31.4496.97 15.029 3.987 11.317 -18.9886.63 15.020 3.891 11.320 -18.6677.77 15.103 4.236 11.339 -20.829
14.34 15.767 4.909 11.862 -43.8480.26 14.572 5.265 12.036 -31.7448.07 15.150 4.335 11.357 -21.9109.60 15.517 4.824 11.523 -30.014
11.02 15.947 5.172 11.739 -39.5538.50 15.233 4.477 11.393 -23.7868.79 15.298 4.570 11.421 -25.221
14.05 15.935 5.018 11.906 -45.86610.34 15.741 5.025 11.633 -34.93114.63 15.557 4.781 11.803 -41.151
9.15 15.390 4.687 11.464 -27.2590.47 14.737 5.061 12.036 -32.614
Figure 1. Isothermal behavior of butter melting in combination with different percentages of bovine tallow.
Nilchian et al.
Food Sci. Technol, Campinas, 40(Suppl. 2): 597-604, December 2020 601/604 601
and with increased percentage of tallow to butter, difference between the onset temperature of endothermic peak 1 and the temperature of peak 1 top increased and the peak 1in the melting curves was wider. This difference between the onset temperature of endothermic peak 1 and the temperature of peak 1 top has capability of estimation 85% about bovine tallow added in butter. Difference between the onset temperature of endothermic peak 2 and the temperature of peak 2 top was also studied. According to the statistical results, the difference between the onset temperature of endothermic peak 2 and the temperature of peak 2 top was significant too, and with increased percentage of tallow into butter, this difference increased and the peak became wider. Difference between the onset temperature of the peak 2 top and the temperature of the peak 2 top was capable of estimation to 85% of bovine tallow in butter. According to results obtained from the effect of addition of bovine tallow into butter on peaks’ being wider during DSC heating, it is shown that the absence of a sharp peak in the melting curve indicates a wide range of melting temperatures, depending on combination of TAG, as well. Evidence has
already been provided that melting of TAG compounds can simultaneously occur during heat in the DSC (Tan & Man, 2000). Therefore, at a specific temperature range, melting of two or more TAG structures can simultaneously occur, leading to a broad or overlapping melting curve. In endothermic curves, it is also observed that by increase of bovine tallow in butter, the melting temperature of butter samples in the endothermic peaks 1 and 2 increased and blended butter sample melted at a lower rate than pure butter did. In general, in relation to milk fat, in melting curve, two main peaks were also observed that peak 1 in the distance between temperatures of 0-20 °C was affected by the oleic section and peak 2 in the distance between temperatures of 20-40 °C was affected by the stearic section (Heyen et al., 1999). According to studies, melting curves are more complex than crystallization curves and are wide and overlapping with each other (Zhang et al., 2013).
In one study, DSC along with multivariate statistical methods identified 100% of cheeses adulterated with vegetable oil that the melting temperature and peak increased as vegetable fat
Table 4. Analysis of variance according to response surface methodology for the effect of different amounts of bovine tallow in butter on significant parameters of the melting curves (p < 0.05).
Parameters Prob>Fa % C.V L_Pseudo equationb
Onset peak 1(°C) 0.0020 3.57 Onset peak 1(°C) =9.47Ac+8.51B+1.76AB (R2 = 0.5864)Peak 1 top (°C) 0.0014 2.87 Peak 1 top (°C) =10.86A+9.94B+2.32AB (R2 = 0.6401)Onset peak 2(°C) 0.0001 3.55 Onset peak 2(°C) =15.09A+12.68B (R2 = 0.7812)Peak 2 top (°C) 0.0001 3.47 Peak 2 top (°C) = 17.61A+14.74B (R2 = 0.8086)aValues of “Prob> F” less than 0.05 indicate model terms are significant; bThe equation in terms of coded factors can be used to make predictions about the response for given levels of each factor. The coded equation is useful for identifying the relative impact of the factors by comparing the factor coefficients; cA: added tallow coefficient and B: butter coefficient.
Table 5. The effect of different amounts of bovine tallow in butter on significant parameters of the melting curves (According to the quartic statistical model).
Tallow (%) Onset peak 1 (°C) Onset peak 2 (°C) Peak 1 top (°C) Peak 2 top (°C)9.38 11.058 16.531 9.522 14.1856.06 10.869 15.896 9.319 13.6533.00 10.494 15.310 8.980 13.1622.63 10.435 15.238 8.928 13.1027.40 10.973 16.152 9.422 13.8689.94 11.067 16.640 9.540 14.276
10.69 11.070 16.783 9.555 14.3962.31 10.383 15.178 8.883 13.0526.97 10.944 16.071 9.392 13.7996.63 10.918 16.006 9.367 13.7457.77 10.995 16.223 9.445 13.927
14.34 10.916 17.482 9.503 14.9820.26 9.994 14.785 8.551 12.7238.07 11.011 16.281 9.463 13.9769.60 11.062 16.574 9.530 14.221
11.02 11.067 16.847 9.559 14.4508.50 11.030 16.364 9.485 14.0458.79 11.041 16.418 9.499 14.091
14.05 10.939 17.426 9.515 14.93510.34 11.070 16.715 9.549 14.33914.63 10.893 17.537 9.491 15.028
9.15 11.052 16.488 9.514 14.1490.47 10.039 14.826 8.589 12.757

Food Sci. Technol, Campinas, 40(Suppl. 2): 597-604, December 2020602 602/604
Thermal behavior of butter combined with bovine tallow
increased (Lara et al., 2017). The effects of spread between peaks are due to the large distribution of TAG (Liu et al., 2010). The melt profiles represent the amount of crystalline fat and the occurrence of the transfer of polymorphs (Fredrick et al., 2008). The first thermal thermogram peak is related to the melting of the shape of α, while the last peak is related to the melting of the β shape, and the middle peak indicates the melting of the shape of β’ (Garti et al., 1989). Busfield & Proschogo also analyzed α, β and β’ structures from the thermal thermograms of palm stearin (Busfield & Proschogo, 1990).
The crystalline structure of pure butter and blended butter with 7.5 and 15% bovine tallow was obtained in isothermal conditions using a polarized optical microscope
at 20, 10 and -20 °C (Figure 2). As shown in Figure 2, at -20 °C, the crystalline particles in the pure butter sample are sharper and have more needles than the blended butter with 7.5 and 15% bovine tallow. At 10 °C, with increase of bovine tallow up to 15%, the crystalline particles indicate a denser net than pure butter does, which indicates strong interactions between crystals (Zhang et al., 2013). When the temperature reaches 20 °C, the pure butter sample forms clear needle crystals, while the butter sample in combination with the bovine tallow shows smaller crystals. At temperatures of 20 °C, there are independent and larger crystals compared to the other two temperatures. As the temperature rises, the crystal net structure is gradually loosened and the crystal net becomes more transparent.
Figure 2. The crystalline structure of samples by polarized optical microscope (200×) at 20, 10 and -20 °C.

Nilchian et al.
Food Sci. Technol, Campinas, 40(Suppl. 2): 597-604, December 2020 603/604 603
palm oil. Crystal Growth & Design, 8(8), 1833-1839. http://dx.doi.org/10.1021/cg070025a.
Garti, N., Aronhime, J., & Sarig, S. (1989). The role of chain length and an emulsifier on the polymorphism of mixtures of triglycerides. Journal of the American Oil Chemists’ Society, 66(8), 1085-1089. http://dx.doi.org/10.1007/BF02670089.
Glaeser, H. (2002). Determination of the milk fat content of fat mixtures. Grasas y Aceites, 53(3), 357-358. http://dx.doi.org/10.3989/gya.2002.v53.i3.329.
Heyen, G., Alleman, X., Kalitventzeff, B., & Dalemans, D. (1999). Modelling the butterfat crystallisation process. Computers & Chemical Engineering, 23, 819-822. http://dx.doi.org/10.1016/S0098-1354(99)80201-4.
Jahurul, M. H. A., Ping, L. L., Sharifudin, M. S., Hasmadi, M., Mansoor, A. H., Lee, J. S., Noorakmar, B. W., Amir, H. M. S., Jinap, S., Mohd Omar, A. K., & Zaidul, I. S. M. (2019). Thermal properties, triglycerides and crystal morphology of bambangan (Mangifera pajang) kernel fat and palm stearin blends as cocoa butter alternatives. Lebensmittel-Wissenschaft + Technologie, 107, 64-71. http://dx.doi.org/10.1016/j.lwt.2019.02.053.
Lambelet, P., & Ganguli, N. C. (1983). Detection of pig and buffalo body fat in cow and buffalo ghees by differential scanning calorimetry. Journal of the American Oil Chemists’ Society, 60(5), 1005-1008. http://dx.doi.org/10.1007/BF02660216.
Lara, E., Paz, M., Sanches, C., Miranda, J., Rivera, E., Santos, B., & Barrientos, J. (2017). Differential scanning calorimetry coupled with chemometric tools for determining adulteration with vegetable fat in fresh cheeses. Food Science and Technology (Campinas), (85), 269-274.
Liu, Y., Meng, Z., Shan, L., Jin, Q., & Wang, X. (2010). Preparation of specialty fats from beef tallow and canola oil by chemical interesterification: Physico-chemical properties and bread applications of the products. European Food Research and Technology, 230(3), 457-466. http://dx.doi.org/10.1007/s00217-009-1188-8.
Molkentin, J., & Precht, D. (1987). Representative determination of the butyric acid content in European milk fats. Milchwissenschaft. Milk Science International, (52), 82-85.
Nilchian, Z., Ehsani, M. R., Piravi-Vanak, Z., & Bakhoda, H. (2020). Determination of bovine tallow in butter using a comprehensive method. Grasas y Aceites, 71(1), 338. http://dx.doi.org/10.3989/gya.1051182.
Nogala-Kałucka, M., Pikul, J., & Siger, A. (2008). Applying liquid chromatography (HPLC) to study the genuineness of butter. Zywnosc: Nauka Technologia, Jakosc, 15(3), 47-56.
Ntakatsane, M. P., Liu, X. M., & Zhou, P. (2013). Short communication: Rapid detection of milk fat adulteration with vegetable oil by fluorescence spectroscopy. Journal of Dairy Science, 96(4), 2130-2136. http://dx.doi.org/10.3168/jds.2012-6417. PMid:23415535.
O’Brien, R. D. (1998). Fats and oils analysis. In R. D. O’Brien. Fats and oils: formulating and processing for applications (pp. 181-250). Lancester: Technomic.
Tan, C. P., & Che Man, Y. B. (2002). Comparative differential scanning calorimetric analysis of vegetable oils: I. Effects of heating rate variation. Phytochemical Analysis, 13(3), 129-141. http://dx.doi.org/10.1002/pca.633. PMid:12099103.
Tan, C. P., & Man, Y. B. C. (2000). Differential scanning calorimetric analysis of edible oils: comparison of thermal properties and chemical composition. Journal of the American Oil Chemists’ Society, 77(2), 143-155. http://dx.doi.org/10.1007/s11746-000-0024-6.
Tomaszewska-Gras, J. (2013). Melting and crystallization DSC profiles of milk fat depending on selected factors. Journal of Thermal Analysis
4 ConclusionThe results of this study showed that the peaks resulting
from the isothermal behavior of the samples are mainly related to the distribution of TAG and because of the polymorphism changes. The difference for fatty acids in the butter and bovine tallow samples has led to a different isothermal behavior in treatments. The morphology of crystals has also varied in different treatments and temperatures. In general, the study of the melting curve and the crystallization behavior of pure butter has made it possible to distinguish it from butter blended with bovine tallow. Therefore, the study of DSC parameters such as temperature and peaks enthalpy can be an effective method to describe butter in combination with animal fat, and can be used simply and quickly before TAG analysis.
ReferencesAkoh, C. C. (1998). Lipid-based synthetic fat substitutes. In C. C. Akoh
& D. B. Min (Eds.), Food lipids chemistry, nutrition, and biotechnology (pp. 559-588). New York: Routledge Taylor & Francis Group.
Aktas, N., & Kaya, M. (2001). Detection of beef body fat and margarine in butterfat by differential scanning calorimetry. Journal of Thermal Analysis and Calorimetry, 66(3), 795-801. http://dx.doi.org/10.1023/A:1013196106365.
American Oil Chemists’ Society – AOCS. (2000). DSC melting properties of fats and oils. Cj 1-94. Illinois: AOCS.
Anklam, E., & Lipp, M. (1997). Determination of the milk fat content in food: problems related to the Official EU-method based on butyric acid. Italy: ISPRA.
Breitschuh, B., & Windhab, E. J. (1996). Direct measurement of thermal fat crystal properties for milk-fat fractionation. Journal of the American Oil Chemists’ Society, 73(11), 1603-1610. http://dx.doi.org/10.1007/BF02523532.
Busfield, W. K., & Proschogo, P. N. (1990). Thermal analysis of palm stearine by DSC. Journal of the American Oil Chemists’ Society, 67(3), 171-175. http://dx.doi.org/10.1007/BF02539620.
Cebula, D. J., & Smith, K. W. (1992). Differential scanning calorimetry of confectionery fats. Part II-effects of blends and minor components. Journal of the American Oil Chemists’ Society, 69(10), 992-998. http://dx.doi.org/10.1007/BF02541064.
Che Man, Y. B., Haryati, T., Ghazali, H. M., & Asbi, B. A. (1999). Composition and thermal profile of crude palm oil and its products. Journal of the American Oil Chemists’ Society, 76(2), 237-242. http://dx.doi.org/10.1007/s11746-999-0224-y.
Deelstra, H., Burns, D. T., & Walker, M. J. (2014). The adulteration of food, lessons from the past, with reference to butter, margarine and fraud. European Food Research and Technology, 239(5), 725-744. http://dx.doi.org/10.1007/s00217-014-2274-0.
Derewiaka, D., Sosinska, E., Obiedzinski, M., Krogulec, A., & Czaplicki, S. (2011). Determination of the adulteration of butter. European Journal of Lipid Science and Technology, 113(8), 1005-1011. http://dx.doi.org/10.1002/ejlt.201100006.
Farah, J. S., Silva, M. C., Cruz, A. G., & Calado, V. (2018). Differential calorimetry scanning: current background and application in authenticity of dairy products. Current Opinion in Food Science, (22), 88-94. http://dx.doi.org/10.1016/j.cofs.2018.02.006.
Fredrick, E., Foubert, I., Van De Sype, J., & Dewettinck, K. (2008). Influence of monoglycerides on the crystallization behavior of
Food Sci. Technol, Campinas, 40(Suppl. 2): 597-604, December 2020604 604/604
Thermal behavior of butter combined with bovine tallow
and Calorimetry, 113(1), 199-208. http://dx.doi.org/10.1007/s10973-013-3087-2.
Tomaszewska-Gras, J. (2016). DSC coupled with PCA as a tool for butter authenticity assessment. Journal of Thermal Analysis and Calorimetry, 126(1), 61-68. http://dx.doi.org/10.1007/s10973-016-5346-5.
Tsimidou, M., Macrae, R., & Wilson, I. (1987). Authentication of virgin olive oils using principal component analysis of triglyceride and fatty acid profiles: Part1-classification of greek olive oils. Food Chemistry, 25(42), 227-239. http://dx.doi.org/10.1016/0308-8146(87)90148-8.
Upadhyay, N., Goyal, A., Kumar, A., & Lal, D. (2017). Detection of adulteration by caprine body fat and mixtures of caprine body fat and groundnut oil in bovine and buffalo ghee using differential scanning calorimetry. International Journal of Dairy Technology, 70(2), 297-303. http://dx.doi.org/10.1111/1471-0307.12336.
Zhang, X., Li, L., Xie, H., Liang, Z., Su, J., Liu, G., & Li, B. (2013). Comparative analysis of thermal behavior, isothermal crystallization kinetics and polymorphism of palm oil fractions. Molecules (Basel, Switzerland), 18(1), 1036-1052. http://dx.doi.org/10.3390/molecules18011036. PMid:23322068.