comparative analysis apo(a)gene, apo(a) glycoprotein ... · lp(a)antibodyandthedetection...
TRANSCRIPT

Comparative Analysis of the Apo(a) Gene, Apo(a) Glycoprotein,and Plasma Concentrations of Lp(a) in Three Ethnic GroupsEvidence For No Common"Null" Allele at the Apo(a) Locus
Allan Gaw,* Eric Boerwinkle,t Jonathan C. Cohen, and Helen H. Hobbs**Departments of Molecular Genetics and Internal Medicine and lCenterfor HumanNutrition, University of Texas Southwestern MedicalCenter, Dallas, Texas 75235; and *Center for Demographic and Population Genetics, University of Texas Health Science Center,Houston, Texas 77225
Abstract
Distributions of plasma lipoprotein(a) (LplaI) concentrationsexhibit marked interracial differences. Apolipoprotein(a)(apolal), the unique constituent of Lp(a), is highly polymor-phic in length due to allelic variations in the number of kringle4(K-4)-encoding sequences. Plasma Lp(a) concentrations areinversely related to the number of K-4 repeats in the apo(a)alleles. To determine the contribution of this length variation tothe interracial variation in plasma Lp(a) levels, we comparedapo(a) allele size, glycoprotein size, and plasma Lp(a) concen-trations in Caucasians, Chinese, and African Americans. Cau-casians and African Americans had very different distributionsof plasma Lp(a) concentrations yet there was no significantdifference in the overall frequency distributions of their apo(a)alleles. Over the entire size spectrum of apo(a) alleles, theplasma Lp(a) levels were higher in African Americans than inCaucasians. Conversely, Caucasians and Chinese had similarplasma Lp(a) concentrations but significantly different apo(a)allele size distributions. Therefore, interracial differences inthe plasma concentrations of Lp(a) are not due to differences inthe frequency distributions of apo(a) alleles.
Wealso examined the relationship between apo(a) allelesize and the presence of detectable plasma apo(a) protein inplasma. Apo(a) alleles associated with no detectable plasmaprotein were not of uniformly large size, as had been expected,but were distributed over the entire size spectrum. From thisanalysis, we conclude that there is no common "null" allele atthe apo(a) locus. (J. Clin. Invest. 1994. 93:2526-2534.) Keywords: apolipoprotein(a) - lipoprotein(a) * polymorphismCaucasian * Chinese * African American
Introduction
Lipoprotein(a) (Lp[a] ), a cholesterol ester-rich lipoprotein,is a derivative of low density lipoprotein (LDL), with distinct
Address correspondence to Helen H. Hobbs, Department of MolecularGenetics, University of Texas Southwestern Medical Center, 5323Harry Hines Blvd., Dallas, TX 75235-9046.
Receivedfor publication 1 November 1993 and in revisedform 17February 1994.
1. Lp(a), lipoprotein(a); apo(a), apolipoprotein(a); LDL, low-den-sity lipoprotein; HDL, high-density lipoprotein; TG, triglyceride; K-4,kringle-4; kb; kilobases; EDTA, ethylenediamine tetraacetic acid;ELISA, enzyme-linked immunosorbent sandwich assay; SDS, sodiumdodecyl sulfate.
structural, epidemiological, and genetic properties (1, 2).Lp(a) contains a particle of LDL to which is attached a large,hydrophilic glycoprotein, apolipoprotein(a) (apo[a]). Plasmalevels of Lp(a) vary over a 1000-fold range among individualsin a population but remain remarkably constant within an indi-vidual over time (3). In both Caucasian and Oriental popula-tions, elevated plasma levels of Lp(a) confer a 1.5-3-fold in-crease in the risk of coronary atherosclerosis (4-7). Because ofthe association between high plasma Lp (a) concentrations andcoronary artery disease, the factors controlling plasma Lp(a)concentrations have been extensively studied over the last fiveyears.
Soon after the discovery of Lp(a), family studies suggestedthat its plasma levels were highly heritable (8). The apo(a)gene was implicated as a major determinant of plasma Lp(a)levels when it was noted that the apo(a) glycoprotein varied insize over a wide range and that its size tended to be inverselyrelated to plasma concentrations of Lp(a) ( 1, 9). The molecu-lar mechanism responsible for this size variation is length poly-morphism in the apo(a) gene ( 10). The apo(a) gene containsseveral tandem repeats of a 5.5-kb sequence encoding a cys-teine-rich protein motif resembling the kringle 4 (K-4) of plas-minogen ( 1). The number of K-4 domain repeats in differentapo(a) alleles varies from 12 to 51 (12). Approximately 94%ofCaucasians have two apo (a) alleles that contain different num-bers of K-4 repeats (10). This highly informative length poly-morphism has been used in family studies to examine the rela-tionship between apo(a) genotype and plasma concentrationsof Lp(a). It has been estimated that in Caucasians, 90% ofthe inter-individual variation in plasma Lp(a) levels is ex-plained by sequence differences at, or closely linked to, theapo(a) locus ( 13). To date, this finding has not been extendedto other racial groups, which is important since the distribu-tions of plasma Lp(a) levels exhibit marked interracial vari-ability.
In Caucasians and Chinese, the distribution of plasmaLp(a) is highly skewed towards lower levels (2, 4, 14-16). How-ever, in Africans and African Americans, the distribution curveof plasma Lp(a) levels has a more Gaussian shape ( 1, 14-20)and on average, African Americans have 2-3-fold higherplasma concentrations of Lp(a) than either Caucasians or Chi-nese. The factors responsible for the racial differences in distri-bution of Lp(a) levels have not been identified, but previousstudies have suggested that differences in apo(a) isoform sizedistributions are not solely responsible ( 14-16, 18). The use ofapo(a) isoforms in such studies is problematic, however, be-cause standard immunoblotting methods cannot detect pro-tein products from all apo(a) alleles. In fact, in only one out ofeleven ethnic groups in which apo(a) allele frequencies havebeen calculated were the alleles in Hardy-Weinberg equilib-rium(16, 18).
2526 Gawet al.
J. Clin. Invest.© The American Society for Clinical Investigation, Inc.0021-9738/94/06/2526/09 $2.00Volume 93, June 1994, 2526-2534

In this study, we used high resolution apo(a) genotypingand phenotyping systems ( 12) to evaluate the relationship be-tween apo(a) gene structure, apo(a) glycoprotein size, andplasma concentrations of Lp( a) in three racial groups: Cauca-sians, Chinese, and African Americans. This is the first study inwhich apo(a) gene structure, apo(a) glycoprotein size, andplasma Lp(a) levels have been simultaneously analyzed in anypopulation.
Methods
Plasma and lipoprotein analysis. Fasting blood samples were collectedinto Na2 EDTAtubes from a total of 381 unrelated individuals residingwithin 50 miles of Dallas, TX. Plasma was isolated by low speed centrif-ugation and stored at -70 'C. Plasma Lp(a) concentrations were mea-sured within 2 moof collection at GeneScreen (Dallas, TX) using anenzyme-linked immunosorbent sandwich assay (ELISA) (21). Thecapture antibody used in the assay was a polyclonal rabbit anti-humanLp(a) antibody and the detection antibody was a mouse monoclonalanti-human apo(a) antibody, IgG-IA2, provided by Dr. Gerd Uter-mann (University of Innsbruck, Innsbruck, Austria). Total cholesteroland triglyceride levels and plasma lipoprotein concentrations were as-sayed on fresh plasma in the laboratory of Dr. Scott Grundy (UT South-western Medical Center, Dallas, TX) according to the protocols of theLipid Research Clinics (22).
Apo (a) isoform determination by immunoblotting. Apo (a) iso-form analysis was performed using a modification of the immunoblot-ting method described by Kamboh et al. (23). A 12.5-;il aliquot ofplasma was mixed with 30 ,l reducing buffer ( 1:2:10 ratio of #-mercap-toethanol, 0.5% [wt/vol] bromophenol blue in 5% [vol/vol] glycerol,5% [wt/vol] SDS) and boiled for 5 min. A 10-,d aliquot was loadedonto a 2%agarose gel ( 15 X 25 cm) in 90 mMTris-HCl, 90 mMboricacid, 2 mMNa2EDTAand 0.1% (wt/vol) SDS. Electrophoresis wasperformed in a horizontal gel apparatus (BRL Life Technologies,Gaithersburg, MD) in 45 mMTris-HCl, 45 mMboric acid, 2 mMNa2EDTAand 0.1% (wt/vol) SDS for 17 h at 120 V at 4°C. Afterelectrophoresis, proteins were transferred to a supported nitrocellulosemembrane (HybondTm-C extra, Amersham, Arlington Heights, IL) byelectroblotting using a Hoefer Transphor Cell (Hoefer Scientific In-struments, San Francisco, CA) at 90 V for 3 h in 10 mMTris-HCl, 40mMglycine and 5% (vol/vol) methanol at 4 'C. The membrane wasincubated in TBS (0.5 MNaCl and 35 mMTris-HCI, pH 7.4), 5%(wt/vol) powdered skimmed milk and 0.2% (vol/vol) Tween 20 for 1h before a 30-min incubation in TBSplus 1%(vol/vol) NP-40 and 400jig/ml mouse monoclonal anti-human apo(a)-specific antibody IgG-IA2 (21), which had been conjugated to horseradish peroxidase (24).IgG- 1A2 is directed against the commonK-4 repeat, i.e., the type A andtype B K-4 repeat, (reference 11 and Dr. Gerd Utermann, personalcommunication). The membrane was washed four times in 100 mlwashing buffer (TBS plus 1% [vol/vol] NP-40, 0.5% [wt/vol] deoxy-cholic acid and 0.1% [wt/vol] filtered SDS) and then developed byusing ECLTMWestern blot detection reagent (Amersham) and sub-jected to autoradiography using X-OMATTmAR film (Eastman Ko-dak Co., Rochester, NY) for 1-10 min.
To determine the sensitivity of the assay, serial dilutions of plasmaswith apo(a) alleles of various size were examined by immunoblotting.All isoforms with plasma Lp(a) concentration of > 0.1 mg/dl weredetected (data not shown). The sensitivity of the immunoblotting de-tection system was the same irrespective of apo(a) isoform size. Inaddition, on a subset of 15 plasma samples, we also performed immuno-blotting using a monoclonal anti-peptide antibody (lOC5) directedagainst an epitope in the protease domain of the apo(a) glycoprotein.Both antibodies gave signals of equal relative intensity and no isoformsthat were undetectable by 1A2 were revealed using lOC5.
Apo(a) genotype determination by pulsed-field gel electrophoresisand genomic blotting Apo(a) alleles were examined using a modifica-tion of the pulse-field gel electrophoresis procedures described byLackner et al. (10). Leukocytes were isolated from whole blood using
LeucoPrep tubes (Becton, Dickinson & Co., Lincoln Park, NJ), em-bedded in agarose plugs, and stored at 4VC in 0.5 MNa2 EDTA, pH8.0. A 3-mm segment of the agarose-cellular plug was washed in 1X TE (1 mMNa2 EDTA, 10 mMTris-HCl, pH 8.0) and incubatedtwice for 2 h each with 100 U KpnI or HpaI (New England Biolabs,Beverly, MA) in 70 ,l of the buffer suggested by the manufacturer ( 10,12). The plugs were subjected to transverse alternating gel electrophore-sis using a GeneLine II.' apparatus (Beckman Instruments, Inc., Ful-lerton, CA). The pulse times were 4 s for 30 min followed by 6-s pulses( 150 V/ 350 mAmps) for 18 h. Low range PFGmarkers (New EnglandBiolabs) were used as size standards. The size-fractionated DNAwasblotted to a nylon membrane (ICN Biomedicals, Irvine, CA) and hy-bridized with an [ a- 32P]dCTP radiolabeled human apo(a) K-4-spe-cific single-stranded fragment ( 10). The filters were washed for 1 h andexposed to Kodak X-OMATTmAR film with an intensifying screen(Lightening Plus Dupont Co., Wilmington, DE) for 16 h at -70'C.The apo(a) alleles were designated by the estimated number of K-4-encoding sequences per allele (apo(a) K-12 to apo(a) K-51) (12).
Statistical methods. The overall shape of the distribution of plasmaLp(a) concentrations was compared between populations using thetwo-sample Kolmogorov-Smirnov test (25). The distributions ofplasma Lp(a), were clearly not normally distributed, therefore, non-parametric rank-sum tests and Kruskal-Wallis tests (25) were used to
compare median Lp(a) levels between racial groups.Because of the large number of apo(a) phenotypes relative to the
numbers of individuals in this sample, traditional chi-square goodness-of-fit test and chi-square tests of independence were inappropriate. Agoodness-of-fit test to Hardy-Weinberg expectations was carried outusing a computerized permutation algorithm described by Guo andThompson (26). Comparisons of apo(a) isoform and phenotype fre-quencies among races were carried out using a Monte Carlo simulationmethod to derive P values for Fisher's exact test (27).
The relationship between the apo(a) polymorphism and plasmaLp(a) concentrations was analyzed in several ways. The contributionof the apo(a) genotypes to the inter-individual variance in plasmaLp(a) concentrations was estimated using the adjusted R2 from ananalysis of variance (28). The Spearman's rank correlation (25) be-tween the sum of the number of K-4 repeats represented in an individ-ual's genotype and their plasma Lp(a) level was calculated. These rankcorrelations were compared between populations using Fisher's z-transformation.
Results
Venous blood was obtained from 174 unrelated AmericanCaucasians (86 men, 88 women), 101 unrelated Chinese (46men, 55 women), and 106 unrelated African-Americans (20men, 86 women). All subjects were selected at random fromhealthy individuals living in the Dallas-Fort Worth area. Theonly selection criteria were that all Caucasians and AfricanAmericans had to be born in the United States and all Chinesehad to be born in Mainland China or Taiwan. Somedata from103 of the 174 Caucasians were included in a prior publication(10). Four Caucasians, 17 Chinese and 12 African Americanswere postmenopausal at the time of sampling. A description ofthe characteristics of the three samples is given in Table I.There was no significant difference in the ages, or plasma levelsof total cholesterol or LDL-cholesterol(C) of the three groups.The African Americans had slightly lower plasma concentra-tions of triglyceride and higher concentrations of high densitylipoprotein HDL(C) than the other two racial groups.
The distribution of plasma Lp(a) concentrations in each ofthe three racial groups is shown in Fig. 1. The characteristics ofthe distributions of plasma Lp(a) levels were compared in thethree populations (Table II). In all populations, the plasmaLp(a) concentrations varied over a wide range. As reportedpreviously, ( 14-16, 18) the plasma levels of Lp(a) were more
Genetic Analysis ofApo(a) Gene and Plasma Lp(a) in Three Ethnic Groups 2527
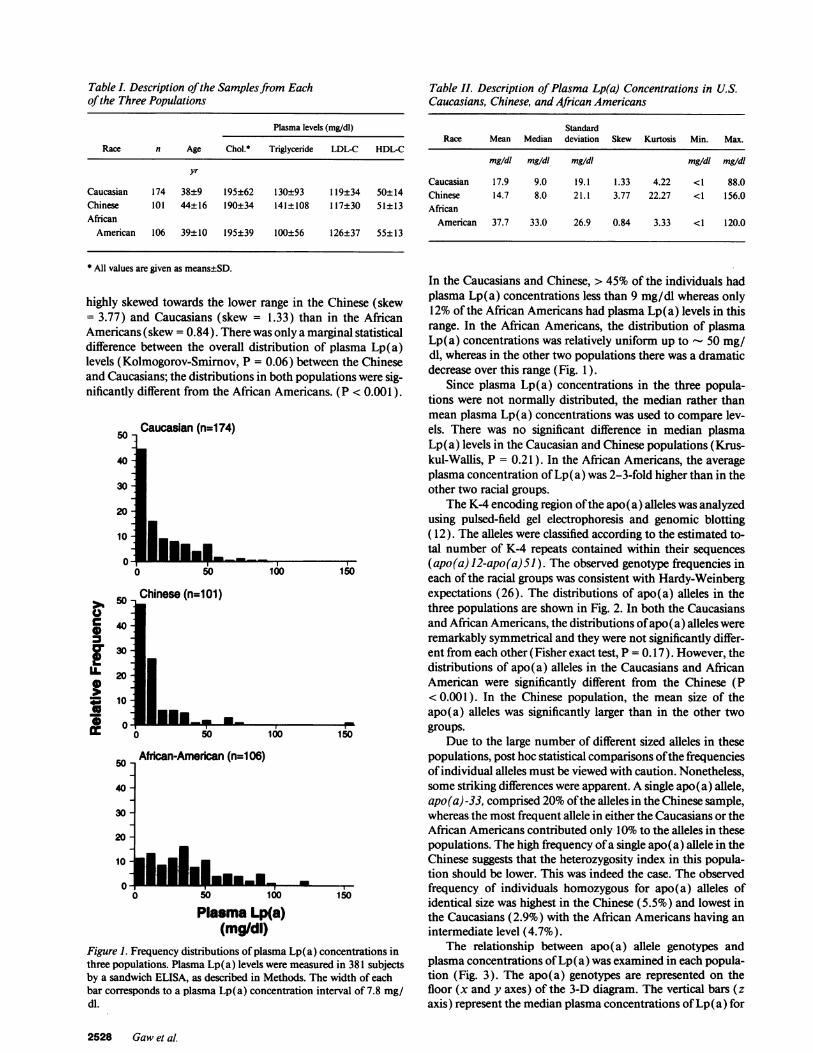
Table I. Description of the Samples from Eachof the Three Populations
Plasma levels (mg/dl)
Race n Age Chol.* Triglyceride LDL-C HDL-C
yr
Caucasian 174 38±9 195±62 130±93 119±34 50±14Chinese 101 44±16 190±34 141±108 117±30 51±13African
American 106 39±10 195±39 100±56 126±37 55±13
* All values are given as means±SD.
highly skewed towards the lower range in the Chinese (skew= 3.77) and Caucasians (skew = 1.33) than in the AfricanAmericans (skew = 0.84). There was only a marginal statisticaldifference between the overall distribution of plasma Lp(a)levels (Kolmogorov-Smimov, P = 0.06) between the Chineseand Caucasians; the distributions in both populations were sig-nificantly different from the African Americans. (P < 0.001 ).
50 Caucasian (n=1 74)
40
30
20
10
0
U1Ca
a
UL
100 150
40-
30 -
20 -
10
50
40
30
20
10
Plasma Lp(a)(mg/dl)
Figure 1. Frequency distributions of plasma Lp(a) concentrations inthree populations. Plasma Lp(a) levels were measured in 381 subjectsby a sandwich ELISA, as described in Methods. The width of eachbar corresponds to a plasma Lp(a) concentration interval of 7.8 mg/dl.
Table II. Description of Plasma Lp(a) Concentrations in U.S.Caucasians, Chinese, and African Americans
StandardRace Mean Median deviation Skew Kurtosis Min. Max.
mg/dl mg/dl mg/dl mg/dl mg/dl
Caucasian 17.9 9.0 19.1 1.33 4.22 <1 88.0Chinese 14.7 8.0 21.1 3.77 22.27 <1 156.0African
American 37.7 33.0 26.9 0.84 3.33 <1 120.0
In the Caucasians and Chinese, > 45% of the individuals hadplasma Lp(a) concentrations less than 9 mg/dl whereas only12% of the African Americans had plasma Lp(a) levels in thisrange. In the African Americans, the distribution of plasmaLp(a) concentrations was relatively uniform up to 50 mg/dl, whereas in the other two populations there was a dramaticdecrease over this range (Fig. 1).
Since plasma Lp(a) concentrations in the three popula-tions were not normally distributed, the median rather thanmean plasma Lp(a) concentrations was used to compare lev-els. There was no significant difference in median plasmaLp(a) levels in the Caucasian and Chinese populations (Krus-kul-Wallis, P = 0.21 ). In the African Americans, the averageplasma concentration of Lp(a) was 2-3-fold higher than in theother two racial groups.
The K-4 encoding region of the apo(a) alleles was analyzedusing pulsed-field gel electrophoresis and genomic blotting( 12). The alleles were classified according to the estimated to-tal number of K-4 repeats contained within their sequences(apo(a) 12-apo(a) 51). The observed genotype frequencies ineach of the racial groups was consistent with Hardy-Weinbergexpectations (26). The distributions of apo(a) alleles in thethree populations are shown in Fig. 2. In both the Caucasiansand African Americans, the distributions of apo(a) alleles wereremarkably symmetrical and they were not significantly differ-ent from each other (Fisher exact test, P = 0.17). However, thedistributions of apo(a) alleles in the Caucasians and AfricanAmerican were significantly different from the Chinese (P< 0.001). In the Chinese population, the mean size of theapo(a) alleles was significantly larger than in the other twogroups.
Due to the large number of different sized alleles in thesepopulations, post hoc statistical comparisons ofthe frequenciesof individual alleles must be viewed with caution. Nonetheless,some striking differences were apparent. A single apo(a) allele,apo(a) -33, comprised 20%of the alleles in the Chinese sample,whereas the most frequent allele in either the Caucasians or theAfrican Americans contributed only 10% to the alleles in thesepopulations. The high frequency of a single apo(a) allele in theChinese suggests that the heterozygosity index in this popula-tion should be lower. This was indeed the case. The observedfrequency of individuals homozygous for apo(a) alleles ofidentical size was highest in the Chinese (5.5%) and lowest inthe Caucasians (2.9%) with the African Americans having anintermediate level (4.7%).
The relationship between apo(a) allele genotypes andplasma concentrations of Lp(a) was examined in each popula-tion (Fig. 3). The apo(a) genotypes are represented on thefloor (x and y axes) of the 3-D diagram. The vertical bars (zaxis) represent the median plasma concentrations of Lp(a) for
2528 Gawet al.
J_vw b

25 -
20 -
15 -
10 -
5-
Caucasian (n=348)
010 15
25 -
20 -
15 -
10 -
5
20 25 30 35 40 45 50
Chinese (n=202)
10 15 2(
25 -
20 -
15 -
10 -
5
25 30 35 40 45 50
African-American (n=212)
l.iEIlI lIlmI10 15 20 25 30 35 40 45 50
Apo(a) Alleles(no. of K-4 Repeats)
Figure 2. Frequency distributions of apo(a) alleles in three popula-tions. Apo(a) allele size (number of K-4 repeats) was estimated usingpulsed-field gel electrophoresis and genomic blotting, as described inthe Methods.
all individuals with a given apo(a) genotype. Although the pat-
terns of apo(a) genotypes differed among the three popula-tions, there was a similar inverse relationship between the sizeof the apo(a) alleles and the plasma concentration of Lp(a), as
indicated by the decrease in the height of the bars from left toright. The Spearman rank correlation values for the relation-ship between the sum of the apo(a) allele sizes (i.e., total num-
ber of K-4 repeats) and the plasma levels of Lp(a) were remark-ably similar in the three populations: -0.49 (Caucasians andAfrican Americans) and -0.53 (Chinese). The Chinese group
had a significantly different "footprint pattern" on the floor ofthe graph from the other two populations, reflecting the differ-ence in apo(a) allele frequencies (noted above). The Cauca-sians and African Americans had more similar "footprint pat-terns", but had distinctly different "skyline patterns," that is,for almost all apo(a) genotypes, the African Americans hadhigher median plasma Lp(a) levels than the Caucasians. Whilenot apparent from this figure, it should be noted that the vari-ance in plasma Lp(a) levels for each genotype was higher in
African Americans (a 2 = 664) than in the Caucasians (a2= 166) or Chinese (a2 = 133).
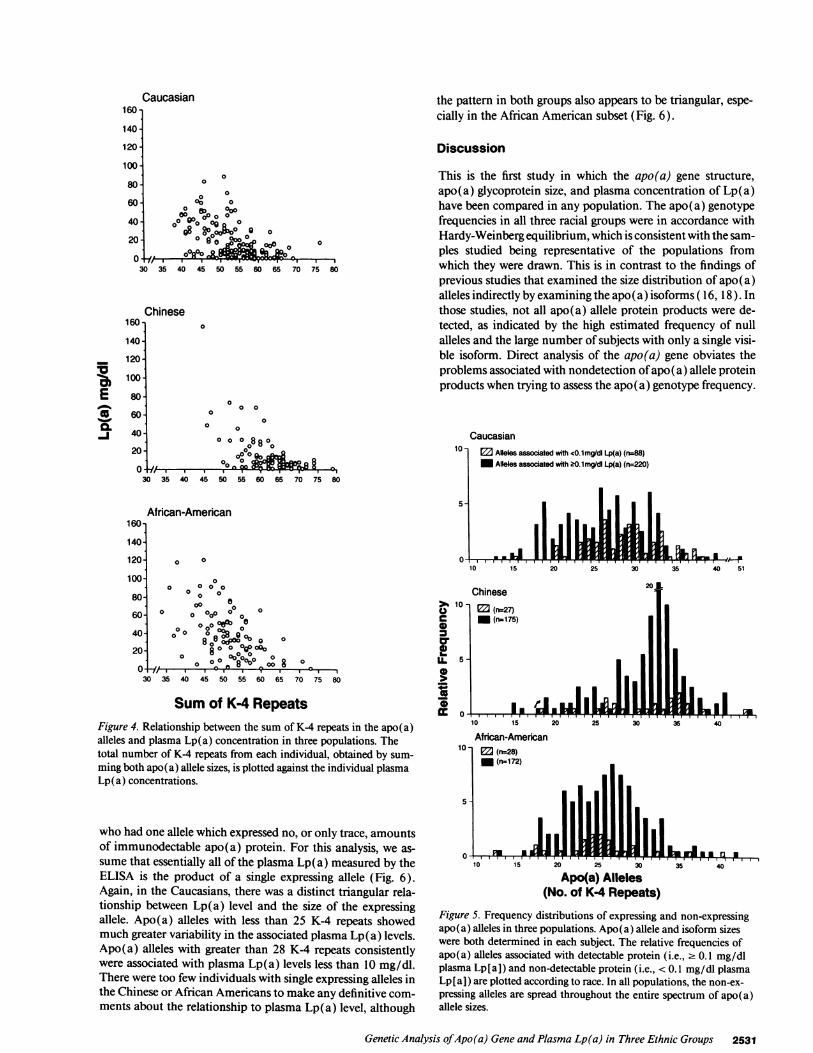
The higher variance in plasma Lp(a) levels in the AfricanAmericans is made more obvious if the total number of K-4repeats is related to the plasma concentrations of Lp(a) (Fig.4). In all three populations distribution of plasma Lp(a) levelsvs. total number of K-4 repeats was triangular in appearance.The relationship between apo(a) allele size and plasma Lp(a)level is not linear over the entire range. The relationship ap-pears to be biphasic; Caucasian and Chinese individuals with' 65 K-4 repeats had uniformly low plasma concentrations ofLp(a) (Fig. 4). The variability in plasma Lp(a) concentrationswas greater among individuals with fewer rather than more K4repeats, and the variability was greatest in the African Ameri-cans. This effect may be explained in part by the fact that thoseindividuals with fewer K-4 repeats comprise more than onegroup of individuals-those with one large and one smallapo(a) allele, or those with two medium sized alleles. In con-trast, almost all the individuals with a larger total number ofK-4 repeats (e.g., > 65) constituted a more uniform group be-cause their K-4 complement could only result from the addi-tion of two large alleles, and not a very small plus a very largeallele because such alleles (< 12 or > 51 K-4 repeats) were notobserved in this study.
Wenext examined the relationship between apo(a) allelesize and the presence of detectable apo(a) glycoprotein inplasma. The apo(a) isoforms were analyzed by immunoblot-ting in the entire Chinese group, in all but six of the AfricanAmericans, and in 155 of the 174 Caucasians. Immunoblottingdata were not obtained in 25 subjects (six African Americansand 19 Caucasians) because blood samples were obtained fromthese individuals before the development of the more sensitiveimmunoblotting technique. The alleles were classified into twogroups based on whether or not there was clearly detectableplasma apo(a) protein present on immunoblotting. Weshowed by the analysis of serial dilutions of plasma samples ofknown Lp(a) concentration that apo(a) alleles associated witha plasma concentration of Lp(a) 2 0.1 mg/dl were invariablydetectable. Only those apo(a) alleles in which no protein prod-uct was identified by immunoblotting (i.e., associated withplasma Lp(a) concentrations < 0.1 mg/dl) are refered to as"null" alleles and are included in Fig. 5. Since future refine-ment of the immunoblotting technique may reveal proteinproducts that are presently undetectable, we have qualified ourdesignation of null alleles by using quotation marks.
The frequency of apo(a) alleles with undetectable proteinproducts was highest in the Caucasians (28.6%), and was simi-lar in the African Americans and Chinese, 14.0% and 13.4%,respectively). The frequency of individuals who had no detect-able apo(a) protein by immunoblotting was 5.7% in the Cau-casians, 2.0% in the Chinese and 2.8% in the African Ameri-cans. In all three populations, the frequency distribution ofalleles associated with trace to no detectable apo(a) protein(i.e., < 0.1 mg/dl Lp[a]) was similar to the frequency distribu-tion of alleles associated with detectable apo(a) protein (i.e.,2 0.1 mg/dl Lp[a] ). Thus, despite the overall relationship be-tween apo(a) allele size and plasma Lp(a) level in all threepopulations, the frequency of low expressing alleles was notskewed towards the larger alleles, as might have been expectedbased on the overall relationship between apof a) allele size andplasma level of Lp(a).
Finally, we examined the relationship between apo(a) al-lele size and plasma level of Lp(a) in the subset of individuals
Genetic Analysis of Apo(a) Gene and Plasma Lp(a) in Three Ethnic Groups 2529
0
0*
LL0
co0)
I-.
-IN- 11 lipD.

A Caucasian (n=1 74)
640
B Chinese (n-I 01)
6e0
CL 0
r
1S
%0
S
a.
13oot#
wX
%WO%M
r Figure 3. Relationship betweenV apo(a) genotype and plasma0 Lp(a) concentration in three" populations. In each 3-D plot,
the number of K-4 repeats ofq the smaller apo(a) allele (Al-_ lele l ) is given on the x-axis.= The number of K-4 repeats in
the larger apo(a) allele (Allele2) is shown on the y-axis. Thevertical bars (z-axis) representthe median plasma Lp(a) con-centration of individuals witheach genotype.
2530 Gawet al
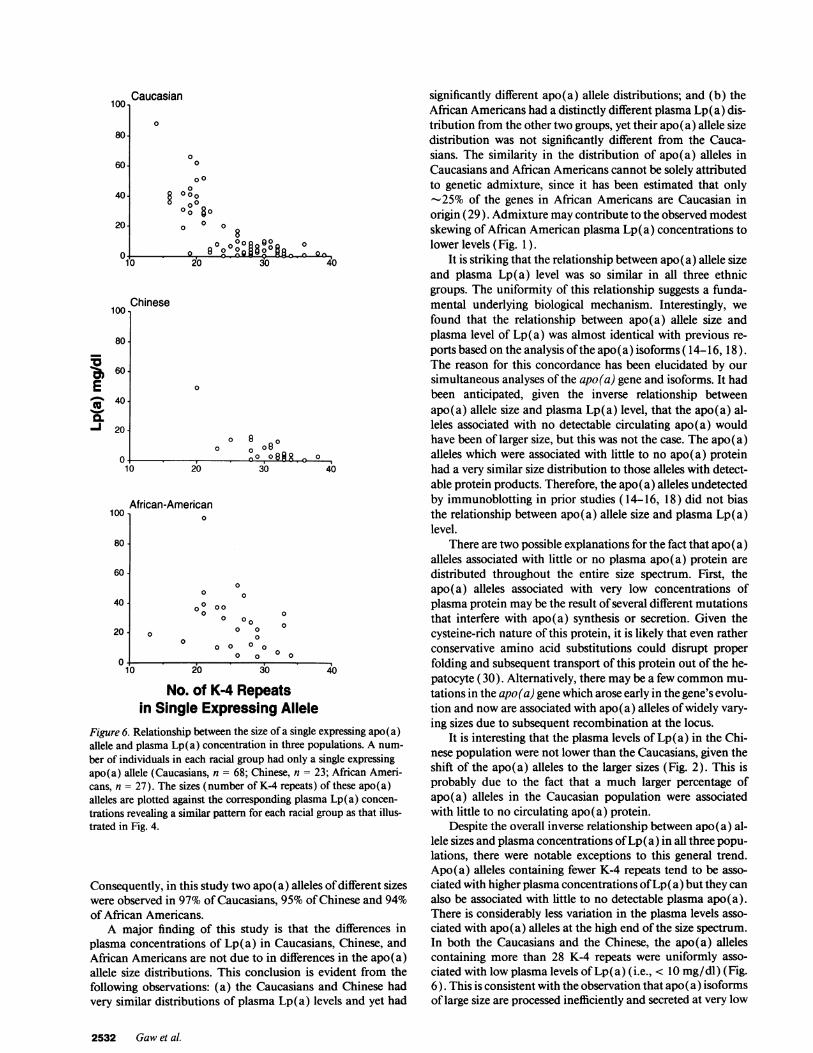
the pattern in both groups also appears to be triangular, espe-cially in the African American subset (Fig. 6).
Discussion
0O0
006
0000 e90 Oa oo
o°o^g8 00oo§:X0 90 0
0 0000 00 0
00R00~0.030 35 4 4 5 5 6 6 7030 35 40 45 50 55~ -60 6,5- 70
This is the first study in which the apo(a) gene structure,apo(a) glycoprotein size, and plasma concentration of Lp(a)have been compared in any population. The apo(a) genotypefrequencies in all three racial groups were in accordance withHardy-Weinberg equilibrium, which is consistent with the sam-ples studied being representative of the populations fromwhich they were drawn. This is in contrast to the findings ofprevious studies that examined the size distribution of apo(a)alleles indirectly by examining the apo(a) isoforms ( 16, 18 ). Inthose studies, not all apo(a) allele protein products were de-tected, as indicated by the high estimated frequency of nullalleles and the large number of subjects with only a single visi-ble isoform. Direct analysis of the apo(a) gene obviates theproblems associated with nondetection of apo(a) allele proteinproducts when trying to assess the apo(a) genotype frequency.
Caucasian
160-
140
120
100
80
60
40
20
.. I I I........... I . . .
30 35 40 45 50 55 60 65 70 75 80
African-American
o00
000 0 000
0
Chinese00 a
0 000 0 0000 o ol Oa
8800 ,0~%° 80 0 0000 o ° °o ° 8 0
30 35 40 45 50 55 60 65 70 75 80
Sumof Ka4 RepeatsFigure 4. Relationship between the sum of K-4 repeats in the apo(a)alleles and plasma Lp(a) concentration in three populations. Thetotal number of K-4 repeats from each individual, obtained by sum-ming both apo(a) allele sizes, is plotted against the individual plasmaLp(a) concentrations.
who had one allele which expressed no, or only trace, amountsof immunodectable apo(a) protein. For this analysis, we as-sume that essentially all of the plasma Lp(a) measured by theELISA is the product of a single expressing allele (Fig. 6).Again, in the Caucasians, there was a distinct triangular rela-tionship between Lp(a) level and the size of the expressingallele. Apo(a) alleles with less than 25 K-4 repeats showedmuch greater variability in the associated plasma Lp(a) levels.Apo(a) alleles with greater than 28 K-4 repeats consistentlywere associated with plasma Lp(a) levels less than 10 mg/dl.There were too few individuals with single expressing alleles inthe Chinese or African Americans to make any definitive com-ments about the relationship to plasma Lp(a) level, although
01100c0
IL
04.
10 15
African-An10- ED (n=28)
M (n=172
5 -
A Po
20 25 30 35 40
nerican
II .J mm n -10 15 20 25 30
Apo(a) Alleles(No. of K4 Repeats)
35440
Figure 5. Frequency distributions of expressing and non-expressingapo(a) alleles in three populations. Apo(a) allele and isoform sizeswere both determined in each subject. The relative frequencies ofapo(a) alleles associated with detectable protein (i.e., 2 0.1 mg/dlplasma Lp[a]) and non-detectable protein (i.e., < 0.1 mg/dl plasmaLp[a]) are plotted according to race. In all populations, the non-ex-pressing alleles are spread throughout the entire spectrum of apo(a)allele sizes.
Genetic Analysis ofApo(a) Gene and Plasma Lp(a) in Three Ethnic Groups 2531
Caucasian
00
160-
140-
120
10o0
80
60
40
20
160
140
120.
100
0
75 80
Chinese
a.aI0 000
0
80-
60 -
40-
20-°0o °08 80o
0
0a 4 11-A an-L
nt
. 'm [A f_
T TTI T%P
I
100 Caucasian
80.
60.
40.
20
0
0
§0 0 80 °°8
0 0 o
o 829o-B Q2'000800R0o
0
40
Chinese100,
E
0.-j
80
60
40
20
80
60
40-
20.
) 20
0 8 o80
0 0
30 40
African-American100 1 0
0
0
0
00 000 0
0 000 0 0
0 00 0 0 0
0 0 0 0
10 20 30 40
No. of K-4 Repeatsin Single Expressing Allele
Figure 6. Relationship between the size of a single expressing apo(a)allele and plasma Lp(a) concentration in three populations. A num-
ber of individuals in each racial group had only a single expressingapo(a) allele (Caucasians, n = 68; Chinese, n = 23; African Ameri-cans, n = 27). The sizes (number of K-4 repeats) of these apo(a)alleles are plotted against the corresponding plasma Lp(a) concen-
trations revealing a similar pattern for each racial group as that illus-trated in Fig. 4.
Consequently, in this study two apo(a) alleles of different sizeswere observed in 97% of Caucasians, 95% of Chinese and 94%of African Americans.
A major finding of this study is that the differences inplasma concentrations of Lp(a) in Caucasians, Chinese, andAfrican Americans are not due to in differences in the apo(a)allele size distributions. This conclusion is evident from thefollowing observations: (a) the Caucasians and Chinese hadvery similar distributions of plasma Lp(a) levels and yet had
significantly different apo(a) allele distributions; and (b) theAfrican Americans had a distinctly different plasma Lp(a) dis-tribution from the other two groups, yet their apo(a) allele sizedistribution was not significantly different from the Cauca-sians. The similarity in the distribution of apo(a) alleles inCaucasians and African Americans cannot be solely attributedto genetic admixture, since it has been estimated that only-25% of the genes in African Americans are Caucasian in
origin (29). Admixture may contribute to the observed modestskewing of African American plasma Lp(a) concentrations tolower levels (Fig. 1).
It is striking that the relationship between apo(a) allele sizeand plasma Lp(a) level was so similar in all three ethnicgroups. The uniformity of this relationship suggests a funda-mental underlying biological mechanism. Interestingly, wefound that the relationship between apo(a) allele size andplasma level of Lp(a) was almost identical with previous re-ports based on the analysis of the apo(a) isoforms ( 14-16, 18).The reason for this concordance has been elucidated by oursimultaneous analyses of the apo(a) gene and isoforms. It hadbeen anticipated, given the inverse relationship betweenapo(a) allele size and plasma Lp(a) level, that the apo(a) al-leles associated with no detectable circulating apo(a) wouldhave been of larger size, but this was not the case. The apo (a)alleles which were associated with little to no apo(a) proteinhad a very similar size distribution to those alleles with detect-able protein products. Therefore, the apo(a) alleles undetectedby immunoblotting in prior studies ( 14-16, 18) did not biasthe relationship between apo(a) allele size and plasma Lp(a)level.
There are two possible explanations for the fact that apo(a)alleles associated with little or no plasma apo(a) protein aredistributed throughout the entire size spectrum. First, theapo(a) alleles associated with very low concentrations ofplasma protein may be the result of several different mutationsthat interfere with apo(a) synthesis or secretion. Given thecysteine-rich nature of this protein, it is likely that even ratherconservative amino acid substitutions could disrupt properfolding and subsequent transport of this protein out of the he-patocyte (30). Alternatively, there may be a few commonmu-tations in the apo(a) gene which arose early in the gene's evolu-tion and now are associated with apo(a) alleles of widely vary-ing sizes due to subsequent recombination at the locus.
It is interesting that the plasma levels of Lp(a) in the Chi-nese population were not lower than the Caucasians, given theshift of the apo(a) alleles to the larger sizes (Fig. 2). This isprobably due to the fact that a much larger percentage ofapo(a) alleles in the Caucasian population were associatedwith little to no circulating apo(a) protein.
Despite the overall inverse relationship between apo(a) al-lele sizes and plasma concentrations of Lp(a) in all three popu-lations, there were notable exceptions to this general trend.Apo(a) alleles containing fewer K-4 repeats tend to be asso-ciated with higher plasma concentrations of Lp(a) but they canalso be associated with little to no detectable plasma apo(a).There is considerably less variation in the plasma levels asso-ciated with apo(a) alleles at the high end of the size spectrum.In both the Caucasians and the Chinese, the apo(a) allelescontaining more than 28 K-4 repeats were uniformly asso-ciated with low plasma levels of Lp(a) (i.e., < 10 mg/dl) (Fig.6). This is consistent with the observation that apo(a) isoformsof large size are processed inefficiently and secreted at very low
2532 Gawet al.
%f i
1
levels in primary cultures of baboon hepatocytes (31 ). How-ever, it must be noted that in the African Americans, some verylarge alleles are associated with significant amounts of plasmaLp(a) protein (> 20 mg/dl). Therefore, there is no intrinsicproperty of large apo(a) isoforms that precludes their synthesisand secretion.
A possible confounding factor in this study is the relativeexcess of womenin the African American sample. In all popula-tions studied to date there has been no significant differencebetween plasma Lp(a) levels in men and women. The oneexception is postmenopausal womenwhere plasma concentra-tions of Lp(a) are increased by an average of 15% (32). Toensure that the higher plasma Lp(a) levels in the African Amer-ican population were not due to a relative excess of women inthe sample, the median plasma Lp(a) levels were compared inthe African American men and womenand were found to benot statistically different (30.5 men vs. 33.5 mg/dl women).Similarly, when the sample was stratified to exclude AfricanAmerican postmenopausal womenand compared with the to-tal female group of African Americans, the median level wasalmost identical (32.5 vs. 33.5). Therefore, we are confidentthat the results of this study are not biased significantly by thedifferences in sex ratios.
In previous studies, the contributions of apo(a) allele sizepolymorphism to inter-individual variations in plasma Lp(a)levels have been calculated. However, these calculations arebased on the ratio between the variance in apo(a) allele sizeand the variance in plasma Lp(a) level. As noted previously,for almost every genotype, the plasma concentrations of Lp(a)vary much more in the African Americans than in either of thetwo other populations. Accordingly, the size polymorphismappears to contribute much less to the inter-individual variabil-ity in plasma concentrations of Lp(a) in the African Ameri-cans due to the greater variance in plasma Lp(a) levels in thispopulation. Therefore, the significance of such calculations isnot clear.
A compelling question that remains unanswered by thisstudy is why African Americans have higher plasma concentra-tions of Lp (a) than Caucasians despite the similar apo (a) alleledistributions. Wecan definitively state that the higher plasmaconcentrations of Lp(a) in African Americans are not due to ahigher frequency of apo(a) alleles with fewer K-4 repeats. Norcan we explain the higher plasma Lp(a) levels in African Ameri-cans by their relatively lower frequency of "null" alleles.Rather, high Lp(a) levels in African Americans appear to bedue to a more general mechanism. For almost every apo(a)genotype, the African Americans had higher median plasmalevels of Lp(a) than did Caucasians or Chinese. To date, little isknown about the genetics of plasma Lp(a) concentrations inAfrican Americans. In Caucasians, the apo(a) gene, or se-quences linked to it, contribute > 90% to the inter-individualvariation in plasma Lp(a) levels (13). The relative contribu-tion of the apo(a) locus to plasma levels of Lp(a) in individ-uals of African descent has not been determined. The fact thatthe relationship between apo(a) allele size and plasma Lp(a)level is similar in the African Americans and the Caucasianssuggests that sequences at the apo(a) locus contribute impor-tantly to plasma levels of Lp(a) in the African American popu-lation. If indeed the apo(a) gene is a major determinant ofplasma Lp(a) levels in African Americans, there appear to beadditional factors, genetic or nongenetic, that modify the effectof the apo(a) allele size in this group.
Acknowledgments
We wish to acknowledge the technical excellence of KathySchueler and TommyHyatt and the assistance of Carla C. Lef-fert, R.N.
A. Gawis the recipient of a British Heart Foundation Inter-national Fellowship, and a Travel Scholarship from the JamesClerk Maxwell Foundation. E. Boerwinkle is the recipient of aResearch Career Development Award and is an EstablishedInvestigator of the American Heart Association. H. H. Hobbsis an Established Investigator of the American Heart Associa-tion. This work was supported by grants from the Perot FamilyFund and National Institutes of Health grants HL-476 19 andHL-20948.
References
1. Scanu, A. M. and G. M. Fless. 1990. Lipoprotein(a): heterogeneity andbiological relevance. J. Clin. Invest. 85:1709-1715.
2. Utermann, G. 1989. The mysteries of lipoprotein(a). Science (Wash. DC).246:904-910.
3. Albers, J. J., S. M. Marcovina, and M. S. Lodge. 1990. The unique lipopro-tein(a): properties and immunochemical measurement. Clin. Chem. 36:2019-2026.
4. Albers, J. J., J. L. Adolphson, and W. R. Hazzard. 1977. Radio-immunoas-say of human plasma Lp(a) lipoprotein. J. Lipid Res. 18:331-338.
5. Armstrong, V. W., P. Cremer, E. Eberle, A. Manke, F. Schulze, H. Wieland,H. Kreuzer, and D. Seidel. 1986. The association between serum Lp(a) concen-trations and angiographically assessed coronary atherosclerosis: dependence onserum LDL levels. Atherosclerosis. 62:249-257.
6. Sandholzer, C., E. Boerwinkle, N. Saha, M. C. Tong, and G. Utermann.1992. Apolipoprotein(a) phenotypes, Lp(a) concentration and plasma lipid lev-els in relation to coronary heart disease in a Chinese population: evidence for therole of the apo(a) gene in coronary heart disease. J. Clin. Invest. 89:1040-1046.
7. Rhoads, G. G., G. H. Dahln, K. Berg, N. E. Morton, and A. L. Dannen-berg. 1986. Lp(a) lipoprotein asa risk factor for myocardial infarction. JAMA(J.Am. Med. Assoc.). 256:2540-2544.
8. Berg, K., and J. Mohr. 1963. Genetics ofthe Lp system. Acta Genet. (Basle).13:349-360.
9. Utermann, G., H. J. Menzel, H. G. Kraft, H. C. Duba, H. G. Kemmler, andC. Seitz. 1987. Lp(a) glycoprotein phenotypes: inheritance and relation toLp(a)-lipoprotein concentrations in plasma. J. Clin. Invest. 80:458-465.
10. Lackner, C., E. Boerwinkle, C. C. Leffert, T. Rahmig, and H. H. Hobbs.1991. Molecular basis of apolipoprotein(a) isoform size heterogeneity as revealedby pulsed-field gel electrophoresis. J. Clin. Invest. 87:2077-2086.
11. McLean, J. W., J. E. Tomlinson, W.-J. Kuang, D. L. Eaton, E. Y. Chen,G. M. Fless, A. M. Scanu, and R. M. Lawn. 1987. cDNA sequence of humanapolipoprotein (a) is homologous to plasminogen. Nature (Lond.). 330:132-137.
12. Lackner, C., J. C. Cohen, and H. H. Hobbs. 1993. Molecular definition ofthe extreme size polymorphism in apolipoprotein(a). Hum. Mol. Genet. 2:933-940.
13. Boerwinkle, E., C. C. Leffert, J. Lin, C. Lackner, G. Chiesa, and H. H.Hobbs. 1992. Apolipoprotein(a) gene accounts for greater than 90%of the varia-tion in plasma lipoprotein(a) concentrations. J. Clin. Invest. 90:52-60.
14. Marcovina, S. M., J. J. Albers, D. R. Jacobs, Jr., L.L. Perkins, C.E. Lewis,B. V. Howard, and P. Savage. 1993 Lipoprotein[a] concentrations and apolipo-protein[al phenotypes in Caucasians and African Americans. The Cardia Study.Arterioscler. Thromb. 13:1037-1045.
15. Marcovina, S. M., Z.H. Zhang, V. P. Gaur, and J. J. Albers. 1993 Identifi-cation of 34 apolipoprotein(a) isoforms: differential expression of apolipopro-tein(a) alleles between American blacks and whites. Biochem. Biophys. Res.Commun. 191:1192-1196.
16. Sandholzer, C., D. M. Hallman, N. Saha, G. Sigurdsson, C. Lackner, A.Cksaar, E. Boerwinkle, and G. Utermann. 1991. Effects of the apolipoprotein(a)size polymorphism on the lipoprotein(a) concentration in 7 ethnic groups. Hum.Genet. 86:607-614.
17. Guyton, J. R., G. H. Dahlen, W. Patsch, J. A. Kautz, and A. M. Gotto,Jr.1985. Relationship of plasma lipoprotein Lp(a) levels to race and to apolipopro-tein B. Arteriosclerosis. 5:265-272.
18. Helmhold, M., J. Bigge, R. Muche, J. Mainoo, J. Thiery, D. Seidel, andV. W. Armstrong. 1991. Contribution of the apo(a) phenotype to plasma Lp(a)concentrations shows considerable ethnic variation. J. Lipid Res. 32:1919-1928.
Genetic Analysis of Apo(a) Gene and Plasma Lp(a) in Three Ethnic Groups 2533

19. Parra, H., I. Luyey6, C. Bouramou6, C. Demarquilly, and J.-C. Fruchart.1987. Black-white differences in serum Lp(a) lipoprotein levels. Clin. Chim.Acta. 167:27-31.
20. Bovet, P., C. Shamlaye, A. Kitua, W. F. Riesen, F. Paccaud, and R.Darioli. 1991. High prevalence of cardiovascular risk factors in the Seychelles(Indian Ocean). Arterioscler. Thromb. 11:1730-1736.
21. Menzel, H. J., H. Dieplinger, C. Lackner, F. Hoppichler, J. K. Lloyd,D. R. Muller, C. Labeur, P. J. Talmud, and G. Utermann. 1990. Abetalipopro-teinemia with an apoB-100-lipoprotein(a) glycoprotein complex in plasma. J.Biol. Chem. 265:981-986.
22. Lipid Research Clinic Program. 1982. Lipid &Lipoprotein Analysis. Man-ual of Laboratory Operations. Department of Health, Education and WelfarePubl. NIH. Government Printing Office, Washington, D.C., 175-628.
23. Kamboh, M. I., R. E. Ferrell, and B. A. Kottke. 1991. Expressed hypervar-iable polymorphism of apolipoprotein(a). Am. J. Hum. Genet. 49:1063-1074.
24. Nakane, P.K. and A. Kawaoi. 1974. Peroxidase Labeled Antibody. A newmethod of conjugation. J. Histochem. Cytochem. 22:1084-1091.
25. Conover, W.J. 1980. Practical nonparametric statistics. John Wiley &Sons, NewYork.
26. Guo, W. S., and E. A. Thompson. 1992. Performing the exact test ofHardy-Weinberg proportion for multiple alleles. Biometrics. 48:361-372.
27. Guo, W. S., and E. A. Thompson. 1989. Monte Carlo estimation of p-va-lues forsparse contigency tables. Technical report #187. Department of Statistics.Uof Washington,Seattle, WA.
28. Neter, J., W. Wasserman, and M. H. Kutner. 1990. Applied linear statisti-cal models. IrwinInc. Homewood, IL.
29. Chakraborty, R., M.I. Kamboh, M. Nwankwo, and R.E. Ferrell. 1992.Caucasian genes in American Blacks: new data. Am. J. Hum. Genet. 50:145-155.
30. Amara, J.F., S.H. Cheng, and A.E. Smith. 1992 Intracellular protein traf-ficking defects in human disease. Trend. Cell Biol. 2:145-149.
31. White, A. L., J. E. Hixson, D. L. Rainwater, and R. E. Lanford. 1994.Molecular basis for "null" lipoprotein (a) phenotypes and the influence of apoli-poprotein (a) size on plasma lipoprotein (a) level in the baboon. J. Biol. Chem. Inpress.
32. Heinrich, J., M. Sandkamp, R. Kokott, H. Schulte, and G. Assmann.1991. Relationship of lipoprotein (a) to variables of coagulation and fibrinolysisin a healthy population. Clin. Chem. 37:1950-1954.
2534 Gawet al.