comparable social vulnerability profiling case study: …
TRANSCRIPT
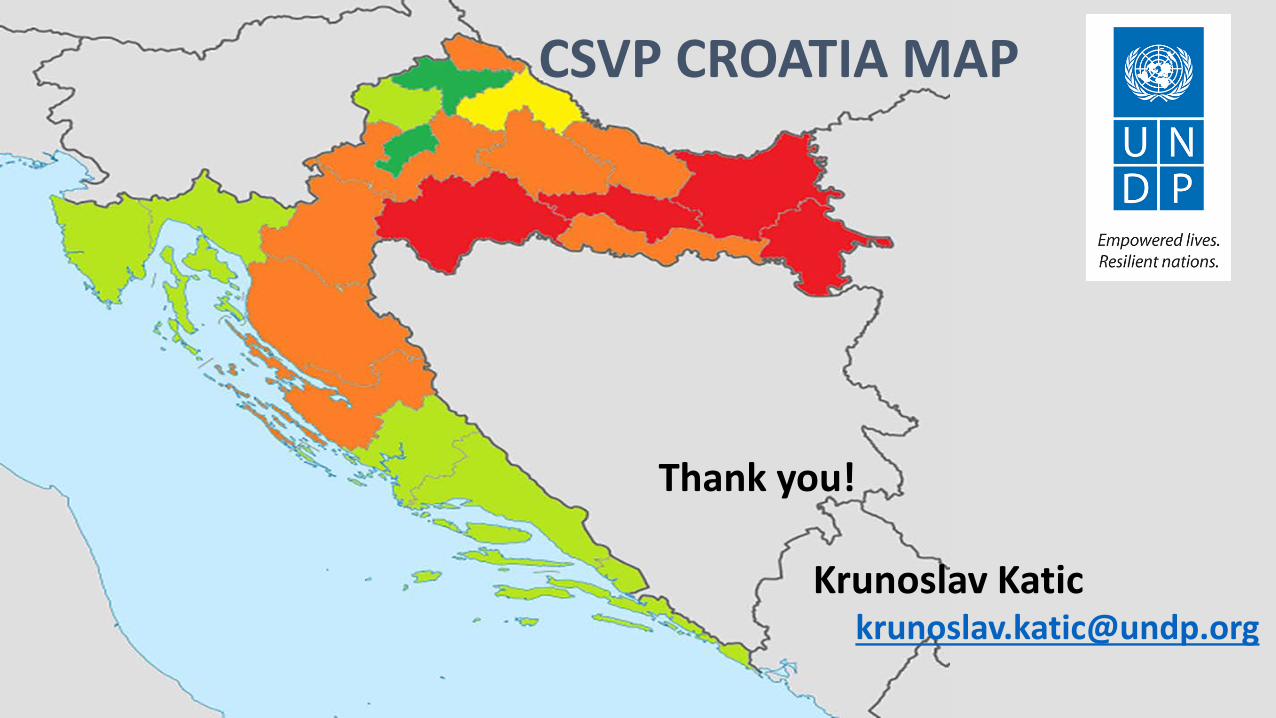
COMPARABLE SOCIAL VULNERABILITY PROFILING
CASE STUDY: CROATIA
Understanding Risk Forum 2016Venice, 18 May 2016
PRESENTATION OUTLINE
Background info - Croatia
Flooding 2014
CSVP methodology
CONCLUSIONS
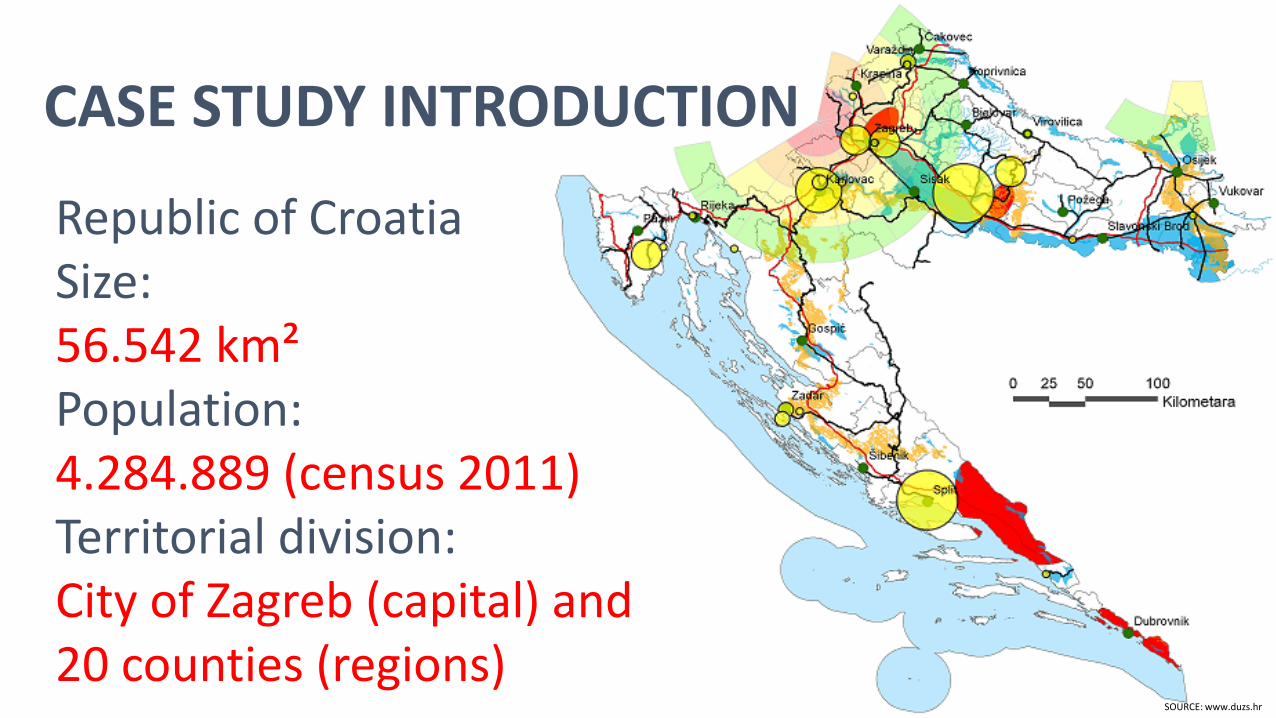
Republic of CroatiaSize: 56.542 km²Population: 4.284.889 (census 2011)Territorial division: City of Zagreb (capital) and 20 counties (regions)
CASE STUDY INTRODUCTION
SOURCE: www.duzs.hr
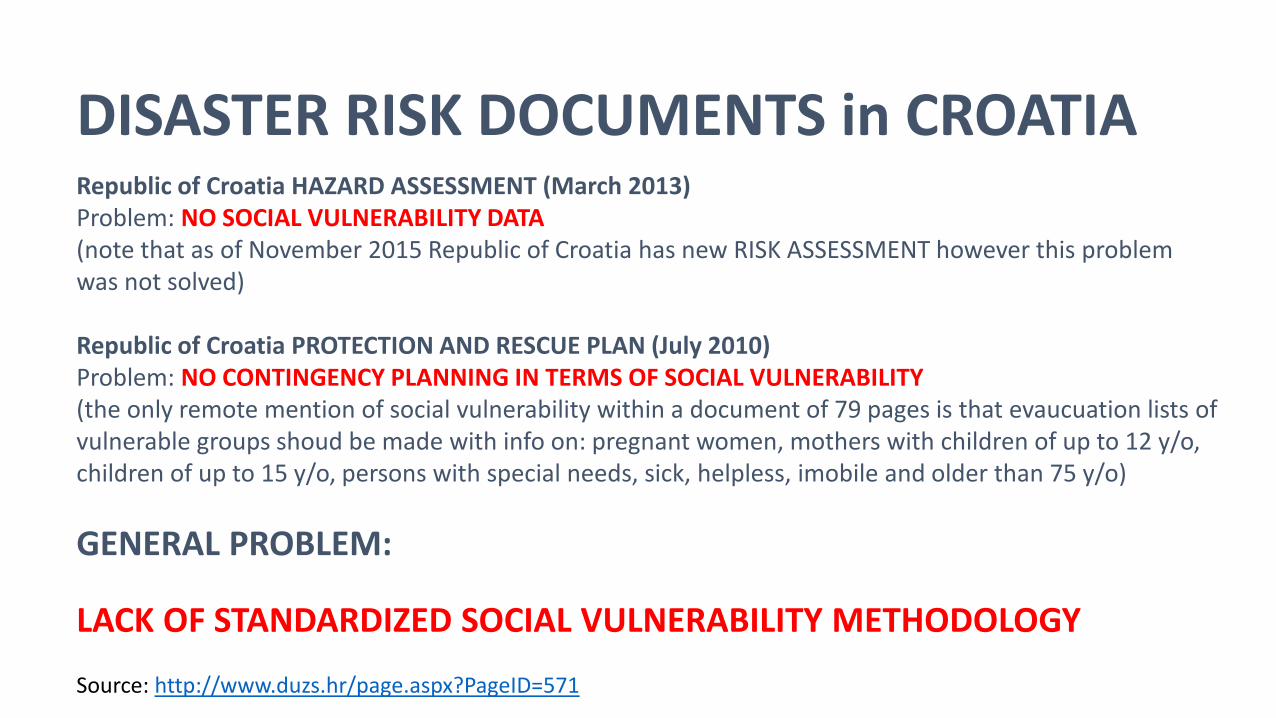
Republic of Croatia HAZARD ASSESSMENT (March 2013)Problem: NO SOCIAL VULNERABILITY DATA(note that as of November 2015 Republic of Croatia has new RISK ASSESSMENT however this problem was not solved)
Republic of Croatia PROTECTION AND RESCUE PLAN (July 2010)Problem: NO CONTINGENCY PLANNING IN TERMS OF SOCIAL VULNERABILITY(the only remote mention of social vulnerability within a document of 79 pages is that evaucuation lists of vulnerable groups shoud be made with info on: pregnant women, mothers with children of up to 12 y/o, children of up to 15 y/o, persons with special needs, sick, helpless, imobile and older than 75 y/o)
GENERAL PROBLEM:
LACK OF STANDARDIZED SOCIAL VULNERABILITY METHODOLOGY
Source: http://www.duzs.hr/page.aspx?PageID=571
DISASTER RISK DOCUMENTS in CROATIA
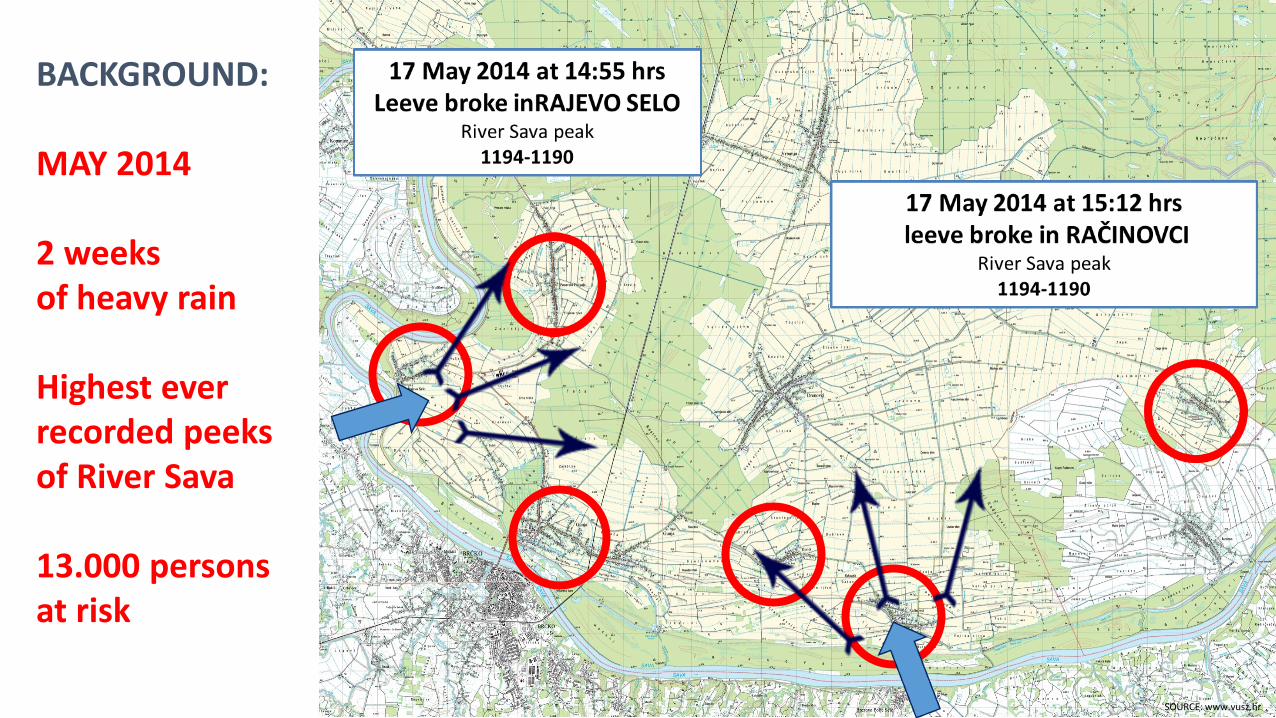
BACKGROUND:
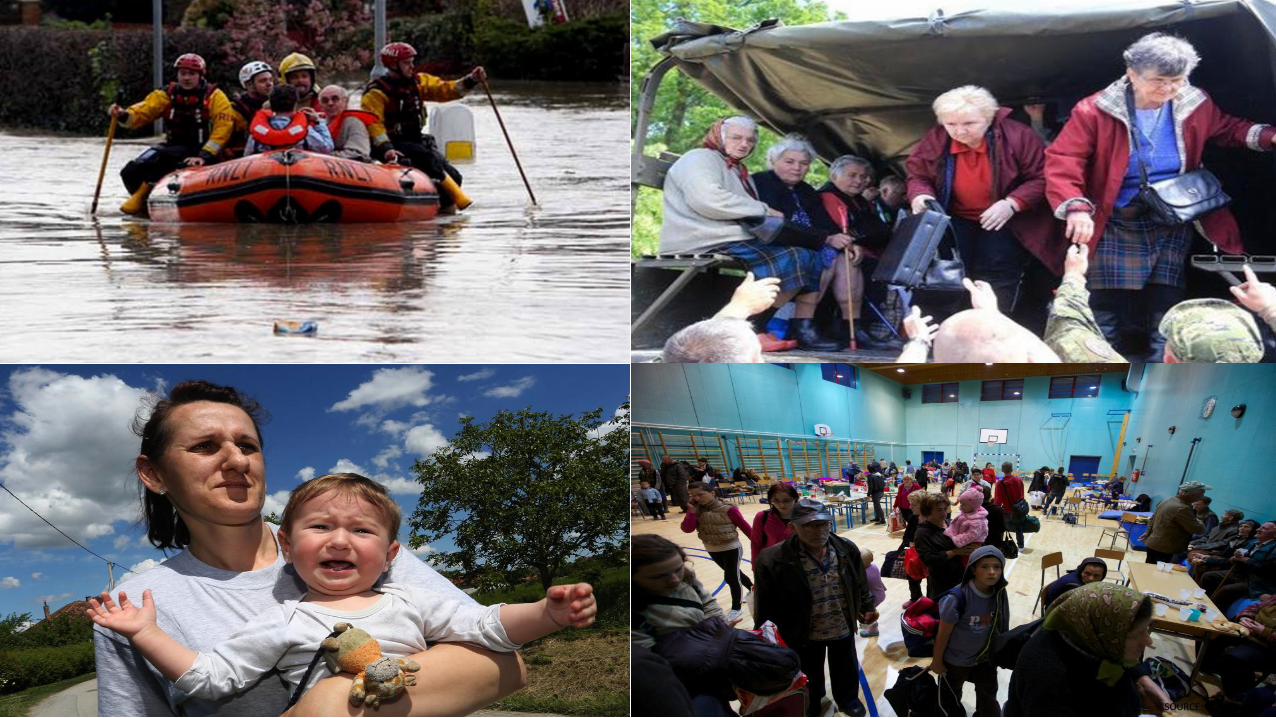
MAY 2014
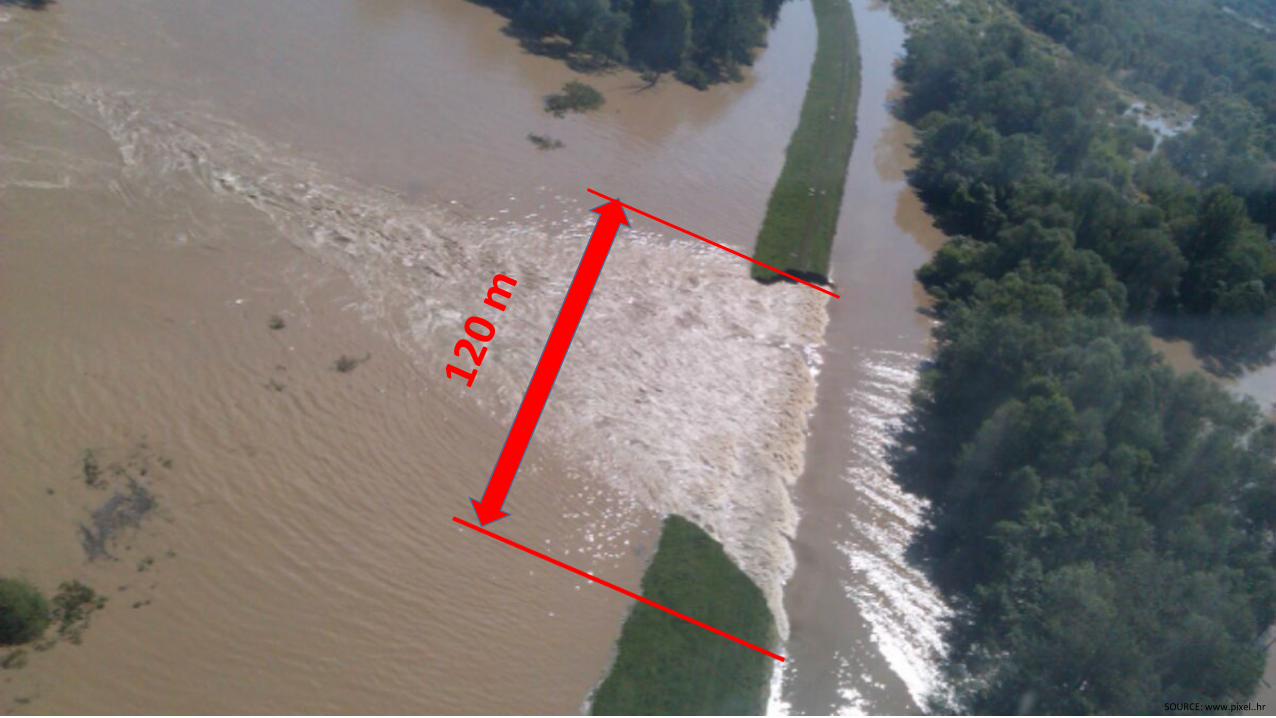
2 weeks of heavy rain
Highest everrecorded peeksof River Sava
13.000 persons at risk
SOURCE: www.vusz.hr
SOURCE: www.pixel..hr
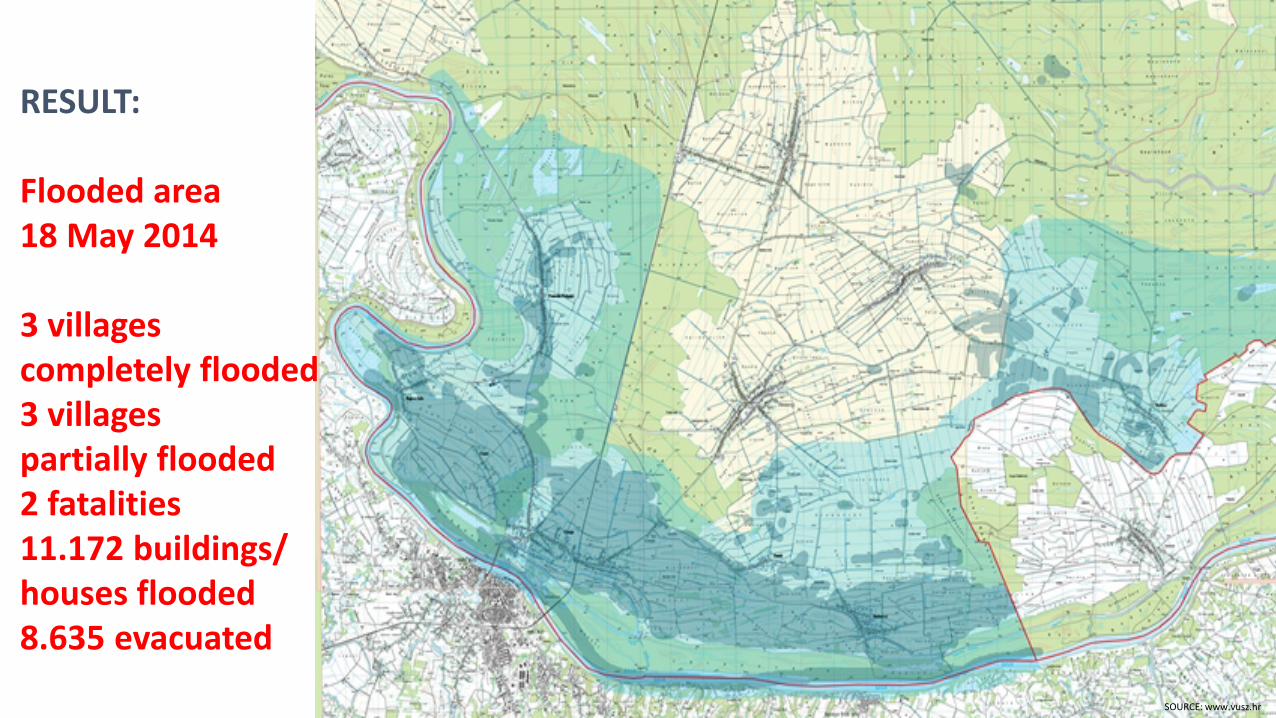
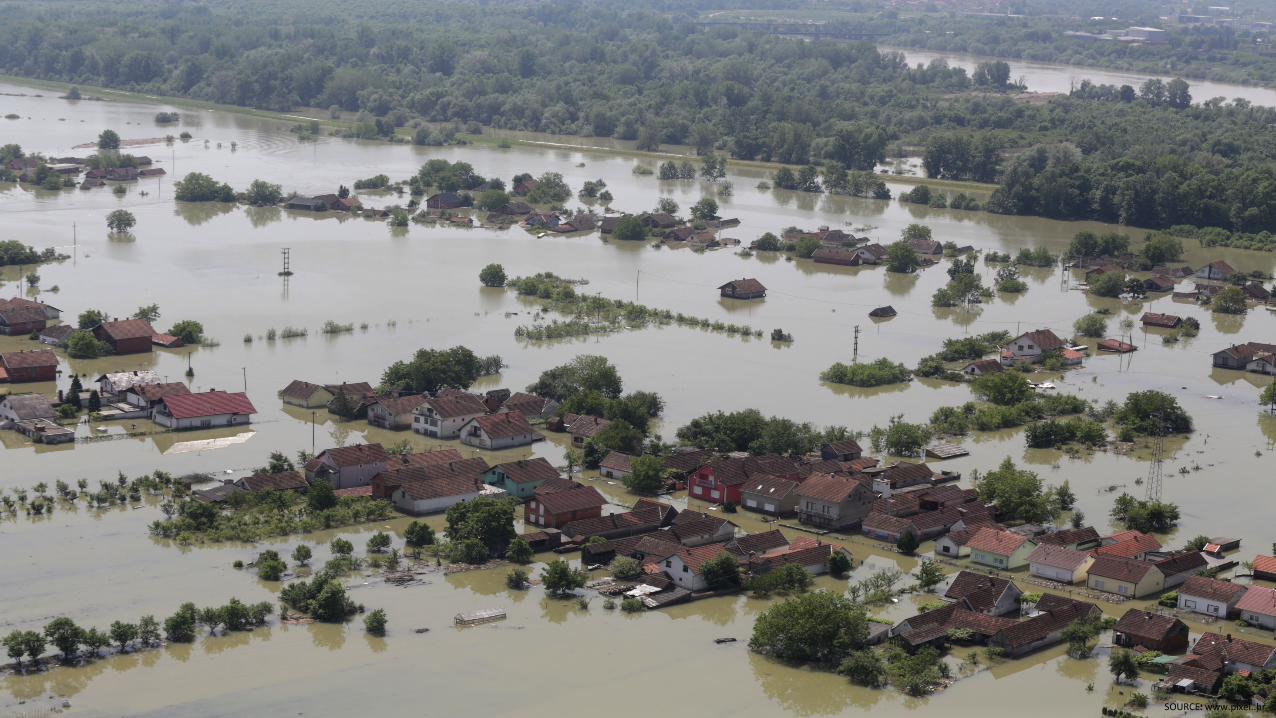
RESULT:
Flooded area 18 May 2014
3 villages completely flooded3 villages partially flooded2 fatalities11.172 buildings/houses flooded8.635 evacuated
SOURCE: www.vusz.hr
SOURCE: www.pixel..hr
SOURCE: www.pixel..hr
COULD WE HAVE REACTED BETTER IN TERMS OF PROTECTION AND RESCUE
IF WE HAD MORE ACCURATE DATA ON SOCIAL VULNERABILITY?
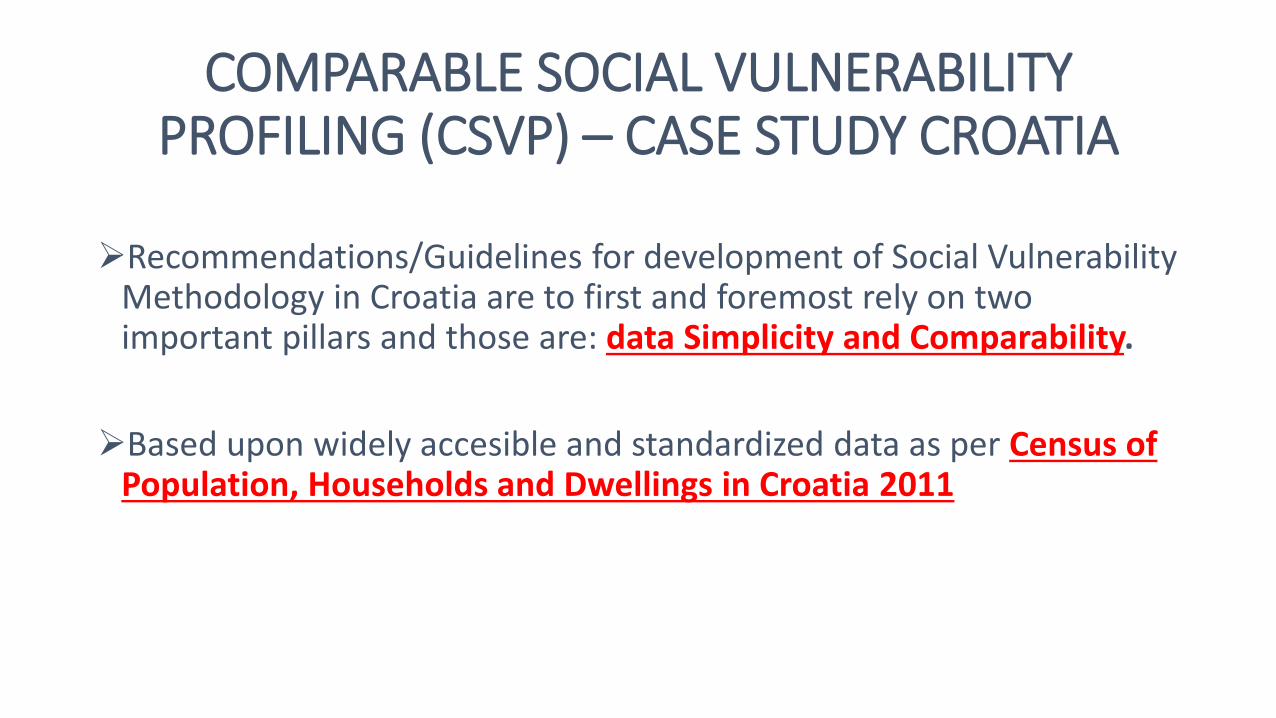
COMPARABLE SOCIAL VULNERABILITY PROFILING (CSVP) – CASE STUDY CROATIA
Recommendations/Guidelines for development of Social Vulnerability Methodology in Croatia are to first and foremost rely on two important pillars and those are: data Simplicity and Comparability.
Based upon widely accesible and standardized data as per Census of Population, Households and Dwellings in Croatia 2011
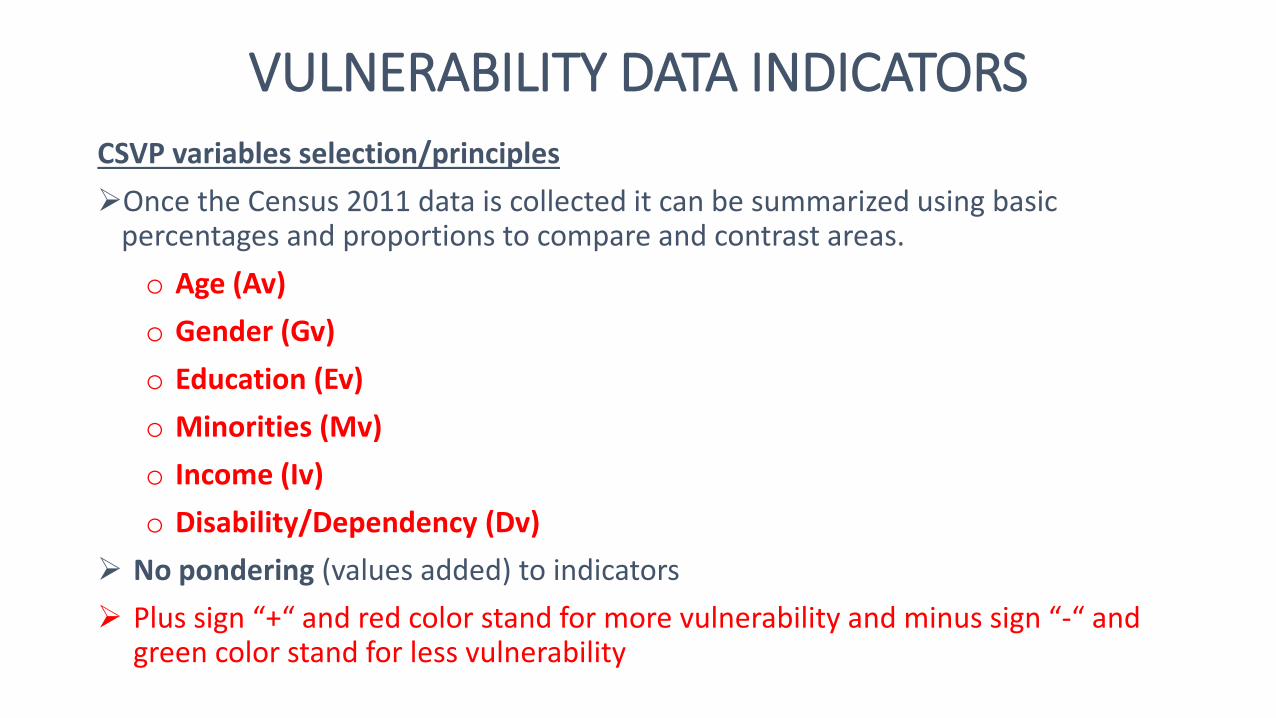
VULNERABILITY DATA INDICATORSCSVP variables selection/principlesOnce the Census 2011 data is collected it can be summarized using basic
percentages and proportions to compare and contrast areas.o Age (Av)o Gender (Gv)o Education (Ev)o Minorities (Mv)o Income (Iv)o Disability/Dependency (Dv)
No pondering (values added) to indicators Plus sign “+“ and red color stand for more vulnerability and minus sign “-“ and
green color stand for less vulnerability
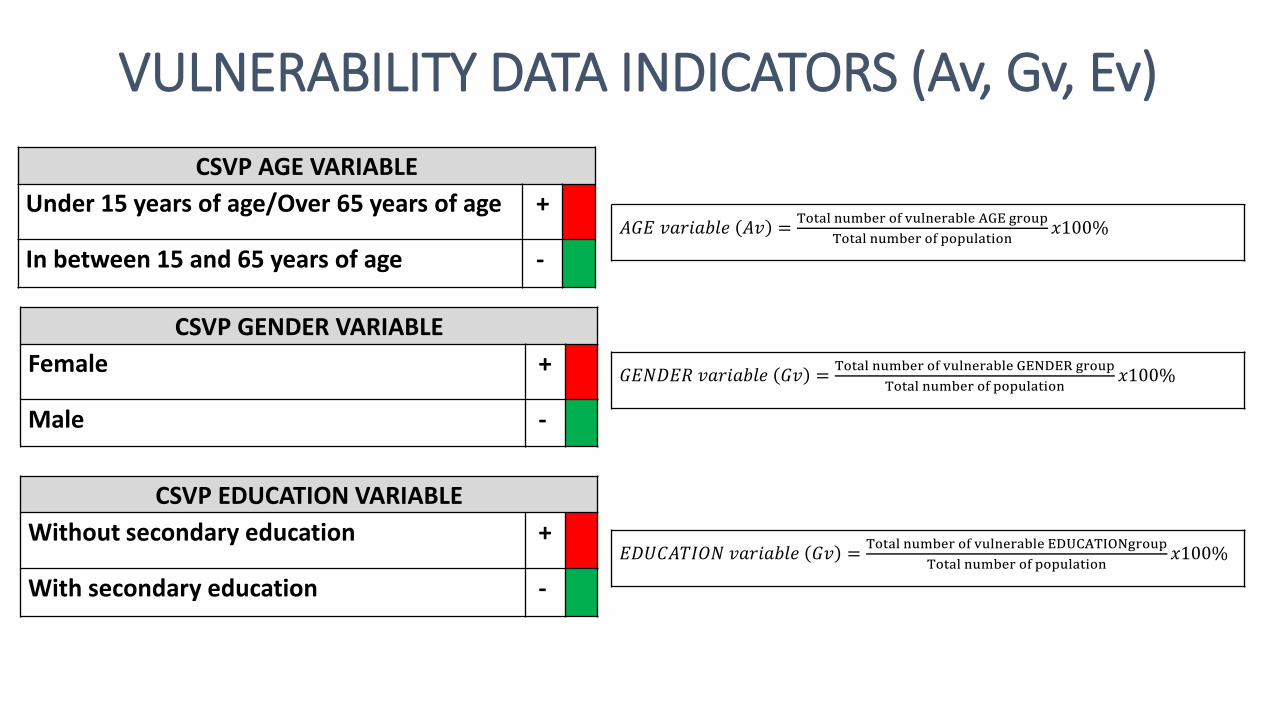
VULNERABILITY DATA INDICATORS (Av, Gv, Ev)CSVP AGE VARIABLE
Under 15 years of age/Over 65 years of age +
In between 15 and 65 years of age -
CSVP GENDER VARIABLEFemale +
Male -
CSVP EDUCATION VARIABLEWithout secondary education +
With secondary education -
𝐴𝐴𝐴𝐴𝐴𝐴 𝑣𝑣𝑣𝑣𝑣𝑣𝑣𝑣𝑣𝑣𝑣𝑣𝑣𝑣𝑣𝑣 𝐴𝐴𝑣𝑣 = Total number of vulnerable AGE groupTotal number of population
𝑥𝑥100%
𝐴𝐴𝐴𝐴𝐺𝐺𝐺𝐺𝐴𝐴𝐺𝐺 𝑣𝑣𝑣𝑣𝑣𝑣𝑣𝑣𝑣𝑣𝑣𝑣𝑣𝑣𝑣𝑣 𝐴𝐴𝑣𝑣 = Total number of vulnerable GENDER groupTotal number of population
𝑥𝑥100%
𝐴𝐴𝐺𝐺𝐸𝐸𝐸𝐸𝐴𝐴𝐸𝐸𝐸𝐸𝐸𝐸𝐺𝐺 𝑣𝑣𝑣𝑣𝑣𝑣𝑣𝑣𝑣𝑣𝑣𝑣𝑣𝑣𝑣𝑣 𝐴𝐴𝑣𝑣 = Total number of vulnerable EDUCATIONgroupTotal number of population
𝑥𝑥100%
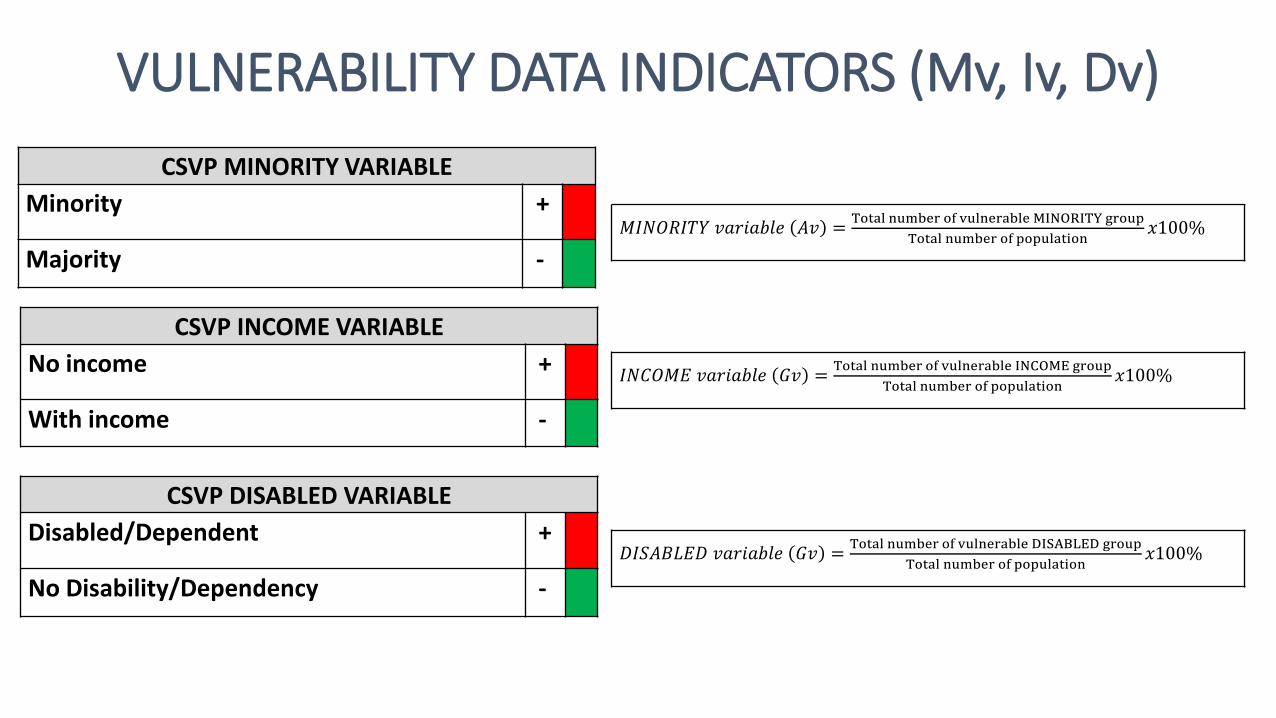
VULNERABILITY DATA INDICATORS (Mv, Iv, Dv)CSVP MINORITY VARIABLE
Minority +
Majority -
CSVP INCOME VARIABLENo income +
With income -
CSVP DISABLED VARIABLEDisabled/Dependent +
No Disability/Dependency -
𝑀𝑀𝐸𝐸𝐺𝐺𝐸𝐸𝐺𝐺𝐸𝐸𝐸𝐸𝑀𝑀 𝑣𝑣𝑣𝑣𝑣𝑣𝑣𝑣𝑣𝑣𝑣𝑣𝑣𝑣𝑣𝑣 𝐴𝐴𝑣𝑣 = Total number of vulnerable MINORITY groupTotal number of population
𝑥𝑥100%
𝐸𝐸𝐺𝐺𝐸𝐸𝐸𝐸𝑀𝑀𝐴𝐴 𝑣𝑣𝑣𝑣𝑣𝑣𝑣𝑣𝑣𝑣𝑣𝑣𝑣𝑣𝑣𝑣 𝐴𝐴𝑣𝑣 = Total number of vulnerable INCOME groupTotal number of population
𝑥𝑥100%
𝐺𝐺𝐸𝐸𝐷𝐷𝐴𝐴𝐷𝐷𝐷𝐷𝐴𝐴𝐺𝐺 𝑣𝑣𝑣𝑣𝑣𝑣𝑣𝑣𝑣𝑣𝑣𝑣𝑣𝑣𝑣𝑣 𝐴𝐴𝑣𝑣 = Total number of vulnerable DISABLED groupTotal number of population
𝑥𝑥100%
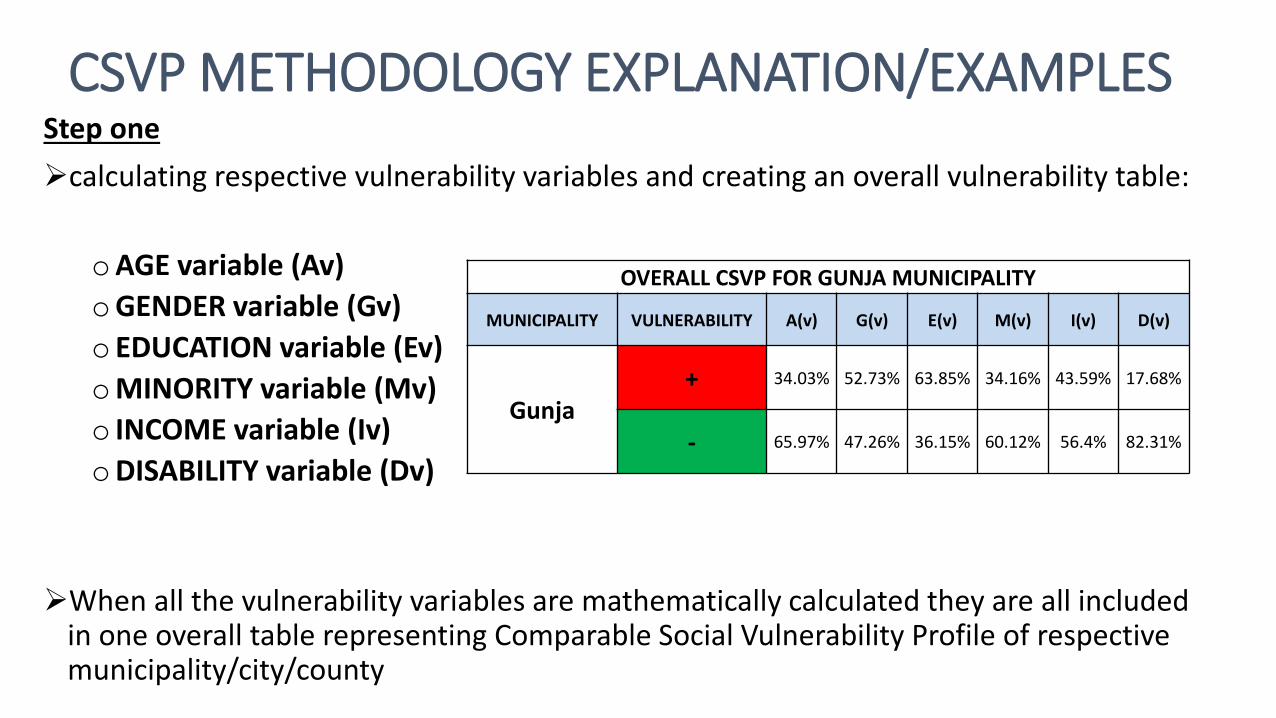
CSVP METHODOLOGY EXPLANATION/EXAMPLESStep onecalculating respective vulnerability variables and creating an overall vulnerability table:
oAGE variable (Av)oGENDER variable (Gv)o EDUCATION variable (Ev)oMINORITY variable (Mv)o INCOME variable (Iv)oDISABILITY variable (Dv)
When all the vulnerability variables are mathematically calculated they are all included in one overall table representing Comparable Social Vulnerability Profile of respective municipality/city/county
OVERALL CSVP FOR GUNJA MUNICIPALITY
MUNICIPALITY VULNERABILITY A(v) G(v) E(v) M(v) I(v) D(v)
Gunja+ 34.03% 52.73% 63.85% 34.16% 43.59% 17.68%
- 65.97% 47.26% 36.15% 60.12% 56.4% 82.31%
CSVP METHODOLOGY EXPLANATION/EXAMPLES
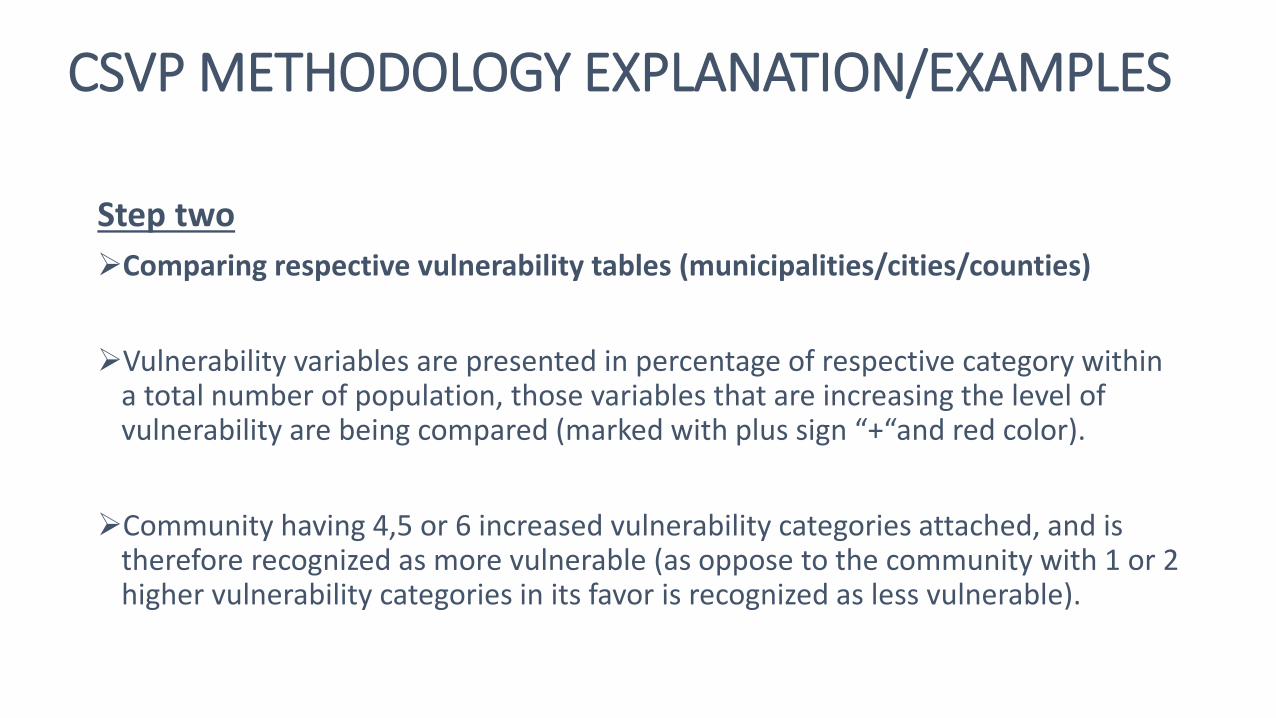
Step twoComparing respective vulnerability tables (municipalities/cities/counties)
Vulnerability variables are presented in percentage of respective category within a total number of population, those variables that are increasing the level of vulnerability are being compared (marked with plus sign “+“and red color).
Community having 4,5 or 6 increased vulnerability categories attached, and is therefore recognized as more vulnerable (as oppose to the community with 1 or 2 higher vulnerability categories in its favor is recognized as less vulnerable).
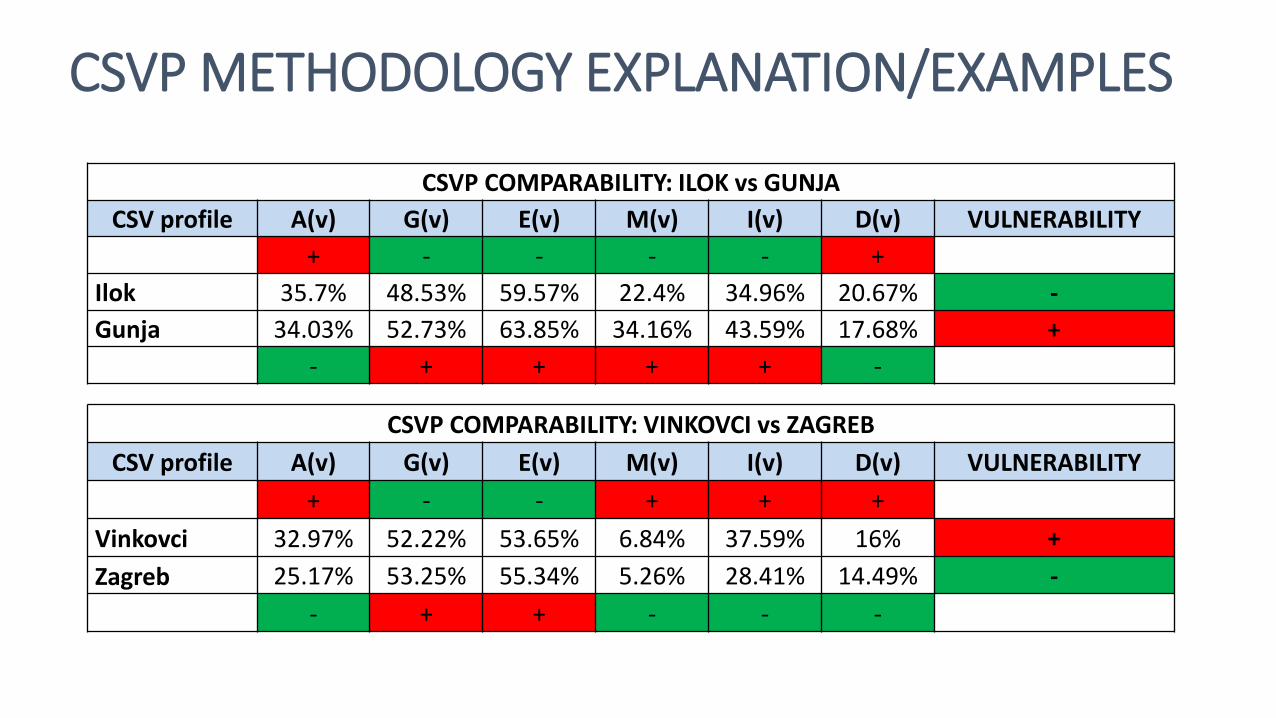
CSVP METHODOLOGY EXPLANATION/EXAMPLES
CSVP COMPARABILITY: ILOK vs GUNJACSV profile A(v) G(v) E(v) M(v) I(v) D(v) VULNERABILITY
+ - - - - +Ilok 35.7% 48.53% 59.57% 22.4% 34.96% 20.67% -Gunja 34.03% 52.73% 63.85% 34.16% 43.59% 17.68% +
- + + + + -
CSVP COMPARABILITY: VINKOVCI vs ZAGREBCSV profile A(v) G(v) E(v) M(v) I(v) D(v) VULNERABILITY
+ - - + + +Vinkovci 32.97% 52.22% 53.65% 6.84% 37.59% 16% +Zagreb 25.17% 53.25% 55.34% 5.26% 28.41% 14.49% -
- + + - - -
CSVP METHODOLOGY EXPLANATION/EXAMPLES
Step three Comparing respective vulnerability tables against common denominator
To determine vulnerability levels between respective communities within one area, all the results derived from respective vulnerability tables need to be compared with the common denominator.
If the respective community vulnerability variable is higher than the reference vulnerability variable it gets marked with red color; in the opposite case it gets marked with green color meaning that with that particular variable community is lower vulnerable than its reference point (county/state).
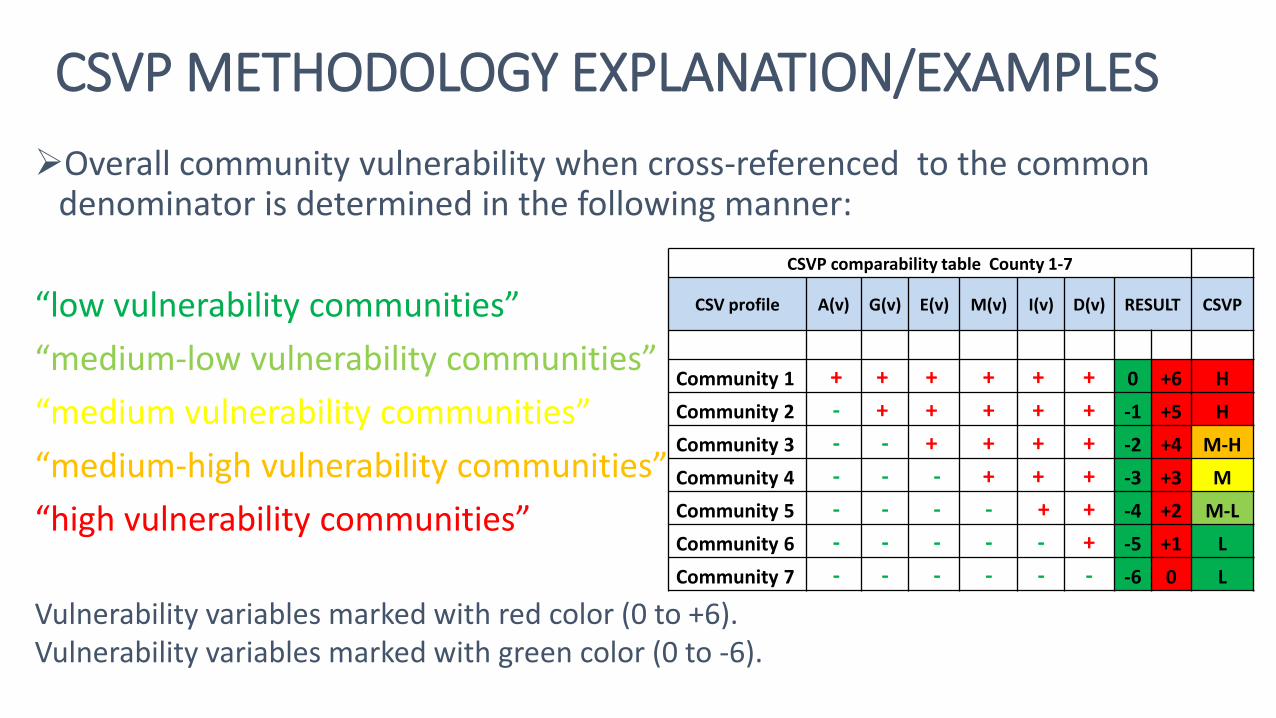
CSVP METHODOLOGY EXPLANATION/EXAMPLESOverall community vulnerability when cross-referenced to the common
denominator is determined in the following manner:
“low vulnerability communities”“medium-low vulnerability communities”“medium vulnerability communities”“medium-high vulnerability communities”“high vulnerability communities”
Vulnerability variables marked with red color (0 to +6).Vulnerability variables marked with green color (0 to -6).
CSVP comparability table County 1-7
CSV profile A(v) G(v) E(v) M(v) I(v) D(v) RESULT CSVP
Community 1 + + + + + + 0 +6 HCommunity 2 - + + + + + -1 +5 HCommunity 3 - - + + + + -2 +4 M-HCommunity 4 - - - + + + -3 +3 MCommunity 5 - - - - + + -4 +2 M-LCommunity 6 - - - - - + -5 +1 LCommunity 7 - - - - - - -6 0 L
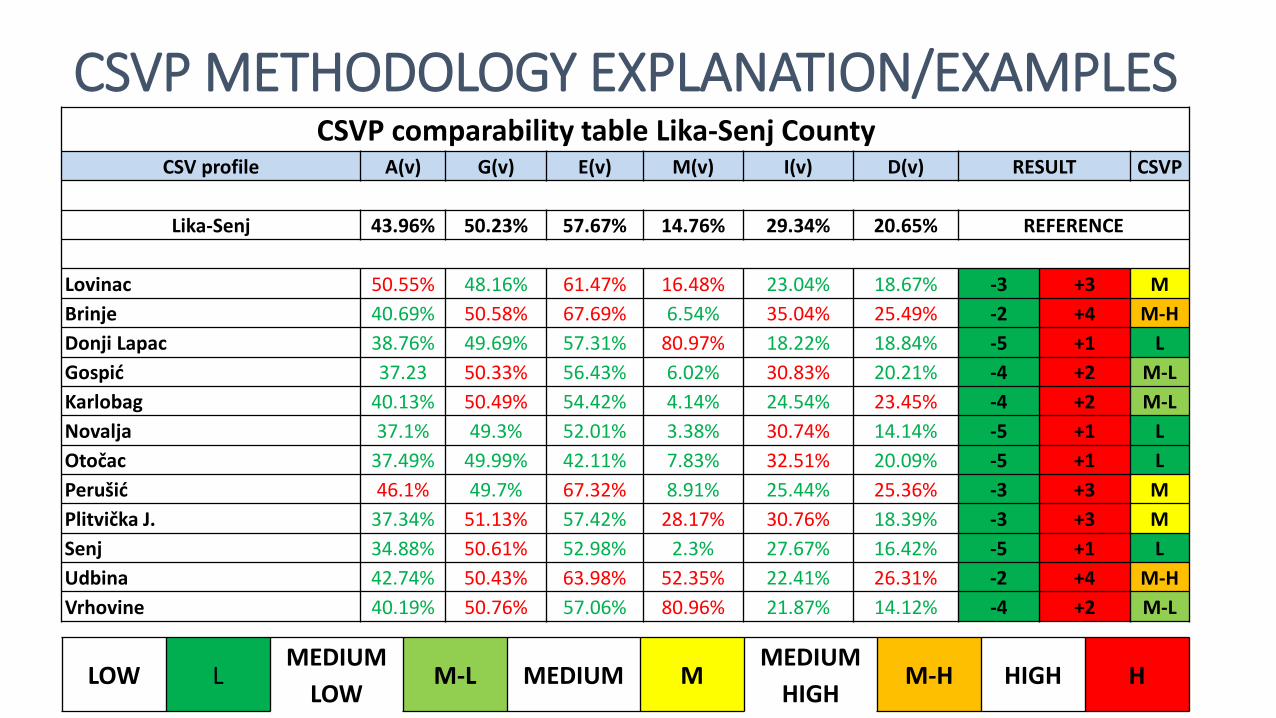
CSVP METHODOLOGY EXPLANATION/EXAMPLESCSVP comparability table Lika-Senj County
CSV profile A(v) G(v) E(v) M(v) I(v) D(v) RESULT CSVP
Lika-Senj 43.96% 50.23% 57.67% 14.76% 29.34% 20.65% REFERENCE
Lovinac 50.55% 48.16% 61.47% 16.48% 23.04% 18.67% -3 +3 MBrinje 40.69% 50.58% 67.69% 6.54% 35.04% 25.49% -2 +4 M-HDonji Lapac 38.76% 49.69% 57.31% 80.97% 18.22% 18.84% -5 +1 LGospić 37.23 50.33% 56.43% 6.02% 30.83% 20.21% -4 +2 M-LKarlobag 40.13% 50.49% 54.42% 4.14% 24.54% 23.45% -4 +2 M-LNovalja 37.1% 49.3% 52.01% 3.38% 30.74% 14.14% -5 +1 LOtočac 37.49% 49.99% 42.11% 7.83% 32.51% 20.09% -5 +1 LPerušić 46.1% 49.7% 67.32% 8.91% 25.44% 25.36% -3 +3 MPlitvička J. 37.34% 51.13% 57.42% 28.17% 30.76% 18.39% -3 +3 MSenj 34.88% 50.61% 52.98% 2.3% 27.67% 16.42% -5 +1 LUdbina 42.74% 50.43% 63.98% 52.35% 22.41% 26.31% -2 +4 M-HVrhovine 40.19% 50.76% 57.06% 80.96% 21.87% 14.12% -4 +2 M-L
LOW LMEDIUM
LOWM-L MEDIUM M
MEDIUMHIGH
M-H HIGH H
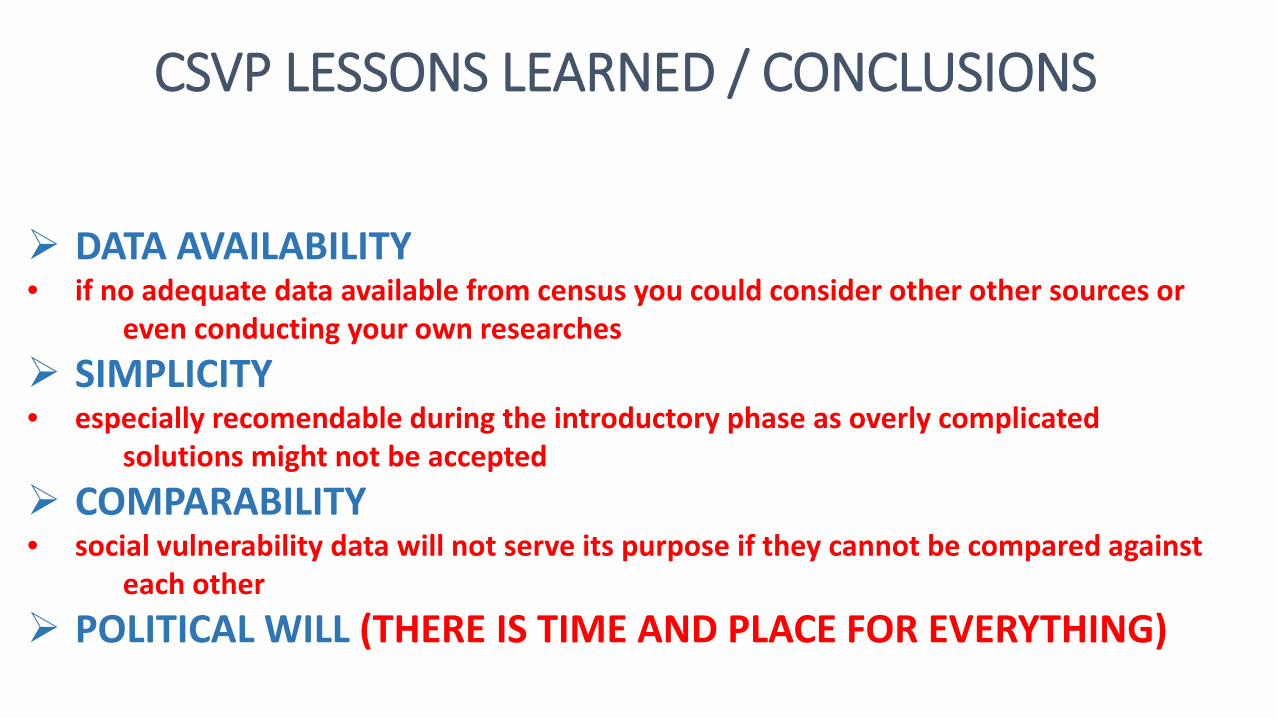
CSVP LESSONS LEARNED / CONCLUSIONS
DATA AVAILABILITY• if no adequate data available from census you could consider other other sources or
even conducting your own researches SIMPLICITY • especially recomendable during the introductory phase as overly complicated
solutions might not be accepted COMPARABILITY• social vulnerability data will not serve its purpose if they cannot be compared against
each other POLITICAL WILL (THERE IS TIME AND PLACE FOR EVERYTHING)