compar og bnp v hfef, bor hfef hfef: epor chart‑2 sy · heart and vessels (2018) 33:997–1007...
TRANSCRIPT

Vol.:(0123456789)1 3
Heart and Vessels (2018) 33:997–1007 https://doi.org/10.1007/s00380-018-1150-4
ORIGINAL ARTICLE
Comparable prognostic impact of BNP levels among HFpEF, Borderline HFpEF and HFrEF: a report from the CHART‑2 Study
Shintaro Kasahara1 · Yasuhiko Sakata1 · Kotaro Nochioka1 · Takeshi Yamauchi1 · Takeo Onose1 · Kanako Tsuji1 · Ruri Abe1 · Takuya Oikawa1 · Masayuki Sato1 · Hajime Aoyanagi1 · Masanobu Miura1 · Takashi Shiroto1 · Jun Takahashi1 · Satoshi Miyata2 · Hiroaki Shimokawa1,2 · On behalf of the CHART-2 Investigators
Received: 31 October 2017 / Accepted: 9 March 2018 / Published online: 22 March 2018 © Springer Japan KK, part of Springer Nature 2018
AbstractWe aimed to compare the usefulness of plasma levels of B-type natriuretic peptide (BNP) for long-term risk stratification among patients with heart failure (HF) with preserved left ventricular ejection fraction (LVEF) (HFpEF), borderline HFpEF, and HF with reduced LVEF (HFrEF) in the same HF cohort. In the CHART-2 Study (N = 10,219), we categorized 4301 consecutive Stage C/D HF patients (mean age 68.7 years, female 32.4%) into 3 groups: HFpEF (LVEF ≥ 50%, N = 2893), borderline HFpEF (LVEF 40–50%, N = 666), and HFrEF (LVEF ≤ 40%, N = 742). During the median 6.3-year follow-up, all-cause deaths occurred in 887 HFpEF, 330 borderline HFpEF, and 330 HFrEF patients. Although median BNP levels increased from HFpEF, borderline HFpEF to HFrEF (85.3, 126 and 208 pg/ml, respectively, P < 0.001), the relationship between log2 BNP levels and the mortality risk was comparable among the 3 groups. As compared with patients with BNP < 30 pg/ml, those with 30–99, 100–299 and ≥ 300 pg/ml had comparably increasing mortality risk among the 3 groups (hazard ratio 2.5, 4.7 and 7.8 in HFpEF, 2.1, 4.2 and 7.0 in borderline HFpEF, and 3.0, 4.7 and 9.5 in HFrEF, respectively, all P < 0.001). BNP levels have comparable prognostic impact among HFpEF, borderline HFpEF, and HFrEF patients.
Keywords B-type natriuretic peptide · Prognosis · Heart failure · Left ventricular ejection fraction
Introduction
Along with the rapid aging of society, the burden of heart failure (HF) is a global pandemic worldwide; HF incidence increases with age, rising from approximately 20 per 1000 individuals 65–69 years of age to > 80 per 1000 individu-als among those ≥ 85 years of age [1, 2]. Based on the data from the National Health and Nutrition Examination Sur-vey (NHANES), it was estimated that 5.7 million Ameri-cans aged ≥ 20 years had HF and that the prevalence of HF
patients would increase by 46% in 2030, resulting in > 8 million HF patients among Americans aged ≥ 18 years [3]. Similarly, in Europe, the proportion of the elderly population aged ≥ 65 years was 12.4% in 1980, is currently 17.6% in 2015, and will be increased to 23.1% by 2030 [4], indicat-ing a rapid increase in HF [5]. Also in Asia, HF pandemic has been emerging although available information is limited [6–9].
The poor prognosis of HF patients is another important healthcare issue worldwide. For instance, in the US, there was no improvement in 5-year mortality in HF patients from 2000–2003 to 2008–2010 [age-adjusted hazard ratio (HR) 1.05, 95% confidence interval (CI) 0.91–1.20] [5, 10]. It was also reported that survival after HF diagnosis leveled off after mid-2000s, possibly reflecting the increasing propor-tion of non-cardiovascular deaths along with an increase of HF with preserved ejection fraction (HFpEF) as well as the comorbidity burden in HF [10]. Although the prevalence of HFpEF, characterized by higher prevalence of elderly peo-ple, females, hypertension and atrial fibrillation (AF), has
The members of the CHART-2 Investigators are listed in “Acknowledgements” section.
* Yasuhiko Sakata [email protected]
1 Department of Cardiovascular Medicine, Tohoku University Graduate School of Medicine, 1-1 Seiryo-machi, Aoba-ku, Sendai 980-8574, Japan
2 Department of Evidence-Based Cardiovascular Medicine, Tohoku University Graduate School of Medicine, 1-1 Seiryo-machi, Aoba-ku, Sendai 980-8574, Japan

998 Heart and Vessels (2018) 33:997–1007
1 3
increased over time [6], effective strategies still remain to be developed for the disorder [11, 12].
Risk stratification is one of the most useful means for better management of HF. Efforts have been made to stratify the individual risk and therapeutic strategy in HF patients. Indeed, a number of studies explored the prognostic bio-markers in HF patients, including natriuretic peptides, tro-ponins and other biomarkers, those reflecting inflammation, oxidative stress, neurohormonal disarray, and myocardial and matrix remodeling [1]. Among them, natriuretic pep-tides have been shown to be the most powerful prognostic markers and their measurements are widely used in daily practice [13]. The systematic review with 16 publications for B-type natriuretic peptide (BNP) and 88 publications for N-terminal proBNP (NT-proBNP) showed that higher levels of BNP and NT-proBNP could predict mortality and morbidity in chronic stable HF patients [14]. How-ever, since almost all previous studies examined the prog-nostic impact of BNP and/or NT-proBNP in the separated cohorts of HFpEF [15–17] or HF with reduced ejection frac-tion (HFrEF) patients [18–22], it remains to be examined whether BNP has comparable usefulness to stratify the risk between HFpEF and HFrEF patients in the same cohort. Fur-thermore, there have been few reports regarding the prognos-tic impact of BNP in patients with borderline HFpEF, a new HF criterion for those with left ventricular ejection fraction (LVEF) between 40 and 50% [1]. Since we and others have demonstrated that clinical characteristics and prognostic factors are different according to LVEF categories among HF patients [3, 23, 24], it remains to be examined whether BNP levels have the same or different prognostic impact among the HFpEF, borderline HFpEF and HFrEF groups in the same HF cohort.
In the present study, we thus compared the prognostic impact of BNP levels among HFpEF, borderline HFpEF and HFrEF patients, using the database of our Chronic Heart Failure Analysis and Registry in the Tohoku District (CHART)-2 Study, the largest-scale cohort study of HF patients in Japan [24–28].
Methods
Study design
The CHART-2 Study is a large-scale prospective obser-vational multicenter cohort study of chronic HF patients in Japan (NCT00418041) [24–28]. The CHART-2 Study has been previously described in detail [24–28]. Briefly, a total of 10,219 stable patients aged ≥ 20 years with either coronary artery disease (Stage A, N = 868), asymptomatic structural heart disease (Stage B, N = 4475), or a current or past history of symptomatic HF (Stage C/D, N = 4876) at
cardiology outpatient clinics or just before discharge were enrolled between October 2006 and September 2010 at the Tohoku University Hospital and 23 affiliated hospitals in the Tohoku District, Japan [24–28]. Based on the American Col-lege of Cardiology Foundation/American Heart Association (ACCF/AHA) guidelines [1], we defined HFpEF, borderline HFpEF and HFrEF as HF with LVEF ≥ 50%, HF with LVEF between 40 and 50% and LVEF ≤ 40%, respectively (Fig. 1). After excluding 5333 patients with Stage A/B HF, 10 with-out sufficient data, and 575 patients with Stage C/D with no data on LVEF and/or BNP, we finally examined consecu-tive 4301 Stage C/D HF patients with BNP and echocardio-graphic data at registration (2893 HFpEF, 666 borderline HFpEF and 742 HFrEF) in the present study (Fig. 1). We compared the distribution and usefulness of BNP levels for the long-term risk stratification among HFpEF, borderline HFpEF, and HFrEF patients. The primary endpoint of the present study was all-cause death. The secondary endpoints included cardiovascular death, non-cardiovascular death and HF admission. All procedures performed in studies involv-ing human participants were in accordance with the ethical standards of the institutional and/or national research com-mittee and with the 1964 Helsinki declaration and its later amendments or comparable ethical standards. Informed con-sent was obtained from all individual participants included in the study.
Statistical analysis
All continuous variables are reported as mean ± SD or median with interquartile range (IQR) and all categorical variables are reported as frequency (%). To compare the sub-groups, we performed Welch’s t test and one-way ANOVA
Stage A/B/C/D (N=10,219)
Stage C/D (N=4,876)
Stage A/B (N=5,333)
Stage C/D (N=4,301)
No data of LVEFand/or BNP (N=575)
HFpEF(LVEF>50%)
(N=2,893)
Borderline HFpEF(40%<LVEF<50%)
(N=666)
Data unavailable (N=10)
HFrEF(LVEF<40%)
(N=742)
Fig. 1 Flow chart of patient selection. BNP B-type natriuretic pep-tide, LVEF left ventricular ejection fraction, HFpEF heart failure with preserved ejection fraction, HFrEF heart failure with reduced ejec-tion fraction

999Heart and Vessels (2018) 33:997–1007
1 3
for continuous variables and Fisher’s exact test for categori-cal variables. To examine the factors related to log2 BNP lev-els [29], we performed multivariable regression analysis. In the multivariable models, variables were selected based on ACCF/AHA guideline as follows: age, sex, body mass index (BMI), chronic kidney disease (CKD) (estimated glomerular filtration rate (eGFR) < 60 ml/min/1.73 m2), New York Heart Association (NYHA) classification, ischemic heart dis-ease (IHD), AF and anemia (hemoglobin < 13 g/dl in male and < 12 g/dl in female). To compare the incidence rate of the endpoints (1000 person-years) for all possible combina-tions of log2 BNP levels and HFpEF, borderline HFpEF and HFrEF groups, we estimated the incidence rates and tested with the mid-P exact P values by the epitools package (ver-sion 0.5–7) of the R software followed by Bonferroni mul-tiple comparisons. To evaluate the association between log2 BNP levels and the mortality risk, we calculated HR and 95% CI using the simple Cox proportional hazard regression model and P values for interaction between log2 BNP levels and LVEF values were calculated in overall and subgroups divided by BNP-related factors. To compare the prognos-tic impact of BNP among HFpEF, borderline HFpEF and HFrEF patients, we classified the patients in each group into 4 subsets according to the BNP cutoff values determined by the survival classification and regression trees (CART) analysis. The CART analysis provides a binary decision tree for classification and regression based on recursive partition-ing of the data space and sequentially determines condition-ing variables and their splitting points for partitioning to fit a simple prediction model within each partition. The survival CART is the CART considering survival time as an outcome [30]. Kaplan–Meier curves among BNP subsets were com-pared by the log-rank test and the Cox proportional hazard models were utilized. P value < 0.05 and P value for inter-action < 0.1 were considered as statistically significant. All statistical analyses were performed using the open-source statistics computing software R version 3.1.3 [31].
Results
Baseline characteristics of HFpEF, Borderline HFpEF and HFrEF patients
Table 1 shows the baseline characteristics of the patients among the 3 groups. Age and the prevalence of female and BMI were significantly decreased from HFpEF, borderline HFpEF, to HFrEF, while the prevalence of NYHA class III/IV was increased. As a HF etiology, the prevalence of IHD was highest in all 3 groups, but it was higher in borderline HFpEF and HFrEF compared with HFpEF. From HFpEF, borderline HFpEF, to HFrEF, the prevalence of dilated car-diomyopathy was increased, whereas those of hypertrophic
cardiomyopathy, hypertensive heart disease and valvular heart disease decreased as a HF etiology. As comorbidi-ties, the frequency of prior admission for HF was increased, while those of hypertension, and malignant disease, and AF decreased from HFpEF, borderline HFpEF, to HFrEF. Sys-tolic and diastolic blood pressures were decreased, while heart rate, left atrium dimension and left ventricular end-diastolic dimension were increased from HFpEF, borderline HFpEF, to HFrEF. As for laboratory findings, hemoglobin level was increased from HFpEF, borderline HFpEF, to HFrEF, while eGFR was decreased from HFpEF, borderline HFpEF, to HFrEF. Regarding medications, the prescription rates of beta-blockers, angiotensin converting enzyme inhib-itors and/or angiotensin II receptor blockers, aldosterone antagonists and loop diuretics were increased from HFpEF, borderline HFpEF, to HFrEF, while that of calcium channel blockers was decreased.
Distribution, related factors, and prognostic value of BNP levels
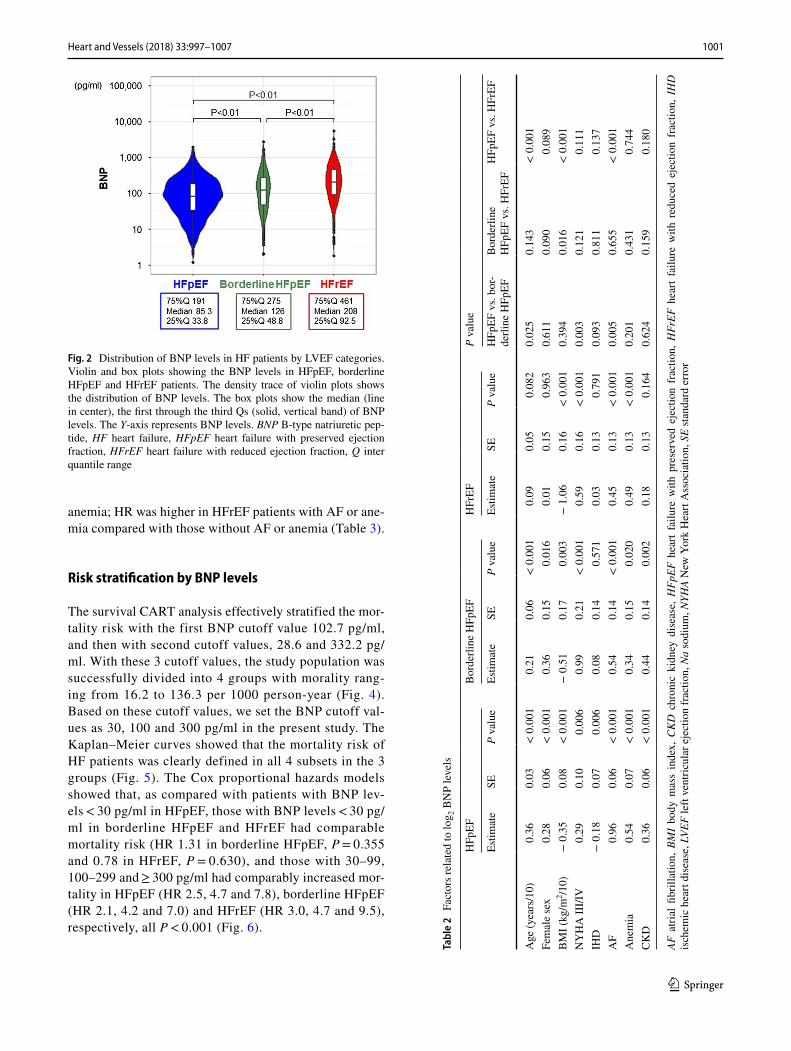
BNP levels were lowest in HFpEF and highest in HFrEF; median (25%, 75% quartiles) BNP levels were 85.3 (33.8, 191) pg/ml in HFpEF, 126 (50.7, 274) pg/ml in borderline HFpEF, and 208 (97.4, 468) pg/ml in HFrEF (Fig. 2). The multivariable regression analysis showed that some factors related to log2 BNP levels differed among HFpEF, border-line HFpEF, to HFrEF. For example, age and AF had higher estimates in HFpEF patients as compared with borderline HFpEF and HFrEF patients, but BMI had higher estimates in HFrEF than in HFpEF and borderline HFpEF patients (Table 2). On the other hand, estimates of IHD, anemia, and CKD had no statistical difference among 3 groups.
Relationship between BNP levels and the endpoints
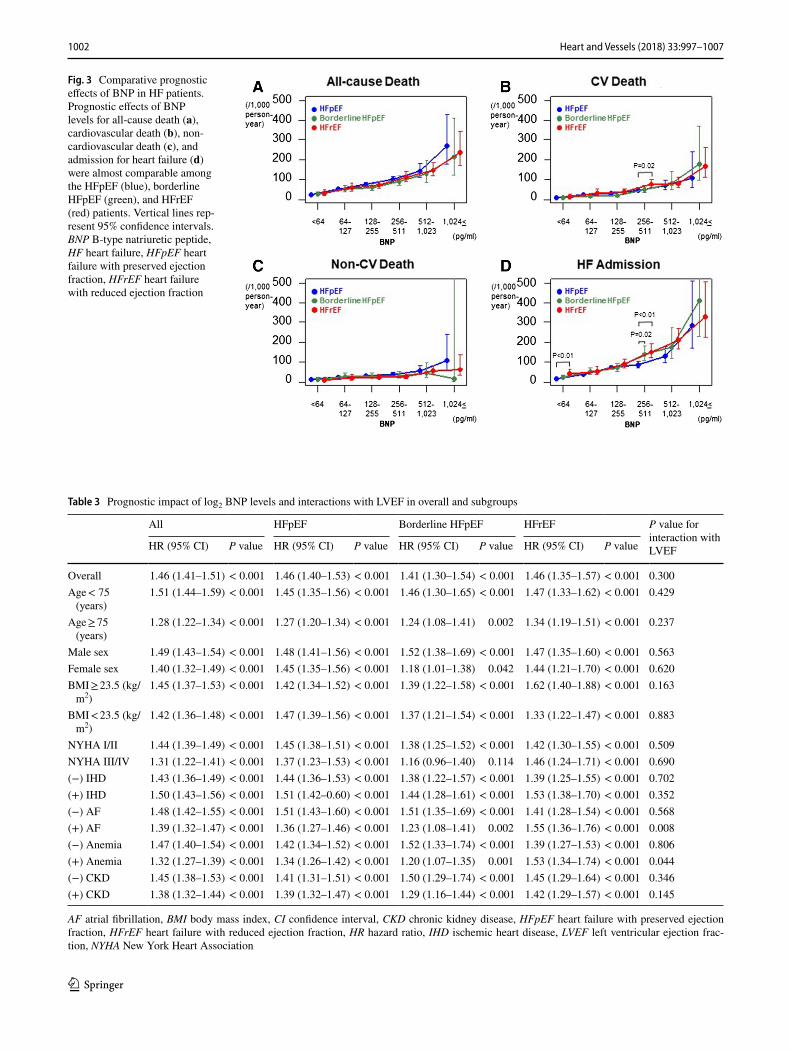
Figure 3a shows the relationship between log2 BNP levels and mortality in the HFpEF, borderline HFpEF and HFrEF groups. The higher the log2 BNP levels, the more the mor-tality increased, which was consistent among the 3 groups. Each range of log2 BNP levels had no statistical differences in mortality among the 3 groups. Moreover, log2 BNP was similarly associated with the incidence of cardiovascular death (Fig. 3b), non-cardiovascular death (Fig. 3c), and HF admission (Fig. 3d) among the 3 groups.
Table 3 shows the results of the unadjusted Cox pro-portional hazard models in the overall and subgroups divided according to variables used in Table 2. Among HFpEF, borderline HFpEF, and HFrEF, the prognostic impact of BNP levels was generally comparable with a few exceptions in patients with AF and those with anemia. We noted statistically significant interactions between log2 BNP and LVEF values in HFrEF patients with AF or

1000 Heart and Vessels (2018) 33:997–1007
1 3
Table 1 Baseline characteristics of patients with HFpEF, borderline HFpEF and HFrEF
Results are expressed as mean ± SD or frequency (%)ACE-I angiotensin converting enzyme inhibitors, ARB angiotensin II receptor blockers, BMI body mass index, BP blood pressure, BUN blood urea nitrogen, CCB calcium channel blockers, CHF chronic heart failure, Cre creatinine, eGFR estimated glomerular filtration rate, HFpEF heart failure with preserved ejec-tion fraction, HFrEF heart failure with reduced ejection fraction, K potassium, LA left artrium, LAD left atrial dimension, LDL-C low-density lipoprotein cholesterol, LV left ventricle, LVDd left ventricular end-diastolic dimension, LVEF left ventricular ejection fraction, Na sodium, NYHA New York Heart Associa-tion
HFpEF (N = 2893) Borderline HFpEF (N = 666)
HFrEF (N = 742) P value
LVEF (%) 65.2 ± 9.0 45.4 ± 2.6 31.8 ± 6.3 < 0.001Age (years) 69.3 ± 12.2 68.1 ± 11.9 66.8 ± 12.6 < 0.001Female sex (N, %) 1042 (36) 179 (27) 172 (23) < 0.001BMI (kg/m2) 23.9 ± 3.9 23.7 ± 3.9 23.1 ± 4.0 < 0.001NYHA class III/IV (N, %) 261 (9) 71 (11) 134 (18) < 0.001Smoking (N, %) 1231 (45) 302 (48) 370 (53) < 0.001Etiology of CHF (N, %) Ischemic heart disease 1346 (47) 347 (52) 373 (50) 0.014 Dilated cardiomyopathy 225 (8) 146 (22) 239 (32) < 0.001 Hypertrophic cardiomyopathy 106 (4) 10 (2) 10 (1) < 0.001 Hypertensive heart disease 680 (24) 94 (14) 66 (9) < 0.001 Valvular heart disease 358 (12) 37 (6) 33 (4) < 0.001
Previous history (N, %) Admission for heart failure 1380 (48) 408 (61) 567 (76) < 0.001 Hypertension 2621 (91) 598 (90) 630 (85) < 0.001 Diabetes mellitus 1102 (38) 265 (40) 316 (43) 0.077 Dyslipidemia 2349 (81) 543 (82) 609 (82) 0.869 Cerebral vascular disease 584 (20) 143 (21) 137 (18) 0.360 Malignant disease 406 (14) 85 (13) 82 (11) 0.091 Myocardial infarction 846 (29) 276 (41) 293 (39) < 0.001 Atrial fibrillation 1242 (43) 271 (41) 273 (37) 0.009
Hemodynamics and LV function Systolic BP (mmHg) 127.9 ± 18.6 125.3 ± 19.1 118.5 ± 19.4 < 0.001 Diastolic BP (mmHg) 72.6 ± 11.9 72.2 ± 12.4 69.9 ± 12.0 < 0.001 Heart rate (bpm) 71.6 ± 14.5 73.3 ± 14.7 73.9 ± 15.6 < 0.001 LAD (mm) 42.4 ± 9.3 42.8 ± 8.6 44.0 ± 8.9 < 0.001 LVDd (mm) 49.1 ± 7.4 55.5 ± 7.9 61.9 ± 9.2 < 0.001
Laboratory findings Hemoglobin (g/dl) 13.1 ± 2.0 13.2 ± 2.1 13.3 ± 2.0 0.023 Albumin (mg/dl) 4.1 ± 0.5 4.0 ± 0.5 4.0 ± 0.5 0.008 Na (mEq/l) 141.1 ± 2.7 140.9 ± 2.8 140.4 ± 3.0 < 0.001 K (mEq/l) 4.4 ± 0.4 4.4 ± 0.5 4.4 ± 0.5 0.039 LDL-C (mg/dl) 104.9 ± 30.2 104.8 ± 31.2 107.4 ± 32.8 0.222 BUN (mg/dl) 19.5 ± 9.7 20.3 ± 9.8 21.9 ± 12.2 < 0.001 Cre (mg/dl) 1.0 ± 0.7 1.1 ± 0.7 1.2 ± 1.0 < 0.001 eGFR (ml/min/1.73 m2) 61.5 ± 21.0 60.1 ± 21.6 58.4 ± 22.0 0.001
Medications (N, %) Beta-blockers 1260 (44) 419 (63) 513 (69) < 0.001 ACE-I/ARB 2047 (71) 516 (77) 598 (81) < 0.001 Aldosterone antagonists 574 (20) 201 (30) 318 (43) < 0.001 Loop diuretics 1338 (46) 401 (60) 559 (75) < 0.001 CCB 1289 (45) 187 (28) 131 (18) < 0.001 Digitalis 698 (24) 152 (23) 219 (30) 0.005 Statins 1074 (37) 264 (40) 289 (39) 0.376 Antiplatelets 1707 (59) 419 (63) 439 (59) 0.171 Warfarin 1121 (39) 278 (42) 339 (46) 0.002
1001Heart and Vessels (2018) 33:997–1007
1 3
anemia; HR was higher in HFrEF patients with AF or ane-mia compared with those without AF or anemia (Table 3).
Risk stratification by BNP levels
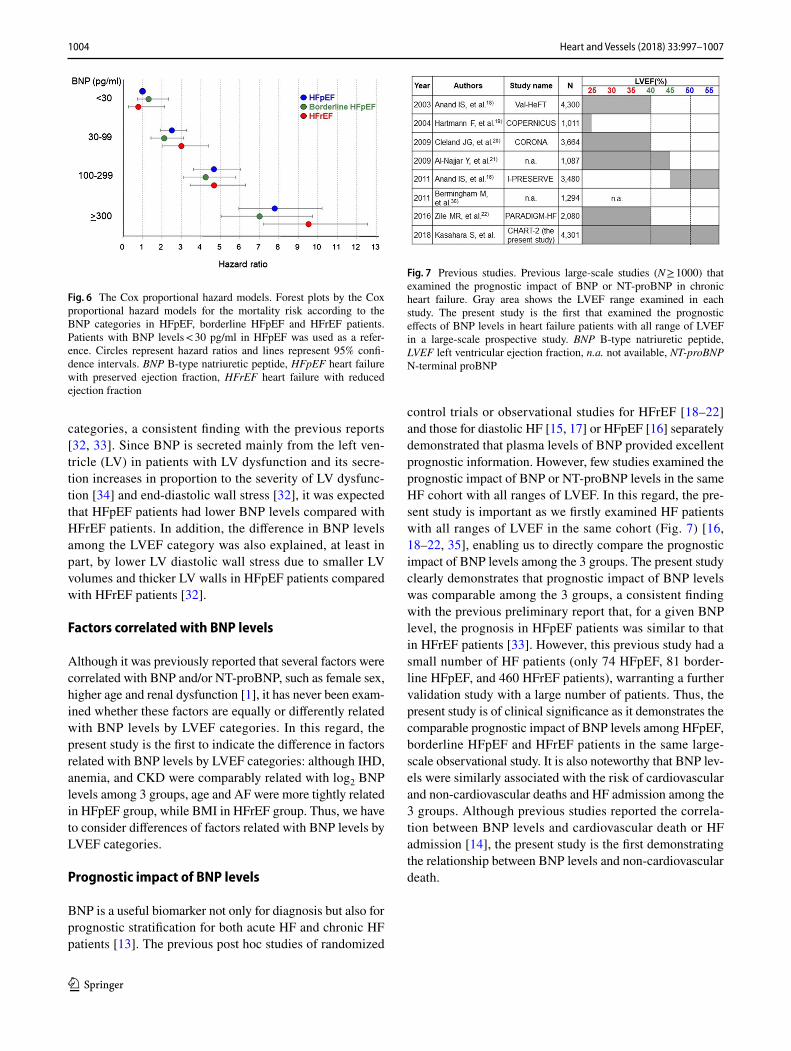
The survival CART analysis effectively stratified the mor-tality risk with the first BNP cutoff value 102.7 pg/ml, and then with second cutoff values, 28.6 and 332.2 pg/ml. With these 3 cutoff values, the study population was successfully divided into 4 groups with morality rang-ing from 16.2 to 136.3 per 1000 person-year (Fig. 4). Based on these cutoff values, we set the BNP cutoff val-ues as 30, 100 and 300 pg/ml in the present study. The Kaplan–Meier curves showed that the mortality risk of HF patients was clearly defined in all 4 subsets in the 3 groups (Fig. 5). The Cox proportional hazards models showed that, as compared with patients with BNP lev-els < 30 pg/ml in HFpEF, those with BNP levels < 30 pg/ml in borderline HFpEF and HFrEF had comparable mortality risk (HR 1.31 in borderline HFpEF, P = 0.355 and 0.78 in HFrEF, P = 0.630), and those with 30–99, 100–299 and ≥ 300 pg/ml had comparably increased mor-tality in HFpEF (HR 2.5, 4.7 and 7.8), borderline HFpEF (HR 2.1, 4.2 and 7.0) and HFrEF (HR 3.0, 4.7 and 9.5), respectively, all P < 0.001 (Fig. 6).
Fig. 2 Distribution of BNP levels in HF patients by LVEF categories. Violin and box plots showing the BNP levels in HFpEF, borderline HFpEF and HFrEF patients. The density trace of violin plots shows the distribution of BNP levels. The box plots show the median (line in center), the first through the third Qs (solid, vertical band) of BNP levels. The Y-axis represents BNP levels. BNP B-type natriuretic pep-tide, HF heart failure, HFpEF heart failure with preserved ejection fraction, HFrEF heart failure with reduced ejection fraction, Q inter quantile range
Tabl
e 2
Fac
tors
rela
ted
to lo
g 2 B
NP
leve
ls
AF a
trial
fibr
illat
ion,
BM
I bo
dy m
ass
inde
x, C
KD
chr
onic
kid
ney
dise
ase,
HFp
EF h
eart
failu
re w
ith p
rese
rved
eje
ctio
n fr
actio
n, H
FrEF
hea
rt fa
ilure
with
red
uced
eje
ctio
n fr
actio
n, I
HD
is
chem
ic h
eart
dise
ase,
LVE
F le
ft ve
ntric
ular
eje
ctio
n fr
actio
n, N
a so
dium
, NYH
A N
ew Y
ork
Hea
rt A
ssoc
iatio
n, S
E st
anda
rd e
rror
HFp
EFB
orde
rline
HFp
EFH
FrEF
P va
lue
Estim
ate
SEP
valu
eEs
timat
eSE
P va
lue
Estim
ate
SEP
valu
eH
FpEF
vs.
bor-
derli
ne H
FpEF
Bor
derli
ne
HFp
EF v
s. H
FrEF
HFp
EF v
s. H
FrEF
Age
(yea
rs/1
0)0.
360.
03<
0.0
010.
210.
06<
0.0
010.
090.
050.
082
0.02
50.
143
< 0
.001
Fem
ale
sex
0.28
0.06
< 0
.001
0.36
0.15
0.01
60.
010.
150.
963
0.61
10.
090
0.08
9B
MI (
kg/m
2 /10)
− 0
.35
0.08
< 0
.001
− 0
.51
0.17
0.00
3−
1.0
60.
16<
0.0
010.
394
0.01
6<
0.0
01N
YH
A II
I/IV
0.29
0.10
0.00
60.
990.
21<
0.0
010.
590.
16<
0.0
010.
003
0.12
10.
111
IHD
− 0
.18
0.07
0.00
60.
080.
140.
571
0.03
0.13
0.79
10.
093
0.81
10.
137
AF
0.96
0.06
< 0
.001
0.54
0.14
< 0
.001
0.45
0.13
< 0
.001
0.00
50.
655
< 0
.001
Ane
mia
0.54
0.07
< 0
.001
0.34
0.15
0.02
00.
490.
13<
0.0
010.
201
0.43
10.
744
CKD
0.36
0.06
< 0
.001
0.44
0.14
0.00
20.
180.
130.
164
0.62
40.
159
0.18
0
1002 Heart and Vessels (2018) 33:997–1007
1 3
Fig. 3 Comparative prognostic effects of BNP in HF patients. Prognostic effects of BNP levels for all-cause death (a), cardiovascular death (b), non-cardiovascular death (c), and admission for heart failure (d) were almost comparable among the HFpEF (blue), borderline HFpEF (green), and HFrEF (red) patients. Vertical lines rep-resent 95% confidence intervals. BNP B-type natriuretic peptide, HF heart failure, HFpEF heart failure with preserved ejection fraction, HFrEF heart failure with reduced ejection fraction
Table 3 Prognostic impact of log2 BNP levels and interactions with LVEF in overall and subgroups
AF atrial fibrillation, BMI body mass index, CI confidence interval, CKD chronic kidney disease, HFpEF heart failure with preserved ejection fraction, HFrEF heart failure with reduced ejection fraction, HR hazard ratio, IHD ischemic heart disease, LVEF left ventricular ejection frac-tion, NYHA New York Heart Association
All HFpEF Borderline HFpEF HFrEF P value for interaction with LVEFHR (95% CI) P value HR (95% CI) P value HR (95% CI) P value HR (95% CI) P value
Overall 1.46 (1.41–1.51) < 0.001 1.46 (1.40–1.53) < 0.001 1.41 (1.30–1.54) < 0.001 1.46 (1.35–1.57) < 0.001 0.300Age < 75
(years)1.51 (1.44–1.59) < 0.001 1.45 (1.35–1.56) < 0.001 1.46 (1.30–1.65) < 0.001 1.47 (1.33–1.62) < 0.001 0.429
Age ≥ 75 (years)
1.28 (1.22–1.34) < 0.001 1.27 (1.20–1.34) < 0.001 1.24 (1.08–1.41) 0.002 1.34 (1.19–1.51) < 0.001 0.237
Male sex 1.49 (1.43–1.54) < 0.001 1.48 (1.41–1.56) < 0.001 1.52 (1.38–1.69) < 0.001 1.47 (1.35–1.60) < 0.001 0.563Female sex 1.40 (1.32–1.49) < 0.001 1.45 (1.35–1.56) < 0.001 1.18 (1.01–1.38) 0.042 1.44 (1.21–1.70) < 0.001 0.620BMI ≥ 23.5 (kg/
m2)1.45 (1.37–1.53) < 0.001 1.42 (1.34–1.52) < 0.001 1.39 (1.22–1.58) < 0.001 1.62 (1.40–1.88) < 0.001 0.163
BMI < 23.5 (kg/m2)
1.42 (1.36–1.48) < 0.001 1.47 (1.39–1.56) < 0.001 1.37 (1.21–1.54) < 0.001 1.33 (1.22–1.47) < 0.001 0.883
NYHA I/II 1.44 (1.39–1.49) < 0.001 1.45 (1.38–1.51) < 0.001 1.38 (1.25–1.52) < 0.001 1.42 (1.30–1.55) < 0.001 0.509NYHA III/IV 1.31 (1.22–1.41) < 0.001 1.37 (1.23–1.53) < 0.001 1.16 (0.96–1.40) 0.114 1.46 (1.24–1.71) < 0.001 0.690(−) IHD 1.43 (1.36–1.49) < 0.001 1.44 (1.36–1.53) < 0.001 1.38 (1.22–1.57) < 0.001 1.39 (1.25–1.55) < 0.001 0.702(+) IHD 1.50 (1.43–1.56) < 0.001 1.51 (1.42–0.60) < 0.001 1.44 (1.28–1.61) < 0.001 1.53 (1.38–1.70) < 0.001 0.352(−) AF 1.48 (1.42–1.55) < 0.001 1.51 (1.43–1.60) < 0.001 1.51 (1.35–1.69) < 0.001 1.41 (1.28–1.54) < 0.001 0.568(+) AF 1.39 (1.32–1.47) < 0.001 1.36 (1.27–1.46) < 0.001 1.23 (1.08–1.41) 0.002 1.55 (1.36–1.76) < 0.001 0.008(−) Anemia 1.47 (1.40–1.54) < 0.001 1.42 (1.34–1.52) < 0.001 1.52 (1.33–1.74) < 0.001 1.39 (1.27–1.53) < 0.001 0.806(+) Anemia 1.32 (1.27–1.39) < 0.001 1.34 (1.26–1.42) < 0.001 1.20 (1.07–1.35) 0.001 1.53 (1.34–1.74) < 0.001 0.044(−) CKD 1.45 (1.38–1.53) < 0.001 1.41 (1.31–1.51) < 0.001 1.50 (1.29–1.74) < 0.001 1.45 (1.29–1.64) < 0.001 0.346(+) CKD 1.38 (1.32–1.44) < 0.001 1.39 (1.32–1.47) < 0.001 1.29 (1.16–1.44) < 0.001 1.42 (1.29–1.57) < 0.001 0.145

1003Heart and Vessels (2018) 33:997–1007
1 3
Discussion
The present study is the first to compare the prognostic impact of BNP levels among HFpEF, borderline HFpEF and HFrEF in the same large-scale prospective observa-tional study. The results clearly demonstrated that, despite the different distribution of BNP levels, the prognostic impact of BNP levels was comparable among the 3 groups,
providing the useful BNP cutoff values for long-term prog-nosis of HF patients in the 3 groups.
Distribution of BNP levels in HF patients by LVEF categories
The present study demonstrates that distribution of BNP levels differed among the 3 groups of HF patients by LVEF
Fig. 4 Optimal BNP cutoff val-ues. The survival CART analy-sis identified the primary and subsequent optimal BNP cutoff values (28.6, 102.7, 332.2 pg/ml) to partition the patients by median 6.3-year mortality risk. The mortality per 1000 person-year in each subgroup is shown in the upper line in the box. BNP B-type natriuretic peptide, CART classification and regres-sion trees, p-y pearson-year
Fig. 5 Mortality risk strati-fication by BNP categories. Kaplan–Meier curves for mor-tality in patients with HFpEF (left panel), borderline HFpEF (middle panel), and HFrEF (right panel) according to BNP levels < 30 (blue), 30–99 (green), 100–299 (yellow) and ≥ 300 pg/ml (red), respec-tively. BNP B-type natriuretic peptide, HFpEF heart failure with preserved ejection frac-tion, HFrEF heart failure with reduced ejection fraction
1004 Heart and Vessels (2018) 33:997–1007
1 3
categories, a consistent finding with the previous reports [32, 33]. Since BNP is secreted mainly from the left ven-tricle (LV) in patients with LV dysfunction and its secre-tion increases in proportion to the severity of LV dysfunc-tion [34] and end-diastolic wall stress [32], it was expected that HFpEF patients had lower BNP levels compared with HFrEF patients. In addition, the difference in BNP levels among the LVEF category was also explained, at least in part, by lower LV diastolic wall stress due to smaller LV volumes and thicker LV walls in HFpEF patients compared with HFrEF patients [32].
Factors correlated with BNP levels
Although it was previously reported that several factors were correlated with BNP and/or NT-proBNP, such as female sex, higher age and renal dysfunction [1], it has never been exam-ined whether these factors are equally or differently related with BNP levels by LVEF categories. In this regard, the present study is the first to indicate the difference in factors related with BNP levels by LVEF categories: although IHD, anemia, and CKD were comparably related with log2 BNP levels among 3 groups, age and AF were more tightly related in HFpEF group, while BMI in HFrEF group. Thus, we have to consider differences of factors related with BNP levels by LVEF categories.
Prognostic impact of BNP levels
BNP is a useful biomarker not only for diagnosis but also for prognostic stratification for both acute HF and chronic HF patients [13]. The previous post hoc studies of randomized
control trials or observational studies for HFrEF [18–22] and those for diastolic HF [15, 17] or HFpEF [16] separately demonstrated that plasma levels of BNP provided excellent prognostic information. However, few studies examined the prognostic impact of BNP or NT-proBNP levels in the same HF cohort with all ranges of LVEF. In this regard, the pre-sent study is important as we firstly examined HF patients with all ranges of LVEF in the same cohort (Fig. 7) [16, 18–22, 35], enabling us to directly compare the prognostic impact of BNP levels among the 3 groups. The present study clearly demonstrates that prognostic impact of BNP levels was comparable among the 3 groups, a consistent finding with the previous preliminary report that, for a given BNP level, the prognosis in HFpEF patients was similar to that in HFrEF patients [33]. However, this previous study had a small number of HF patients (only 74 HFpEF, 81 border-line HFpEF, and 460 HFrEF patients), warranting a further validation study with a large number of patients. Thus, the present study is of clinical significance as it demonstrates the comparable prognostic impact of BNP levels among HFpEF, borderline HFpEF and HFrEF patients in the same large-scale observational study. It is also noteworthy that BNP lev-els were similarly associated with the risk of cardiovascular and non-cardiovascular deaths and HF admission among the 3 groups. Although previous studies reported the correla-tion between BNP levels and cardiovascular death or HF admission [14], the present study is the first demonstrating the relationship between BNP levels and non-cardiovascular death.
Fig. 6 The Cox proportional hazard models. Forest plots by the Cox proportional hazard models for the mortality risk according to the BNP categories in HFpEF, borderline HFpEF and HFrEF patients. Patients with BNP levels < 30 pg/ml in HFpEF was used as a refer-ence. Circles represent hazard ratios and lines represent 95% confi-dence intervals. BNP B-type natriuretic peptide, HFpEF heart failure with preserved ejection fraction, HFrEF heart failure with reduced ejection fraction
Fig. 7 Previous studies. Previous large-scale studies (N ≥ 1000) that examined the prognostic impact of BNP or NT-proBNP in chronic heart failure. Gray area shows the LVEF range examined in each study. The present study is the first that examined the prognostic effects of BNP levels in heart failure patients with all range of LVEF in a large-scale prospective study. BNP B-type natriuretic peptide, LVEF left ventricular ejection fraction, n.a. not available, NT-proBNP N-terminal proBNP

1005Heart and Vessels (2018) 33:997–1007
1 3
Subgroup analysis
The present study is the first to compare prognostic impact of BNP levels among HFpEF, borderline HFpEF and HFrEF patients registered by subgroups divided by the factors related with BNP levels. Importantly, the results clearly showed that 3 groups had generally no interaction with log2 BNP levels for prognostic impact in each subgroup, underlining the clinical utility of BNP regardless of LVEF categories. However, we should remember that, although BNP levels are comparably related with prognosis among HFpEF, borderline HFpEF and HFrEF patients, AF and ane-mia, factors closely related with BNP levels, may weaken the comparability in prognostic impact of BNP levels. Hemody-namic changes related to AF or anemia (e.g., tachycardia) might have affected the prognostic impact of BNP in HFrEF patients.
Risk stratification with BNP levels
The present study has another strength as the survival CART analysis effectively demonstrated the practical BNP cutoff values for prognostic risk stratification. In the present study, the prognosis of HF patients was clearly stratified into 4 cat-egories depending on the BNP levels. Previous studies also reported that the prognosis of HF patients was predictable by BNP or NT-proBNP levels [15–22, 33, 36]. However, BNP cutoff values in these studies varied and any optimal cutoff value was not established [14], because the subjects were stereotypically divided based on half [19], tertile [20], quartile [16–18, 21, 33] or quintile [36] points of the BNP or NT-proBNP values, the point for diagnosis of HF [15, 33], or the point based on previous and ongoing studies [22]. In the present study, the survival CART analysis enabled us to determine the clinically meaningful cutoff values to effec-tively stratify the risk among the 3 groups. In particular, it should be noted that the lowest BNP cutoff value was as low as 30 pg/ml and that subpopulation with BNP level < 30 pg/ml in the HFpEF group could serve as a reference category for all the HF cohorts. Thus, we believe that the BNP cutoff values established in the present study (30, 100, and 300 pg/ml) could be widely applicable to HF patients of all ranges of LVEF.
Study limitations
Several limitations should be mentioned for the present study. First, in the present study, we used the clinical data at enrollment in the CHART-2 Study and did not take into consideration the temporal changes in BNP levels during the follow-up period. Second, although the measurement of BNP levels was pre-specified in the CHART-2 Study, the measurement was done in each participating hospital. Thus,
possible sampling and/or measurement bias should be taken into consideration when interpreting the present findings. Third, we did not use information on chronic obstructive pulmonary disease, which was an important comorbidity of HF patients, because of insufficient reliability. Finally, as the CHART-2 Study is a prospective observational study for HF in Japan and has a larger proportion of HFpEF patients as compared with the previous studies in the Western coun-tries, cautions should be taken when generalizing the present findings to other populations and validation studies in other countries should be performed.
Conclusions
In the present study with a sufficient number of HF patients and a long follow-up period (median 6.3 years), we demon-strated that BNP levels have comparable prognostic impact among HFpEF, borderline HFpEF and HFrEF patients, despite the distribution of BNP levels differs among the groups. Furthermore, we proposed the practical BNP cutoff values, which were commonly useful to stratify the mortal-ity risk in all the 3 groups of HF patients. Further valida-tion studies in various settings are warranted to confirm our present findings.
Acknowledgements We thank all the members of the Tohoku Heart Failure Association and the staff of the Departments of Cardiovascular Medicine and Evidence-based Cardiovascular Medicine, Tohoku Uni-versity Graduate School of Medicine, for their contributions.
The CHART-2 Study investigators: Executive committee: Hiroaki Shimokawa (Chair), Mitsumasa Fukuchi, Toshikazu Goto, Eiji Nozaki, Tetsuya Hiramoto, Satoru Horiguchi, Kanichi Inoue, Atsushi Kato, Hiroshi Kato, Masatoshi Ohe, Tsuyoshi Shinozaki, and Masafumi Sugi. Steering committee: Tetsuya Hiramoto, Kanichi Inoue, Atsushi Kato, Masahiko Ogata, Shoichi Sato, and Masafumi Sugi. Collabo-rating hospitals and active investigators by prefecture: Aomori pre-fecture: Shigeto Oyama, and Jun Demachi (Towada City Hospital). Iwate prefecture: Eiji Nozaki, Akihiro Nakamura, Tohru Takahashi, Hideaki Endo, Masateru Kondo, Kazuki Noda, Masanori Kanaz-awa, and Kenjiro Sato (Iwate Prefectural Central Hospital). Makoto Nakagawa, Tetsuji Nozaki, and Takuya Yagi (Iwate Prefectural Isawa Hospital). Akita prefecture: Toshiaki Takahashi, Satoru Horiguchi, Etsuko Fushimi, Kohei Fukahori, Satoru Takeda, and Sota Naka-jima (Hiraka General Hospital). Yamagata prefecture: Masatoshi Ohe, Takurou Tashima, Katsuhiko Sakurai, and Tadashi Kobayashi (Kojirakawa Shiseido Hospital). Toshikazu Goto, Motoyuki Matsui, Yoshiaki Tamada, Tomoyasu Yahagi, Akio Fukui, Katsuaki Taka-hashi, Shigehiko Kato, and Hyuma Daidouji (Yamagata Prefectural Central Hospital). Miyagi prefecture: Akihiko Sugimura and Junko Ohashi (Sendai Red Cross Hospital). Hiroyuki Kanno and Junji Kaneko (Katta General Hospital). Shu Suzuki and Osamu Kitamukai (KKR Tohoku Kosai Hospital). Dai Katayose (Miyagi Rifu Ekisaikai Hos-pital). Kaoru Iwabuchi, Sachio Onodera, Seiji Komatsu, Masanobu Chida, Masaharu Takeuchi, Hirokazu Yahagi, and Nozomu Takahashi (Osaki Citizen Hospital). Keiji Otsuka, Yoshito Koseki, and Masaki Morita (Saito Hospital). Tsuyoshi Shinozaki, Takeshi Ishizuka, Noriko Onoue, Nobuhiro Yamaguchi, and Hiroshi Fujita (Sendai Medical Center). Atsushi Kato, Shigeto Namiuchi, Tadashi Sugie, Toru Takii,
1006 Heart and Vessels (2018) 33:997–1007
1 3
and Ryoichi Ushigome (Sendai Open Hospital). Yasuharu Matsumoto (Shizugawa Public Hospital). Kanichi Inoue, Jiro Koyama, Tomoko Tomioka, Hiroki Shioiri, and Yoshitaka Ito (South Miyagi Medical Center). Mitsuaki Tanaka, Chikako Takahashi, and Akiko Kawana (Tohoku Rosai Hospital). Tetsuya Hiramoto (Kurihara Central Hospi-tal). Yasuhiko Sakata, Kenta Ito, Masaharu Nakayama, Koji Fukuda, Jun Takahashi, Satoshi Miyata, Koichiro Sugimura, Kimio Sato, Yasu-haru Matsumoto, Makoto Nakano, Takashi Shiroto, Kotaro Nochioka, Masanobu Miura, Hiroaki Yamamoto, Tatsuo Aoki, Kiyotaka Hao, Shunsuke Tatebe, Saori Yamamoto, Yoku Kikuchi, Hideaki Suzuki, Shigeo Godo, Kensuke Nishimiya, Nobuhiro Yaoita, and Tomohiko Shindou (Tohoku University Hospital). Fukushima prefecture: Masa-fumi Sugi, Yoshito Yamamoto, Sunao Toda, Yusuke Takagi, Kentaro Aizawa, Taro Nihei, and Masato Segawa (Iwaki Kyouritsu Hospi-tal). Koji Fukuda (Watanabe Hospital). Head office and coordinating center: Yasuhiko Sakata, Jun Takahashi, Satoshi Miyata, Takashi Shi-roto, Kotaro Nochioka, Masanobu Miura, Takeshi Yamauchi, Kanako Tsuji, Takeo Onose, Ruri Abe, Takuya Oikawa, Shintaro Kasahara, Masayuki Sato, Hajime Aoyanagi, Chiharu Saga, Yoko Yamada, Junko Kimura, Hiromi Ogino, Izumi Oikawa, Sanae Watanabe, Yasuko Ikeno, Tomoyuki Suzuki, and Hiroko Hamada.
Compliance with ethical standards
Funding This study was supported in part by the Grants-in Aid from the Japanese Ministry of Health, Labour, and Welfare and the Japa-nese Ministry of Education, Culture, Sports, Science, and Technol-ogy and the Agency for Medical Research and Development (nos. 15ek0210043h0001, 16ek0210056h0001, 6ek0210043h0002), Tokyo, Japan.
Conflict of interest The Department of Evidence-based Cardiovas-cular Medicine, Tohoku University Graduate School of Medicine is supported in part by unrestricted research grants from Daiichi San-kyo (Tokyo, Japan), Bayer Yakuhin (Osaka, Japan), Kyowa Hakko Kirin (Tokyo, Japan), Novartis Pharma (Tokyo, Japan), Dainippon Sumitomo Pharma (Osaka, Japan), Astellas Pharma (Tokyo, Japan), AstraZeneca (Osaka, Japan), Chugai Pharmaceutical (Tokyo, Japan), GlaxoSmithKline (Tokyo, Japan), Kowa Pharmaceutical (Tokyo, Ja-pan), Mitsubishi Tanabe Pharma (Osaka, Japan), Mochida Pharmaceu-tical (Tokyo, Japan), MSD (Tokyo, Japan), Nippon Boehringer Ingel-heim (Tokyo, Japan), Otsuka Pharmaceutical (Tokyo, Japan), Shionogi (Osaka, Japan) and Takeda Pharmaceutical (Osaka, Japan). H.S. has received lecture fees from Bayer Yakuhin (Osaka, Japan), Daiichi San-kyo (Tokyo, Japan) and Novartis Pharma (Tokyo, Japan).
References
1. Yancy CW, Jessup M, Bozkurt B, Butler J, Casey DE Jr, Drazner MH, Fonarow GC, Geraci SA, Horwich T, Januzzi JL, Johnson MR, Kasper EK, Levy WC, Masoudi FA, McBride PE, McMur-ray JJ, Mitchell JE, Peterson PN, Riegel B, Sam F, Stevenson LW, Tang WH, Tsai EJ, Wilkoff BL (2013) 2013 ACCF/AHA guide-line for the management of heart failure: executive summary: a report of the American College of Cardiology Foundation/Ameri-can Heart Association Task Force on Practice Guidelines. J Am Coll Cardiol 62:e147–e239
2. Curtis LH, Whellan DJ, Hammill BG, Hernandez AF, Anstrom KJ, Shea AM, Schulman KA (2008) Incidence and prevalence of heart failure in elderly persons, 1994–2003. Arch Intern Med 168:418–424
3. Writing Group Members, Mozaffarian D, Benjamin EJ, Go AS, Arnett DK, Blaha MJ, Cushman M, Das SR, de Ferranti S, Després JP, Fullerton HJ, Howard VJ, Huffman MD, Isasi CR, Jiménez MC, Judd SE, Kissela BM, Lichtman JH, Lisabeth LD, Liu S, Mackey RH, Magid DJ, McGuire DK, Mohler ER 3rd, Moy CS, Muntner P, Mussolino ME, Nasir K, Neumar RW, Nichol G, Palaniappan L, Pandey DK, Reeves MJ, Rodriguez CJ, Rosamond W, Sorlie PD, Stein J, Towfighi A, Turan TN, Virani SS, Woo D, Yeh RW, Turner MB, American Heart Association Statistics Com-mittee; Stroke Statistics Subcommittee (2015) Heart disease and stroke statistics—2016 update a report from the American Heart Association. Circulation 133:e38–e360
4. United Nations, Department of Economic and Social Affairs, Pop-ulation (2017) Division, profiles of aging 2015. https ://esa.un.org/unpd/popde v/Profi lesof agein g2015 /index .html. 29 Oct 2017
5. Gomez-Soto FM, Andrey JL, Garcia-Egido AA, Escobar MA, Romero SP, Garcia-Arjona R, Gutierrez J, Gomez F (2011) Inci-dence and mortality of heart failure: a community-based study. Int J Cardiol 151:40–45
6. Shimokawa H, Miura M, Nochioka K, Sakata Y (2015) Heart failure as a general pandemic in Asia. Eur J Heart Fail 17:884–892
7. Sakata Y, Shimokawa H (2013) Epidemiology of heart failure in Asia. Circ J 77:2209–2217
8. Guo Y, Lip GY, Banerjee A (2013) Heart failure in East Asia. Curr Cardiol Rev 9:112–122
9. Pillai HS, Ganapathi S (2013) Heart failure in South Asia. Curr Cardiol Rev 9:102–111
10. Gerber Y, Weston SA, Redfield MM, Chamberlain AM, Mane-mann SM, Jiang R, Killian JM, Roger VL (2015) A contemporary appraisal of the heart failure epidemic in Olmsted County, Min-nesota, 2000 to 2010. JAMA Intern Med 175:996–1004
11. Komajda M, Lam CS (2014) Heart failure with preserved ejection fraction: a clinical dilemma. Eur Heart J 35:1022–1032
12. Pitt B, Pfeffer MA, Assmann SF, Boineau R, Anand IS, Clag-gett B, Clausell N, Desai AS, Diaz R, Fleg JL, Gordeev I, Harty B, Heitner JF, Kenwood CT, Lewis EF, O’Meara E, Probstfield JL, Shaburishvili T, Shah SJ, Solomon SD, Sweitzer NK, Yang S, McKinlay SM, Investigators TOPCAT (2014) Spironolactone for heart failure with preserved ejection fraction. N Engl J Med 370:1383–1392
13. Francis GS, Felker GM, Tang WH (2016) A test in context: criti-cal evaluation of natriuretic peptide testing in heart failure. J Am Coll Cardiol 67:330–337
14. Oremus M, Don-Wauchope A, McKelvie R, Santaguida PL, Hill S, Balion C, Booth R, Brown JA, Ali U, Bustamam A, Sohel N, Raina P (2014) BNP and NT-proBNP as prognostic mark-ers in persons with chronic stable heart failure. Heart Fail Rev 19:471–505
15. Grewal J, McKelvie RS, Persson H, Tait P, Carlsson J, Swedberg K, Ostergren J, Lonn E (2008) Usefulness of N-terminal pro-brain natriuretic peptide and brain natriuretic peptide to predict cardio-vascular outcomes in patients with heart failure and preserved left ventricular ejection fraction. Am J Cardiol 102:733–737
16. Anand IS, Rector TS, Cleland JG, Kuskowski M, McKelvie RS, Persson H, McMurray JJ, Zile MR, Komajda M, Massie BM, Carson PE (2011) Prognostic value of baseline plasma amino-terminal pro-brain natriuretic peptide and its interactions with irbesartan treatment effects in patients with heart failure and pre-served ejection fraction findings from the I-PRESERVE Trial. Circ Heart Fail 4:569–577
17. Cleland JG, Taylor J, Freemantle N, Goode KM, Rigby AS, Ten-dera M (2012) Relationship between plasma concentrations of N-terminal pro brain natriuretic peptide and the characteristics and outcome of patients with a clinical diagnosis of diastolic heart failure: a report from the PEP-CHF Study. Eur J Heart Fail 14:487–494

1007Heart and Vessels (2018) 33:997–1007
1 3
18. Anand IS, Fisher LD, Chiang YT, Latini R, Masson S, Maggioni AP, Glazer RD, Tognoni G, Cohn JN, Investigators Val-HeFT (2003) Changes in brain natriuretic peptide and norepinephrine over time and mortality and morbidity in the Valsartan Heart Fail-ure Trial (Val-HeFT). Circulation 107:1278–1283
19. Hartmann F, Packer M, Coats AJ, Fowler MB, Krum H, Mohacsi P, Rouleau JL, Tendera M, Castaigne A, Anker SD, Amann-Zalan I, Hoersch S, Katus HA (2004) Prognostic impact of plasma N-terminal pro-brain natriuretic peptide in severe chronic con-gestive heart failure: a substudy of the Carvedilol Prospective Randomized Cumulative Survival (COPERNICUS) trial. Circula-tion 110:1780–1786
20. Cleland JG, McMurray JJ, Kjekshus J, Cornel JH, Dunselman P, Fonseca C, Hjalmarson A, Korewicki J, Lindberg M, Ran-jith N, van Veldhuisen DJ, Waagstein F, Wedel H, Wikstrand J, CORONA Study Group (2009) Plasma concentration of amino-terminal pro-brain natriuretic peptide in chronic heart failure: pre-diction of cardiovascular events and interaction with the effects of rosuvastatin: a report from CORONA (Controlled Rosuvas-tatin Multinational Trial in Heart Failure). J Am Coll Cardiol 54:1850–1859
21. Al-Najjar Y, Goode KM, Zhang J, Cleland JG, Clark AL (2009) Red cell distribution width: an inexpensive and powerful prognos-tic marker in heart failure. Eur J Heart Fail 11:1155–1162
22. Zile MR, Claggett BL, Prescott MF, McMurray JJ, Packer M, Rouleau JL, Swedberg K, Desai AS, Gong J, Shi VC, Solomon SD (2016) Prognostic implications of changes in N-terminal pro-B-type natriuretic peptide in patients with heart failure. J Am Coll Cardiol 68:2425–2436
23. Lam CS, Solomon SD (2014) The middle child in heart failure: heart failure with mid-range ejection fraction (40–50%). Eur J Heart Fail 16:1049–1055
24. Tsuji K, Sakata Y, Nochioka K, Miura M, Yamauchi T, Onose T, Abe R, Oikawa T, Kasahara S, Sato M, Shiroto T, Takahashi J, Miyata S, Shimokawa H, On behalf of the CHART-2 investigators (2017) Characterization of heart failure patients with mid-range left ventricular ejection fraction—a report from the CHART-2 Study. Eur J Heart Fail 19:1258–1269
25. Shiba N, Nochioka K, Miura M, Kohno H, Shimokawa H, CHART-2 Investigators (2011) Trend of westernization of etiol-ogy and clinical characteristics of heart failure patients in Japan—first report from the CHART-2 Study. Circ J 75:823–833
26. Ushigome R, Sakata Y, Nochioka K, Miyata S, Miura M, Tadaki S, Yamauchi T, Sato K, Onose T, Tsuji K, Abe R, Oikawa T, Kasahara S, Takahashi J, Shimokawa H, CHART-2 Investiga-tors (2015) Temporal trends in clinical characteristics, manage-ment and prognosis of patients with symptomatic heart failure in Japan—report from the CHART studies. Circ J 79:2396–2407
27. Miyata S, Sakata Y, Miura M, Yamauchi T, Onose T, Tsuji K, Abe R, Oikawa T, Kasahara S, Sato M, Nochioka K, Shiroto T, Takahashi J, Shimokawa H, On behalf of the CHART-2 investiga-tors (2017) Long-term prognostic impact of the Great East Japan earthquake in patients with cardiovascular disease—report from the CHART-2 Study. J Cardiol 70:286–296
28. Takada T, Sakata Y, Miyata S, Takahashi J, Nochioka K, Miura M, Tadaki S, Shimokawa H (2014) Impact of elevated heart rate on clinical outcomes in patients with heart failure with reduced and preserved ejection fraction—a report from the CHART-2 Study. Eur J Heart Fail 16:309–316
29. Schou M, Gustafsson F, Corell P, Kistorp CN, Kjaer A, Hilde-brandt PR (2007) The relationship between N-terminal pro-brain natriuretic peptide and risk for hospitalization and mortality is curvilinear in patients with chronic heart failure. Am Heart J 154:123–129
30. Lemon SC, Roy J, Clark MA, Friedmann PD, Rakowski W (2003) Classification and regression tree analysis in public health: meth-odological review and comparison with logistic regression. Ann Behav Med 26:172–181
31. R Core Team (2016) R: a language and environment for statistical computing. R Foundation for Statistical Computing, Vienna. https ://www.R-proje ct.org/
32. Iwanaga Y, Nishi I, Furuichi S, Noguchi T, Sase K, Kihara Y, Goto Y, Nonogi H (2006) B-type natriuretic peptide strongly reflects diastolic wall stress in patients with chronic heart failure: comparison between systolic and diastolic heart failure. J Am Coll Cardiol 47:742–748
33. van Veldhuisen DJ, Linssen GC, Jaarsma T, van Gilst WH, Hoes AW, Tijssen JG, Paulus WJ, Voors AA, Hillege HL (2013) B-type natriuretic peptide and prognosis in heart failure patients with preserved and reduced ejection fraction. J Am Coll Cardiol 61:1498–1506
34. Yasue H, Yoshimura M, Sumida H, Kikuta K, Kugiyama K, Jou-gasaki M, Ogawa H, Okumura K, Mukoyama M, Nakao K (1994) Localization and mechanism of secretion of B-type natriuretic peptide in comparison with those of A-type natriuretic peptide in normal subjects and patients with heart failure. Circulation 90:195–203
35. Bermingham M, O’Callaghan E, Dawkins I, Miwa S, Samsudin S, McDonald K, Ledwidge M (2011) Are beta2-agonists respon-sible for increased mortality in heart failure? Eur J Heart Fail 13:885–891
36. Wang TJ, Larson MG, Levy D, Benjamin EJ, Leip EP, Omland T, Wolf PA, Vasan RS (2004) Plasma natriuretic peptide levels and the risk of cardiovascular events and death. N Engl J Med 350:655–663