company note alpha series september 5, 2018 · 2019-04-01 · company note │ alpha series...
TRANSCRIPT
Company Note │ Alpha series Retail│Singapore│September 5, 2018
IMPORTANT DISCLOSURES, INCLUDING ANY REQUIRED RESEARCH CERTIFICATIONS, ARE PROVIDED AT THE END OF THIS REPORT. IF THIS REPORT IS DISTRIBUTED IN THE UNITED STATES IT IS DISTRIBUTED BY CIMB SECURITIES (USA), INC. AND IS CONSIDERED THIRD-PARTY AFFILIATED RESEARCH.
Powered by the EFA Platform
INITIATION
Synagie Corp Ltd Automating e-commerce for global FMCG brands ■ Synagie is one of the fastest-growing providers of e-commerce services in Singapore.
It offers one-stop services to global FMCG clients such as Kimberly-Clark. ■ We expect Synagie to ride on robust e-commerce growth prospects; Frost & Sullivan
projects online BBB industry in SEA to expand by 25.2% CAGR in 2017-22F. ■ Revenue growth drivers for Synagie could come from its expansion in other product
categories, beyond its core BBB segment and outside Singapore. ■ Synagie currently trades below its IPO price of S$0.27 and at CY19F price-to-sales
(P/S) ratio of 2.2x, a 60% discount to its global e-commerce peer average of 5.4x. ■ We initiate coverage on Synagie with an Add call and target price of S$0.34.
One-stop shop for e-commerce services for FMCG brands Established in late 2014, home-grown Synagie now provides e-commerce services to more than 250 fast-moving consumer goods (FMCG) brands – mostly in the body, beauty and baby (BBB) sector. Its suite of services includes setting up a brand’s multi-channel online retail presence on popular marketplaces such as Lazada and Qoo10 and helping to manage its customers’ e-logistics and fulfillment processes via its Synagie Platform, a cloud-based e-commerce and fulfillment platform.
Creating a scalable ecosystem with Insurtech Synagie acquired its profitable Insurtech subsidiary, 1Care Global, in Apr 2018 to enter the third-party administrator (TPA) business. This is Synagie’s third business segment, which would work synergistically with its other two segments – e-commerce and e-logistics. Its Insurtech business could help Synagie expand into the computer, communication and consumer electronics (3C) segment, moving beyond its core BBB space and fits into its asset-light business model, which allows for rapid scalability.
Fastest-growing e-commerce start-up Frost & Sullivan rates Synagie as one of the fastest-growing e-commerce start-ups in Southeast Asia, given its historical revenue CAGR of 551.8% over 2015-17. Although the group is currently loss-making, we project Synagie to deliver c.70.7% revenue CAGR over FY17-20F and achieve positive net profit in FY20F, benefiting from economies of scale.
Riding on robust e-commerce growth prospects in the region According to Frost & Sullivan, the online BBB industry accounted for 13.3% of the e-commerce gross merchandise volume (GMV) in Southeast Asia in 2017 and is expected to grow by 25.2% CAGR over 2017-22F, underpinned by mass-market brands adopting a direct-to-consumer digital strategy comprising online sales channels and high turnover rate for BBB products. We think other revenue growth drivers may come from Synagie’s expansion into other product categories beyond BBB and outside of Singapore.
Initiate with Add and target price of S$0.34 Given that Synagie is still in an early high-growth stage, we project that it would achieve normalised EBITDA of S$4.8m by end-FY23F. With its global peers trading at CY19F EV/EBITDA multiple of c.24x, we apply that multiple and a 10% WACC to our discounted FY23F EBITDA to derive a target price of S$0.34. This implies potential upside of 44.7% at FY19F P/S of 3.1x – c.43% discount to its global peers’ average of 5.4x.
Key risks and potential re-rating catalysts Downside risks include prolonged net losses and cessation of relationships with key brand partners. Potential re-rating catalysts could come from faster-than-expected increase in profitability.
SOURCES: CGS-CIMB RESEARCH, COMPANY REPORTS
Singapore
ADD Consensus ratings*: Buy 1 Hold 0 Sell 0
Current price: S$0.22
Target price: S$0.34
Previous target: N/A
Up/downside: 54.5%
CIMB / Consensus: -24.4%
Reuters: SYNA.SI
Bloomberg: SCL SP
Market cap: US$41.81m
S$57.58m
Average daily turnover: US$0.60m
S$0.82m
Current shares o/s: 261.7m
Free float: 50.3% *Source: Bloomberg
Key changes in this note
N/A
Source: Bloomberg
Price performance 1M 3M 12M
Absolute (%)
Relative (%)
Major shareholders % held Clement Lee 23.7
Centurion Global Ltd 11.6
Helen Chow 7.3
Insert
Analyst(s)
Colin TAN
T (65) 6210 8685 E [email protected]
Financial Summary Dec-16A Dec-17A Dec-18F Dec-19F Dec-20F
Revenue (S$m) 3.68 8.03 18.38 28.52 39.96
Operating EBITDA (S$m) (2.10) (3.04) (2.92) (0.96) 0.82
Net Profit (S$m) (2.27) (3.38) (5.07) (1.41) 0.32
Core EPS (S$) (0.009) (0.013) (0.013) (0.005) 0.001
Core EPS Growth 49.2% (3.0%) (57.1%)
FD Core P/E (x) NA NA NA NA 180.4
DPS (S$) - - - - -
Dividend Yield 0% 0% 0% 0% 0%
EV/EBITDA (x) NA NA NA NA 64.79
P/FCFE (x) NA NA NA NA NA
Net Gearing (33%) 636% (82%) (56%) (41%)
P/BV (x) 424.4 347.4 4.7 5.3 5.2
ROE (473%) (2245%) (53%) (12%) 3%
% Change In Core EPS Estimates
CIMB/consensus EPS (x)
81.0
87.3
93.5
99.8
106.0
0.200
0.220
0.240
0.260
0.280
Price Close Relative to FSSTI (RHS)
5
10
15
20
Aug-18 Aug-18 Aug-18 Aug-18
Vol m
2
Retail│Singapore
Synagie Corp Ltd│September 5, 2018
Automating e-commerce for global FMCG brands
One-stop shop for e-commerce services for certain global FMCG brands
A one-stop provider of e-commerce services
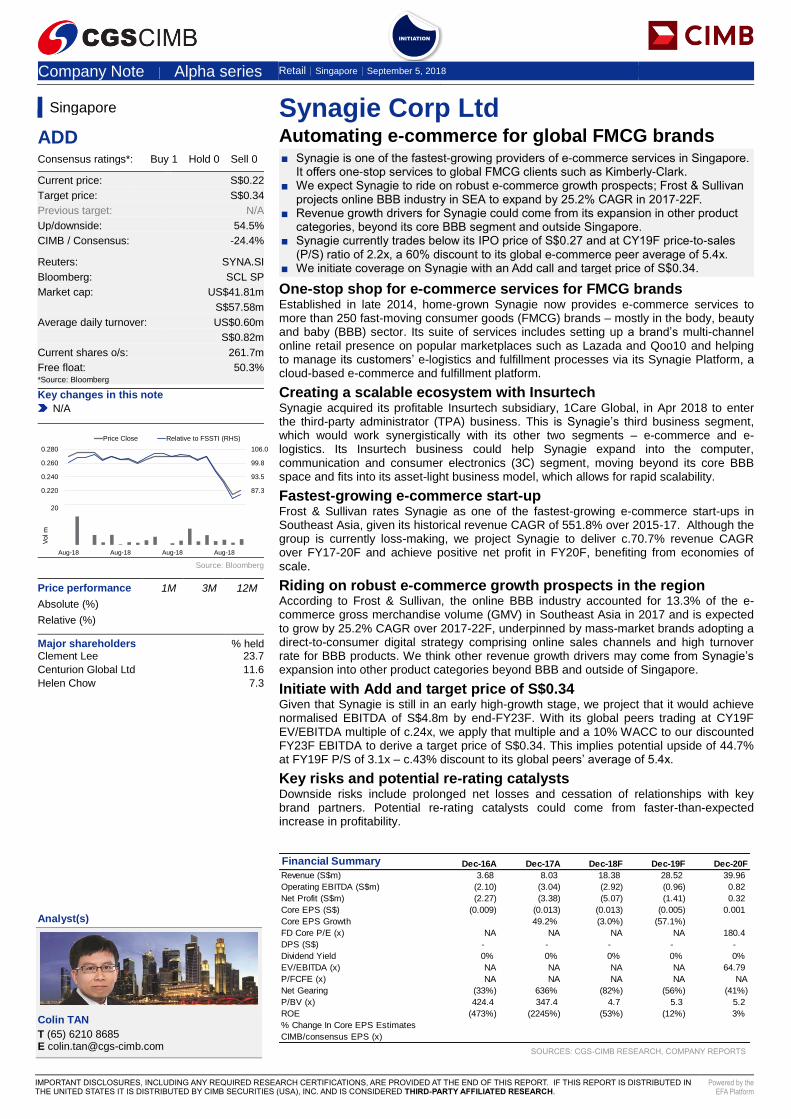
Synagie was founded in late 2014 and listed on the SGX-Catalist board on 8 Aug 2018. The home-grown is a one-stop shop, providing e-commerce services for the entire e-commerce value chain, helping businesses ranging from small-medium enterprises (SME) to multi-national companies to establish a multi-channel online retail presence on online marketplaces such as Lazada and Qoo10. The group also helps its customers to manage their e-logistics and fulfilment processes, which are executed seamlessly on its Synagie Platform, a cloud-based e-commerce and fulfilment platform accessible through the group’s website. Other end-to-end e-commerce solutions offered include: 1) channel and content management, 2) inventory and order management, 3) digital marketing and customer services, as well as 4) data analytics to boost sales.
Figure 1: Synagie’s e-commerce business processes
SOURCES: CGS-CIMB RESEARCH, COMPANY REPORTS
Asset-light model allows rapid scalability
Synagie’s asset-light business model allows it to scale up rapidly without having to invest significant capital, holding excessive inventory or incurring large marketing costs to generate sales. The group collaborates with third-party logistics partners and manages the entire logistics process via its Synagie Platform using business-to-business (B2B) and business-to-consumer (B2C) fulfilment services, mainly on-demand warehousing and last-mile delivery services.
More than 250 brand partners; mostly in BBB sector
Synagie’s customer base comprises more than 250 brand partners, mostly in the body, beauty and baby (BBB) sector, including well-known brands such as Unilever (ULVR LN, Not Rated), Johnson & Johnson (JNJ US, Not Rated), Kimberly-Clark (KMB US, Not Rated) and Shiseido (4911 JP, Not Rated). Synagie is also helping to manage more than 50 official stores for certain brand partners on Lazada, Qoo10, Shopee, Redmart and other online marketplaces. The aggregate number of product listings that Synagie helps to distribute and manage in official brand stores across various online marketplaces is well over 18,000.
3
Retail│Singapore
Synagie Corp Ltd│September 5, 2018
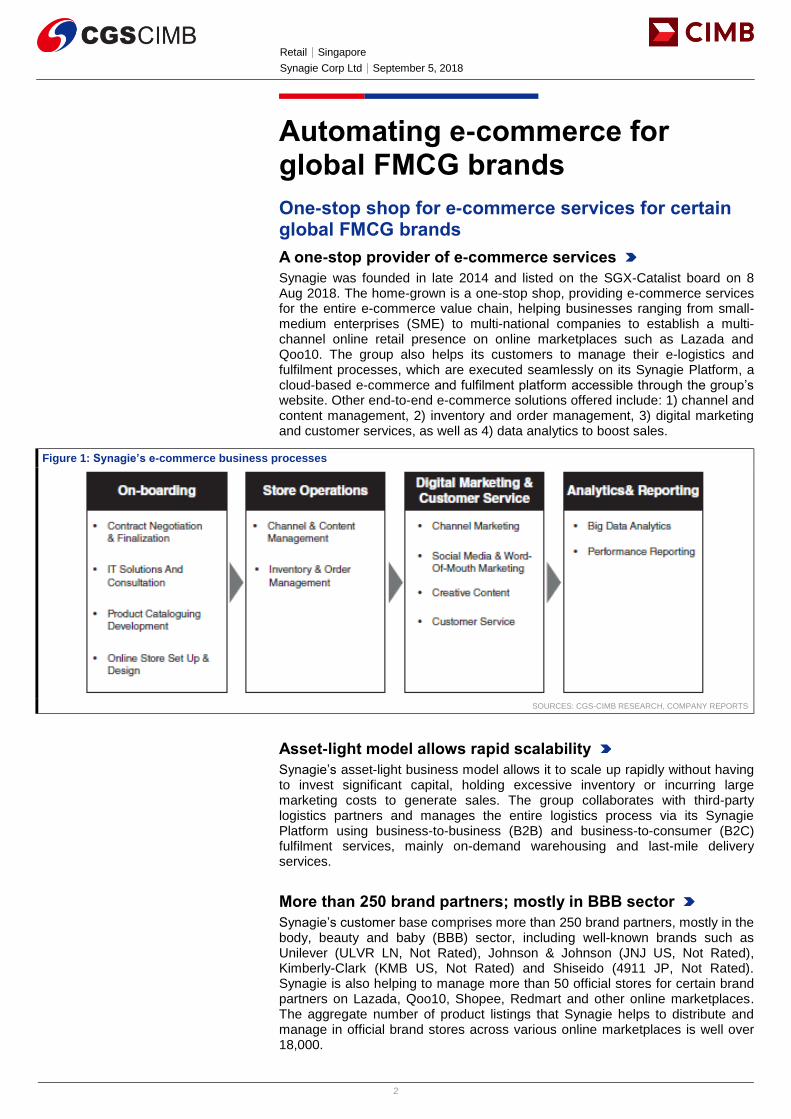
Figure 2: Some of Synagie’s key brand partners currently
SOURCES: CGS-CIMB RESEARCH, COMPANY REPORTS
Operates its own e-commerce store
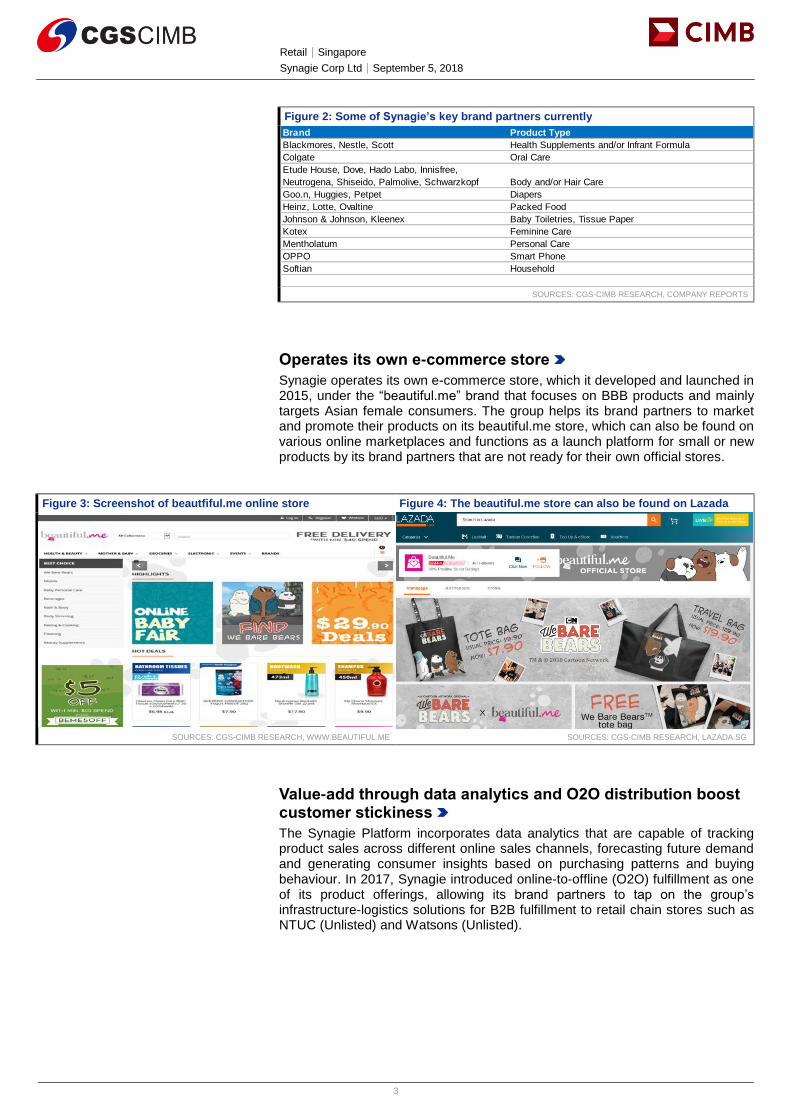
Synagie operates its own e-commerce store, which it developed and launched in 2015, under the “beautiful.me” brand that focuses on BBB products and mainly targets Asian female consumers. The group helps its brand partners to market and promote their products on its beautiful.me store, which can also be found on various online marketplaces and functions as a launch platform for small or new products by its brand partners that are not ready for their own official stores.
Figure 3: Screenshot of beautfiful.me online store Figure 4: The beautiful.me store can also be found on Lazada
SOURCES: CGS-CIMB RESEARCH, WWW.BEAUTIFUL.ME SOURCES: CGS-CIMB RESEARCH, LAZADA.SG
Value-add through data analytics and O2O distribution boost customer stickiness
The Synagie Platform incorporates data analytics that are capable of tracking product sales across different online sales channels, forecasting future demand and generating consumer insights based on purchasing patterns and buying behaviour. In 2017, Synagie introduced online-to-offline (O2O) fulfillment as one of its product offerings, allowing its brand partners to tap on the group’s infrastructure-logistics solutions for B2B fulfillment to retail chain stores such as NTUC (Unlisted) and Watsons (Unlisted).
Brand Product Type
Blackmores, Nestle, Scott Health Supplements and/or Infrant Formula
Colgate Oral Care
Etude House, Dove, Hado Labo, Innisfree,
Neutrogena, Shiseido, Palmolive, Schwarzkopf Body and/or Hair Care
Goo.n, Huggies, Petpet Diapers
Heinz, Lotte, Ovaltine Packed Food
Johnson & Johnson, Kleenex Baby Toiletries, Tissue Paper
Kotex Feminine Care
Mentholatum Personal Care
OPPO Smart Phone
Softian Household
4
Retail│Singapore
Synagie Corp Ltd│September 5, 2018
Fastest growing e-commerce start-up in Southeast Asia with over 500% revenue CAGR in 2015-17
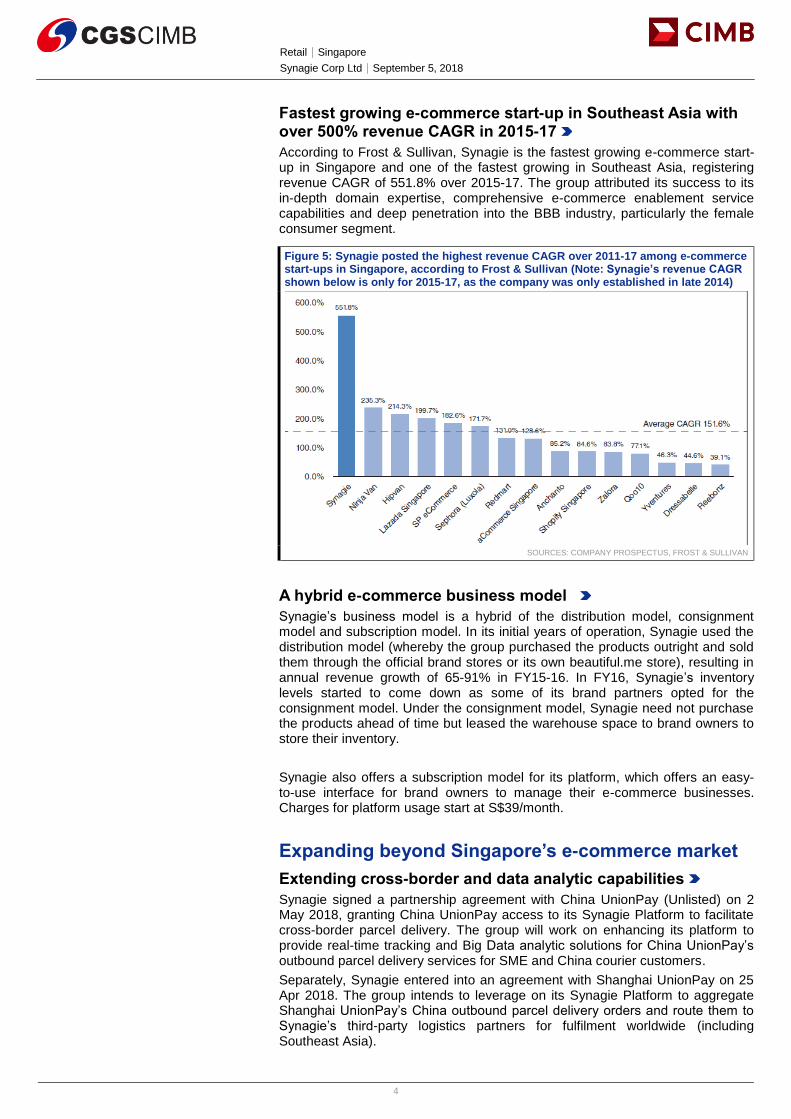
According to Frost & Sullivan, Synagie is the fastest growing e-commerce start-up in Singapore and one of the fastest growing in Southeast Asia, registering revenue CAGR of 551.8% over 2015-17. The group attributed its success to its in-depth domain expertise, comprehensive e-commerce enablement service capabilities and deep penetration into the BBB industry, particularly the female consumer segment.
Figure 5: Synagie posted the highest revenue CAGR over 2011-17 among e-commerce start-ups in Singapore, according to Frost & Sullivan (Note: Synagie’s revenue CAGR shown below is only for 2015-17, as the company was only established in late 2014)
SOURCES: COMPANY PROSPECTUS, FROST & SULLIVAN
A hybrid e-commerce business model
Synagie’s business model is a hybrid of the distribution model, consignment model and subscription model. In its initial years of operation, Synagie used the distribution model (whereby the group purchased the products outright and sold them through the official brand stores or its own beautiful.me store), resulting in annual revenue growth of 65-91% in FY15-16. In FY16, Synagie’s inventory levels started to come down as some of its brand partners opted for the consignment model. Under the consignment model, Synagie need not purchase the products ahead of time but leased the warehouse space to brand owners to store their inventory.
Synagie also offers a subscription model for its platform, which offers an easy-to-use interface for brand owners to manage their e-commerce businesses. Charges for platform usage start at S$39/month.
Expanding beyond Singapore’s e-commerce market
Extending cross-border and data analytic capabilities
Synagie signed a partnership agreement with China UnionPay (Unlisted) on 2 May 2018, granting China UnionPay access to its Synagie Platform to facilitate cross-border parcel delivery. The group will work on enhancing its platform to provide real-time tracking and Big Data analytic solutions for China UnionPay’s outbound parcel delivery services for SME and China courier customers.
Separately, Synagie entered into an agreement with Shanghai UnionPay on 25 Apr 2018. The group intends to leverage on its Synagie Platform to aggregate Shanghai UnionPay’s China outbound parcel delivery orders and route them to Synagie’s third-party logistics partners for fulfilment worldwide (including Southeast Asia).

5
Retail│Singapore
Synagie Corp Ltd│September 5, 2018
Creating an ecosystem with Insurtech
The group acquired 1Care Global, which we believe is its only profitable subsidiary, in Apr 2018. The acquisition, a venture into the Insurtech business, is Synagie’s third business segment and will work synergistically with its other two segments – e-commerce and e-logistics. 1Care Global has been providing regional third-party administration (TPA) and extended warranty and accidental damage protection services for customers that include Fortune 500 companies in the computer, communication and consumer electronics (3C) space for over seven years. 1Care Global would also provide after sales support and call centre services for brand partners. The acquisition of an Insurtech business will help Synagie expand into the 3C segment beyond its core BBB brand space, in our view.
Figure 6: Synagie’s business ecosystem
SOURCES: CGS-CIMB RESEARCH, COMPANY REPORTS
Extending its growth leg into Malaysia
Synagie is currently supporting the e-commerce operations of more than 250 BBB brands in Singapore and offers end-to-end e-commerce enablement solutions and services to over 100 BBB brands. The group counts Unilever, Nestle, Colgate-Palmolive and Henkel as some of its customers in Singapore, and, shortly after expanding operations to Malaysia in 2017, it has also added Amore Pacific, Blackmores and Coty to its customer list.
Industry outlook: robust growth prospects
Growing BBB and e-commerce in Southeast Asia
According to Frost & Sullivan, Singapore had the highest e-commerce penetration rate over total retail volume in Southeast Asia at c.4.8% in 2017. The online BBB industry accounted for 16.7% of the e-commerce gross merchandise volume (GMV) in Singapore (13.3% for Southeast Asia), with growth driven by mass-market brands adopting a direct-to-consumer digital strategy of online sales channels and high turnover rate of BBB products.
Frost & Sullivan forecasts the online BBB industry in SEA to reach US$2.57bn by 2022F, registering 25.2% CAGR over 2017-2022F (faster than overall e-commerce CAGR rate of 22.3% forecasted over the same period). For Singapore alone, Frost & Sullivan expects the online BBB industry to reach US$162.7m by end-2022, implying a 14.7% CAGR over 2017-2022F.

6
Retail│Singapore
Synagie Corp Ltd│September 5, 2018
Figure 7: Frost & Sullivan’s estimated e-commerce penetration rate of total retail sales for SEA in 2017
Figure 8: Market share by product segment purchased on online retail marketplaces in SEA, 2017
SOURCES: CGS-CIMB RESEARCH, COMPANY REPORTS, FROST & SULLIVAN SOURCES: CGS-CIMB RESEARCH, COMPANY REPORTS, FROST & SULLIVAN
Figure 9: Growth of online BBB industry GMV in Singapore, based on Frost & Sullivan's forecasts
Figure 10: Growth of online BBB industry GMV in SEA region, based on Frost & Sullivan's forecasts
SOURCES: CGS-CIMB RESEARCH, COMPANY REPORTS, FROST & SULLIVAN SOURCES: CGS-CIMB RESEARCH, COMPANY REPORTS, FROST & SULLIVAN
E-commerce enablers will play more of an active role
The future growth prospects for e-commerce enablers such as Synagie will be highly dependent on a brand’s e-commerce go-to-market (GTM) strategy and the overall development of e-commerce industry, in our view. E-commerce value chain activities, including online product marketing, content management, order placement and fulfilment, last-mile delivery and after-sale activities, are expected to be increasingly handled by e-commerce enablers rather than the brand owner themselves, based on Frost & Sullivan report on e-commerce industry in SEA.
Expansion beyond BBB sector will support further growth
With its growth largely derived from acquisition of BBB brands, Synagie is looking to expand its business into other product categories such as 3C and toys. One example of a notable non-BBB brand that Synagie has on-boarded is established smartphone brand, OPPO (Unlisted). The group intends to acquire more brand partners in product categories such as 3C, luxury beauty, kids and toys, as stated in the company’s IPO prospectus.
Toys & Hobby
Products, 8.3%
Food & Personal Care (including BBB), 13.3%
Furniture & Appliance, 16.3%
Fashion & Clothing, 26.8%
Computer, Communication & Consumer (3C),
29.6%
Others, 5.7%
6.6%
7.4%
8.0% 8.1%7.8%
7.6%7.8%
0
20
40
60
80
100
120
140
160
180
200
2016 2017E 2018F 2019F 2020F 2021F 2022F
US$m
Online BBB as % of total e-commerce
5.2%5.1% 5.1%
4.9%5.0%
5.4% 5.5%
0.0
0.5
1.0
1.5
2.0
2.5
3.0
2016 2017E 2018F 2019F 2020F 2021F 2022F
US$bn
Online BBB as % of total e-commerce
7
Retail│Singapore
Synagie Corp Ltd│September 5, 2018
Financials and forecasts
E-commerce formed bulk of FY17 revenue
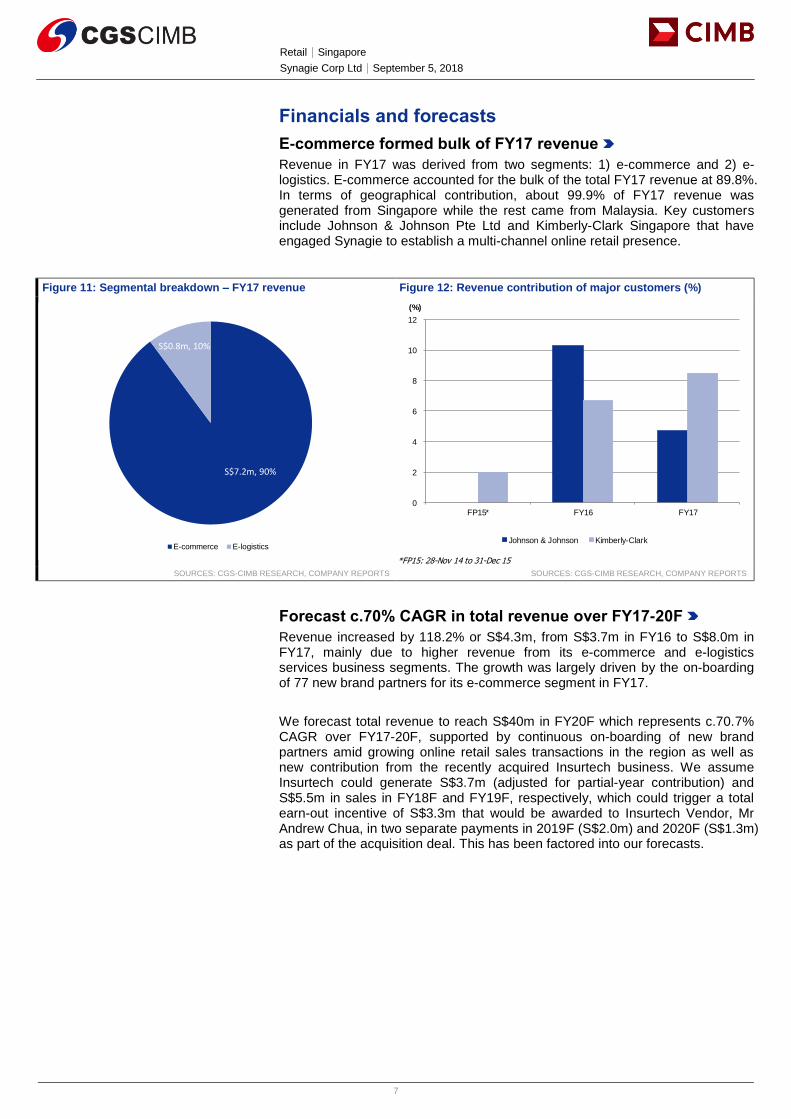
Revenue in FY17 was derived from two segments: 1) e-commerce and 2) e-logistics. E-commerce accounted for the bulk of the total FY17 revenue at 89.8%. In terms of geographical contribution, about 99.9% of FY17 revenue was generated from Singapore while the rest came from Malaysia. Key customers include Johnson & Johnson Pte Ltd and Kimberly-Clark Singapore that have engaged Synagie to establish a multi-channel online retail presence.
Figure 11: Segmental breakdown – FY17 revenue Figure 12: Revenue contribution of major customers (%)
SOURCES: CGS-CIMB RESEARCH, COMPANY REPORTS SOURCES: CGS-CIMB RESEARCH, COMPANY REPORTS
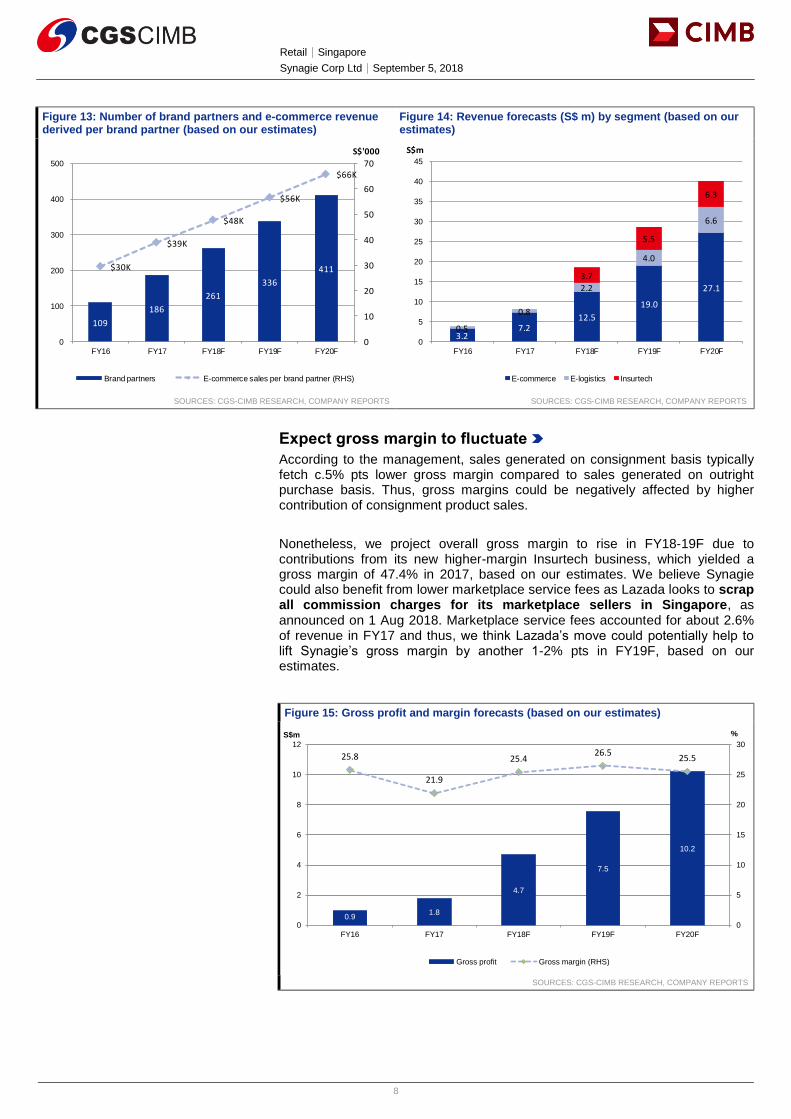
Forecast c.70% CAGR in total revenue over FY17-20F
Revenue increased by 118.2% or S$4.3m, from S$3.7m in FY16 to S$8.0m in FY17, mainly due to higher revenue from its e-commerce and e-logistics services business segments. The growth was largely driven by the on-boarding of 77 new brand partners for its e-commerce segment in FY17.
We forecast total revenue to reach S$40m in FY20F which represents c.70.7% CAGR over FY17-20F, supported by continuous on-boarding of new brand partners amid growing online retail sales transactions in the region as well as new contribution from the recently acquired Insurtech business. We assume Insurtech could generate S$3.7m (adjusted for partial-year contribution) and S$5.5m in sales in FY18F and FY19F, respectively, which could trigger a total earn-out incentive of S$3.3m that would be awarded to Insurtech Vendor, Mr Andrew Chua, in two separate payments in 2019F (S$2.0m) and 2020F (S$1.3m) as part of the acquisition deal. This has been factored into our forecasts.
S$7.2m, 90%
S$0.8m, 10%
E-commerce E-logistics
Title:
Source:
Please fill in the values above to have them entered in your report
*FP15: 28-Nov 14 to 31-Dec 15
0
2
4
6
8
10
12
FP15* FY16 FY17
(%)
Johnson & Johnson Kimberly-Clark
8
Retail│Singapore
Synagie Corp Ltd│September 5, 2018
Figure 13: Number of brand partners and e-commerce revenue derived per brand partner (based on our estimates)
Figure 14: Revenue forecasts (S$ m) by segment (based on our estimates)
SOURCES: CGS-CIMB RESEARCH, COMPANY REPORTS SOURCES: CGS-CIMB RESEARCH, COMPANY REPORTS
Expect gross margin to fluctuate
According to the management, sales generated on consignment basis typically fetch c.5% pts lower gross margin compared to sales generated on outright purchase basis. Thus, gross margins could be negatively affected by higher contribution of consignment product sales.
Nonetheless, we project overall gross margin to rise in FY18-19F due to contributions from its new higher-margin Insurtech business, which yielded a gross margin of 47.4% in 2017, based on our estimates. We believe Synagie could also benefit from lower marketplace service fees as Lazada looks to scrap all commission charges for its marketplace sellers in Singapore, as announced on 1 Aug 2018. Marketplace service fees accounted for about 2.6% of revenue in FY17 and thus, we think Lazada’s move could potentially help to lift Synagie’s gross margin by another 1-2% pts in FY19F, based on our estimates.
Figure 15: Gross profit and margin forecasts (based on our estimates)
SOURCES: CGS-CIMB RESEARCH, COMPANY REPORTS
Title:
Source:
Please fill in the values above to have them entered in your report
$30K
$39K
$48K
$56K
$66K
109
186
261
336
411
0
10
20
30
40
50
60
70
0
100
200
300
400
500
FY16 FY17 FY18F FY19F FY20F
S$'000
Brand partners E-commerce sales per brand partner (RHS)
Title:
Source:
Please fill in the values above to have them entered in your report
3.2 7.2
12.5
19.0
27.1
0.5
0.8
2.2
4.0
6.6
3.7
5.5
6.3
0
5
10
15
20
25
30
35
40
45
FY16 FY17 FY18F FY19F FY20F
S$m
E-commerce E-logistics Insurtech
0.9 1.8
4.7
7.5
10.2
25.8
21.9
25.4 26.5
25.5
0
5
10
15
20
25
30
0
2
4
6
8
10
12
FY16 FY17 FY18F FY19F FY20F
%S$m
Gross profit Gross margin (RHS)

9
Retail│Singapore
Synagie Corp Ltd│September 5, 2018
Cost as % of sales to trend lower as business expands
Apart from cost of sales, staff costs formed the second biggest operating expense at c.18% of total operating costs in FY17. We have factored in a significant step-up in staff costs in FY18F, given that Synagie has almost doubled its staff headcount from 35 as at end-FY17 to 67 as at 20 Jun 2018, with new hires mostly in logistics and operations divisions. We expect staff costs as a % of sales to trend lower over in FY19-20F as we project Synagie to grow its revenue base faster than staff costs and rest of the group’s administrative expenses.
Figure 16: Breakdown of FY17 operating costs Figure 17: Operating expenses (excluding cost of sales) forecasts (based on our estimates)
SOURCES: CGS-CIMB RESEARCH, COMPANY REPORTS SOURCES: CGS-CIMB RESEARCH, COMPANY REPORTS
Expect profitability by end-FY20F
Synagie has been loss-making since inception as the group has yet to ramp up its topline to a level which is high enough to cover its cost base as it is only within its first three years of operations. On a consolidated basis with its profitable Insurtech business, we expect the group to turn profitable on a S$40m topline by end-FY20F.
Figure 18: EBITDA and core net profit forecasts (based on our estimates)
Figure 19: Core EPS forecasts (Scts) (based on our estimates)
SOURCES: CGS-CIMB RESEARCH, COMPANY REPORTS SOURCES: CGS-CIMB RESEARCH, COMPANY REPORTS
Title:
Source:
Please fill in the values above to have them entered in your report
Cost of sales56%
Distribution costs6%
Staff costs18%
Depreciation and amortisation
1%
Others19%
0.2 0.7 1.0 1.5 2.2 1.8
2.0
3.8 4.0
4.2
1.3
2.3
4.6 3.0
3.0
0
2
4
6
8
10
FY16 FY17 FY18F FY19F FY20F
S$m
Distribution costs Staff costs Depre, amort and other expenses
Includes c.$1.7m of listing expenses
Includes c.$0.5m of professional fees leading up to IPO
Title:
Source:
Please fill in the values above to have them entered in your report
* Core net profit - excludes listing expense of c.S$1.8m for FY18F
-2.1
-3.0
-4.7
-1.0
0.8
-2.3
-3.4 -3.3
-1.4
0.3
(70)
(60)
(50)
(40)
(30)
(20)
(10)
0
10
-5.0
-4.0
-3.0
-2.0
-1.0
0.0
1.0
2.0
FY16 FY17 FY18F FY19F FY20F
%S$ m
EBITDA Core net profit Core net margin % (RHS)
-0.9
-1.3 -1.3
-0.5
0.1
-1.4
-1.2
-1.0
-0.8
-0.6
-0.4
-0.2
0.0
0.2
FY16 FY17 FY18F FY19F FY20F
S cts
Core EPS (S cts)

10
Retail│Singapore
Synagie Corp Ltd│September 5, 2018
Valuation and recommendation
Initiate with Add; TP of S$0.34
Synagie is currently trading below its IPO price of S$0.27 and at a CY19F P/S of 2.2x, c.60% discount to its global e-commerce enabler peers’ average of 5.4x (excluding outliers Shopify and Vipshop). With Synagie still in an early high-growth stage, we project it to achieve normalised EBITDA profits of S$4.8m by end-FY23F. With its global peers trading at CY19F EV/EBITDA multiple of c.24x, we also apply an EV/EBITDA multiple of 24x and assume a 10% WACC to our discounted FY23F EBITDA to derive a target price of S$0.34. This implies a FY19F P/S of 3.1x, representing c.43% discount to its peers’ average of 5.4x.
Our target price implies 54.5% upside to the current share price. We initiate coverage with an Add rating.
Figure 20: Peer comparison
Note: Not rated company forecasts based on Bloomberg consensus estimates
SOURCES: CGS-CIMB RESEARCH, COMPANY REPORTS, BLOOMBERG (5 SEP 2018)
Figure 21: Discounted EV/EBITDA valuation basis (based on our estimates)
SOURCES: CGS-CIMB RESEARCH, COMPANY REPORTS
Bloomberg Price
Target
Price
Market
Cap 3-year EPS
Recurring
ROE (%)
Company Ticker Recom. (lcl curr) (lcl curr) (US$ m) CY18F CY19F CAGR (%) CY18F CY19F CY18F CY18F CY19F
Synagie Corp Ltd SCL SP ADD 0.22 0.34 42 na na na 3.42 2.20 -53.7% na na
E-commerce enabler peers
Alibaba Group Holding Lt BABA US Not rated 170.4 na 441,812 45.0 23.2 40.0% 8.38 5.85 17.4% 23.2 16.3
Amazon.com Inc AMZN US Not rated 2,040 na 994,753 76.4 55.5 97.0% 4.23 3.48 21.7% 31.8 24.1
Baozun Inc BZUN US Not rated 52.31 na 2,979 51.3 32.3 13.6% 3.76 2.77 19.8% 36.4 21.6
Etsy Inc ETSY US Not rated 50.66 na 6,067 86.3 60.8 26.2% 10.22 8.00 17.6% 42.7 31.5
Infibeam Avenues Ltd INFIBEAM IN Not rated 229.5 na 2,131 172.5 43.1 8.2% 11.59 7.15 6.9% 51.1 27.8
Shopify Inc SHOP US Not rated 146.3 na 15,563 774.3 251.9 na 15.09 10.94 0.3% 426.1 156.1
Vipshop Holdings Ltd VIPS US Not rated 6.72 na 4,448 11.9 10.2 21.1% 0.35 0.30 13.8% 8.2 6.3
Simple average (excl Shopify, Vipshop) 86.3 43.0 37.0% 7.64 5.45 16.7% 37.0 24.3
EV/EBITDA (x)P/E (x) P/S (x)
S$ m (FYE Dec) FY18F FY19F FY20F FY21F FY22F FY23F
Revenue 18.4 28.5 40.0 53.4 69.8 89.9
Core net profit -3.3 -1.4 0.3 1.4 2.6 3.9
Core net profit margin % -17.9 -4.9 0.8 2.7 3.7 4.3
EBITDA -4.7 -1.0 0.8 1.9 3.2 4.8
EBITDA margin % -25.6 -3.4 2.0 3.6 4.6 5.3
Multiply by EV/EBITDA of 24.0x 115.0
Add net cash 10.0 6.0 4.5 5.3 7.0 9.9
Derived equity value 124.9
Discounted equity value to end-FY19F (WACC: 10.0%) 89.5
Shares outstanding (m) 261.7
Target price/share (S$) 0.34
Implied P/S ratio 4.84 3.12
Current share price 0.22
Implied upside 54.5%
Valuation parameters
WACC (%) 10.0
Target EV/EBITDA multiple (x) 24.0
*core net profit: excludes listing expense of c.$1.8m for FY18F

11
Retail│Singapore
Synagie Corp Ltd│September 5, 2018
Figure 22: Target price sensitivity to EV/EBITDA multiple and WACC assumptions
SOURCES: CGS-CIMB RESEARCH, COMPANY REPORTS
Figure 23: Target price sensitivity to every 10% change in our FY23F EBITDA forecast
SOURCES: CGS-CIMB RESEARCH, COMPANY REPORTS
Key risks
Losses and negative operating cash flow could drag on longer than expected. Synagie’s losses could continue to drag on longer than expected, which we think would require Synagie to take on additional debt or equity financing to fund its future working capital and expansion plans.
Cessation of relationships with key brand partners. Synagie enters into contractual agreements with its brand partners typically for a minimum of one or two years, and these contracts are automatically renewed upon expiration unless terminated by either party. The termination of agreements for any key brand partner could adversely affect Synagie’s sales.
Figure 24: SWOT analysis
SOURCES: CGS-CIMB RESEARCH, COMPANY REPORTS
16.0 20.0 24.0 28.0 32.0
8% 0.25 0.31 0.36 0.42 0.48
9% 0.24 0.30 0.35 0.41 0.46
10% 0.24 0.29 0.34 0.39 0.45
11% 0.23 0.28 0.33 0.38 0.43
12% 0.22 0.27 0.32 0.37 0.42
EV/EBITDA (x)
WA
CC
(%
)
0.25
0.28
0.31
0.34
0.37
0.40
0.44
0.00 0.05 0.10 0.15 0.20 0.25 0.30 0.35 0.40 0.45 0.50
-30%
-20%
-10%
0%
10%
20%
30%
Target Price (S$)
Strengths Opportunities
Track record in providing end-to-end e-commerce solutions for
some of the global BBB brands
Expand into other product categories beyond
BBB segments such as 3C and toys
Regional expansion in Malaysia and other South-
east Asian countries
Weaknesses Threats
Relies on third-party service providers to support its Synagie
platform, warehousing, logistics and fulfillment Losses could drag on for prolonged period
New entrants adding to competitive landscape

12
Retail│Singapore
Synagie Corp Ltd│September 5, 2018
Key management
Key members are its founders, Mr Clement Lee (Executive Director and CEO), Ms Olive Tai (Executive Director) and Ms Zanetta Lee (Executive Director). Mr Lee has over 20 years of experience in brand development and management in the entertainment and lifestyle industry. Ms Tai has over 20 years of experience in the FMCG industry and is responsible for the group’s e-commerce and e-logistics segments. Ms Lee served as a Regional Manager responsible for managing general distributors in Southeast Asia for Daimler before joining Synagie.
Major shareholders; 50.3% float
Based on its IPO prospectus as at 20 June 18, the three co-founders would hold a combined stake of 30.2% in the company after the company’s listing. Substantial stakeholders apart from Clement Lee include Centurion Global and Mrs Helen Chow who held 11.6% and 7.3%, respectively. Save for Clement who is under a 24-month moratorium period, other major stakeholders are under a 6-month moratorium period from the date of listing whereby they have undertaken not to sell their stakes. We estimate free float to the public is about 50.3%.

13
Retail│Singapore
Synagie Corp Ltd│September 5, 2018
BY THE NUMBERS
SOURCES: CGS-CIMB RESEARCH, COMPANY REPORTS
-2,300%
-2,013%
-1,725%
-1,438%
-1,150%
-863%
-575%
-288%
0%
6.10
6.30
6.50
6.70
6.90
7.10
7.30
7.50
7.70
Jan-14AJan-15AJan-16AJan-17AJan-18F Jan-19F
P/BV vs ROE
Rolling P/BV (x) (lhs) ROE (rhs)
-80%
-60%
-40%
-20%
0%
20%
40%
60%
80%
100%
Jan-14A Jan-15A Jan-16A Jan-17A Jan-18F Jan-19F
12-mth Fwd FD Core P/E vs FD Core EPS Growth
12-mth Fwd Rolling FD Core P/E (x) FD Core EPS Growth
Profit & Loss
(S$m) Dec-16A Dec-17A Dec-18F Dec-19F Dec-20F
Total Net Revenues 3.68 8.03 18.38 28.52 39.96
Gross Profit 0.95 1.76 4.67 7.54 10.20
Operating EBITDA (2.10) (3.04) (2.92) (0.96) 0.82
Depreciation And Amortisation (0.17) (0.14) (0.18) (0.18) (0.18)
Operating EBIT (2.27) (3.18) (3.10) (1.14) 0.64
Financial Income/(Expense) 0.00 (0.20) 0.00 0.00 0.00
Pretax Income/(Loss) from Assoc. 0.00 0.00 0.00 0.00 0.00
Non-Operating Income/(Expense) 0.00 0.00 0.00 0.00 0.00
Profit Before Tax (pre-EI) (2.27) (3.38) (3.10) (1.14) 0.64
Exceptional Items (1.79) 0.00 0.00
Pre-tax Profit (2.27) (3.38) (4.89) (1.14) 0.64
Taxation 0.00 0.00 (0.18) (0.27) (0.32)
Exceptional Income - post-tax
Profit After Tax (2.27) (3.38) (5.07) (1.41) 0.32
Minority Interests 0.00 0.00 0.00 0.00 0.00
Preferred Dividends
FX Gain/(Loss) - post tax
Other Adjustments - post-tax
Net Profit (2.27) (3.38) (5.07) (1.41) 0.32
Recurring Net Profit (2.27) (3.38) (3.28) (1.41) 0.32
Fully Diluted Recurring Net Profit (2.27) (3.38) (3.28) (1.41) 0.32
Cash Flow
(S$m) Dec-16A Dec-17A Dec-18F Dec-19F Dec-20F
EBITDA (2.10) (3.04) (2.92) (0.96) 0.82
Cash Flow from Invt. & Assoc.
Change In Working Capital 0.11 (0.80) (0.28) (0.68) (0.55)
(Incr)/Decr in Total Provisions
Other Non-Cash (Income)/Expense
Other Operating Cashflow 0.04 0.30 0.00 0.00 0.00
Net Interest (Paid)/Received 0.00 (0.20) 0.00 0.00 0.00
Tax Paid 0.00 0.00 0.03 (0.27) (0.32)
Cashflow From Operations (1.95) (3.74) (3.17) (1.91) (0.05)
Capex (0.02) (0.15) (0.15) (0.15) (0.15)
Disposals Of FAs/subsidiaries 0.00 0.00 0.00 0.00 0.00
Acq. Of Subsidiaries/investments
Other Investing Cashflow (0.13) (0.19) (4.19) 0.00 0.00
Cash Flow From Investing (0.16) (0.34) (4.34) (0.15) (0.15)
Debt Raised/(repaid) 0.00 3.80 0.00 0.00 0.00
Proceeds From Issue Of Shares 1.58 2.31 11.61 0.00 0.00
Shares Repurchased 0.00 0.00 0.00 0.00 0.00
Dividends Paid 0.00 0.00 0.00 0.00 0.00
Preferred Dividends
Other Financing Cashflow 0.53 (0.40) 5.86 (1.92) (1.30)
Cash Flow From Financing 2.11 5.71 17.47 (1.92) (1.30)
Total Cash Generated 0.01 1.63 9.96 (3.98) (1.50)
Free Cashflow To Equity (2.11) (0.28) (7.51) (2.06) (0.20)
Free Cashflow To Firm (2.11) (3.87) (7.51) (2.06) (0.20)
We expect profitability in FY20F

14
Retail│Singapore
Synagie Corp Ltd│September 5, 2018
BY THE NUMBERS… cont’d
SOURCES: CGS-CIMB RESEARCH, COMPANY REPORTS
Balance Sheet
(S$m) Dec-16A Dec-17A Dec-18F Dec-19F Dec-20F
Total Cash And Equivalents 0.05 1.83 9.99 6.02 4.51
Total Debtors 0.54 2.78 6.30 9.77 13.69
Inventories 0.44 1.46 2.25 3.45 4.89
Total Other Current Assets 0.00 0.00 0.00 0.00 0.00
Total Current Assets 1.03 6.07 18.54 19.23 23.09
Fixed Assets 0.12 0.12 0.19 0.25 0.32
Total Investments 0.00 0.00 0.00 0.00 0.00
Intangible Assets 0.25 0.35 4.44 4.34 4.25
Total Other Non-Current Assets 0.00 0.00 0.00 0.00 0.00
Total Non-current Assets 0.37 0.46 4.62 4.59 4.56
Short-term Debt 0.00 0.00 0.00 0.00 0.00
Current Portion of Long-Term Debt
Total Creditors 1.27 3.48 7.51 11.49 16.31
Other Current Liabilities 0.00 0.00 0.21 0.21 0.21
Total Current Liabilities 1.27 3.48 7.72 11.70 16.52
Total Long-term Debt 0.00 2.88 0.00 0.00 0.00
Hybrid Debt - Debt Component
Total Other Non-Current Liabilities 0.00 0.00 3.23 1.31 0.01
Total Non-current Liabilities 0.00 2.88 3.23 1.31 0.01
Total Provisions 0.00 0.00 0.00 0.00 0.00
Total Liabilities 1.27 6.36 10.95 13.01 16.53
Shareholders' Equity 0.14 0.17 12.21 10.81 11.13
Minority Interests 0.00 0.00 0.00 0.00 0.00
Total Equity 0.14 0.17 12.21 10.81 11.13
Key Ratios
Dec-16A Dec-17A Dec-18F Dec-19F Dec-20F
Revenue Growth N/A 118% 129% 55% 40%
Operating EBITDA Growth N/A 44.7% (3.7%) (67.1%) N/A
Operating EBITDA Margin (57.0%) (37.8%) (15.9%) (3.4%) 2.0%
Net Cash Per Share (S$) 0.000 (0.004) 0.038 0.023 0.017
BVPS (S$) 0.001 0.001 0.047 0.041 0.043
Gross Interest Cover N/A (15.62) N/A N/A N/A
Effective Tax Rate 0.0% 0.0% 0.0% 0.0% 50.0%
Net Dividend Payout Ratio NA NA NA NA NA
Accounts Receivables Days 77.5 75.5 90.1 102.8 107.4
Inventory Days 58.44 55.41 49.47 49.61 51.28
Accounts Payables Days 155.5 138.3 146.4 165.4 170.9
ROIC (%) (289%) (3517%) (254%) (21%) 10%
ROCE (%) (473%) (200%) (41%) (10%) 6%
Return On Average Assets (138%) (80%) (21%) (5%) 2%
Key Drivers
Dec-16A Dec-17A Dec-18F Dec-19F Dec-20F
ASP (% chg, main prod./serv.) N/A N/A N/A N/A N/A
Unit sales grth (%, main prod./serv.) 1781.3% 124.2% 72.7% 52.3% 42.6%
No. of POS (main prod/serv) N/A N/A N/A N/A N/A
SSS grth (%, main prod/serv) N/A N/A N/A N/A N/A
ASP (% chg, 2ndary prod./serv.) N/A N/A N/A N/A N/A
Unit sales grth (%,2ndary prod/serv) 2466.7% 76.8% 173.4% 81.2% 63.9%
No. of POS (2ndary prod/serv) N/A N/A N/A N/A N/A
SSS grth (%, 2ndary prrod/serv) N/A N/A N/A N/A N/A
Includes contingent consideration that requires Synagie to pay total earn-out incentives in 2019-2020F if its TPA subsidiary achieves certain performance targets.

15
Retail│Singapore
Synagie Corp Ltd│September 5, 2018
DISCLAIMER The content of this report (including the views and opinions expressed therein, and the information comprised therein) has been prepared by and belongs to CGS-CIMB or CIMB Investment Bank Berhad (“CIMB”), as the case may be. Reports relating to a specific geographical area are produced and distributed by the corresponding CGS-CIMB entity as listed in the table below. Reports relating to Malaysia are produced and distributed by CIMB.
This report is not directed to, or intended for distribution to or use by, any person or entity who is a citizen or resident of or located in any locality, state, country or other jurisdiction where such distribution, publication, availability or use would be contrary to law or regulation.
By accepting this report, the recipient hereof represents and warrants that he is entitled to receive such report in accordance with the restrictions set forth below and agrees to be bound by the limitations contained herein (including the “Restrictions on Distributions” set out below). Any failure to comply with these limitations may constitute a violation of law. This publication is being supplied to you strictly on the basis that it will remain confidential. No part of this report may be (i) copied, photocopied, duplicated, stored or reproduced in any form by any means or (ii) redistributed or passed on, directly or indirectly, to any other person in whole or in part, for any purpose without the prior written consent of CGS-CIMB or CIMB, as the case may be.
The information contained in this research report is prepared from data believed to be correct and reliable at the time of issue of this report. CGS-CIMB or CIMB, as the case may be, may or may not issue regular reports on the subject matter of this report at any frequency and may cease to do so or change the periodicity of reports at any time. Neither CGS-CIMB nor CIMB has an obligation to update this report in the event of a material change to the information contained in this report. Neither CGS-CIMB nor CIMB accepts any, obligation to (i) check or ensure that the contents of this report remain current, reliable or relevant, (ii) ensure that the content of this report constitutes all the information a prospective investor may require, (iii) ensure the adequacy, accuracy, completeness, reliability or fairness of any views, opinions and information, and accordingly, CGS-CIMB and CIMB, their respective affiliates and related persons including China Galaxy International Financial Holdings Limited (“CGIFHL”) and CIMB Group Sdn. Bhd. (“CIMBG”) and their respective related corporations (and their respective directors, associates, connected persons and/or employees) shall not be liable in any manner whatsoever for any consequences (including but not limited to any direct, indirect or consequential losses, loss of profits and damages) of any reliance thereon or usage thereof. In particular, CGS-CIMB and CIMB disclaim all responsibility and liability for the views and opinions set out in this report.
Unless otherwise specified, this report is based upon sources which CGS-CIMB or CIMB, as the case may be, considers to be reasonable. Such sources will, unless otherwise specified, for market data, be market data and prices available from the main stock exchange or market where the relevant security is listed, or, where appropriate, any other market. Information on the accounts and business of company(ies) will generally be based on published statements of the company(ies), information disseminated by regulatory information services, other publicly available information and information resulting from our research.
Whilst every effort is made to ensure that statements of facts made in this report are accurate, all estimates, projections, forecasts, expressions of opinion and other subjective judgments contained in this report are based on assumptions considered to be reasonable as of the date of the document in which they are contained and must not be construed as a representation that the matters referred to therein will occur. Past performance is not a reliable indicator of future performance. The value of investments may go down as well as up and those investing may, depending on the investments in question, lose more than the initial investment. No report shall constitute an offer or an invitation by or on behalf of CGS-CIMB or CIMB, as the case may be, or any of their respective affiliates (including CGIFHL, CIMBG and their respective related corporations) to any person to buy or sell any investments.
CGS-CIMB, CIMB, their respective affiliates and related corporations (including CGIFHL, CIMBG and their respective related corporations) and/or their respective directors, associates, connected parties and/or employees may own or have positions in securities of the company(ies) covered in this research report or any securities related thereto and may from time to time add to or dispose of, or may be materially interested in, any such securities. Further, CGS-CIMB, CIMB, their respective affiliates and their respective related corporations (including CGIFHL, CIMBG and their respective related corporations) do and seek to do business with the company(ies) covered in this research report and may from time to time act as market maker or have assumed an underwriting commitment in securities of such company(ies), may sell them to or buy them from customers on a principal basis and may also perform or seek to perform significant investment banking, advisory, underwriting or placement services for or relating to such company(ies) as well as solicit such investment, advisory or other services from any entity mentioned in this report.
CGS-CIMB, CIMB or their respective affiliates (including CGIFHL, CIMBG and their respective related corporations) may enter into an agreement with the company(ies) covered in this report relating to the production of research reports. CGS-CIMB or CIMB, as the case may be, may disclose the contents of this report to the company(ies) covered by it and may have amended the contents of this report following such disclosure.
The analyst responsible for the production of this report hereby certifies that the views expressed herein accurately and exclusively reflect his or her personal views and opinions about any and all of the issuers or securities analysed in this report and were prepared independently and autonomously. No part of the compensation of the analyst(s) was, is, or will be directly or indirectly related to the inclusion of specific recommendations(s) or view(s) in this report. The analyst(s) who prepared this research report is prohibited from receiving any compensation, incentive or bonus based on specific investment banking transactions or for providing a specific recommendation for, or view of, a particular company. Information barriers and other arrangements may be established where necessary to prevent conflicts of interests arising. However, the analyst(s) may receive compensation that is based on his/their coverage of company(ies) in the performance of his/their duties or the performance of his/their recommendations and the research personnel involved in the preparation of this report may also participate in the solicitation of the businesses as described above. In reviewing this research report, an investor should be aware that any or all of the foregoing, among other things, may give rise to real or potential conflicts of interest. Additional information is, subject to the duties of confidentiality, available on request.
Reports relating to a specific geographical area are produced by the corresponding CGS-CIMB entity as listed in the table below. The term “CGS-CIMB” shall denote, where appropriate, the relevant entity distributing or disseminating the report in the particular jurisdiction referenced below, or, in every other case except as otherwise stated herein, CGS-CIMB Securities International Pte. Ltd. and its affiliates, subsidiaries and related corporations.

16
Retail│Singapore
Synagie Corp Ltd│September 5, 2018
Country CGS-CIMB Entity Regulated by
Hong Kong CGS-CIMB Securities (Hong Kong) Limited Securities and Futures Commission Hong Kong
India CGS-CIMB Securities (India) Private Limited Securities and Exchange Board of India (SEBI)
Indonesia PT CGS-CIMB Sekuritas Indonesia Financial Services Authority of Indonesia
Singapore CGS-CIMB Research Pte. Ltd. Monetary Authority of Singapore
South Korea CGS-CIMB Securities (Hong Kong) Limited, Korea Branch Financial Services Commission and Financial Supervisory Service
Thailand CGS-CIMB Securities (Thailand) Co. Ltd. Securities and Exchange Commission Thailand
Reports relating to Malaysia are produced by CIMB as listed in the table below:
Country CIMB Entity Regulated by
Malaysia CIMB Investment Bank Berhad Securities Commission Malaysia
Other Significant Financial Interests:
(i) As of September 4, 2018 CGS-CIMB / CIMB has a proprietary position in the securities (which may include but not limited to shares, warrants, call warrants and/or any other derivatives) in the following company or companies covered or recommended in this report:
(a) Synagie Corp Ltd
(ii) Analyst Disclosure: As of September 5, 2018, the analyst(s) who prepared this report, and the associate(s), has / have an interest in the securities (which may include but not limited to shares, warrants, call warrants and/or any other derivatives) in the following company or companies covered or recommended in this report:
(a) -
This report does not purport to contain all the information that a prospective investor may require. Neither CGS-CIMB or CIMB, as the case may be, nor any of their respective affiliates (including CGIFHL, CIMBG and their related corporations) make any guarantee, representation or warranty, express or implied, as to the adequacy, accuracy, completeness, reliability or fairness of any such information and opinion contained in this report. Neither CGS-CIMB or CIMB, as the case may be, nor any of their respective affiliates nor their related persons (including CGIFHL, CIMBG and their related corporations) shall be liable in any manner whatsoever for any consequences (including but not limited to any direct, indirect or consequential losses, loss of profits and damages) of any reliance thereon or usage thereof.
This report is general in nature and has been prepared for information purposes only. It is intended for circulation amongst CGS-CIMB’s or CIMB’s (as the case may be) clients generally and does not have regard to the specific investment objectives, financial situation and the particular needs of any specific person who may receive this report. The information and opinions in this report are not and should not be construed or considered as an offer, recommendation or solicitation to buy or sell the subject securities, related investments or other financial instruments or any derivative instrument, or any rights pertaining thereto.
Investors are advised to make their own independent evaluation of the information contained in this research report, consider their own individual investment objectives, financial situation and particular needs and consult their own professional and financial advisers as to the legal, business, financial, tax and other aspects before participating in any transaction in respect of the securities of company(ies) covered in this research report.
The securities of such company(ies) may not be eligible for sale in all jurisdictions or to all categories of investors.
Australia: Despite anything in this report to the contrary, this research is provided in Australia by CGS-CIMB Securities (Singapore) Pte. Ltd. and CGS-CIMB Securities (Hong Kong) Limited. This research is only available in Australia to persons who are “wholesale clients” (within the meaning of the Corporations Act 2001 (Cth) and is supplied solely for the use of such wholesale clients and shall not be distributed or passed on to any other person. You represent and warrant that if you are in Australia, you are a “wholesale client”. This research is of a general nature only and has been prepared without taking into account the objectives, financial situation or needs of the individual recipient. CGS-CIMB Securities (Singapore) Pte. Ltd. and CGS-CIMB Securities (Hong Kong) Limited do not hold, and are not required to hold an Australian financial services license. CGS-CIMB Securities (Singapore) Pte. Ltd. and CGS-CIMB Securities (Hong Kong) Limited rely on “passporting” exemptions for entities appropriately licensed by the Monetary Authority of Singapore (under ASIC Class Order 03/1102) and the Securities and Futures Commission in Hong Kong (under ASIC Class Order 03/1103).
Canada: This research report has not been prepared in accordance with the disclosure requirements of Dealer Member Rule 3400 – Research Restrictions and Disclosure Requirements of the Investment Industry Regulatory Organization of Canada. For any research report distributed by CIBC, further disclosures related to CIBC conflicts of interest can be found at https://researchcentral.cibcwm.com .
China: For the purpose of this report, the People’s Republic of China (“PRC”) does not include the Hong Kong Special Administrative Region, the Macau Special Administrative Region or Taiwan. The distributor of this report has not been approved or licensed by the China Securities Regulatory Commission or any other relevant regulatory authority or governmental agency in the PRC. This report contains only marketing information. The distribution of this report is not an offer to buy or sell to any person within or outside PRC or a solicitation to any person within or outside of PRC to buy or sell any instruments described herein. This report is being issued outside the PRC to a limited number of institutional investors and may not be provided to any person other than the original recipient and may not be reproduced or used for any other purpose.
France: Only qualified investors within the meaning of French law shall have access to this report. This report shall not be considered as an offer to subscribe to, or used in connection with, any offer for subscription or sale or marketing or direct or indirect distribution of financial instruments and it is not intended as a solicitation for the purchase of any financial instrument.
Germany: This report is only directed at persons who are professional investors as defined in sec 31a(2) of the German Securities Trading Act (WpHG). This publication constitutes research of a non-binding nature on the market situation and the investment instruments cited here at the time of the publication of the information.
The current prices/yields in this issue are based upon closing prices from Bloomberg as of the day preceding publication. Please note that neither the German Federal Financial Supervisory Agency (BaFin), nor any other supervisory authority exercises any control over the content of this report.
Hong Kong: This report is issued and distributed in Hong Kong by CGS-CIMB Securities (Hong Kong) Limited (“CHK”) which is licensed in Hong Kong by the Securities and Futures Commission for Type 1 (dealing in securities), Type 4 (advising on securities) and Type 6 (advising on corporate finance) activities. Any investors wishing to purchase or otherwise deal in the securities covered in this report should contact the Head of Sales at
17
Retail│Singapore
Synagie Corp Ltd│September 5, 2018
CGS-CIMB Securities (Hong Kong) Limited. The views and opinions in this research report are our own as of the date hereof and are subject to change. If the Financial Services and Markets Act of the United Kingdom or the rules of the Financial Conduct Authority apply to a recipient, our obligations owed to such recipient therein are unaffected. CHK has no obligation to update its opinion or the information in this research report.
This publication is strictly confidential and is for private circulation only to clients of CHK.
CHK does not make a market on other securities mentioned in the report.
India: This report is issued and distributed in India by CGS-CIMB Securities (India) Private Limited (“CGS-CIMB India”) which is registered with the National Stock Exchange of India Limited and BSE Limited as a trading and clearing member under the Securities and Exchange Board of India (Stock Brokers and Sub-Brokers) Regulations, 1992. In accordance with the provisions of Regulation 4(g) of the Securities and Exchange Board of India (Investment Advisers) Regulations, 2013, CGS-CIMB India is not required to seek registration with the Securities and Exchange Board of India (“SEBI”) as an Investment Adviser. CGS-CIMB India is registered with SEBI as a Research Analyst pursuant to the SEBI (Research Analysts) Regulations, 2014 ("Regulations").
This report does not take into account the particular investment objectives, financial situations, or needs of the recipients. It is not intended for and does not deal with prohibitions on investment due to law/jurisdiction issues etc. which may exist for certain persons/entities. Recipients should rely on their own investigations and take their own professional advice before investment.
The report is not a “prospectus” as defined under Indian Law, including the Companies Act, 2013, and is not, and shall not be, approved by, or filed or registered with, any Indian regulator, including any Registrar of Companies in India, SEBI, any Indian stock exchange, or the Reserve Bank of India. No offer, or invitation to offer, or solicitation of subscription with respect to any such securities listed or proposed to be listed in India is being made, or intended to be made, to the public, or to any member or section of the public in India, through or pursuant to this report.
The research analysts, strategists or economists principally responsible for the preparation of this research report are segregated from the other activities of CGS-CIMB India and they have received compensation based upon various factors, including quality, accuracy and value of research, firm profitability or revenues, client feedback and competitive factors. Research analysts', strategists' or economists' compensation is not linked to investment banking or capital markets transactions performed or proposed to be performed by CGS-CIMB India or its affiliates.
CGS-CIMB India has not received any investment banking related compensation from the companies mentioned in the report in the past 12 months.
CGS-CIMB India has not received any compensation from the companies mentioned in the report in the past 12 months.
Indonesia: This report is issued and distributed by PT CGS-CIMB Sekuritas Indonesia (“CGS-CIMB Indonesia”). The views and opinions in this research report are our own as of the date hereof and are subject to change. CGS-CIMB Indonesia has no obligation to update its opinion or the information in this research report. Neither this report nor any copy hereof may be distributed in Indonesia or to any Indonesian citizens wherever they are domiciled or to Indonesian residents except in compliance with applicable Indonesian capital market laws and regulations.
This research report is not an offer of securities in Indonesia. The securities referred to in this research report have not been registered with the Financial Services Authority (Otoritas Jasa Keuangan) pursuant to relevant capital market laws and regulations, and may not be offered or sold within the territory of the Republic of Indonesia or to Indonesian citizens through a public offering or in circumstances which constitute an offer within the meaning of the Indonesian capital market law and regulations.
Ireland: CGS-CIMB is not an investment firm authorised in the Republic of Ireland and no part of this document should be construed as CGS-CIMB acting as, or otherwise claiming or representing to be, an investment firm authorised in the Republic of Ireland.
Malaysia: This report is distributed in Malaysia by CIMB solely for the benefit of and for the exclusive use of our clients. Recipients of this report are to contact CIMB, at 17th Floor Menara CIMB No. 1 Jalan Stesen Sentral 2, Kuala Lumpur Sentral 50470 Kuala Lumpur, Malaysia, in respect of any matters arising from or in connection with this report. CIMB has no obligation to update, revise or reaffirm its opinion or the information in this research reports after the date of this report.
New Zealand: In New Zealand, this report is for distribution only to persons who are wholesale clients pursuant to section 5C of the Financial Advisers Act 2008.
Singapore: This report is issued and distributed by CGS-CIMB Research Pte Ltd (“CGS-CIMBR”). CGS-CIMBR is a financial adviser licensed under the Financial Advisers Act, Cap 110 (“FAA”) for advising on investment products, by issuing or promulgating research analyses or research reports, whether in electronic, print or other form. Accordingly CGS-CIMBR is a subject to the applicable rules under the FAA unless it is able to avail itself to any prescribed exemptions.
Recipients of this report are to contact CGS-CIMB Research Pte Ltd, 50 Raffles Place, #16-02 Singapore Land Tower, Singapore in respect of any matters arising from, or in connection with this report. CGS-CIMBR has no obligation to update its opinion or the information in this research report. This publication is strictly confidential and is for private circulation only. If you have not been sent this report by CGS-CIMBR directly, you may not rely, use or disclose to anyone else this report or its contents.
If the recipient of this research report is not an accredited investor, expert investor or institutional investor, CGS-CIMBR accepts legal responsibility for the contents of the report without any disclaimer limiting or otherwise curtailing such legal responsibility. If the recipient is an accredited investor, expert investor or institutional investor, the recipient is deemed to acknowledge that CGS-CIMBR is exempt from certain requirements under the FAA and its attendant regulations, and as such, is exempt from complying with the following : (a) Section 25 of the FAA (obligation to disclose product information); (b) Section 27 (duty not to make recommendation with respect to any investment product without having a reasonable basis where you may be reasonably expected to rely on the recommendation) of the FAA; (c) MAS Notice on Information to Clients and Product Information Disclosure [Notice No. FAA-N03]; (d) MAS Notice on Recommendation on Investment Products [Notice No. FAA-N16]; (e) Section 36 (obligation on disclosure of interest in securities), and (f) any other laws, regulations, notices, directive, guidelines, circulars and practice notes which are relates to the above, to the extent permitted by applicable laws, as may be amended from time to time, and any other laws, regulations, notices, directive, guidelines, circulars, and practice notes as we may notify you from time to time. In addition, the recipient who is an accredited investor, expert investor or institutional investor acknowledges that a CGS-CIMBR is exempt from Section 27 of the FAA, the recipient will also not be able to file a civil claim against CGS-CIMBR for any loss or damage arising from the recipient’s reliance on any recommendation made by CGS-CIMBR which would otherwise be a right that is available to the
18
Retail│Singapore
Synagie Corp Ltd│September 5, 2018
recipient under Section 27 of the FAA, the recipient will also not be able to file a civil claim against CGS-CIMBR for any loss or damage arising from the recipient’s reliance on any recommendation made by CGS-CIMBR which would otherwise be a right that is available to the recipient under Section 27 of the FAA.
CGS-CIMBR, its affiliates and related corporations, their directors, associates, connected parties and/or employees may own or have positions in securities of the company(ies) covered in this research report or any securities related thereto and may from time to time add to or dispose of, or may be materially interested in, any such securities. Further, CGS-CIMBR, its affiliates and its related corporations do and seek to do business with the company(ies) covered in this research report and may from time to time act as market maker or have assumed an underwriting commitment in securities of such company(ies), may sell them to or buy them from customers on a principal basis and may also perform or seek to perform significant investment banking, advisory, underwriting or placement services for or relating to such company(ies) as well as solicit such investment, advisory or other services from any entity mentioned in this report.
As of September 4, 2018, CGS-CIMBR does not have a proprietary position in the recommended securities in this report.
CGS-CIMBR does not make a market on the securities mentioned in the report.
South Korea: This report is issued and distributed in South Korea by CGS-CIMB Securities (Hong Kong) Limited, Korea Branch (“CGS-CIMB Korea”) which is licensed as a cash equity broker, and regulated by the Financial Services Commission and Financial Supervisory Service of Korea. In South Korea, this report is for distribution only to professional investors under Article 9(5) of the Financial Investment Services and Capital Market Act of Korea (“FSCMA”).
Spain: This document is a research report and it is addressed to institutional investors only. The research report is of a general nature and not personalised and does not constitute investment advice so, as the case may be, the recipient must seek proper advice before adopting any investment decision. This document does not constitute a public offering of securities.
CGS-CIMB is not registered with the Spanish Comision Nacional del Mercado de Valores to provide investment services.
Sweden: This report contains only marketing information and has not been approved by the Swedish Financial Supervisory Authority. The distribution of this report is not an offer to sell to any person in Sweden or a solicitation to any person in Sweden to buy any instruments described herein and may not be forwarded to the public in Sweden.
Switzerland: This report has not been prepared in accordance with the recognized self-regulatory minimal standards for research reports of banks issued by the Swiss Bankers’ Association (Directives on the Independence of Financial Research).
Thailand: This report is issued and distributed by CGS-CIMB Securities (Thailand) Co. Ltd. (“CGS-CIMB Thailand”) based upon sources believed to be reliable (but their accuracy, completeness or correctness is not guaranteed). The statements or expressions of opinion herein were arrived at after due and careful consideration for use as information for investment. Such opinions are subject to change without notice and CGS-CIMB Thailand has no obligation to update its opinion or the information in this research report.
CGS-CIMB Thailand may act or acts as Market Maker, and issuer and offerer of Derivative Warrants and Structured Note which may have the following securities as its underlying securities. Investors should carefully read and study the details of the derivative warrants in the prospectus before making investment decisions.
AAV, ADVANC, AMATA, AOT, AP, BANPU, BBL, BCH, BCP, BCPG, BDMS, BEAUTY, BEM, BGRIM, BJC, BH, BLA, BLAND, BPP, BTS, CBG, CENTEL, CHG, CK, CKP, COM7, CPALL, CPF, CPN, DELTA, DTAC, EA, EGCO, EPG, ERW, ESSO, GGC, GFPT, GLOBAL, GLOW, GPSC, GUNKUL, HANA, HMPRO, INTUCH, IRPC, ITD, IVL, KBANK, KCE, KKP, KTB, KTC, LH, LPN, MAJOR, MEGA, MINT, MTLS, ORI, PRM, PSH, PSL, PTG, PTT, PTTEP, PTTGC, QH, RATCH, ROBINS, RS, SAWAD, SCB, SCC, SGP, SIRI, SPALI, SPRC, STA, STEC, SUPER, TASCO, TCAP, THAI, THANI, TISCO, TKN, TMB, TOA, TOP, TPIPL, TPIPP, TRUE, TTW, TU, TVO, UV, WHA, WHAUP, WORK.
Corporate Governance Report:
The disclosure of the survey result of the Thai Institute of Directors Association (“IOD”) regarding corporate governance is made pursuant to the policy of the Office of the Securities and Exchange Commission. The survey of the IOD is based on the information of a company listed on the Stock Exchange of Thailand and the Market for Alternative Investment disclosed to the public and able to be accessed by a general public investor. The result, therefore, is from the perspective of a third party. It is not an evaluation of operation and is not based on inside information.
The survey result is as of the date appearing in the Corporate Governance Report of Thai Listed Companies. As a result, the survey result may be changed after that date. CGS-CIMB Thailand does not confirm nor certify the accuracy of such survey result.
Score Range: 90 - 100 80 – 89 70 - 79 Below 70 or No Survey Result
Description: Excellent Very Good Good N/A
United Arab Emirates: The distributor of this report has not been approved or licensed by the UAE Central Bank or any other relevant licensing authorities or governmental agencies in the United Arab Emirates. This report is strictly private and confidential and has not been reviewed by, deposited or registered with UAE Central Bank or any other licensing authority or governmental agencies in the United Arab Emirates. This report is being issued outside the United Arab Emirates to a limited number of institutional investors and must not be provided to any person other than the original recipient and may not be reproduced or used for any other purpose. Further, the information contained in this report is not intended to lead to the sale of investments under any subscription agreement or the conclusion of any other contract of whatsoever nature within the territory of the United Arab Emirates.
United Kingdom and European Economic Area (EEA): In the United Kingdom and European Economic Area, this material is also being distributed by CGS-CIMB Securities (UK) Limited (“CGS-CIMB UK”). CGS-CIMB UK is authorized and regulated by the Financial Conduct Authority and its registered office is at 27 Knightsbridge, London, SW1X7YB. The material distributed by CGS-CIMB UK has been prepared in accordance with CGS-CIMB’s policies for managing conflicts of interest arising as a result of publication and distribution of this material. This material is for distribution only to, and is solely directed at, selected persons on the basis that those persons: (a) are eligible counterparties and professional clients of CGS-CIMB UK; (b) have professional experience in matters relating to investments falling within Article 19(5) of the Financial Services and Markets Act 2000 (Financial Promotion) Order 2005 (as amended, the “Order”), (c) fall within Article 49(2)(a) to (d) (“high net worth companies, unincorporated associations etc”) of the Order; (d) are outside the United Kingdom subject to relevant regulation in each jurisdiction, material(all such persons together being referred to as “relevant persons”). This material is directed only at relevant persons and must not be acted on or relied
19
Retail│Singapore
Synagie Corp Ltd│September 5, 2018
on by persons who are not relevant persons. Any investment or investment activity to which this material relates is available only to relevant persons and will be engaged in only with relevant persons.
Where this material is labelled as non-independent, it does not provide an impartial or objective assessment of the subject matter and does not constitute independent “research” (cannot remove research from here under the applicable rules of the Financial Conduct Authority in the UK. Consequently, any such non-independent material will not have been prepared in accordance with legal requirements designed to promote the independence of research (cannot remove research from here) and will not subject to any prohibition on dealing ahead of the dissemination of research. Any such non-independent material must be considered as a marketing communication.
United States: This research report is distributed in the United States of America by CGS-CIMB Securities (USA) Inc, a U.S. registered broker-dealer and a related company of CGS-CIMB Research Pte Ltd, PT CGS-CIMB Sekuritas Indonesia, CGS-CIMB Securities (Thailand) Co. Ltd, CGS-CIMB Securities (Hong Kong) Limited, CGS-CIMB Securities (India) Private Limited, and is distributed solely to persons who qualify as “U.S. Institutional Investors” as defined in Rule 15a-6 under the Securities and Exchange Act of 1934. This communication is only for Institutional Investors whose ordinary business activities involve investing in shares, bonds, and associated securities and/or derivative securities and who have professional experience in such investments. Any person who is not a U.S. Institutional Investor or Major Institutional Investor must not rely on this communication. The delivery of this research report to any person in the United States of America is not a recommendation to effect any transactions in the securities discussed herein, or an endorsement of any opinion expressed herein. CGS-CIMB Securities (USA) Inc, is a FINRA/SIPC member and takes responsibility for the content of this report. For further information or to place an order in any of the above-mentioned securities please contact a registered representative of CGS-CIMB Securities (USA) Inc.
CGS-CIMB Securities (USA) Inc. does not make a market on other securities mentioned in the report.
CGS-CIMB Securities (USA) Inc. has not managed or co-managed a public offering of any of the securities mentioned in the past 12 months.
CGS-CIMB Securities (USA) Inc. has not received compensation for investment banking services from any of the company mentioned in the past 12 months.
CGS-CIMB Securities (USA) Inc. neither expects to receive nor intends to seek compensation for investment banking services from any of the company mentioned within the next 3 months.
Other jurisdictions: In any other jurisdictions, except if otherwise restricted by laws or regulations, this report is only for distribution to professional, institutional or sophisticated investors as defined in the laws and regulations of such jurisdictions.
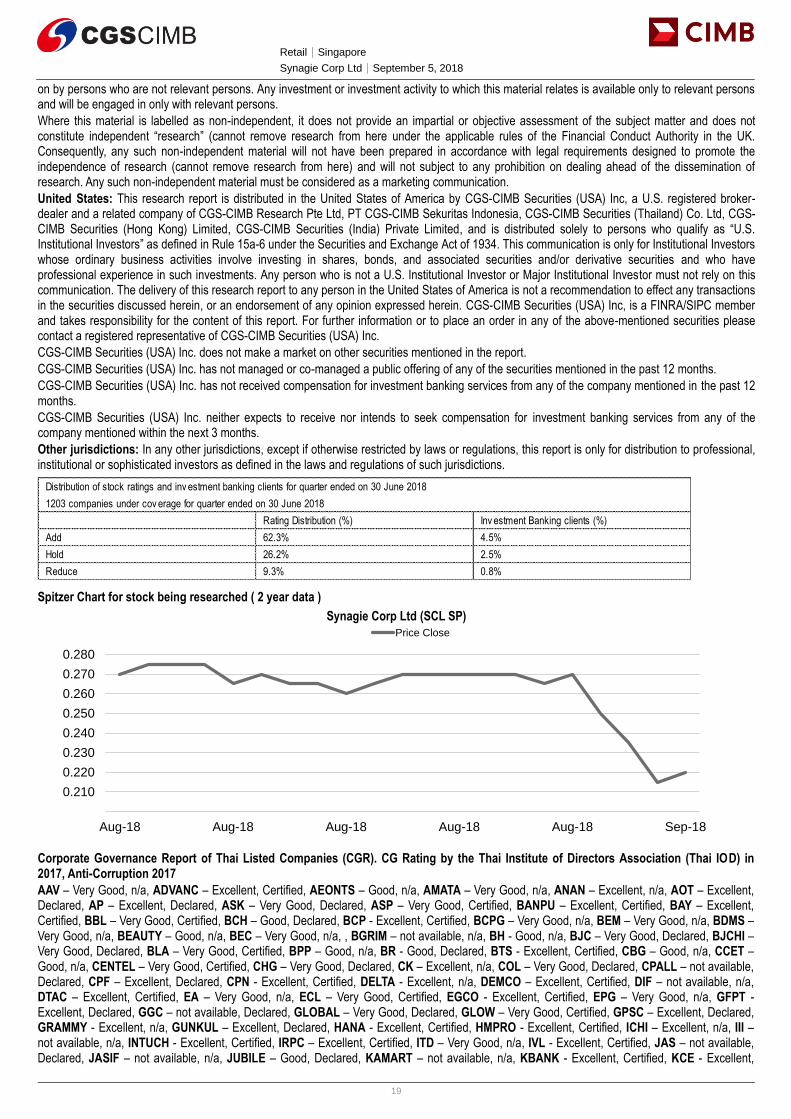
Spitzer Chart for stock being researched ( 2 year data )
Synagie Corp Ltd (SCL SP)
Corporate Governance Report of Thai Listed Companies (CGR). CG Rating by the Thai Institute of Directors Association (Thai IOD) in 2017, Anti-Corruption 2017
AAV – Very Good, n/a, ADVANC – Excellent, Certified, AEONTS – Good, n/a, AMATA – Very Good, n/a, ANAN – Excellent, n/a, AOT – Excellent, Declared, AP – Excellent, Declared, ASK – Very Good, Declared, ASP – Very Good, Certified, BANPU – Excellent, Certified, BAY – Excellent, Certified, BBL – Very Good, Certified, BCH – Good, Declared, BCP - Excellent, Certified, BCPG – Very Good, n/a, BEM – Very Good, n/a, BDMS – Very Good, n/a, BEAUTY – Good, n/a, BEC – Very Good, n/a, , BGRIM – not available, n/a, BH - Good, n/a, BJC – Very Good, Declared, BJCHI – Very Good, Declared, BLA – Very Good, Certified, BPP – Good, n/a, BR - Good, Declared, BTS - Excellent, Certified, CBG – Good, n/a, CCET – Good, n/a, CENTEL – Very Good, Certified, CHG – Very Good, Declared, CK – Excellent, n/a, COL – Very Good, Declared, CPALL – not available, Declared, CPF – Excellent, Declared, CPN - Excellent, Certified, DELTA - Excellent, n/a, DEMCO – Excellent, Certified, DIF – not available, n/a, DTAC – Excellent, Certified, EA – Very Good, n/a, ECL – Very Good, Certified, EGCO - Excellent, Certified, EPG – Very Good, n/a, GFPT - Excellent, Declared, GGC – not available, Declared, GLOBAL – Very Good, Declared, GLOW – Very Good, Certified, GPSC – Excellent, Declared, GRAMMY - Excellent, n/a, GUNKUL – Excellent, Declared, HANA - Excellent, Certified, HMPRO - Excellent, Certified, ICHI – Excellent, n/a, III – not available, n/a, INTUCH - Excellent, Certified, IRPC – Excellent, Certified, ITD – Very Good, n/a, IVL - Excellent, Certified, JAS – not available, Declared, JASIF – not available, n/a, JUBILE – Good, Declared, KAMART – not available, n/a, KBANK - Excellent, Certified, KCE - Excellent,
Rating Distribution (%) Inv estment Banking clients (%)
Add 62.3% 4.5%
Hold 26.2% 2.5%
Reduce 9.3% 0.8%
Distribution of stock ratings and inv estment banking clients for quarter ended on 30 June 2018
1203 companies under cov erage for quarter ended on 30 June 2018
0.200
0.210
0.220
0.230
0.240
0.250
0.260
0.270
0.280
Aug-18 Aug-18 Aug-18 Aug-18 Aug-18 Sep-18
Price Close
20
Retail│Singapore
Synagie Corp Ltd│September 5, 2018
Certified, KGI – Very Good, Certified, KKP – Excellent, Certified, KSL – Very Good, Certified, KTB - Excellent, Certified, KTC – Excellent, Certified, LH - Very Good, n/a, LPN – Excellent, Certified, M – Very Good, n/a, MACO – Very Good, n/a, MAJOR – Very Good, n/a, MAKRO – Very Good, Declared, MALEE – Very Good, n/a, MBKET – Very Good, Certified, MC – Very Good, Declared, MCOT – Excellent, Certified, MEGA – Very Good, n/a, MINT - Excellent, Certified, MTLS – Very Good, Declared, NYT – Excellent, n/a, OISHI – Very Good, n/a, PLANB – Excellent, Declared, PLAT – Very Good, Certified, PSH – Excellent, Certified, PSL - Excellent, Certified, PTT - Excellent, Certified, PTTEP - Excellent, Certified, PTTGC - Excellent, Certified, QH – Excellent, Certified, RATCH – Excellent, Certified, ROBINS – Excellent, Certified, RS – Very Good, n/a, SAMART - Excellent, n/a, SAPPE - Good, n/a, SAT – Excellent, Certified, SAWAD – Very Good, n/a, SC – Excellent, Declared, SCB - Excellent, Certified, SCBLIF – not available, n/a, SCC – Excellent, Certified, SCN – Very Good, Declared, SCCC - Excellent, Declared, SIM - Excellent, n/a, SIRI – Very Good, Declared, SPA - Good, n/a, SPALI - Excellent, n/a, SPRC – Excellent, Declared, STA – Very Good, Declared, STEC – Excellent, n/a, SVI – Excellent, Certified, TASCO – Very Good, n/a, TCAP – Excellent, Certified, THAI – Very Good, n/a, THANI – Very Good, Certified, THCOM – Excellent, Certified, THRE – Very Good, Certified, THREL – Excellent, Certified, TICON – Very Good, Declared, TIPCO – Very Good, Certified, TISCO - Excellent, Certified, TK – Very Good, n/a, TKN – Very Good, Declared, TMB - Excellent, Certified, TNR – Good, n/a, TOP - Excellent, Certified, TPCH – Good, n/a, TPIPP – not available, n/a, TRUE – Excellent, Declared, TTW – Very Good, n/a, TU – Excellent, Declared, TVO – Excellent, Declared, UNIQ – not available, Declared, VGI – Excellent, Declared, WHA – not available, Declared, WHART – not available, n/a, WORK – not available, n/a.
Companies participating in Thailand’s Private Sector Collective Action Coalition Against Corruption programme (Thai CAC) under Thai Institute of Directors (as of October 28, 2016) are categorized into:
- Companies that have declared their intention to join CAC, and
- Companies certified by CAC
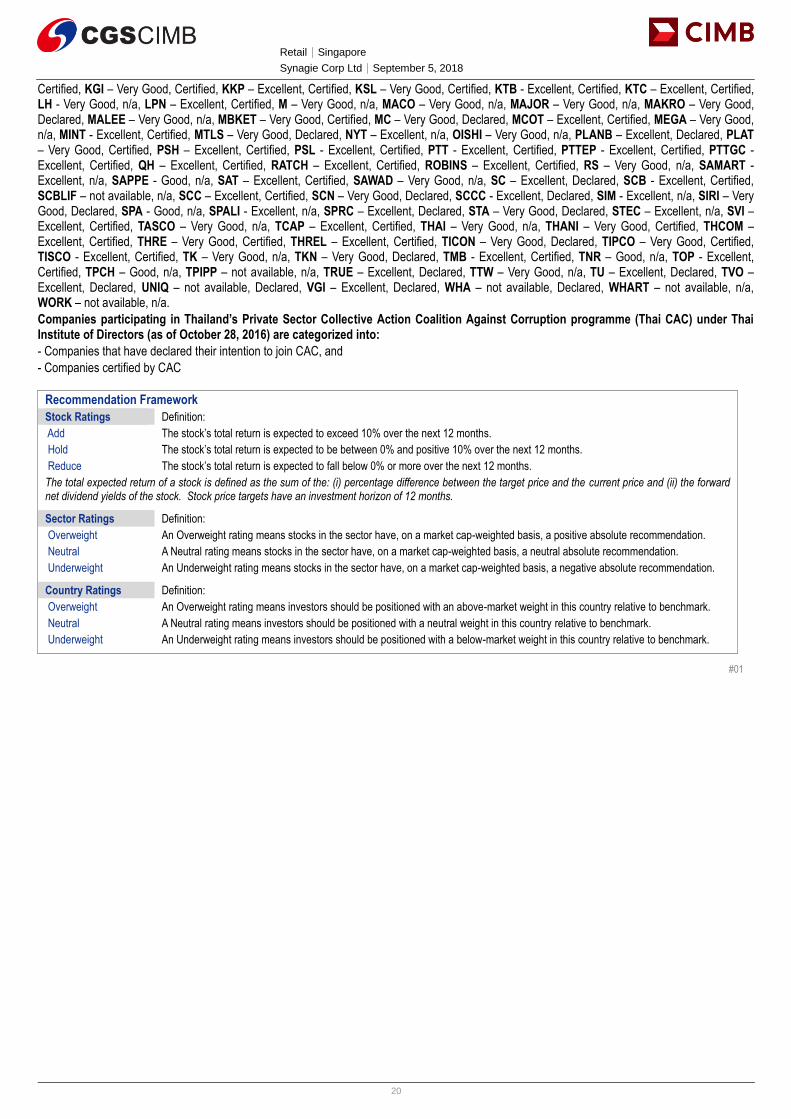
Recommendation Framework
Stock Ratings Definition:
Add The stock’s total return is expected to exceed 10% over the next 12 months.
Hold The stock’s total return is expected to be between 0% and positive 10% over the next 12 months.
Reduce The stock’s total return is expected to fall below 0% or more over the next 12 months.
The total expected return of a stock is defined as the sum of the: (i) percentage difference between the target price and the current price and (ii) the forward net dividend yields of the stock. Stock price targets have an investment horizon of 12 months.
Sector Ratings Definition:
Overweight An Overweight rating means stocks in the sector have, on a market cap-weighted basis, a positive absolute recommendation.
Neutral A Neutral rating means stocks in the sector have, on a market cap-weighted basis, a neutral absolute recommendation.
Underweight An Underweight rating means stocks in the sector have, on a market cap-weighted basis, a negative absolute recommendation.
Country Ratings Definition:
Overweight An Overweight rating means investors should be positioned with an above-market weight in this country relative to benchmark.
Neutral A Neutral rating means investors should be positioned with a neutral weight in this country relative to benchmark.
Underweight An Underweight rating means investors should be positioned with a below-market weight in this country relative to benchmark.
#01