compacted earthfill is a 3-phase material
TRANSCRIPT

Page 1 of 20
Compacted Earthfill
is a
3-phase Material
Abstract
This article describes the physics involved at each stage around the
hysteresis loop which encapsulates the wetting-drying cycle. As a 2-phase
dry soil-structure (solids and air) progressively takes in water, thereby
becoming a 3-phase system, it eventually becomes a water-saturated 2-
phase system. The reciprocal withdrawal of water during the process of
returning to the dry condition follows a different working path, thereby
involving a hysteresis effect which highlights the work needed to return to
the original state.
To allow a mathematical treatment of these physics, an idealized model
aggregation of uniform-sized spheres, arranged both in their loosest and
densest packing arrangements, is examined. Graphic representations of the
work/energy hysteresis are shown plotted against normalized axes which are
independent of particle size and moisture content.
Computer coding is provided for the permeability (hydraulic conductivity)
associated with any state of these multi-phase aggregations.
Soil Physics laboratory-derived drying cycle plots are given for three sand
size gradations made from a natural soil. A comparison between the
behaviour of these real materials and the idealized spherical model are
discussed, together with practical inferences which may be drawn from their
gradations or particle shapes.
The unexpected post-construction behaviour of two highly significant
engineering structures (Tarbela and Bennett Dams) caused serious concerns
regarding their stability, and consequently, resulted in the expenditure of
huge resources. Both the fears and the costs might perhaps have been
lessened had the controlling engineers appreciated that they were merely
witnessing the time-dependant aspects of a 3-phase material responding to
increasing moisture content.

Page 2 of 20
1. Introduction
It is beyond the reach of theoretical physics to anticipate the detailed
behaviour of soils: the clear impossibility of fully defining the exact material
idiosyncrasies of the grain aggregation simply has to be faced. But it is
equally clear that any possibility of putting rational boundaries, and perhaps
suggesting limits, or even defining the kinemathics of inter-particulate
contacts could be useful. It is in this sense/spirit that the following ideas are
put forward.
The approach adopted here is to simplify this intractable problem by
modelling the sand- and silt-sized soils of primary importance here as if they
were perfect spherical solids of uniform size, neatly arranged into well
defined geometric arrays. It is easily argued that examining the implications
of particle size and moisture content of partially saturated soils as if these
were well ordered arrays of spheres can have little to do with, or tell us
anything about, the real world of geotechnical engineering. And the author,
having spent his best years working on earthworks construction in the field,
freely acknowledges this deficiency. But then, whatever else can we do to
move above ground zero.
It is worth noting that there are excellent precedents for this simple
approach to engineering research. The frontispiece of the inaugural issue of
Geotechnique is a picture of Osborne Reynolds holding before him a
container of steel balls all of the same size. Presumably this symbolized
what he wanted to emphasise as a good avenue to future speculation.
Somewhat later, Peter W. Rowe, his successor at the University of
Manchester made much the same point to the Royal Society, and also in his
1969 Geotechnique article “Osborne Reynolds and Dilatancy”. This approach
seems to have gone out of fashion probably because later generations
supposed such eminent engineers/thinkers must have exhausted this means
towards enlightenment.
Anyway, the plain fact of the matter is that in order to make any advance in
practical physics (engineering) it is first necessary to come to know the main
principles which govern the kinematics of the system under investigation.
Then, using these rules as guidance, design/devise laboratory testing to

Page 3 of 20
tease out an understanding of the degree to which real materials depart
from those idealizations of behaviour.
2. Particle Packing
The geotechnical term most commonly used to define the extent of particle
packing density is void ratio (e). This is the ratio of void space to volume of solids. An equivalent term, porosity (η), is related such that η = e/(1+e).
The two extreme packing arrangements for uniformly sized spheres are
studied herein. The loosest possible packing has a void ratio where e =
(6/π) -1, or η = 0.476. It is called “cubic open” packing and is illustrated
in Figure 1a where it may be seen to consist of square arrays set directly
on top of each other. There are two entirely different ways of making the
densest packing, both having e = 6/( π√2) - 1, or η = 0.260. The “cubic
close” is where a square array sits in the troughs of the layer beneath is
shown as Figure 1b. The “hexagonal close” depicted in Figure 1c, which is
the dense packing adopted herein, is formed of triangular arrays nesting in
the troughs beneath. Particles in the loosest arrangement touch 6
neighbouring spheres, the cubic close 8, and the hexagonal close 12.

Page 4 of 20
3. Meniscus Forces & Volumes
Having conceded the need to adopt
uniformly sized spherical shapes in
regular arrays as a first approximation
to aggregations of soil grains we can
now move towards determining the
idealistic principles which govern earthfill
behaviour.
Figure 2 shows the Loose (cubic open)
and the Dense (hexagonal close) which
are the two extreme packing densities
considered hereinafter. In this sketch
they are shown with water
adhering/attached to them as menisci.
This is one case in the range of the 3-
phase system of solid, water and air.
Here the menisci are shown at their
maximum extent/volume where Θ is 45°
for the Loose case and 30° for the Dense
case. This is a threshold condition
where any increase in moisture content
will cause the menisci to collapse into a
new configuration which will be
discussed later.
From the geotechnical point of view it is the surface tension force (T) which
is of primary interest since it dictates the pressure difference between the
liquid and vapour phases. The following set of equations allow calculation of
the pressure deficiency (PD) between the water droplet with respect to the
void air:
PD = T (1/R1 – 1/R2 )
R1 = r ( sec 2Θ – 1 )
R2 = ( r tan 2Θ – R1 )
r = radius of the spherical particle, and
T = 0.0741 N/m at 10 °C.

Page 5 of 20
The complementary relationship between the volume of one complete
meniscus droplet (V) and particle size and extent of wetness is:
V = 8 π r3 sin4 Θ [ 1 - ( π/2 - 2Θ ) tan 2Θ ] / cos2 2Θ.
These equations, together with Boyle’s Law allow the full drying-wetting
hysteresis curves shown in what followings to be drawn.
4. Drainage of Pore Water from Voids
One of the most important lessons we geotechnical engineers can, and
indeed ought to, learn from Soil Physics is that once a saturated soil is
allowed to drain it is not an easy thing to re-saturate the soil-structure; this
is particularly difficult in finer grained soils. The goal of this technical essay
is to make this reality clear and, furthermore to point out the consequence
this apparently esoteric fact of nature can have on earthfill structures,
especially water retaining embankments.
In Soil Physics the phenomenon is referred to as the “ink-bottle effect”. This
out of date allusion is/was intended to illustrating the essence of the
situation. A very simple experiment makes the point: Find a small bottle
with a choked neck, fill it with water and invert it over standing water. The
water will remain inside the bottle and it will remain full until some air is
allowed to enter to release it. Now, to simulate a falling water table, lift the
rim of the bottle above the outside water level and, of course, the bottle will
empty. But, to simulate a rising water level, push the rim of the empty
bottle underwater, and it will be seen not to admit the outside water.
Obviously this is because the air can’t get out to let the water in.
Kindergartenesque though this experiment appears it nevertheless illustrates
the physical principle which prevails in the void spaces within an unsaturated
particulate mass. It’s easier to empty the voids than to refill them.
At a somewhat more refined level of experimentation, the results shown on
Figure 3 are from the author’s laboratory work for his masters degree. The
Soil Physics unit/measure of suction (sub-atmospheric pressure), use during
those experiments was pF, where pF is defined as Log10 cm H2O, and
therefore, is used here too. Various soil gradations (sands, silt, and clay)

Page 6 of 20
were tested throughout their full drying range from water-saturation to air-
saturation. Only the early, vapour condensation, stage of re-wetting was
achieved.
The three sands shown here are fractions of the same natural soil. The
particle sizes of the coarse specimen were from 2.0mm to 0.2mm, the fine
material 0.2mm to 0.05mm, and the third specimen was a mixture of 40%
coarse to 60% fine sand. The nature of the testing procedures ruled out
compaction of the specimens. Nonetheless, the moisture contents of the
coarse and fine specimens, starting out above 25%, implies looseness.
Incidentally, the lower initial amount of water in the mixed specimen can be
attributed to its better gradation.
The test results from
the coarse specimen
show a gradual water
loss from ambient
pressure down to
1pF, and then
between 1pF and
2pF, 73% of the
water content is lost
to pore drainage.
This response to
imposed suction
indicates (as will be
explained later) that
73% of the pores have an equivalent circular diameters varying between
0.30mm and 0.03mm. The fine specimen shows a gradual loss from 0pF to
2.5pF and then 75% of the water drains between 2.5pF and 3pF. The
equivalent circular pore diameters corresponding to these suctions are 0.01
mm and 0.003 mm. The moisture retention characteristics of the mixture
shows 88% of the water was lost between 1.5pF and 3.5pF. These suctions
correspond to pore sizes of 0.05 mm and 0.0005 mm. This upper limit is
less than the largest pores in the coarse sand, and the lower limit is only a
third of the size of the smallest pores in the fine sand. This overall reduction
in pore dimensions is caused by the finer grains particles filling some of the
pore spaces formed between the larger grains.

Page 7 of 20
5. Filling Dry Voids with Water
Even back in my student days the full drying curve had been defined all the way from ambient pressure down to absolute zero. But that was not the case with the reciprocal/reverse process of rewetting the dried-out pores. I presume this was because in Soil Physics there was little of practical interest in this aspect of soil behaviour. Perhaps this deficit has been rectified in the meantime and I am unaware of it. In any event it has been something I wanted to sort out for myself – to complete the cycle – to close the loop of drying and rewetting of the voids within the soil-structure. Basically, to see for myself if this phenomenon has/had any bearing on how we go about using Soil Mechanics. Just recently I’ve found time to do just that, and the purpose of this technical essay is to document what came out of that effort. With that aim in mind I now propose closed curves (e.g. Figures 4 & 5) which I believe represent the loci of a continuous relationship between moisture content and ambient or water pressure. So, using the above as a prelude, we can now move on to teasing out any geotechnical significance that may adhere to these hysteresis curves. But before doing so it is necessary to say something about the coordinate values against which the data points are plotted. We are quite familiar with the abscissa with its measures of either water content or percent saturation, but the ordinate scale needs some introduction.
A choice has been made to use a compound-logarithmic ordinate scale for
the following reason: Because of the great spread of pressure range data of
interest, a logarithmic scale is necessary to cover the full scope of activity.
And then, to have adopted absolute zero as the basis of measurement would
seem a foregone conclusion, thereby making any distinction between suction
and gauge pressure unnecessary. But unfortunately that would have
resulted in the most interesting and informative data would appear in the
Log10 3 region of the plot where detail would be virtually indecipherable. So,
in order to provide data clarity in the vicinity of atmospheric pressure, while
still accommodating very high values, two separate log scales were needed:
a pressure scale set directly above a suction scale.
However, it must be acknowledged that this procedure involves a
compromise with mathematical propriety: Since the unit weight of water is
1 gmf/cm3, the zero-ordinate (Log10 = 0) has the value 1 cm H2O pressure

Page 8 of 20
on the top side of the line, whereas the same line, on the suction side
representing 1 cm H2O of negative pressure. Therefore, a line which should
have no thickness, here turns out to be 2 cm wide. Nevertheless, I decided
to gloss over this mathematical nicety in favour of clarity of depiction.
6. Going around the Hysteresis Loop
Figure 4 is a graphical representation of the full wetting-drying cycle for
uniformly sized 0.3mm solid spheres arranged in their loosest packing
arrangements. This specific particle size was chosen because it is of interest
to me with regard to earthquake liquefaction. In the generality of 3-phase
physics the void space between the solid particles can be occupied by either
liquid or vapour, or some combination of both. In geotechnical engineering
the liquid is water and the vapour is air.
Page 9 of 20
Point B is reached by depressing the ambient water pressure by the amount
necessary to create a suction which will permit an air bubble to enter the
void spaces through the openings available between the solids. This, in a
mass of uniformly sized spheres, results in the drainage of most of the pore
water. So, the system then passes from a 2-phase to a 3-phased one.
At Point C the loss of water comes to a halt, and cannot be further reduced
unless there is a further depression in pore water energy. The reason for
this impediment is that any remaining water is held within the menisci where
particles touch, which incidentally, at this point are holding only slightly
more than 20% of their water capacity. The continuity of the water phase
has therefore been broken, and phase continuity now resides in the pore air
alone.
To reach Point D, where pore energy is zero, further drying is necessary and
this may be brought about by evaporation or transpiration. The outside
ambient water level is irrelevant.
Similarly, Point E can only be reached from D or C by increased humidity
and condensation of vapour into the menisci, thereby increasing the
moisture content while lessening the suction level (increasing the pore
energy).
Point E is a state of extreme instability. This is because the menisci’s ability
to hold water are at their full capacity and these are on the point of
brimming over as depicted in Figure 2: They cannot expand without
interfering with adjacent menisci. I was stuck for a long time at this
apparent impasse. Finally, however, having reasoned that the only
physically plausible outcome under the conditions that pertained there and
then was a catastrophic inversion of the air/water interfaces. An event
where/when the menisci surfaces flip to a complete reversal of their previous
role - from one of constraining the water against the particles, to one of
containing the void air within a modified bubble.
This idea is entirely consistent with the understanding that the natural
tendency of surface tension is to minimize it’s area (reduce energy potential)
Page 10 of 20
and the fact that at this physical/theoretical crisis point the combined area of
the menisci surfaces are more than necessary to enclose the existing void air
in a bubble of modified shape. During the ensuing implosion there is an
energy expenditure without any possible response from the outside ambient
prevailing energy of the system as a whole. And it is to rectify this
nonconformity that explains the next position along the wetting cycle.
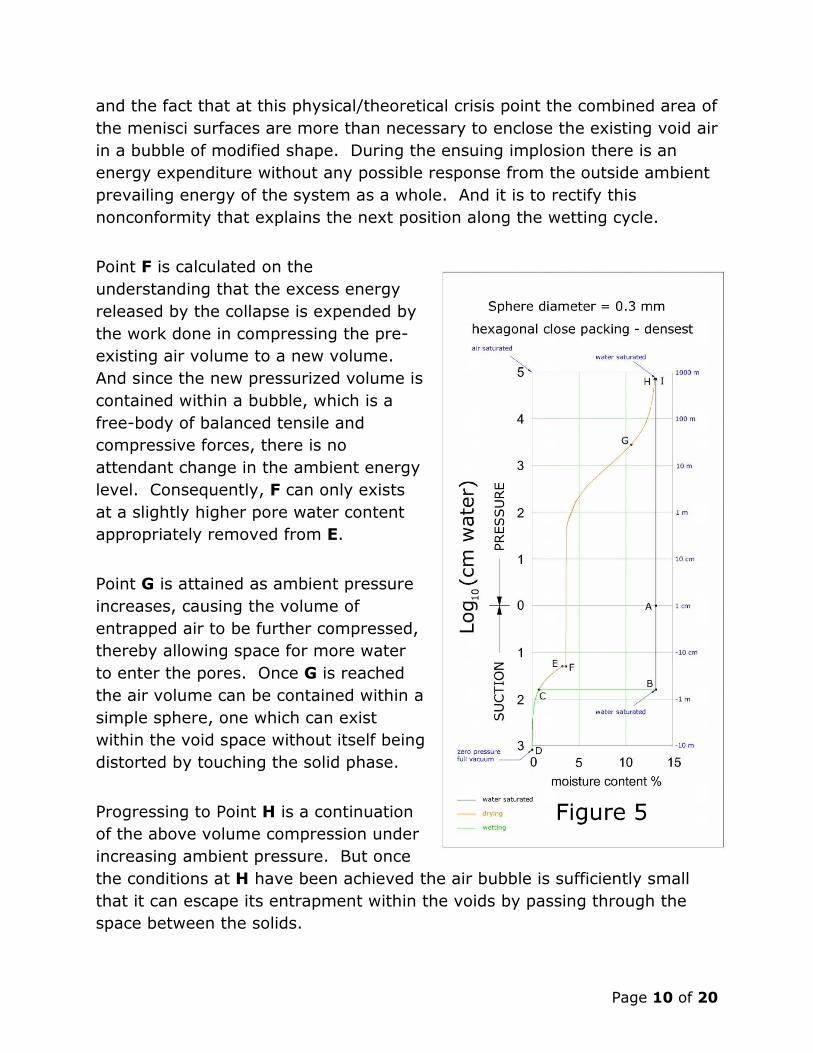
Point F is calculated on the
understanding that the excess energy
released by the collapse is expended by
the work done in compressing the pre-
existing air volume to a new volume.
And since the new pressurized volume is
contained within a bubble, which is a
free-body of balanced tensile and
compressive forces, there is no
attendant change in the ambient energy
level. Consequently, F can only exists
at a slightly higher pore water content
appropriately removed from E.
Point G is attained as ambient pressure
increases, causing the volume of
entrapped air to be further compressed,
thereby allowing space for more water
to enter the pores. Once G is reached
the air volume can be contained within a
simple sphere, one which can exist
within the void space without itself being
distorted by touching the solid phase.
Progressing to Point H is a continuation
of the above volume compression under
increasing ambient pressure. But once
the conditions at H have been achieved the air bubble is sufficiently small
that it can escape its entrapment within the voids by passing through the
space between the solids.

Page 11 of 20
Point I is attained as a result of the air venting once H has been reached,
thereby completing the wetting cycle and the soil becoming a water
saturated 2-phase material again. This system cannot become air-entrained
again without being subjected to the conditions attending Point B, and
thereafter starting into another drying cycle.
Figure 5 represents exactly the same pattern of behaviour for the same
sized assembly of sphere, but in this case, arranged in the densest packing.
Both figures are drawn to the same scales, the relative narrowness of the
dense packing reflects the smaller void spaces available for water &/or air.
7. Water Retention within the solid aggregation
The locus of any/all viable instances of geotechnical 3-phases systems is
constrained to fall somewhere or other on the lines bounding the hysteresis
confinement; there is no other physically compatible placement at normal
groundwater temperatures. The drying cycle is controlled initially by
exerting suction on the ambient (exterior) water, then by evaporation. The
wetting cycle is advanced initially by condensation, then after collapse a E,
by increasing ambient water pressure.
The important geometric relationship governing the idealized aggregations
dealt with herein is that of the maximum spherical opening which exists
between the solid spheres, that through which an air bubble can either enter
or exit the void spaces. This is equal to (√2–1)D for the loose packing and
(2/√3–1)D for dense arrays, where D is the diameter of the solid spheres.
This opening size controls both the initial air entry at the start of the drying
stage (B), and again at the end of the wetting stage (H) to permit the
release of the air from the system.
At both extremes of drying and wetting it is worth noting the following: At
the dry extreme (D) we encounter a situation which bears on the survival of
humanity, because when suction exceeds 10m we pass the point where
plants can any longer suck/draw water from the soil – what in agriculture is
called the “permanent wilting point”. Then, at the top of the hysteresis we
see that in order to purge the system entirely of entrained air, very high
ambient pressures are theoretically needed - about 100m in the case of
Page 12 of 20
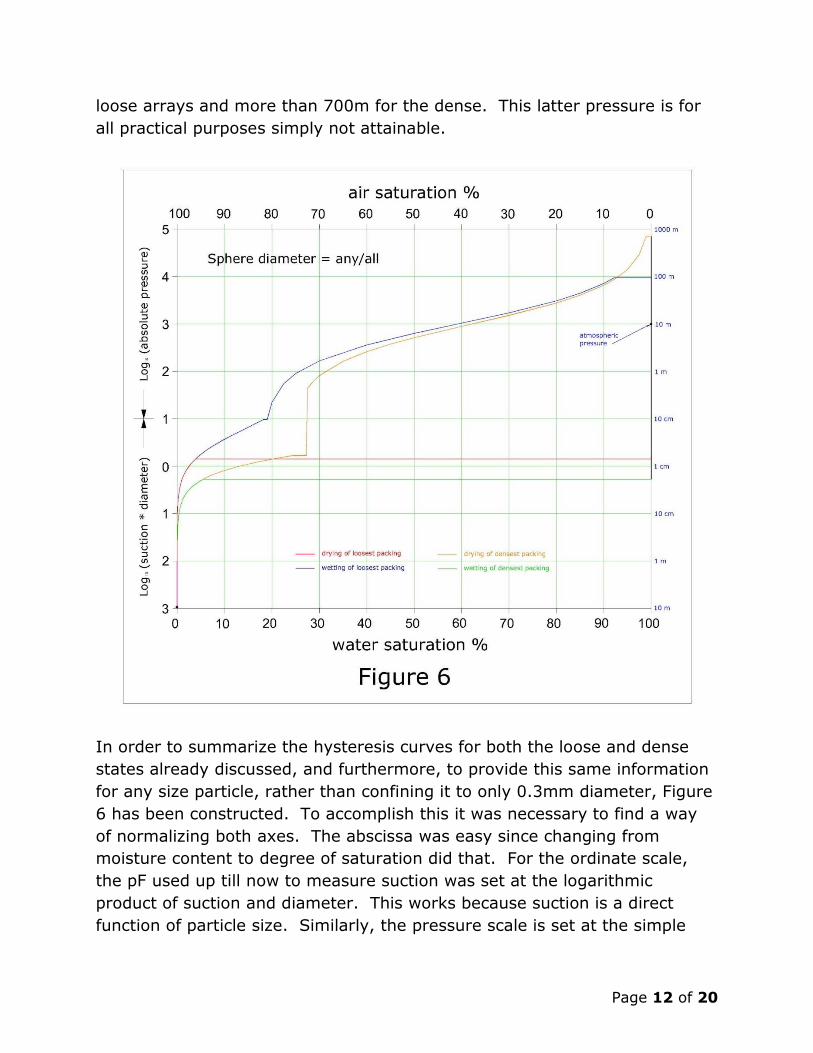
loose arrays and more than 700m for the dense. This latter pressure is for
all practical purposes simply not attainable.
In order to summarize the hysteresis curves for both the loose and dense
states already discussed, and furthermore, to provide this same information
for any size particle, rather than confining it to only 0.3mm diameter, Figure
6 has been constructed. To accomplish this it was necessary to find a way
of normalizing both axes. The abscissa was easy since changing from
moisture content to degree of saturation did that. For the ordinate scale,
the pF used up till now to measure suction was set at the logarithmic
product of suction and diameter. This works because suction is a direct
function of particle size. Similarly, the pressure scale is set at the simple

Page 13 of 20
logarithm of absolute pressure since void-confined air volume is not related
to particle sizes.
The normalized axes of Figure 6 help to show that the area within the
hysteresis curves is a function of work/energy since “pressure by volume”,
being equivalent to “force by distance” carries the dimensions of energy.
8. Permeability of aggregation
Entrained air bubbles impede water flow through the pores of the soil and
consequently reduce water permeability (hydraulic conductivity), and they
do so to the same degree as would a solid particle of the same size. So the
permeability of a 3-phase system depends upon the locus its state occupies
on the drying-wetting curve.
Between Points I and B the system is fully saturated (2-phase) and
permeability is at its maximum because all of the pore space is available for
water flow. Beyond C in the drying cycle permeability is completely lost, and
remains zero all the way past E. This is because there is no water continuity
within the pores, only isolated annuli of menisci attached at particle
contacts. It is not till the collapse of E to F that some water continuity is
restored. Thereafter it gradually increases as the volume of void air is
progressively squeezed smaller by increasing ambient pressure. Finally,
when the 3-phased system arrives at Point H the air bubble has been forced
small enough to escape from the pore space, allowing replacement water to
attain the 2-phase state again at I. It should be noted that in the 2-phased
state the ambient water pressure has no effect on permeability and can be
increased to any level. And provided it does not fall to Point B (which would
return the system to a 3-phase state) permeability remains at its maximum
value.
For my own use I have written a computer program to estimate hydraulic
conductivity; the source coding is freely available at Reference 1. This
program employs user-supplied input values for soil-structure void ratio,
particle size distribution, hydraulic gradient, and water temperature in its
computations. It uses the J.S. Kozeny inspired technique whereby an
equivalent pipe diameter can be assigned to any soil aggregation by

Page 14 of 20
equating the Fluid Mechanics parameter, hydraulic radius, to the Soil
Mechanics ratio of pore volume to surface area of all the grains. Once in the
pipe-analogy mode it is a simple matter to determine conductivity from a
combination of the Darcy–Weisback formula and the Colebrook equations for
surface roughness (e/D = 0.05 adopted herein). Flow types ranging from
laminar to turbulent are then assigned appropriate parameters based on
their Reynolds Number.
The presence of entrained air bubbles can be accommodated by entering
bubble sizes and frequencies into the particle size distribution as if these
bubbles were solid particles. These equivalent particle diameter DAIR can be
calculated from their prevailing system locus/position on Figure 5 as follows:
DAIR = D (e ASAT )1/3, where ASAT is the degree of air saturation expressed as
a decimal quantity.
9. Apparent Cohesion
Pure water has high tensile
strength. This is obvious from
the height to which trees can
feed water from root level to
their leaves, with some in the
Redwood National Park, California
having been measured taller than
100m. Under ideal laboratory
conditions water has been shown
to have a maximum tensile
strength of about 3,000m of
head. But any impurity or water
bubbles in the column will greatly
diminish this value, as is attested
to by the 5m limit to which
suction pumps are useful/reliable.
It must be emphasised that the cohesion being considered here is not the
permanent kind that comes from chemical or adsorbed water bonding
between naturally occurring soils. Rather, the following refers to the
“apparent” cohesion (CA) that which depends on the presence of menisci

Page 15 of 20
between particles within a partially saturated soil as depicted in Figure 2.
This cohesion is ephemeral inasmuch as it disappears when/if the soil
becomes saturated with water.
The equations relating to menisci
listed in Section 3 allow CA to be
calculated. Both the surface
tension of the water/air interface
together with the relative
pressure deficiency in the liquid
phase contribute to a tension
between touching particles. That
tensile force, tending to pull the
particles together, can likewise be
appreciated as a cohesive force
resisting them being pulled apart.
And in this context we call such a
resistance “cohesion”.
Before being able to speak of cohesive as a stress/strength parameter, for
instance as it is shown in Figure 7, it is necessary to stick with it in terms of
a force vector a while longer. This is because in the case of loose (cubic
open) packing each particle touches 6 neighbours, and for the dense
(hexagonal close) packing the number of interparticle contacts is 12. Since
each contact has an attached meniscus we must resolve these several forces
and find the resultant, and that, in the direction we are interested in.
Afterwards we are able to slip into thinking in terms of stress, by dividing
the resultant by the area the particle occupies on the plane orthogonal
(normal) to the force. The data points behind the curves drawn in Figures 7
and 8 were computed accordingly.
Figure 7 shown here relates the values of apparent cohesion plotted against
particle size. Here cohesion is quoted in terms of stress, using the
dimension (gmf/cm2) as elsewhere within this document. These data are for
the particular case of 10% water saturation. As a generality three things are
obvious: cohesion is greater for denser packing; cohesion increases rapidly
with decreasing particle size; cohesion is of much more significant in silts
(<0.06mm) than in sands. Figure 8 plots the same data against normalized

Page 16 of 20
axes in order to present data for any particle size &/or the full range of
water saturation.
It needs to be noted that interparticle menisci can exist only for the
conditions that prevail between the Points D to E, thus CA cannot be
generated outside/beyond that stretch of the hysteresis curve. Somewhat
counter intuitively, the highest cohesion does not reside where the menisci
are most voluminous - it exists near the point of almost complete dryness
(near D). The qualifier “almost” is required because although maximum CA
occurs when R1 & R2 are minimum, obviously when there is no water there
can be no cohesion.
In their designs, geotechnical engineers quite rightly take the position that
placing any reliance on CA would constitute an unwarranted risk, and in
consequence, assume the ground is saturated, that being the ground’s
weakest state from the perspective of shear strength. However, this
“sensible” assumption unintentionally brushed aside the sometimes
undesirable implications/consequences of making unsaturated (3-phase)
soils much less predictable and manageable in practice. This issue is
addressed in the following section.
10. Consequence to earthfill and tailings dams
Although the following discussion refer to the post-construction behaviour of
two large hydroelectric dams, much the same principles and consequences
are applicable to tailings dams. In the latter case there is more reason to be
fearful, because they are built for speculative mining operators who
generally cannot predict their final dimension . . . they are always a work-in-
progress. In comparison the dams owned and operated by public utilities
are built in one continuous sequence and made to endure, and also get the
supervision, monitoring and maintenance they warrant.
Earthfill embankment dams can be the source of high water pressures within
the pore spaces of the soil-structure. And since the earthfill is normally
placed and compacted in an unsaturated state such pressures can be an
important instance of a 3-phase material. As soon as the reservoir begins to
be impounded, and water invades the fill, the forces of cohesion between

Page 17 of 20
individual smaller particle inevitably change to some extent here and there
throughout the dam.
Common practice in earthdam embankment construction is to ensure the
earthfill is partially dry when placed ready for compaction/densification. The
target placement moisture content for the non-plastic (discrete particle)
types of fill modelled theoretically herein is typically “2% dry of optimum”.
Optimum here refers to that moisture content which has been determined at
the site laboratory to yield the highest packing density for that specific
material, and optimum itself falls about 5% short of water saturation.
Therefore, these earthfills start out between Points D and E on the
hysteresis curve, both because they are not saturated, and no ambient
water pressure is applied.
Compacting the fill in a moist (3-phase) state has the advantage that
interparticle cohesion facilitates the compactive effort by restraining the
otherwise free movements of grains. On the other had it renders the fill
vulnerable to some degree of soil-structure collapse and readjustment if
subsequently, after reservoir impoundment, conditions come to prevail
where the system moves past Point E, towards Point G, whereupon all
cohesion would be lost.
Two field cases are now discussed where characteristics of the 3-phase
model behaviour are applied to earthdams in order to see if they can help
understand post-construction behaviours, manifested as surface
depressions, which caused major fears about the stability of these world-
class structures. Tarbela dam on the Indus River in Pakistan’s NWFP will be
used to illustrate upstream problems; Bennett dam on the Peace River in
western Canada for downstream problems.
10.1 Upstream problems
During my residence there, Tarbela Dam was the largest earthfill dam in the
world – and surely it was also the most troubled. The earthworks were
instrumented, and monitoring was conscientious. After several years of
attempting to fill the reservoir it was noticed that the piezometric surface
across the “impervious core” did not conform to the design intent. Rather
Page 18 of 20
than the pore water pressure gradually reducing from reservoir level at its
upstream side of the dam to tail-water level on the downstream side, there
was no perceptible loss across the wetted extent of the core. So,
piezometers close to its downstream side were registering the full,
undiminished, force of the reservoir.
Credit must be given to John Lowe III, geotechnical engineer and senior
partner of TAMS NY who designed the dam. He correctly diagnosed this
otherwise fearful condition as being a natural consequence of the core
actually being effectively impervious to water. Therefore, the situation being
that no reservoir water was flowing through the core, the wetted upstream
part of the core, quite properly, showed no piezometric losses; while the
downstream part was still almost dry. He attributed the impervious nature
of the dry part of the core to air entrainment within its pore spaces making
that material essentially impervious to water. This explanation allayed the
fears in this specific regard.
The upstream face of a high earthdam is a good instance of 3-phase soil
behaviour under large ambient pressure reversals. Each year the reservoir
level changes, often by a matter 100 metres or more, from full pond to dead
storage. Depending on soil gradation and elevation within the embankment
this could well be enough to put pores through their full wetting-drying cycle
year after year. Suffering such repetitions of loss and reestablishment of
cohesive forces, it would not be surprising if there was a significant re-
aggregation of the discrete particles from which the fill is composed. Under
such circumstance, however well the earthfill had been compacted, it must
be expected that somewhere or other in the millions of cubic metres of
earthfill, pockets of loosened fill might align themselves to make for a
preferred seepage channel.
When a sinkhole appeared on the upstream face of Tarbela at about 50m
below water level the reservoir was dumped. To fully appreciate the gravity
of this situation coloured photographs help: Reference 3 shows several.
Despite the hundreds of sinkholes that had already appeared in the
upstream blanket, it was thought that the main embankment itself would not
suffer one. This expectation was based on the hypothesis that sinkhole
vulnerability was related to the magnitude of differential hydraulic pressures
exerted across the impervious blanket; the higher the differential the less

Page 19 of 20
brittle the soil behaviour. As the differential was greatest at the dam section
it was thereby predicted that a sinkhole would be less likely thereabouts.
Unfortunately, such proved not to be the case.
Subsequently, I have come to believe this sinkhole was precipitated by fill
density reduction brought on by large swings round and about the hysteresis
curve as the reservoir level rose and fell during its annual usage.
10.2 Downstream problems
Two depressions (“sinkholes”) appeared on the crest of Bennett dam on the
Peace River at Portage Mountain in British Columbia. Prior to this happening
the core instrumentation indicated behaviour similar to what had been
recorded some years before at Tarbela, a decades-long period when the
wetted front moved ever so slowly downstream. This suggested to me an
explanation, in fact two explanations, for the subsequent development of
sinkholes/depressions downstream. Both conceptual mechanisms fit, better
or worse, with what might be expected to happen quite naturally during the
course of time within an earthfill, simply because of it being constructed of a
multiphase material.
Both proposition had in common John Lowe’s explanation that the advance
of the wetted front was stalled by air entrapped in the voids ahead of the
front. Now, as I perceive it, since the downstream unsaturated core
material would have been a 3-phase material in a state somewhere between
Points D and E, that material would have been virtually impervious, as John
Lowe explained at Tarbela. So, in order to render that dry core water-
permeable it’s state had to move past Point E. And it is here that my two
conceptual mechanisms differ: in the manner by which the front eventually
manages to creeps forward at all.
My first idea was that, at the immediate front, the water on the upstream
(u/s) water-saturated side, might take the void air on the downstream (d/s)
side into solution, thereby removing it as an obstacle to seepage flow. But
in order to persist with this air removal activity it would be necessary for the
water at the front to replenish its air- solution capacity. My thought at that
time was this could only be done by dissipation: passing the air u/s to the
reservoir. This would maintain some level of receptive, “empty” water at the

Page 20 of 20
face to continue the work. Of course this would take a lot of time, but that
was one of the characteristics that need to be accounted for anyway. The
design team must have given the idea enough credence to subsequently
publish this concept in Geotechnique, or so my colleagues tell me.
My second, and current idea, is that the frontal advance would more likely
have been accomplished by differential vapour pressures at the interface,
whereby evaporation from the water saturated pores on the u/s side would
have condensed on the menisci downstream. Thereafter, once Point E had
been reached in this way, the high (full reservoir) pressure front could exert
its influence by compressing the void air volume still remaining on the d/s
side, pushing towards Points H and I, and all the while making the core
more permeable to water. This, of course, being also a slow process would
similarly explain the time-lapse phenomenon characteristic of the experience
on both dams.
The eventual breakthrough of the wetted front to the downstream face of
the core would then allow the onset of steady-state-seepage flow. Once that
happened, the downstream side of the embankment would come to
experience drainage water for the first time. And since the two
sinkholes/depressions at Bennett dam developed coincident with the
positions of two vertical settlement gauge pipes, it is altogether possible the
whole incident could be accounted for by the backfilling around those vertical
pipes getting wet, and the attendant new cohesive forces causing
contraction of that fill material. It is to be expected that fill closely
surrounding instrumentation does not get the same degree of compaction as
the shell fill itself, and in consequence, it is more vulnerable to volume
changes.
11. References
[1] Hodge, W.E, Computer Coding for Computation of Soil Permeability
http://www.phoenix-hodge.com/computer%20programs.html.
[2] Baver, L.D., Soil Physics, John Wiley: London and New York, pp. 100-
101, 1966
[3] Hodge, W.E, Photographs of Tarbela Dam Main Embankment Sinkhole
http://www.phoenix-hodge.com/tarbela.html