compact thermal energy storage: material development for system...
TRANSCRIPT

IEA SHC/ECES – Task 42/24 – Compact Thermal Energy Storage
Collection of experimental data on the
behavior of TCM/PCM-materials to bench-
mark numerical codes
Report A3.2 of the Working Group on Numerical Modelling
December 2012
Paul Gantenbein Camilo Rindt
A report of the IEA Solar Heating and Cooling / Energy Conservation
through Energy Storage programme – Task 42/Annex 24:
Compact Thermal Energy Storage: Material
Development for System Integration

2
Collection of experimental data on the
behavior of TCM/PCM-materials to bench-mark numerical codes
by
Paul Gantenbein, Camilo Rindt

3
Short description Working Group A3 Numerical Modelling
INTRODUCTION
The activities in this working group are aimed at developing and testing numerical
models that help to understand and optimise the material behaviour and the dynamic
behaviour of compact thermal energy storage systems and components based on Phase
Change Materials (PCM’s) and Thermo Chemical Materials (TCM’s). Ultimately, these
numerical models could help to find ways to optimise the materials in combination with
the system components. The activities in this working group help to lay the foundation
for such models.
The Working Group includes the following activities:
Micro-scale modelling
Meso-scale modelling
Macro-scale modelling
Multi-scale approach
Thermo-mechanical modelling
Reactor models
Not all activities receive the same amount of attention in the Working Group and the
distinction between the various scales is not always clear. The figure below presents an
attempt to quantify the micro-, meso- and macro-scales in a time-length framework but
it has to be realised that the definition of the scales is highly dependent on the problem
at hand.
Figure 1: Definition of micro-, meso- and macro-scales in a time-length
framework.
DELIVERABLES
The following deliverables are set.
# Deliverable Month
A3.1 Report on state-of-the-art modeling techniques of TCM/PCM-
materials on micro-, meso- and macro scales
12
A3.2 Collection of experimental data on the behavior of TCM/PCM-
materials which can be used to bench-mark numerical codes
30
A3.3 Overview of material properties required for increased storage
performance compared to conventional storage techniques
48
A3.4 Final report on the (validated) numerical models developed for
the micro-, meso-, macro and multi-scale
48

4
Deliverable A3.2: collection of experimental data on the behavior of TCM/PCM-materials to validate numerical models
MOTIVATION
In the developing process of a heat storage device experiments play a dominant role
because in the prototype stadium a physical system has to be built to acquire
measurement data for fine tuning of the pilot and market product. In this development
process numerical modelling plays the role of reducing the number of time consuming
and cost intensive experiments. And modelling should help to understand how the
limiting parameters can or should be adapted for the assigned task.
In the former deliverable A3.1 it is shown that numerical models are being developed for
all kind of length scales (and time scales), ranging from the molecular level, f.e.
Molecular Dynamics simulations to gain insight into the hydration/dehydration kinetics,
up to the reactor level, f.e. CFD-calculations to simulate the time-dependent heat and
vapour flows in a fixed-bed reactor. For validation purposes all these models need to be
confronted with results of detailed experiments and it is needless to say that this should
be done on as many length scales as possible. Therefore, the contribution of
experimental results from one group and the use of these results to validate numerical
models developed in another group is appreciated.
This report contains a collection of various experiments. The focus is not only on the
measuring results but the report also presents detailed descriptions of the experimental
set-ups, the materials tested and their physical properties and the measuring
procedures.
OUTLINE
The document is structured in two main parts focussing on PCM and TCM experiments.
Each section describes a typical experiment and has a fixed outline:
1. introduction;
2. lay-out of the experimental set-up including dimensions and material properties;
3. detailed description of the measuring procedure;
4. results presented in graphical or table form;
5. closure containing contact details.
5
Table of contents
SHORT DESCRIPTION WORKING GROUP A3 NUMERICAL
MODELLING ................................................................................... 3
introduction ............................................................................................................................................... 3
Deliverables .............................................................................................................................................. 3
DELIVERABLE A3.2: COLLECTION OF EXPERIMENTAL DATA ON THE BEHAVIOR OF TCM/PCM-MATERIALS TO VALIDATE NUMERICAL
MODELS ......................................................................................... 4
Motivation .................................................................................................................................................. 4
Outline ......................................................................................................................................................... 4
TABLE OF CONTENTS ..................................................................... 5
PHASE CHANGE MATERIAL MODELS ............................................... 7
Introduction .............................................................................................................................................. 7
Detailed experimental results for PCM Melting and solidification in circular tubes
and spherical shells ............................................................................................................................... 8
Detailed Experimental Results for Submerged Finned Heat Exchanger in PCM
Based Thermal Energy Storage ..................................................................................................... 12
Experimental results for PCM-Air heat exchangers: Melting and solidification in
flat plates (CSM panels from rubitherm) .................................................................................. 15
Heat storage system coupled with a photovoltaic panel .................................................. 21
THERMO-CHEMICAL MATERIAL MODELS ...................................... 27
Introduction ............................................................................................................................................ 27
HYDRATION AND DEsHYDRATION OF SORPTION MATERIALS: EXPERIMENTS IN
A SMALL-SCALE REACTOr ................................................................................................................. 28
Adsorption heat storage: Dynamic properties ....................................................................... 34
Fixed bed reactor for Hydration / dehydration or adsorption / desorption
experiments ............................................................................................................................................ 39
Adsorption heat storage: EQUILIBRIUM properties DETERMINATION WITH
COMPARISON TO MOLECULAR SIMULATIONS ....................................................................... 45
Characterization OF the dehydration reaction OF SEVeral crystalline salt
hydrates uNDER the condtions of the seasonal heat storage ........................................ 51
Short Description of Task 42/ annex 24 ................................................................................... 55

6
Objective ................................................................................................................................................... 55
Scope .......................................................................................................................................................... 55
Structure ................................................................................................................................................... 55
IEA SOLAR HEATING AND COOLING PROGRAMME ....................... 57
Appendix “Detailed Experimental Results for Submerged Finned Heat Exchanger
in PCM Based Thermal Energy Storage” by NM. J. CHIU and V. MARTIN ................. 61

7
Phase Change Material Models
INTRODUCTION
Nowadays, thermal energy storage systems are essential for reducing dependency on
fossil fuels and then contributing to a more efficient environmentally benign energy use.
Thermal energy storage can be accomplished either by using sensible heat storage or
latent heat storage. Sensible heat storage has been used for centuries by builders to
store/release passively thermal energy, but a much larger volume of material is required
to store the same amount of energy in comparison to latent heat storage. The principle
of the phase change material (PCM) use is simple. As the temperature increases, the
material changes phase from solid to liquid. The reaction being endothermic, the PCM
absorbs heat. Similarly, when the temperature decreases, the material changes phase
from liquid to solid. The reaction being exothermic, the PCM desorbs heat.
The phase change materials used in applications can be either organic materials or
inorganic materials. The organic PCM are paraffins, fatty acids and the polyethylene
glycol (PEG). They present a congruent phase change, they are not dangerous, and they
have a good nucleation rate.
The advantages of organic PCM are:
availability in a large temperature range,
freeze without much super cooling,
ability to melt congruently,
self nucleating properties,
compatibility with conventional material of construction,
no segregation,
chemically stable,
high heat of fusion,
safe and non-reactive,
recyclable.
The disadvantages of organic PCM are:
low thermal conductivity,
low volumetric latent heat storage capacity,
flammable (depending on containment).
The inorganic PCM are salt hydrates.
The advantages of inorganic PCM are:
high volumetric latent heat storage capacity,
low cost and easy availability,
sharp phase change,
high thermal conductivity,
non-flammable.
The disadvantages of inorganic PCM are:
high volume change,
super cooling,
segregation.
PCM are used in systems for passive or active applications. The objective of numerical
modeling is to predict the behavior of systems depending on the heat and/or mass
transfers involved.

8
DETAILED EXPERIMENTAL RESULTS FOR PCM MELTING AND SOLIDIFICATION IN CIRCULAR TUBES AND SPHERICAL SHELLS
G. ZISKIND, Heat Transfer Laboratory, Department of Mechanical Engineering, Ben-
Gurion University of the Negev, Beer-Sheva 84105, Israel
INTRODUCTION
Extensive experimental investigations are performed for circular vertical tubes and
spherical shells containing paraffin-type PCMs. Visualization makes it possible to obtain
melt fractions and patterns for various instants. Thus, a significant database is created
for validation of the numerical codes, not only in terms of overall parameters but also
concerning the details.
LAY-OUT OF THE EXPERIMENTAL SET-UP
The experimental set-up for melting is shown schematically in Figure 1. Experiments are
performed in a transparent tank, filled with water. In order to keep a constant water
temperature, an electric heater is used, and its power is adjusted using a variable
voltage controller. In order to ensure uniform temperature of water inside the tank, a
mechanical turbine-type stirrer is used. In a typical experiment, a transparent vertical
tube/spherical shell filled with the solid PCM is placed into the water. The experiment
continues until the PCM has melted completely.
Figure 1: Schematic view of the experimental set-up.
Circular tubes of four different diameters are used, with the inner diameters of 0.9, 1.93,
3.14, and 3.92cm. These tubes are referred to using their nominal diameters of 1, 2, 3,
and 4 cm, respectively. The water level is set at 23.5 cm above the tank bottom. The
height of the solid PCM inside the tube is 6, 12 or 17cm. At its top, the tube is open to
atmosphere, in order to allow free expansion of the melt liquid. From below, the tube is
sealed by a cork made of an insulating material. In each tube the experiments are
performed at the water bath temperatures 10, 20 and 30°C above the melting point of
the PCM. Thus, the four different diameters, three heights and three temperature
differences bring the total number of cases explored in the present study to thirty-six.
Similar experiments are performed for spherical shells and could be expanded to various
diameters and temperature differences. Details of the shells are given in the references.
Solidification is studied using a Neslab RTE 7 circulating thermostatic bath, which
maintains a desired temperature within 0.1°C. The bath is kept typically at 10 or 20 °C
below the mean solidification temperature. The shell is inserted in the bath when the PCM
temperature is typically few degrees above its mean melting temperature.
Material properties

9
The material used in the experimental study is the RT27 paraffin wax (Rubitherm GmbH),
claimed to be suitable for heat-storage applications. Its properties, given in the
references, are close to n-octadecane. Melting occurs at a temperature about 28°C.
DETAILED DESCRIPTION OF THE MEASURING PROCEDURE
For melting, the initial shape of the solid PCM is cylindrical/spherical, with a flat top. In
order to achieve a desired shape, the tube/shell is filled gradually with a liquid PCM
allowing the latter to solidify at each stage. As a result, no void is formed close to the
centerline/centerpoint of the tube/shell. Sample preparation is performed at a reduced
ambient pressure, in order to prevent air entrapment in the PCM. Visualization has been
chosen as the major method of investigation. Melting images are recorded by a digital
camera at various stages of the process. Then, these images are analyzed and the
experimental values of the melt fraction are calculated at various instants.
For solidification, thin plastic shells are used, which can be sawed with the PCM after the
latter has solidified completely or on the intermediate stages of the process. Two series
of the experiments are performed. The first series is conducted in shells of 30 mm and
70 mm in diameter up to complete solidification. The shells are then cut in halves, and
the solid shape recorded. The second series is conducted in shells of 40mm in diameter,
where each shell is withdrawn from the bath at a prescribed time. The shell is cut in
halves, the remaining liquid is removed and the solid shape is recorded.
RESULTS
The results for melting in circular tubes are summarized in Figure 2, in terms of the melt
fraction versus time. The melt fraction is defined as the melted mass divided by the total
mass of the sample.
Figure 2: Experimental results for melting in circular tubes.
An example of the visualization results for solidification in a spherical shell is presented in
Figure 3, along with its numerical simulation.

10
a. numerical b. experimental
Figure 3: Example of the results for solidification in spherical shells
(D=40 mm, T=20 °C).
CLOSURE
300s
600s
900s
1200s
1500s
11
An extensive database has been created for melting and solidification of PCM in circular
vertical tubes and spherical shell. The accumulated data includes also detailed
melting/solidification patterns based on visualization. Thus, these data can be used for
benchmarking. Further information is available (see the Bibliography or contact
BIBLIOGRAPHY
[1] E. Assis, L. Katsman, G. Ziskind, R. Letan (2007) Numerical and experimental
study of melting in a spherical shell. Int. J. Heat Mass Transfer 50, 1790-1804.
[2] L. Fraiman, E. Benisti, G. Ziskind, R. Letan, Experimental investigation of melting
in vertical circular tubes, Proceedings of the ASME Biennial ESDA Conference,
Haifa, Israel, 7-9 July 2008.
[3] E. Assis, G. Ziskind, R. Letan (2009) Numerical and experimental study of
solidification in a spherical shell. ASME Journal of Heat Transfer 131, 024502.
[4] H. Shmueli, G. Ziskind, R. Letan (2010) Melting in a vertical cylindrical tube:
Numerical investigation and comparison with experiments. Int. J. Heat Mass
Transfer 53, 4082-4091.

12
DETAILED EXPERIMENTAL RESULTS FOR SUBMERGED FINNED HEAT EXCHANGER IN PCM BASED THERMAL ENERGY STORAGE
NW. J. CHIU* and V. MARTIN, Department of Energy Technology, Royal Institute of
Technology, 10044 Stockholm, Sweden (*[email protected])
INTRODUCTION
Various means have been investigated for the goal of overcoming the low thermal
storage/extraction rate with use of phase change materials (PCMs) in active thermal
energy storage systems (TESs). The most common means employed are surface
extension techniques, such as encapsulation, heat-exchange-surface extension, and
material thermal property enhancement, for instance with highly conductive
additives/matrices. Numerous simulations predicting the effect of the enhancement are
available [1,2,3], however, only limited number of experiments are made available to
serve as basis for model validation. This article, as part of the IEA Task 42/Annex 24
official report, aims at providing experimental data for use in validating and verifying
gelled PCM-based TESs with submerged finned pipe heat exchanger. This work was
carried out at Royal Institute of Technology, Sweden.
DETAILED DESCRIPTION OF THE EXPERIMENTAL SET-UP
The submerged finned pipe heat exchanger based latent heat TES is characterized by
specifications listed in Table 1. The water temperature is practically uniform, and the
material is gelled. This means that at different fins the process is practically the same.
However, to avoid any disturbance of temperature due to edge effect on the first and the
last fin, 4 fins were mounted, and the temperature was taken from the center 2 fins. The
insulation is attached to the shell of the unit. Water was utilized as the heat transfer fluid
(HTF). The mass flow rate of the HTF was maintained at a sufficient level to assure
uniform heat flux between the storage and the HTF in this experimental study. The HTF
temperature variation from inlet to outlet was maintained below 0.1 °C. Temperature
sensors are thermocouples type T, calibrated to 0.1 °C accuracy.
Table 1 Characteristics of the Thermal Energy Storage Unit and Experimental Parameters
Parameter Parameter
Fin spacing 30 mm Heat transfer fluid Water
Fin thickness 1 mm PCM Shape Stabilized Sodium
Sulfate Decahydrate
Fin diameter 68 mm Change in HTF
temperature
<0.1 °C
Pipe diameter 8 mm Mass flow rate 0.07 L/s
Pipe thickness 0.8 mm Tank insulation 10 mm polyurethane with
0.03W/m.K
Pipe and fin
material
Aluminum 6082 Number of fins 4
Outer diameter
of shell
80 mm Thickness of shell 3 mm
Total length of
the finned pipe
160 mm
The PCM utilized is a commercially available gelled salt-hydrate product [4], the material
properties of which were tested and characterized with an in-house built testing facility
based on an improved T-History method described by Chiu et al. [5]. The specific heat of
the material in melting and in congealing (freezing) is measured between 5 °C and 40
°C, as depicted in Figure 1. The energy storage capacities measured in melting and
congealing of the PCM are 52 ±1 Wh/kg (187 ±4 kJ/kg). A proposed numerical curve fit
function with the use of Dirac approximation and proposed parameters is presented in
eq. (1). It is shown that melting latent heat extends over a range of 8 °C while the
congealing cp covers a temperature range slightly less than 4 °C. The use of correct
material property data in modeling is essential in achieving representative results.

13
(1)
a=(T-Tpc);
Melting
Tpc=23.5 °C; b=1.830559547;
cps=3600 J/kg.K;
h=58800 J/kg;
Cooling
Tpc=20.5 °C; b=0.9152797733;
cps=3600 J/kg.K;
h=64800 J/kg;
where “a” and “b” are cure fitting parameters that characterize the peak cp temperature
and the phase change temperature range. “Tpc” is the phase change temperature with
the peak cp. cps corresponds to the sensible heat of the material; from the measurement,
it is seen that the sensible heat is identical in both solid and liquid phases. “h” is the
latent heat of the material with sensible heat deducted, it also corresponds to the surface
area of the lobe in Figure 1.
Figure 1 Thermal Property of PCM in Melting (left) and in Congealing (right)
with Curve Fit Approximations
The schematic of the experimental setup is shown in Figure 2. Teflon insulated
thermocouples are led out through the opening top of the TES unit. An 8 L water bath
was served as the heat source and heat sink for charge and discharge of the TES unit.
The experimental data were collected with a 16 bit multiplexer/ data logger and the data
were recorded in a 32 bit computer. Temperature sensors are placed along the pipe, on
the fins and in the center of the PCM, see Figure 2 (right).
Pump
Water Bath
ComputerData
Logger
Thermal
Storage
T fin low
T fin high
T fin mid high
T fin mid low
T PCM high
T PCM mid
T PCM low
T in
T out
T pipe in
T pipe out
T pipe mid
Figure 2 Submerged Finned Heat Exchanger (left); Schematic of the Setup (middle);
Thermocouple Placement (right)
The charging of heat (melting process) was performed with initial temperature of 12 °C
and HTF at 32 °C; the discharging of heat (freezing process) was performed with initial
temperature of 31 °C and HTF at 11 °C. Data were recorded from 15 °C to 29 °C in the
melting process and 29 °C to 15 °C in the congealing process.

14
RESULTS AND DISCUSSION
Temperature readings obtained for the finned pipe heat exchanger submerged gelled
PCM TES unit are appended to this article. The data are open for use to all for
experimental comparisons and numerical validations by giving reference to this article.
The fin temperature, PCM temperature, and pipe temperature presented in the
appendices are the average fin temperatures, PCM temperatures and pipe temperatures
measured. Averaging is possible due to the practically uniform HTF temperature
throughout the heat exchanger tube and the symmetry of the storage.
The temperature profiles are presented in Figure 3, the shown temperatures are fin
temperatures and PCM temperatures in run A, run B and run C. It is shown here that the
PCM heating temperatures deviate 5% in terms of melting time at the upper bound of the
testing temperature range, while the congealing temperature curves have more
consistent readings through the 3 test runs.
Figure 3 Temperature Profiles in Melting (left) and in Congealing (right)
CLOSURE
A compilation of experimental results for a gelled PCM based submerged finned pipe heat
exchanger TES is made available in this report for numerical validation. The material
enthalpy data measured with T-history method, the temperature profiles of the gelled
PCM and of the fins are appended to this report. The data are open for access to all, and
we welcome the use of the data with reference to this report.
Acknowledgement
The authors would like to acknowledge Swedish Energy Agency for providing funding for
this project 31067-1.
BIBLIOGRAPHY
[1] A. Castell, M. Belusko, F. Bruno and L.F. Cabeza, Maximisation of heat transfer in
a coil tank PCM cold storage system, Applied Energy, 88, pp. 4120-4127, 2011.
[2] Li P.W. et al., "Similarity and generalized analysis of efficiencies of thermal energy
storage systems," Renewable Energy, vol. 39, pp. 388-402, 2012.
[3] Ye W.B., Zhu D.S., and Wang N., "Numerical simulation on phase-change thermal
storage/release in a plate-fin unit," Applied Thermal Engineering, vol. 31, pp.
3871-3884, 2011.
[4] Julin N. Climator. [Online]. www.climator.com/
[5] Chiu NWJ. and Martin V., "Submerged finned heat exchanger latent heat storage
design and its experimental verification," Applied Energy, vol. 93, pp. 507-516,
2012.
15
EXPERIMENTAL RESULTS FOR PCM-AIR HEAT EXCHANGERS: MELTING AND SOLIDIFICATION IN FLAT PLATES (CSM PANELS FROM RUBITHERM)
P. DOLADO, A. LÁZARO, J.M. MARÍN, B. ZALBA; GITSE-I3A, Department of Mechanical
Engineering, EINA, University of Zaragoza, Spain.
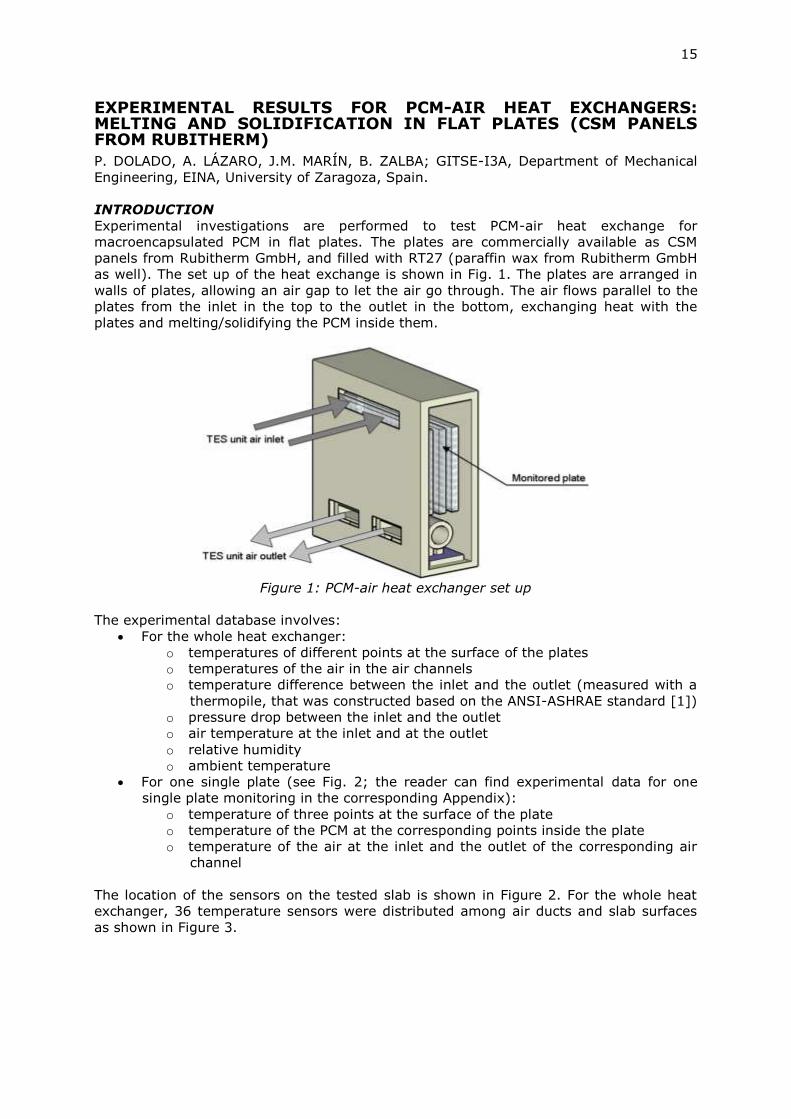
INTRODUCTION
Experimental investigations are performed to test PCM-air heat exchange for
macroencapsulated PCM in flat plates. The plates are commercially available as CSM
panels from Rubitherm GmbH, and filled with RT27 (paraffin wax from Rubitherm GmbH
as well). The set up of the heat exchange is shown in Fig. 1. The plates are arranged in
walls of plates, allowing an air gap to let the air go through. The air flows parallel to the
plates from the inlet in the top to the outlet in the bottom, exchanging heat with the
plates and melting/solidifying the PCM inside them.
Figure 1: PCM-air heat exchanger set up
The experimental database involves:
For the whole heat exchanger:
o temperatures of different points at the surface of the plates
o temperatures of the air in the air channels
o temperature difference between the inlet and the outlet (measured with a
thermopile, that was constructed based on the ANSI-ASHRAE standard [1])
o pressure drop between the inlet and the outlet
o air temperature at the inlet and at the outlet
o relative humidity
o ambient temperature
For one single plate (see Fig. 2; the reader can find experimental data for one
single plate monitoring in the corresponding Appendix):
o temperature of three points at the surface of the plate
o temperature of the PCM at the corresponding points inside the plate
o temperature of the air at the inlet and the outlet of the corresponding air
channel
The location of the sensors on the tested slab is shown in Figure 2. For the whole heat
exchanger, 36 temperature sensors were distributed among air ducts and slab surfaces
as shown in Figure 3.

16
Figure 2: Compact Storage Modules by Rubitherm, layout of the T sensors over the plate
Figure 3: Temperature sensors distribution in the heat exchanger
LAY-OUT OF THE EXPERIMENTAL SET-UP

17
The experimental set-up is shown in Fig. 4.
Figure 4: Experimental set-up
An experimental setup was designed to study different PCM-air heat exchangers. A
closed air loop setup is used to simulate indoor conditions. Setup design was based on
ANSI/ASHRAE STANDARD 94.1-2002 ‘‘Method of testing active latent-heat storage
devices based on thermal performance” [1]. This setup is constituted of [2]:
Inlet air conditioner allowing the simulation of different operating modes (5 kW air
chiller and 4.4 kW electrical resistance)
Air flow measurement
Difference between inlet and outlet air temperatures measurement (thermopile)
Inlet and outlet air temperature and humidity measurement
PCM and air channels temperature measurement (over 20 thermocouples)
Data logger and data screening
Air ducts and gates
PID controller
The total amount of PCM in TES is approximately 135 kg, contained in 216 plates. The
outer dimensions of the plate are 450 mm per 300 mm, and 10 mm thick. The plates are
arranged in walls of plates (3 plates high per 4 plates width). The 18 walls of plates are
separated from each other by a 1 cm air gap. The chiller fan was single speed, while the
TES unit fan had three speeds. In the energy balance the heat released by the fan is
considered as a fixed quantity of watts, depending on the selected speed of the fan.
Detailed information on the energy balance can be found in [6], section 3.3 (particularly
page 69, Eq. 3.4). The air flow range varied from 675 m3/h to 1550 m3/h. Depending on
the stage of the thermal cycling (melting or solidification of the PCM), the working
equipment will be the electrical resistances (to heat the inlet air) or the chiller (to cool
down the inlet air).
DESCRIPTION OF THE MEASURING PROCEDURE
Measurements started after surface temperatures of the PCM slabs in the TES unit
(average PCM temperature) had reached a stable value.
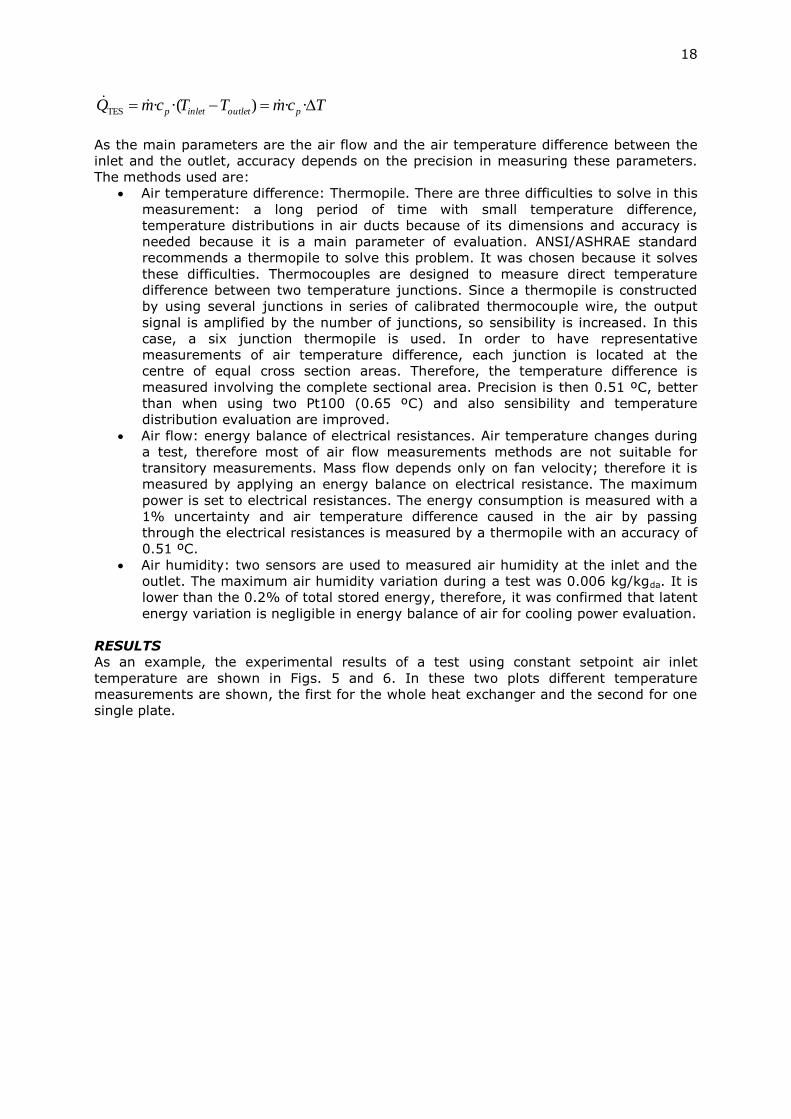
One of the main outputs of the PCM-air heat exchanger is the heat rate. This is
determined applying an energy balance to the air between the inlet and the outlet of the
heat exchanger.
18
TcmTTcmQ poutletinletp ··)·(·TES
As the main parameters are the air flow and the air temperature difference between the
inlet and the outlet, accuracy depends on the precision in measuring these parameters.
The methods used are:
Air temperature difference: Thermopile. There are three difficulties to solve in this
measurement: a long period of time with small temperature difference,
temperature distributions in air ducts because of its dimensions and accuracy is
needed because it is a main parameter of evaluation. ANSI/ASHRAE standard
recommends a thermopile to solve this problem. It was chosen because it solves
these difficulties. Thermocouples are designed to measure direct temperature
difference between two temperature junctions. Since a thermopile is constructed
by using several junctions in series of calibrated thermocouple wire, the output
signal is amplified by the number of junctions, so sensibility is increased. In this
case, a six junction thermopile is used. In order to have representative
measurements of air temperature difference, each junction is located at the
centre of equal cross section areas. Therefore, the temperature difference is
measured involving the complete sectional area. Precision is then 0.51 ºC, better
than when using two Pt100 (0.65 ºC) and also sensibility and temperature
distribution evaluation are improved.
Air flow: energy balance of electrical resistances. Air temperature changes during
a test, therefore most of air flow measurements methods are not suitable for
transitory measurements. Mass flow depends only on fan velocity; therefore it is
measured by applying an energy balance on electrical resistance. The maximum
power is set to electrical resistances. The energy consumption is measured with a
1% uncertainty and air temperature difference caused in the air by passing
through the electrical resistances is measured by a thermopile with an accuracy of
0.51 ºC.
Air humidity: two sensors are used to measured air humidity at the inlet and the
outlet. The maximum air humidity variation during a test was 0.006 kg/kgda. It is
lower than the 0.2% of total stored energy, therefore, it was confirmed that latent
energy variation is negligible in energy balance of air for cooling power evaluation.
RESULTS
As an example, the experimental results of a test using constant setpoint air inlet
temperature are shown in Figs. 5 and 6. In these two plots different temperature
measurements are shown, the first for the whole heat exchanger and the second for one
single plate.

19
Figure 5: Experimental results for a full cycle: TES air inlet and outlet temperatures,
ambient temperature, and surface temperature distribution of the plates inside TES
Figure 6: Experimental results for a full cycle, single-plate monitoring (air-plate surface-
PCM temperatures)
In Fig. 7 the experimental heat rate (determined by means of the previous energy
balance) is plotted as well as the total energy stored on each stage (melting or
solidification).
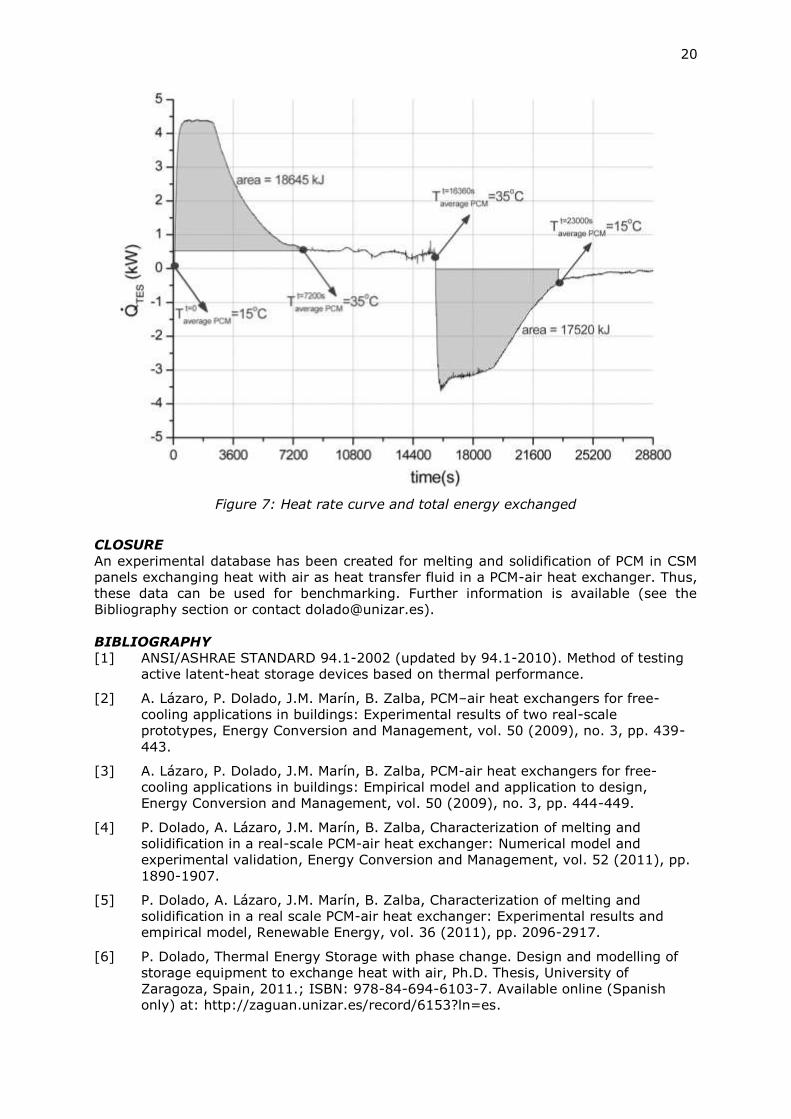
20
Figure 7: Heat rate curve and total energy exchanged
CLOSURE
An experimental database has been created for melting and solidification of PCM in CSM
panels exchanging heat with air as heat transfer fluid in a PCM-air heat exchanger. Thus,
these data can be used for benchmarking. Further information is available (see the
Bibliography section or contact [email protected]).
BIBLIOGRAPHY
[1] ANSI/ASHRAE STANDARD 94.1-2002 (updated by 94.1-2010). Method of testing
active latent-heat storage devices based on thermal performance.
[2] A. Lázaro, P. Dolado, J.M. Marín, B. Zalba, PCM–air heat exchangers for free-
cooling applications in buildings: Experimental results of two real-scale
prototypes, Energy Conversion and Management, vol. 50 (2009), no. 3, pp. 439-
443.
[3] A. Lázaro, P. Dolado, J.M. Marín, B. Zalba, PCM-air heat exchangers for free-
cooling applications in buildings: Empirical model and application to design,
Energy Conversion and Management, vol. 50 (2009), no. 3, pp. 444-449.
[4] P. Dolado, A. Lázaro, J.M. Marín, B. Zalba, Characterization of melting and
solidification in a real-scale PCM-air heat exchanger: Numerical model and
experimental validation, Energy Conversion and Management, vol. 52 (2011), pp.
1890-1907.
[5] P. Dolado, A. Lázaro, J.M. Marín, B. Zalba, Characterization of melting and
solidification in a real scale PCM-air heat exchanger: Experimental results and
empirical model, Renewable Energy, vol. 36 (2011), pp. 2096-2917.
[6] P. Dolado, Thermal Energy Storage with phase change. Design and modelling of
storage equipment to exchange heat with air, Ph.D. Thesis, University of
Zaragoza, Spain, 2011.; ISBN: 978-84-694-6103-7. Available online (Spanish
only) at: http://zaguan.unizar.es/record/6153?ln=es.

21
HEAT STORAGE SYSTEM COUPLED WITH A PHOTOVOLTAIC PANEL
V. LO BRANO, G. CIULLA, M. CELLURA; Department of Energy, University of Palermo,
Italy.
INTRODUCTION
A key element of a wider dissemination of PV systems is represented by high power
conversion efficiency. Concerning this point, the energy produced by a PV cell depends,
apart materials, also on other two important parameters:
the amount of the incident radiation;
the temperature of the PV cell.
The performance of a PV panel in fact is defined by manufactures according to the "peak
power", which identifies the maximum electric power supplied by the PV panel when it
receives an insolation of 1 kW/m2 and the cell temperature is maintained at 25 °C. These
conditions are nominal only because solar radiation has a variable intensity and the panel
is subjected to significant temperature changes, with temperature values higher than 25
°C. In real conditions performances of a PV panel are different from those declared under
the nominal conditions and the conversion efficiency decreases when temperature of the
cell increases.
Among other measures aimed to increase the energy conversion, we investigated the
application of PCMs (Phase Change Materials).
The idea to couple the PCMs with the photovoltaic technology arises from features of
these materials to absorb large amounts of heat (keeping almost constant the
temperature) when the heat is not required. Indeed overheating causes a drop in
efficiency of the photovoltaic cells. The absorbed heat should be then released to the
surrounding air during the night when the panel does not produce electrical power. The
application of PCM in PV systems has been experimentally and numerically studied by
several authors [1-6].
PV-PCM Model
Considering a PV panel coupled with PCM system, the energy balance must take into
account the presence of the phase-change material. Schematically, the energy
exchanges in a PV-PCM system can be exemplified by the figure. Thanks to the presence
of a simple geometry it was possible to choose a one-dimensional approach, considering
only the heat flow orthogonal to the PV plane.
IT
h
h
PV
Tamb
Tamb
PCM
Figure 1: PV-PCM schema of the PV-PCM system
In detail, the system is composed by a:
tempered glass sheet (λ= 1.3 W/mK) with a thickness of 3.2 mm (Glass layer);
1 mm of PET plastic panel (λ= 0.15 W/mK)on which are "printed" the silicon cells;
the silicon cells are considered having negligible thickness (PET layer);
an optional layer of air interposed between the panel and the heat storage system
representing a possible imperfect contact (Air layer); a plastic layer (λ= 0.15

22
W/mK) that takes into account the bag that contains the PCM (bag layer); this is a
vacuum plastic bag of 20cm x30 cm.
the PCM layer;
Figure 2 represents a section of the geometry along the thickness of the PV-PCM system
where it is possible to identify all the involved layers: the glass panel, the PET panel, the
layer of air due to the imperfect contact of the envelope of PCM with the PV, the
thickness of the envelope containing the PCM and the PCM layer itself.
Figure 2: PV-PCM cross-section
The PV-PCM system is presented as a multi-layer plate invested by solar radiation and
exchanging heat with the external environment by convection and radiation. Depending
on the properties of the PCM and on the amount of energy captured from the panel, the
layer of PCM can partially or totally melt during the maximum insolation, and returns that
amount of energy, possibly solidifying again, during the night. The first hypothesis is that
the phase change is isothermal. In case of non-isothermal transition, having the value of
cp with temperature, the problem is reduced to a heat conduction case. The occurrence of
a phase change that keeps the temperature at a given value is a more interesting case
and implies the determination of the PCM liquid fraction.
In general terms, commercial PCMs have a thermal window; only pure substances show
an isothermal phase change
The balance equations were written by finite difference model considering a one-
dimensional approach with constant thermo-physical properties and without internal heat
generation. It was necessary to distinguish the energy balance of border nodes.
We developed an algorithm that can easily be implemented in a software procedure that
uses a common programming language like VB.NET. Authors developed a software tool
implementing the discussed algorithm shown in Fig. 3.
Figure 3: Front panel of the developed software
EXPERIMENTAL SYSTEM
To perform the measurements, an experimental system was made up and situated on
the top of the Energy Department of University of Palermo, (38°07’ N, 13°22’ E). Two
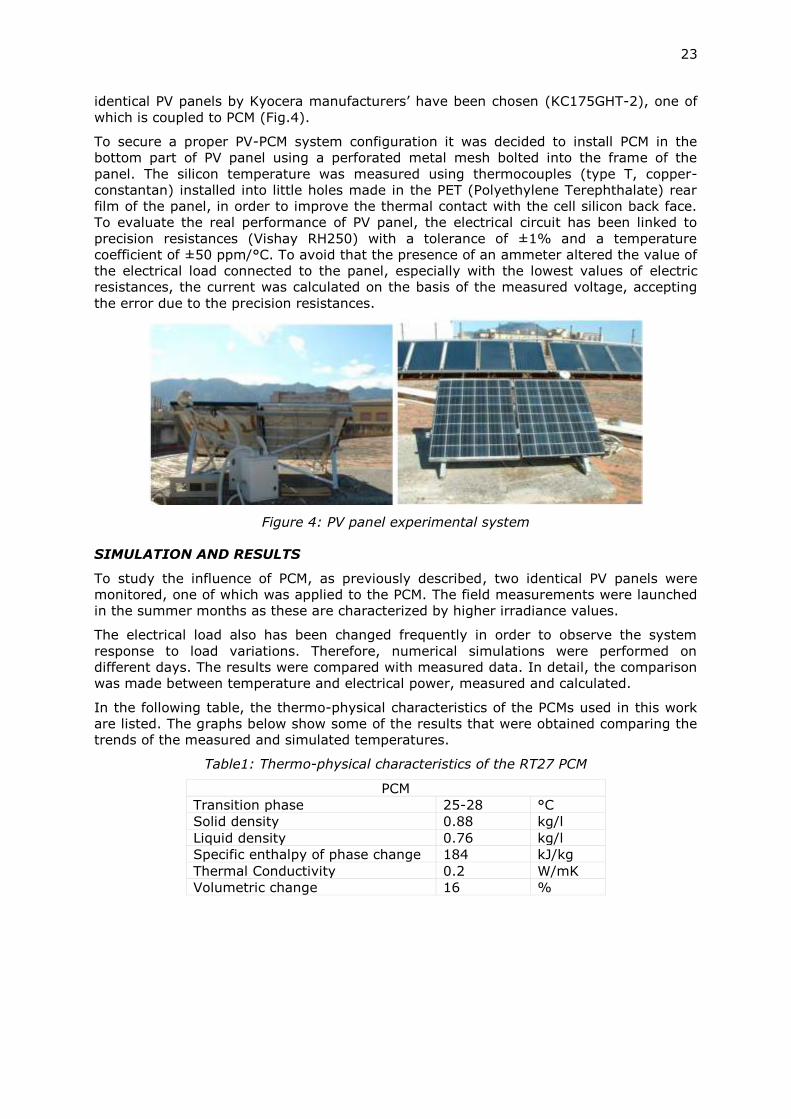
23
identical PV panels by Kyocera manufacturers’ have been chosen (KC175GHT-2), one of
which is coupled to PCM (Fig.4).
To secure a proper PV-PCM system configuration it was decided to install PCM in the
bottom part of PV panel using a perforated metal mesh bolted into the frame of the
panel. The silicon temperature was measured using thermocouples (type T, copper-
constantan) installed into little holes made in the PET (Polyethylene Terephthalate) rear
film of the panel, in order to improve the thermal contact with the cell silicon back face.
To evaluate the real performance of PV panel, the electrical circuit has been linked to
precision resistances (Vishay RH250) with a tolerance of ±1% and a temperature
coefficient of ±50 ppm/°C. To avoid that the presence of an ammeter altered the value of
the electrical load connected to the panel, especially with the lowest values of electric
resistances, the current was calculated on the basis of the measured voltage, accepting
the error due to the precision resistances.
Figure 4: PV panel experimental system
SIMULATION AND RESULTS
To study the influence of PCM, as previously described, two identical PV panels were
monitored, one of which was applied to the PCM. The field measurements were launched
in the summer months as these are characterized by higher irradiance values.
The electrical load also has been changed frequently in order to observe the system
response to load variations. Therefore, numerical simulations were performed on
different days. The results were compared with measured data. In detail, the comparison
was made between temperature and electrical power, measured and calculated.
In the following table, the thermo-physical characteristics of the PCMs used in this work
are listed. The graphs below show some of the results that were obtained comparing the
trends of the measured and simulated temperatures.
Table1: Thermo-physical characteristics of the RT27 PCM
PCM
Transition phase 25-28 °C
Solid density 0.88 kg/l
Liquid density 0.76 kg/l
Specific enthalpy of phase change 184 kJ/kg
Thermal Conductivity 0.2 W/mK
Volumetric change 16 %

24
Figure 5: The figure represents the trends of climatic parameters in Palermo, June 19 to
21
Table 2: Climatic parameters in Palermo, June 19 to 21
Mean value
Air Temperature 25.14 °C
Irradiation 264.75 W/m2
Wind Speed 2.1 m/s
Figure 6: Temperature trend of the measured and simulated PV-PCM system, in Palermo,
June 19 to 21

25
COMMENTS AND CONCLUSIONS
Looking at the graphs represented before, it is possible to see as the calculated
temperature trends are in good agreement with measured temperatures, validating the
reliability of the calculation model.
The calculated temperatures at night are significantly lower than the comparable
measured: this is an indication of an incorrect estimate irradiative heat exchange, which
were estimated under the assumption of the sky always clear. Table 3 shows that the
differences between the measured and calculated values are lower than 10% of average
temperature. The comparison is based on the following definitions:
Average gap:
n
i
calmea
n
TT
1
Absolute average gap:
n
i
calmea
n
TT
1
Average Deviation:
n
i mea
meacaln
T
TT
1
the maximum negative gap:
n
i
meacal TT1
min ;
the maximum positive gap:
n
i
meacal TT1
max ;
where meaT is the measured temperature [°C], Tcal is the calculated temperature [°C] and
n in the number of samples.
Table 3: Comparison between measured and calculated temperatures
PV panel
Average gap 2.32 [°C]
Absolute average gap 2.48 [°C]
Max negative gap -2.72 [°C]
Max positive gap 8.51 [°C]
Average Deviation 7.39%
PCM
Average gap 1.67 [°C]
Absolute average gap 1.87 [°C]
Max negative gap -2.21 [°C]
Max positive gap 5.22 [°C]
Average Deviation 6.11%
The results show that the proposed model is valid and can be used to determine the
thermal behaviour of a multilayer wall in which there is a phase change material. The
model was validated by comparison with the analytical solution of the Voller and Cross
problem and then by using an experimental setup with PV panel.
The good agreement between experimental measurements and numerical predictions
have shown that the algorithm, although simplified and in one-dimensional geometry,
can be used to determine the trend in temperature of a multilayer wall accompanied by a
PCM
26
BIBLIOGRAPHY
[1] Huang M.J., Eames P.C., Norton B., Thermal regulation of building-integrated
photovoltaics using phase change materials, International Journal of Heat and Mass
Transfer 47 (2004) 2715–2733.
[2] Huang M.J., Eames P.C., Norton B., An experimental study into the application of
phase change materials to limit the temperature rise in build integrated photovoltaic
systems, Proceedings of Renewable Energy in Maritime Island Climates, September,
Belfast, UK, 2001, 143-150.
[3] Huang M.J., The application of CFD to predict the thermal performance of phase
change materials for the control of photovoltaic cell temperature in buildings,
Proceedings of VI World Renewable Energy Congress, July, Brighton, 2000, 2123-2126.
[4] Huang M.J., Eames P.C., Norton B., Phase change materials for limiting temperature
rise in building integrated photovoltaics, Solar Energy 80 (2006) 1121–1130.
[5] Cellura M., Lo Brano V., Orioli A., et al., Miglioramento della resa energetica di un
pannello fotovoltaico per mezzo di materiale a cambiamento di fase, ATI 2009, L’Aquila,
Italy.
[6] Cellura M., Lo Brano V., Orioli A., et al., A Photovoltaic panel coupled with a phase
changing material heat storage system in hot climates, DREAM University of Palermo,
PLEA, Dublin, 2008.
[7] Frank P. Incropera, David P. DeWitt, Fundamentals of Heat Mass Transfer, 5th edition,
ISBN 0471386502.
[8] E V.R. Voller and M. Cross, Accurate Solutions of Moving Boundary Problems Using
Enthalpy Method. Int. J. Heat Mass Transfer 24 (1981).
[9] L. Rubestein, The Stefan Problem, Transactions in Mathematics Monograph No. 27.
American Mathematical Society, 1971

27
Thermo-Chemical Material Models
INTRODUCTION
Households use a large amount of their energy consumption for space heating and
domestic hot water. The energy consumption in the built environment can be reduced by
energy saving measures (improved insulation, heat recovery, etc.). A substantial part of
the remaining energy demand can be fulfilled by using renewable energy sources such as
solar energy. During summer, the heat demand can be completely covered using solar
heat, but in winter the heat demand exceeds the solar supply. To accommodate this lag
between the solar energy surplus in summer and the energy demand in winter, a
seasonal thermal storage is needed.
Traditionally, water is used for storing solar heat (for example, solar boiler) for short time
periods. However, water-based long-term heat storage will require a large tank (>50 m3)
that is often too large to be placed inside a building. As an alternative, it is possible to
store energy by means of chemical processes, making use of the reversible reactions C +
heat A + B.
In the charging mode during summer, solid C dissociates under the influence of solar
heat into components A and B, which are stored separately. In the discharging mode
during winter, the two components (A and B) react to form solid C while releasing the
stored solar heat. No reactions occur as long as the two components A and B are stored
separately. Preliminary calculations show that sensible heat losses comprise
approximately 10% of the total energy storage; this means that the remaining energy
can be stored loss-free.
The Table below gives a list of candidate Thermo-Chemical Materials which can be used
for long-term heat storage, see [1]. Dependent on their loading temperatures, energy
densities, power densities and recyclability, TCM-materials can be used for (long-term)
heat storage in the built environment and/or industry. To gain more insight into the heat
and mass transfer processes taking place in these materials during charging and
discharging, numerical modeling is needed ranging from the molecular- and micro-scale
up to the macro- and reactor-scale. This insight can be used in a later stage to optimize
specific properties of the storage materials with respect to their usage. The next chapters
present an overview of the state-of-the-art modeling techniques on the various scales.
Candidate TCM-materials for long-term heat storage (from [1])
[1] Visscher, K., Veldhuis, J. B. J., Oonk, H. A. J., van Ekeren, P. J., and Blok, J.G.,
2004, “Compacte Chemische Seizoenopslag Van Zonnewarmte; Eindrapportage,”
ECN Report No. ECN-C-04-074.

28
HYDRATION AND DESHYDRATION OF SORPTION MATERIALS: EXPERIMENTS IN A SMALL-SCALE REACTOR
Camilo RINDT and Hadi RAJAEI, Eindhoven University of Technology, Eindhoven, The
Netherlands.
INTRODUCTION
In the present study a small-scale reactor is built in which controlled adsorption and
desorption experiments are carried out. During the hydration and dehydration cycle
temperature profiles are measured in the reactor to gain insight into the heat and mass
transfer processes. Firstly a general description is given of the experimental set-up with
special attention to the design of the reactor. Secondly some results are presented of
adsorption and desorption experiments of zeolite 13X. Finally some conclusions are
drawn and contact details are presented.
LAY-OUT OF THE EXPERIMENTAL SET-UP
The setup
The main components of the experimental device are the reactor, a heater and an
evaporator. Figure 1 shows a lay-out of the experimental setup. At the left hand side,
compressed air is delivered at a pressure of 7.5 bar and a relative humidity of 2.5 % at
250C. The incoming dried air flow is measured and regulated by a gas flow controller
(GFC). During a desorption experiment this air flows at the bottom side of the setup
through the heater into the reactor. During a adsorption experiment water is pressed out
of the water vessel by the pressurized airflow and measured by the liquid flow controller
(LFC), resulting in a water-air stream into the controlled evaporator mixer (CEM). By
giving set points for the air and water flow, the absolute humidity can be controlled. Then
the humidified air flows into the reactor. A relative humidity/temperature sensor is used
to measure the humidity and temperature at the outflow and a thermocouple data logger
is used to readout the temperature profiles in the reactor. A more detailed description of
the experimental device can be found in Rajaei [2012].
Figure 1: Lay-out of the experimental setup
Dimensions and design
Figure 2 shows a schematic view of the reactor and the positioning of the thermocouples
and pressure gauges. The reactor is made of multiple materials. The inner shell is made
of Teflon. The Teflon layer is used because of its low thermal conductivity characteristics,
leading to large temperature differences over the wall, which are relatively easy to
measure. The middle layer is made of stainless steel. A layer of insulation is applied at
the outer part of the reactor. The outer side of the insulation is covered with a layer of
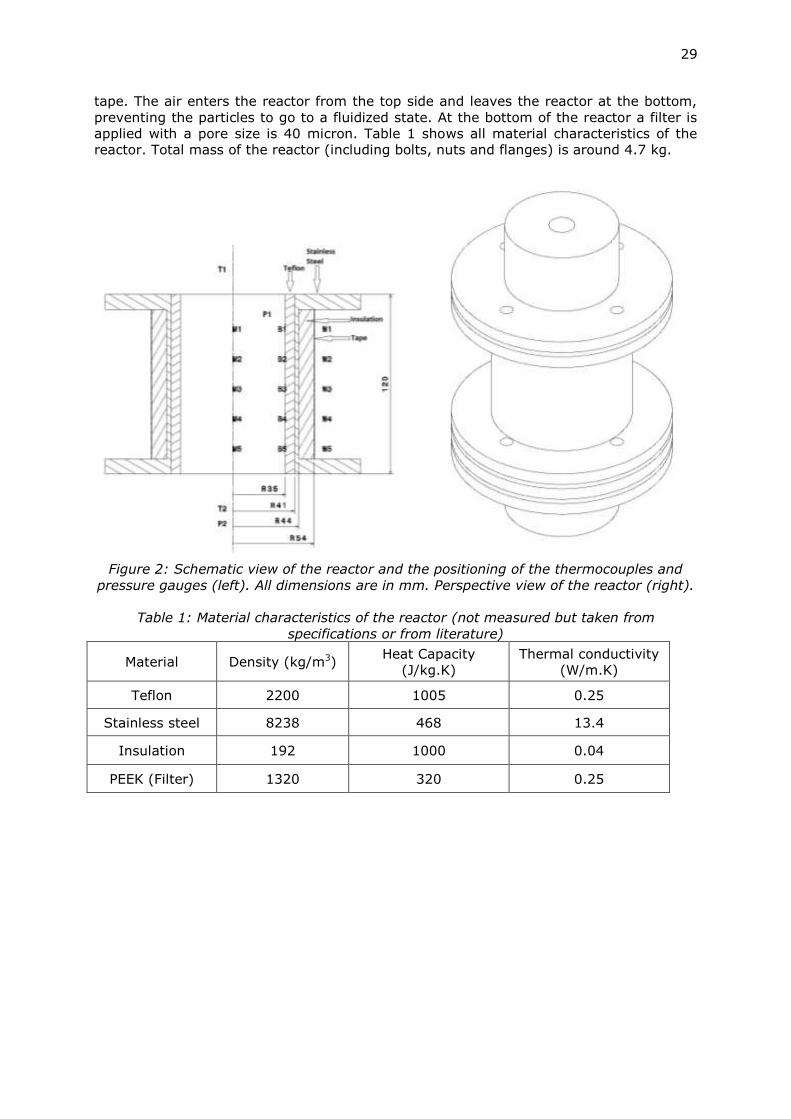
29
tape. The air enters the reactor from the top side and leaves the reactor at the bottom,
preventing the particles to go to a fluidized state. At the bottom of the reactor a filter is
applied with a pore size is 40 micron. Table 1 shows all material characteristics of the
reactor. Total mass of the reactor (including bolts, nuts and flanges) is around 4.7 kg.
Figure 2: Schematic view of the reactor and the positioning of the thermocouples and
pressure gauges (left). All dimensions are in mm. Perspective view of the reactor (right).
Table 1: Material characteristics of the reactor (not measured but taken from
specifications or from literature)
Material Density (kg/m3) Heat Capacity
(J/kg.K)
Thermal conductivity
(W/m.K)
Teflon 2200 1005 0.25
Stainless steel 8238 468 13.4
Insulation 192 1000 0.04
PEEK (Filter) 1320 320 0.25

30
Material properties
Around 248 grams (weighted at ambient temperature and and humidity) zeolite 13X pre-
dried (dried at a temperature of 200°C for two hours) was used for the adsorption and
desorption experiments. Table 2 shows the properties of zeolite 13X.
Table 2: Properties of zeolite 13X (not measured but taken from literature)
Material Diameter of pellets
(mm)
Density
(kg/m3)
Heat Capacity
(J/kg.K)
Thermal
conductivity
(W/m.K)
Zeolite 13X 1.3-2.5 1876 1047 0.076
DETAILED DESCRIPTION OF THE MEASURING PROCEDURE
17 thermocouples are attached to the reactor. T1 and T2 measure the inlet and outlet
temperature, respectively. M1 up to M5 measure the temperature over the bed. B1 up to
B5 are attached at the inner side of the Teflon wall, measuring the inner wall
temperature. The thermocouples labeled W1 up to W5 are used to measure the outer
wall temperatures. The thermocouples M and B are of type T. The thermocouples
attached to the wall are of type K. In the reactor, every 2 cm a thermocouple is
positioned. The filter is mounted at the bottom and has a thickness of 0.5 cm. The
distance between bottom side of the reactor and M5 is 2.5 cm (total length of the reactor
and filter is 12.5cm). Thermocouples T1 and T2 are positioned in the gas stream leading
to typical measuring errors in the range of 2%. The humidity/temperature sensor has an
accuracy of 1.5% on the relative humidity and 0.2°C on the temperature. It can measure
from 0% to 100% of relative humidity and its response time is less than 15s. Since there
are only 16 slots available at the data acquisition system, not all temperatures are
measured simultaneously. Furthermore, two slots are required for measuring the
humidity and temperature at the outlet. So, 14 slots remain available to measure
temperatures in the reactor. To this end the 3 thermocouples labeled W1, W3 and W5
are not used in the presented measurements. Two pressure gauges are positioned at the
inlet and outlet of the reactor to measure the pressure difference over the reactor. The
reactor is filled with more or less spherical particles of zeolite 13X on top of the filter. The
particle bed is not pressed, leading to a ‘natural’ porosity in the range of around 0.6 (not
measured).
At the start of the experiment the reactor was in thermal equilibrium with the
surroundings.
RESULTS
Adsorption
During the adsorption experiment a regulated gas flow of 24 l/min and a liquid flow of
0.28 g/min enter the reactor. These numbers result in a relative humidity of 59%. The
248 grams of zeolite used in the adsorption experiment resulted in a bed height of 8.5
cm, covering M2. The experiment lasted 6 hours until the reaction ceased. Figure 3-top
shows the temperature profiles in the reactor bed. The reactor inlet temperature is 17.5
°C which is different from the temperature of the compressed air (25°C). This difference
comes from the required energy for evaporation of water droplets.
The maximum temperature reached was 54°C which occurred at the top of the bed. The
outlet temperature remains constant for almost 4 hours at 42°C. the temperature profiles
for T1 and M1 are identical. The thermocouples M2, M3, M4 and M5 show successive
temperature peaks and this indicates a moving reaction front. The smaller this front, the
more concentrated the energy released and so the higher the temperatures reached.
Deeper in the reactor, the reaction front stretches out and the elevated temperatures last
longer. This is caused by the fact that not all water vapor is consumed within the reaction
front so material downstream the reaction front will hydrate in steps. So, deeper inside
the reactor zeolite 13X loses some of its stored energy before the reaction front passes

31
and, as a consequence, less elevated temperatures are reached which last longer. The
reaction ceased after 5 hours (300 min) when the outlet temperature drops close to the
inlet temperature.
Figure 3-bottom shows the outlet humidity. The vapor inflow is kept constant by the
liquid flow controller and has a value of 0.28 g/min during this experiment. The vapor
outflow is not constant: at the start of the experiment it decreases to zero. In this period
of time, all the supplied water vapor is consumed by the reaction. After 50 minutes it
starts to rise and it stabilizes after 300 minutes. According to the measurements 56.3
grams H2O was absorbed in 300 minutes which is 22 %wt of the zeolite.
Figure 3: Temperature profile (top) and vapor in- and outflow (bottom) as function of
time during the adsorption reaction of zeolite 13X
Desorption
For the desorption experiment the heater was set to a heating rate of 1°C per minute.
The maximum temperature was set to 200°C and the heater kept the maximum
temperature for 2 hours. Figure 4-top shows the temperature profiles during the
desorption experiment. At the beginning of the experiment the temperature at several
positions drops a few degrees below the inlet temperature because water is expelled and
process absorbs heat. As the inlet flow gradually heats up, the reactor temperature
increases as well.
The outlet humidity graph shows that at the beginning of the desorption, a huge amount
of water is expelled. Zeolite 13X has a maximum water uptake of 30 wt%. Figure 4-
bottom shows that the vapor content decreases in time. The water vapor content starts
at 1 g/min and decreases quickly in the first 10 minutes. The incoming dry air causes the

32
weakly bonded water molecules to separate from the zeolite. By further heating the air,
more vapor is released from the zeolite (second peak at t = 45 min). The vapor content
that is released from the zeolite gradually reduces, but is more or less constant between
t = 100 min and t = 170 min. In this time interval the temperature of the incoming air is
ranging between 70°C and 130°C. The total amount of water expelled from the zeolite
during the experiment was 70 grams, which is 28 wt%. The zeolite apparently released
more water than it took up in the adsrption experiment as described above. Possibly the
zeolite was not fully dehydrated before the start of the adsorption experiment. The vapor
content of the incoming heated air stream was 0.038 g/min.
Figure 4: Temperature profiles in the reactor (top) and vapor outflow (bottom) as
function of time during the desorption reaction of zeolite 13X.
CLOSURE
An experimental database has been created for adsorption and desorption of zeolite 13X
using a small-scale reactor. Temperature profiles in the reactor are shown as function of
time. The data can be used for benchmarking. For further information please contact
BIBLIOGRAPHY
[1] A.J. Brouwer, Development of an experimental device for the investigation of
seasonal heat storage by thermo-chemical materials, M.Sc. Thesis, WET 2008.07,
Eindhoven University of Technology, Eindhoven, the Netherlands, (2008)

33
[2] P.J. van Kimmenade, Design of a test reactor for thermo-chemical heat storage
materials, M.Sc. Thesis, WET 2010.13, Eindhoven University of Technology,
Eindhoven, the Netherlands, (2010)
[3] E.C.J.A Dukers, Fixed bed reactor analysis for thermochemical heat storage, M.Sc.
Thesis, WET 2012.01, Eindhoven University of Technology, Eindhoven, the
Netherlands, (2012)
[4] H. Rajaei, Fixed bed reactor analysis for seasonal heat storage by thermochemical
materials , M.Sc. Internship Report, WET 2012.16, Eindhoven University of
Technology, Eindhoven, the Netherlands, (2012)

34
ADSORPTION HEAT STORAGE: DYNAMIC PROPERTIES
Gerrit FUELDNER, Fraunhofer Institute Solar Energy Systems, Freiburg, Germany.
INTRODUCTION
Adsorption heat storage uses the exothermal process of physical adsorption of a gas
(e.g. water vapor) on highly porous materials such as zeolites or silicagel. The storage
can be loaded by drying the material with high temperature (100-250°C) heat. If kept
dry, it only cools down sensibly, and when exposed to water vapor will release the heat
of adsorption at a medium temperature level (35-70°C). The storage can be built as an
open system where hot air flows through an adsorbent bed for desorption and cool air is
heated by adsorption of its water content. It can also be built as a closed (vacuum)
system with pure water vapor atmosphere. In this case an additional heat exchanger is
needed to bring in and out the heat. As well, a low temperature (0-20°C) evaporation
source is necessary for the adsorption process in a closed system adsorption storage.
Porous adsorbent materials can be characterized in various ways. The typical physical
properties which are of importance when considering a material in the context of thermal
energy storage are mass/volume specific working fluid uptake (isobars/isotherms), heat
capacity, heat conductivity, diffusivity, porosity and density. There are different
characterization techniques for all these parameters. All of them have an influence on
both the energy storage density and on the possible power of the storage, i.e. how fast
can the storage be (un-)loaded. Of course, also the complete storage setup with casing,
heat exchangers etc. will influence both, and it is often not easily possible to find the
limiting factors.
LAY-OUT OF THE EXPERIMENTAL SET-UP
To evaluate the dynamic properties of different heat-exchanger/adsorbent setups a
volumetric adsorption kinetics measurement facility will be presented. In this the
transient adsorption process is measured. Physical parameters like heat transfer
resistances or diffusivities can be drawn from such measurements by comparison to a
detailed model.
Figure 1: Scheme of the measurement setup for adsorption kinetics (most important
parts).
The dosing chamber (water vapour reservoir, Volume 42.888 liters) with a defined
quantity of pure water vapor (given by the saturation pressure at water bottle
temperature) and the measuring chamber (Volume 0.7.. litres) are put in a thermostated
rack (40°C). The sample is put on a coldplate thermostated by a water flow at constant
temperature.
Sample properties

35
The exemplary sample presented in this report is a composite adsorbent material in a
thin layer (thickness 0.72 mm) that is glued to an aluminum plate (thickness 0.4 mm)
representing the heat exchanger. The material consists of a rare earth exchanged Y-
zeolite in a polymer fibre matrix (UOP DDZ-70) [1]. The sample size is 5x5 cm2, the
density of the dry material is 650 kg/m3 (dry adsorbent mass 1.12 g) and the porosity is
57% [2]. The mean intercrystalline poresize between the zeolite crystals (from
permeability and mercury intrusion) is approximately 3-5 µm, the pore tortuosity factor
is about 7 [3].
The heat capacity is 1000 J/(kg K), the heat conductivity of the dry material about 0.12
W/(m K) [2]. The adsorption equilibrium can be described by a generalized form of
Dubinin’s characteristic curve giving the adsorbed volume W [cm3 of adsorbate/kg of dry
adsorbent] as a function of the adsorption potential A=RT ln psat(T)/p [J/g of adsorbate].
Figure 2: Characteristic curve UOP DDZ-70 with 20% of polymeric binder.
W=(a+cA+eA2+gA3)/(1+bA+dA2+fA3) [4,2]
with the parameters
a 221,160732
b -2,01E-03
c -7,91E-01
d -2,22E-06
e 1,48E-03
f 1,65E-08
g -5,13E-07
DETAILED DESCRIPTION OF THE MEASURING PROCEDURE
To measure the transient adsorption process, the desorbed (activated) sample is cooled
to 40°C and then exposed to water vapor atmosphere by opening valve 1. The sample
immediately starts to adsorb.

36
The possible measurements vary with respect to the activation (desorption) conditions
and with respect to the actual adsorption process.
Desorption Conditions
For desorption two different conditions are applied:
1. The sample is heated to 95°C and the measurement cell is evacuated to ending
pressure of a two stage vacuum pump (about 0.1 mbar).
2. For conditions closer to real working conditions in an adsorption storage, the
desorption is against a condenser (the thermostated water reservoir) at e.g. 30°C.
In both conditions one has to keep in mind that the starting point (equilibrium uptake at
t=0) is not directly defined by the desorption conditions (e.g. 95°C and 42 mbar
condenser pressure), since the sample is cooled down after the desorption phase and
takes up some water from the small but not negligible volume of the measurement cell.
Canonical Measurement
„Canonical“ in this context means that we have a closed system so the amount of water
molecules in the system stays constant during the measurement. After opening valve 1 it
is possible to calculate the absolute uptake of the sample by the drop in pressure
(knowing the exact volume of measurement cell + dosing chamber). As starting pressure
usually either 12.3 mbar (evaporator 10°C) or 17 mbar (evaporator 15°C) are chosen.
Coupling of the Sample to Coldplate/HF-Sensor
The sample has been characterized in three different coupling variants. First, the sample
has only been pressed to the coldplate without Thermigrease and without heat flux (HF)
sensor to get the pressure drop without the danger of polluting the sample with the
thermigrease. Then, to get the fastest possible adsorption kinetics, the sample is coupled
to the coldplate with a thin layer of Thermigrease but without HF sensor. Finally the
samples can be characterized with the HF sensor included in the setup.
RESULTS
The measurement gives data on the surface temperature, the pressure in the
measurement chamber and – if included – on the heat flux to the coldplate. Figure 3
shows 4 measurements, two measured with heatflux sensor and two without.
To evaluate the measurements, a detailed model of the non-isothermal adsorption
kinetics taking into account heat transfer in the adsorbent and the metal, heat transfer
resistances both between the adsorbent and the metal as well as between the metal and
the coldplate and of course also mass transfer through macro- and micropores is fitted to
the experiment [5]. The blue marks show the fitted model results.

37
Figure 3: Pressure in measurement chamber (upper) and surface temperature of the
sample after step change in pressure to 17 or 23 mbar after desorption and cooling. The
measurements have been carried out with and without a heat flux (HF) sensor. For the
measurements with HF, data on the heat flux is available as well. The HF introduces an
additional heat transfer resistance which slows down the kinetics and thus has to be
taken into account when modeling the transient uptake.
CLOSURE
By measuring the uptake kinetics of macroscopic composite samples, heat and mass
transfer parameters relevant for designing adsorption heat storages can be extracted.
Using these parameters in simulation of the cyclic ad- and desorption process allows to
predict the performance of different storage designs and materials [6,7].

38
For further information and detailed experimental data, please contact
BIBLIOGRAPHY
[1] Dawoud, B., Vedder, U., Amer, E. and Dunne, S., Non-isothermal adsorption
kinetics of water vapour into a consolidated zeolite layer, International Journal of
Heat and Mass Transfer, 50, 2190 – 2199, (2007)
[2] Schnabel, L., Experimentelle und numerische Untersuchung der Adsorptionskinetik
an Adsorbens-Metall-Verbundstrukturen,PhD Thesis Faculty III - Process Sciences,
Technical University Berlin, Germany, (2009)
[3] Füldner G., Permeability of composite adsorbent layer, Unpublished
measurements, (2008-2010)
[4] Núñez, T., Charakterisierung und Bewertung von Adsorbentien für Wärmetrans-
formationsanwendungen, PhD Thesis Faculty of Physics, University of Freiburg,
Germany, (2001)
[5] Füldner G. and Schnabel L., Non-isothermal kinetics of water adsorption in
compact adsorbent layers on a metal support, Proc. of the Int. COMSOL Conf.,
Hannover, Germany, (2008)
[6] Schnabel L. and Füldner G., Water Adsorption in Compact Adsorbent Layers –
Kinetic Measurements and Numerical Layer Optimization, Proc. of Heat Powered
Cycles 2009, TU Berlin, Germany: 520, (2009)
[7] Füldner, G.; Schnabel, L.; Wittstadt, U.; Henning, H. & Schmidt, Numerical layer
optimization of aluminium fibre/Sapo-34 composites for the application in
adsorptive heat exchangers, F. Lazzarin, R.; Longo, G. & Noro, M. (ed.),
Proceedings of the International Sorption Heat Pump Conference, Padua Italy,
533-542, (2011)

39
FIXED BED REACTOR FOR HYDRATION / DEHYDRATION OR ADSORPTION / DESORPTION EXPERIMENTS
Barbara METTE, Florian BERTSCH, Henner KERSKES, Instiute for Thermodynamic and
Thermal Engineering, Stuttgart University, Stuttgart, Germany.
INTRODUCTION
Experiments on the hydration and dehydration or adsorption and desorption behavior of
thermochemical energy storage materials are carried out in a small-scale fixed bed
reactor. The experiments are performed under controlled inlet conditions of the airflow
(humidity, temperature and mass flow). During the experiments, the temperature profile
inside of the material bed is measured at five different axial positions. In addition, the
inlet and outlet temperature, the inlet and outlet humidity and the mass flow of the
airflow are measured.
LAY-OUT OF THE EXPERIMENTAL SET-UP
Figure 1 depicts the experimental set up of the fixed bed reactor. Compressed air is
filtered, additionally dried and then entering the fixed bed reactor test rig. For the drying
process of the compressed air, the air is conducted through a bulk of zeolite 13X particles
which has been dried at a temperature of = 180 °C. This drying process further
reduces the air humidity to values of pH2O < 0.3 mbar.
The mass flow rate of the air is measured and regulated with a mass flow controller
(Bronkhorst, El-Flow, control range: 0…0.16…8m³/h). During the hydration / adsorption
experiments, the air is humidified by directing part of the air flow through the air
humidifier and part of it through the bypass. Afterward, the two air flows are mixed
together again and the air humidity is measured with a dew points sensor (EdgeTech
Dew Master, dew point range: -20 to 95 °C, accuracy +/- 0.2 K). A pneumatic control
valve regulates the volume flow through the bypass so that the resulting combined flow
has the desired air humidity. During the dehydration / desorption experiments the
complete air flow is passing through the bypass.
In an electrically heated pipe the air is heated up to the desired reactor inlet
temperature. The electrical power of the heating coils can be regulated so that the
variation in the inlet temperature is less than +/- 0.3 K.
The reactor inlet and outlet temperature of the airflow and the temperature of the
material bed at five different axial positions (TR,1 = 20 mm, TR,2 = 40 mm, TR,3 = 60 mm,
TR,4 = 80 mm, TR,5 = 120 mm) of the reactor are measured with thermocouples (type K,
diameter 1 mm, accuracy +/- 1 K). The air humidity at the reactor inlet and outlet are
measured with dew point sensors.
Figure 1: Experimental set up of the fixed-bed reactor test rig

40
A more detailed sketch of the fixed bed reactor is given
in figure 2. The reactor is made of stainless steel (wall
thickness of 3 mm) and has a volume of approximately
165 ml (reactor height = 125 mm, reactor diameter =
40.5 mm). The reactor is insulated with glass wool of a
thickness of approximately 50 mm.
The temperature sensors for measuring the material
bed temperatures are not in direct contact with the
material bed. The sensors are inserted in brass tubes
(inner diameter of 1 mm, outer diameter of 1.4 mm)
which are horizontally passed through the reactor. This
set up allows an easy and reproducible measurement of
the bed temperature in many experiments.
A clamp ring connection allows an easy installation and
removal of the reactor. A reducer pipe from the reactor
diameter to 20 mm is installed before and behind the
fixed bed reactor. Two filters (sintered bronze, pore size
of 1 mm), which are positioned in the top and bottom flange, are fixing the material
inside the reactor.
The following inlet conditions of the air flow can be set:
Mass flow (dry air): 100 … 3000 g/h
Air humidity: 5 … 100 mbar
Reactor inlet temperature: 25 … 190 °C
DETAILED DESCRIPTION OF THE MEASURING PROCEDURE
A measuring cycle in general consists of at least three steps which are all conducted in
the fixed bed reactor: Desorption / dehydration of the material, cooling down the
material, adsorption / hydration of the material. In all three phases air at a defined mass
flow is flowing through the material bed.
The different steps will be described in more details by the example of an adsorption /
desorption cycle of binder-free zeolite 13X and a hydration / dehydration cycle of a
composite of calcium chloride on a mineral clay matrix.
Binder-free zeolite 13X
The reactor is filled with binder-free zeolite 13X (Köstrolith® 13XBFK) of the company
Chemiewerke Bad Köstritz up to the fifth temperature sensor (approximately 88 g). The
particles are spherical and have a grain size of 1.6 – 2.0 mm.
During the desorption process the material is dried in the reactor with a dry air flow of
the following reactor inlet conditions: air mass flow rate = 1000 g/h, reactor inlet
temperature = 180 °C, reactor inlet air humidity pH2O < 0.3 mbar. Due to heat losses
over the reactor length no uniform temperature distribution over the reactor length is
achieved in steady-state conditions. A temperature drop of T = Tin – Tout = 30 K is
measured over the reactor length.
In the cooling phase the material (and also the periphery to and from the reactor) is
cooled down by air flown through the fixed bed reactor. The reactor inlet temperature is
set to the desired temperature of the adsorption phase. The mass flow rate and air
humidity remain constant.
For the adsorption process the air flow is humidified to the desired inlet air humidity. Due
the control algorithm of the pneumatic valve it takes a few minutes (up to 8 minutes)
until the air humidity is constant at the desired set point value. A bypassing of the
reactor is not possible so that during the first minutes of the measurements the inflow
conditions are not stationary.
The adsorption is performed at an inlet temperature of the air flow of = 35 °C and an
inlet humidity of pH2O = 20 mbar.
Figure 2: Sketch of the fixed
bed reactor.

41
Composite of calcium chloride on a mineral clay matrix
The composite of calcium chloride and mineral clay was prepared at ITW by impregnating
mineral clay (grain size of 2 to 5 mm) in a salt solution of calcium chloride. Afterwards
the sample was dried in an oven at 150 °C. The uptake of calcium chloride into the
mineral clay matrix was approximately 34 weight-% (related to the mineral clay mass).
Afterwards the sample was stored under room conditions.
For investigating the hydration behavior of this composite 71 g of the material was filled
in the fixed bed reactor, just covering the fifth temperature sensor.
For the dehydration of the composite, the temperature of the airflow is stepwise
increased: 4 hours at 50 °C, 5 hours at 100 °C, 6 hours at 150 °C. The mass flow is set
constant to = 1000 g/h, the reactor inlet air humidity is pH2O < 0.3 mbar. Due to heat
losses over the reactor length a temperature drop over the reactor of T = 22 K is
measured at a reactor inlet temperature of = 150 °C.
The cooling and the hydration phase were conducted in the same manner as for the
binder-free zeolite 13X.
Results
Binder-free zeolite 13X
Figure 3 depicts the temperature profile in the material bed, the reactor inlet and outlet
temperatures and the reactor inlet and outlet water vapor pressures of the airflow during
the adsorption process.
Successively the temperatures measured at the five thermocouples TR1 to TR5 are
increasing to a maximum temperature of around = 80 °C and are then decreasing
again. The sharp temperature peaks indicate a sharp reaction front which is moving
through the reactor.
Over almost 1.5 hours the air humidity at the reactor outlet is almost zero. This indicates
a high affinity of this zeolite towards water. During the next 40 minutes, the reactor
outlet water vapor pressure is comparatively rapidly increasing to 18.5 mbar and then
over a long period of roughly 30 to 40 minutes slowly approaching the value of the water
vapor pressure of the reactor inlet of 20 mbar. The total amount of water vapor adsorbed
is measured to 23 g, equivalent to 26.4 weight-% (related to the dry material mass).
Figure 3: Temperature distribution over the reactor length, reactor inlet and outlet air
temperatures and reactor inlet and outlet water vapor pressures depicted over the
reaction time during the adsorption of binder-free zeolite 13X

42
Composite of calcium chloride on a mineral clay matrix
In figure 4 the temperature profile in the material bed, the reactor inlet and outlet
temperatures and the reactor inlet and outlet water vapor pressures of the airflow during
the hydration phase are depicted.
As soon as water vapor is given to the airflow a temperature increase at all temperature
sensors is measured immediately. After 6 minutes, a maximum temperature of about
= 60 °C is reached at temperature sensor TR3 and TR4. Afterwards, the temperature in
the whole material bed is first dropping quickly to around = 45 °C, then only slightly
decreasing for a quite long period and then decreasing faster again to the air flow inlet
temperature. For example, the temperature at sensor TR3 is first dropping by 15 K (from
= 60 °C to = 45 °C) in 1.5 hours, then only dropping by 3 K (to = 42 °C) during
the next 3.5 hours and then by 5 K again (to = 37°C) in 2.5 hours.
The curve of the partial pressure of the water vapor at the reactor outlet can be classified
in four phases: a very quick increase from pH2O = 0 to pH2O = 12.5 mbar in the first hour,
then a slow increase to pH2O = 14 mbar in the next 4 hours, and then a faster increase to
pH2O = 17.5 mbar in the next 2.5 hours. Afterwards, the water vapor at the reactor outlet
only approaches very slowly the water vapor inlet pressure. Even after 10 hours of
reaction only a water vapor pressure of pH2O = 19 mbar is measured at the reactor outlet.
In total, the water uptake of the composite was measured to be 31.7 weight-% (related
to the dry material) during 10 hours of hydration.
An explanation for the fast increase in temperature in the beginning of the hydration
experiment is that the anhydrated salt first reacts comparatively quickly with the water
vapor. Due to the superposition of two effects, the maximum temperature is measured at
the temperature sensors TR3 and TR4: 1) the air flow transports the heat of reaction
from further upstream in this area and preheats the material and 2) the material in this
area is reacting with the water vapor which is transported via the air flow, heat is
released and further increase the materials temperature.
Further downstream the water vapor in the air flow is consumed and no further reaction
takes place. Hence, no further heat is produced and the air flow is slowly cooled down by
preheating the material.
As soon as a first hydration of the material has occurred the reaction rate rapidly
decreases. This explains the fast temperature decrease over the whole reactor length
after the first peak.
Figure 4: Temperature distribution over the reactor length, reactor inlet and outlet air
temperatures and reactor inlet and outlet water vapor pressures depicted over the
reaction time during the hydration of the composite of mineral clay and calcium-chloride.

43
Now, the reaction front is distributed over the whole reactor length and even at the
reactor outlet not the whole water vapor is consumed but blown out with the air flow.
The almost constant temperature plateau inside the reactor which is measured over a
long time period of 3 to 5 hours especially at the temperature sensors TR4 and TR5 can
be explained by the fact that over the whole reactor length an almost constant heat of
reaction is produced. This explanation is supported by the measurement of the water
vapor pressure at the reactor outlet which is also only very slightly increasing during this
time period.
With increasing material hydration the reaction rate further decreases. After 4 hours of
reaction the temperature measured at the temperature sensor TR1, after 6 and 7 hours
the temperature measured at temperature sensor TR2 and TR3 has dropped almost to
the air inlet temperature. This indicates that the hydration reaction has almost stopped in
this area. Due to a slower hydration reaction of the material also further downstream,
less water vapor is consumed in the reactor and the water vapor outlet pressure is
increasing more rapidly. This is also associated with less heat production inside the
reactor. Less or no preheating of the material further downstream is possible. The
temperatures at the temperature sensors TR4 and TR5 are dropping faster again.

44
CLOSURE
The experimental investigations in the fixed bed reactor allow to gain insight in the
overall heat and mass transport phenomena during a desorption / dehydration and
adsorption / hydration reaction of thermochemical energy storage materials. Information
on the energy density of the material and the material loading can be determined.
The measured data can be used to determine the heat and mass transport parameters
which are needed for a mathematical description of the reaction and to validate
numerical codes. Information on the equilibrium data cannot be obtained from these
experiments and have to be determined by other means.
The validated simulation software can be used to investigate the heat and mass transport
phenomena of different thermochemical energy storage materials under arbitrary
boundary conditions. In addition different reactor designs and different operations of the
reactor can be investigated in great detail which forms the basis for the designing
process of a thermochemical energy storage.
For further information and detailed experimental data contact Barbara Mette, University
of Stuttgart, Institute for Thermodynamic and Thermal Engineering, Pfaffenwaldring 6,
70550 Stuttgart, Germany.
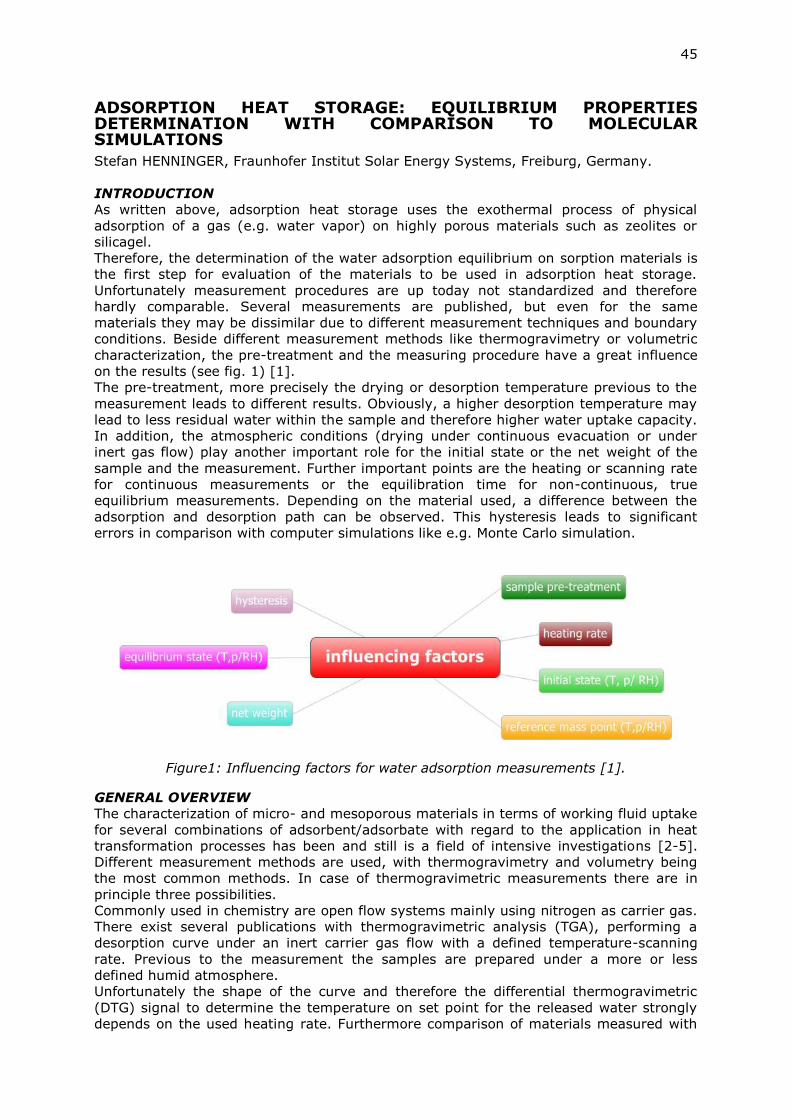
45
ADSORPTION HEAT STORAGE: EQUILIBRIUM PROPERTIES DETERMINATION WITH COMPARISON TO MOLECULAR SIMULATIONS
Stefan HENNINGER, Fraunhofer Institut Solar Energy Systems, Freiburg, Germany.
INTRODUCTION
As written above, adsorption heat storage uses the exothermal process of physical
adsorption of a gas (e.g. water vapor) on highly porous materials such as zeolites or
silicagel.
Therefore, the determination of the water adsorption equilibrium on sorption materials is
the first step for evaluation of the materials to be used in adsorption heat storage.
Unfortunately measurement procedures are up today not standardized and therefore
hardly comparable. Several measurements are published, but even for the same
materials they may be dissimilar due to different measurement techniques and boundary
conditions. Beside different measurement methods like thermogravimetry or volumetric
characterization, the pre-treatment and the measuring procedure have a great influence
on the results (see fig. 1) [1].
The pre-treatment, more precisely the drying or desorption temperature previous to the
measurement leads to different results. Obviously, a higher desorption temperature may
lead to less residual water within the sample and therefore higher water uptake capacity.
In addition, the atmospheric conditions (drying under continuous evacuation or under
inert gas flow) play another important role for the initial state or the net weight of the
sample and the measurement. Further important points are the heating or scanning rate
for continuous measurements or the equilibration time for non-continuous, true
equilibrium measurements. Depending on the material used, a difference between the
adsorption and desorption path can be observed. This hysteresis leads to significant
errors in comparison with computer simulations like e.g. Monte Carlo simulation.
Figure1: Influencing factors for water adsorption measurements [1].
GENERAL OVERVIEW
The characterization of micro- and mesoporous materials in terms of working fluid uptake
for several combinations of adsorbent/adsorbate with regard to the application in heat
transformation processes has been and still is a field of intensive investigations [2-5].
Different measurement methods are used, with thermogravimetry and volumetry being
the most common methods. In case of thermogravimetric measurements there are in
principle three possibilities.
Commonly used in chemistry are open flow systems mainly using nitrogen as carrier gas.
There exist several publications with thermogravimetric analysis (TGA), performing a
desorption curve under an inert carrier gas flow with a defined temperature-scanning
rate. Previous to the measurement the samples are prepared under a more or less
defined humid atmosphere.
Unfortunately the shape of the curve and therefore the differential thermogravimetric
(DTG) signal to determine the temperature on set point for the released water strongly
depends on the used heating rate. Furthermore comparison of materials measured with

46
this method leads to large discrepancies as the initial state, which is room temperature,
is not well defined and therefore difficult to reproduce. In addition without a possibility to
perform adsorption curves, possible hysteresis effects cannot be detected.
Another possibility in case of open systems is to use a well defined humidified carrier gas
(e.g. Setaram WetSys) which flows around the sample. To prevent condensation, the
transfer line and the measurement cell has to be temperature controlled in an accurate
way.
The third possibilities are systems with closed working fluid atmosphere. As shown in
Henninger et al. [6] measurements with open and closed systems are comparable if
using the same reference conditions. Beside the differences in the apparatuses an
additional uncertainty is the difference in isobaric versus isothermal measurements.
Isothermal measurement in principle allows the determination of the heat of adsorption,
by calculation for at least two isotherms or direct measurement within a simultaneous
TG/DSC. In addition, especially with regard to the Dubinin transformation, the
temperature independency can be verified.
Isobaric measurement can in principle be performed in a broader temperature range
therefore covering a larger range of the adsorption potential A = RT ln p/p0. Furthermore
as the real cycle (ideally) consists of two isobaric phases of desorption and adsorption at
condenser and evaporator pressure, the isothermal measured data is not directly
adoptable to the operating device. An overview on the adsorption equilibrium
characterization is given in fig. 2.
Figure 1: Overview on possible adsorption equilibrium characterization methods. This list
is not exhaustive.
MEASUREMENT PROCEDURES
As a result of the consideration described above a common method for determination of
water adsorption characteristics with focus on adsorption heat transformation must be
defined.
Within this Task a round robin test (RRT) consisting of two isothermal measurements has
been performed. The results of this RRT will be described within another report.
Beside this proposed procedure here another procedure is described, allowing for
comparison of measurement with simulation were isotherms are difficult to be performed
[1]. As defined below, in case of grand canonical simulations the definition of the
temperature is more straight forward than the definition of a pressure via the fugacity.
The procedure consists of a pre-treatment of the sample under continuous evacuation
(vacuum level: 1e-4 kPa) or dry carrier gas flow.
The optimal sample pre-treatment temperature should be selected according to the
hydrophilicity of the samples.
• Strongly hydrophilic zeolites (4A, 13X): pre-treatment T = 300°C.
• Hydrophilic aluminosilicates (NaY): pre-treatment T = 200°C

47
• Hydrophobic aluminosilicates (silicalites, ZSM5): T=150°C
• Aluminophospates (AlPO, SAPO): T=150°C
• Others (silica gels, activated carbons): T=150°C
The sample is heated starting from ambient conditions with a heating rate of 1K/min
followed by an isothermal drying step for another 8 hours. In the following step, isobar
measurement at a water vapour pressure of 1.2 and 5.6 kPa takes place.
The selection of the two pressure levels is motivated with respect to the possible
applications. The pressure level of 1.2 kPa corresponds to an evaporation temperature of
10°C, which marks a useful temperature level for low temperature heat source. The
second pressure level of 5.6 kPa corresponds to 35°C which either marks the
temperature where heat can be rejected (in desorption case) or can be used for low
temperature heating (heat pumping application).
For each pressure level the sample temperature is varied in 5 or 10 K steps between
150°C and 40°C (for 5.6 kPa) or 20°C (for 1.2 kPa) respectively. In addition at least one
adsorption and desorption measurements should be performed in order to detect possible
hysteresis effects.
Figure 2: Proposed measurement procedure, including sample pre-treatment and the
first isobaric step.
This procedure has successfully been used within the IEA annex 34 “Thermally driven
heat pumps”. First promising results with a good agreement between measurements
performed at Fraunhofer ISE and at CNR-ITAE, using different techniques were
performed. As first two candidates of a standard material to be used in a round robin
test, a silica gel 127 B and a SAPO-34 have been chosen.
CALIBRATION AND COMPARISON WITH MODELLING RESULT
New materials are necessary in order to improve the adsorption characteristics for these
applications. Molecular simulations are seen as a promising tool to investigate the
influence of molecular structure on the adsorption characteristics and thus to provide
means for future improvements of such materials for application in heat transformation.
The field of molecular simulation enfolds a broad range, from model systems of generally
theoretical interest to real fluids or solids in material science up to applications in life
science, e.g. drug design.
Within a recently published work, a simulation program specially tailored to the problem
has been developed [7]. The program uses the grand canonical ensemble and the simple
point charge model (SPC) and the enhanced version (SPC/E) developed by Berendsen et
al. [7,8]. Calculation of long-range electrostatic interactions is realised by the use of the
Ewald summation technique [9,10] in combination with periodic boundary conditions
respecting the minimum image convention [11]. The accurate implementation of the long
ranged coulomb interactions has been examined by calculation of the Madelung constant

48
for a NaCl ion lattice. Furthermore the combined interaction energy for water within a
zeolite structure has been confirmed for a fixed water configuration with the molecular
dynamic program MOSCITO [12].
For comparison with experimental data the chemical potential is converted according to
the ideal gas law
)ln( Pideal
with the fugacity f = P and TkB
1 .
Calculation of the isosteric adsorption enthalpy is achieved by the ensemble fluctuation
method [13-15].
As result of the simulations, the number of water molecules adsorbed in thermodynamic
equilibrium under given conditions of temperature and chemical potential (pressure) are
compared with the experimental data. To assure thermodynamic equilibrium, all
simulations start with an equilibration phase followed by a production phase. The number
of required equilibration cycles varies strongly with the different simulated frameworks,
depending on size and number of water molecules within the unit cell. As an average two
million equilibration cycles have been chosen for the equilibration phase. Within one cycle
there is one attempt for a displacement, five attempts for exchange and one attempt for
a rotation of a water molecule. Simulation results out of the production cycles are
analysed and simulation errors are calculated according to the block transformation
method of Flyvbjerg and Petersen [16].
As shown in Fig. 3, the simulated and experimental isobars are in very good agreement.
Figure 3: Comparison of simulated (dashed line) and experimental (solid line) adsorption
isobars at 1.2 and 5.6 kPa.
The relative water uptake (absolute water uptake normalized by the reference mass at
150°C) is shown for the water vapour pressure at 1.2 kPa or 5.6 kPa. The reason for
choosing this reference mass is due to the fact that the real adsorbent sample in the
experimental case is different to the ideal crystalline framework (see Fig.4). Whereas in
the simulation there is only the pure crystal, the real sample contains potentially a
binding agent, amorphous phases and residual water content.

49
Figure 4: Snapshot of the simulation showing 214 water molecules in a Li-LSX host at
383 K, 5.6 kPa.
CLOSURE
To measure equilibrium adsorption characteristic several important influencing factors
have to be taken into account. This includes for example the sample preparation. Here
the outgassing temperature and surrounding has the greatest impact on the results. With
regard to the measurement procedure isobaric vs. isothermal measurements may show
different results. By a proper choice of reference mass and illustration this can be
overcome.
The apparatus itself also has a great influence on the experimental data. As written
above, differences between open flow and closed system can be eliminated by a proper
choice of the reference mass.
All these factors have to be taken into account comparing simulated results with
experimental data.
However, evaluation of sorption materials on basis of experimental characterisation and
molecular simulation methods can give deeper insight into the underlying adsorption
mechanism. According to the molecular simulation results, various recommendations on
the improvement of sorption materials for heat transformation can be given.
BIBLIOGRAPHY
[1] Henninger, S. K., Freni, A., Schnabel, L., Schossig, P., & Restuccia, G. (2011).
Unified water adsorption measurement procedure for sorption materials. Proc. of
International Sorption Heat Pump Conference (Vol. 4, pp. 513 - 522). Padova, Italy.
doi:ISBN: 978-2-913149-84-7
[2] Srivastava, N. C., & Eames, I. W. (1998). A review of adsorbents and adsorbates
in solid-vapour adsorption heat pump systems. Applied Thermal Engineering, 18,
707-714.
[3] Aristov, Y. I., Restuccia, G., Cacciola, G., & Parmon, V. (2002). A family of new
working materials for solid sorption air conditioning systems. Applied Thermal
Engineering, 22(2), 191–204. Elsevier

50
[4] Jänchen, J., Ackermann, D., & Stach, H. (2002). Adsorption Properties of
Aluminophosphate Molecular Sieves-Potential Applications for Low Temperature
Heat Utilization. Proceedings of the International Sorption Heat Pump Conference Shanghai, PR China (pp. 2-5).
[5] Critoph, R. E., & Zhong, Y. (2005). Review of trends in solid sorption refrigeration
and heat pumping technology. Proceedings of the Institution of Mechanical
Engineers, Part E: Journal of Process Mechanical Engineering, 219(3), 285-300. doi: 10.1243/095440805X6982.
[6] Henninger, S.K., Schmidt, F. P., & Henning, H.-M. (2010). Water adsorption
characteristics of novel materials for heat transformation applications. Applied
Thermal Engineering, 30(13), 1692-1702. Elsevier Ltd. doi: 10.1016/j.applthermaleng.2010.03.028.
[6] Henninger, S., Schmidt, F., & Henning, H.-M. (2011). Characterisation and
improvement of sorption materials with molecular modeling for the use in heat
transformation applications. Adsorption, 17(5), 833-843. Springer.
doi:10.1007/s10450-011-9342-6
[7] Berendsen H. J. C. et al.: Interaction models for water in relation to protein
hydration, Pullmann B. (Ed.), Intermolecular Forces, Reidel, Dordrecht. 1981, pp.
331–342
[8] Berendsen H. J. C., Grigera J. R. and Straatsma T. P.:The Missing Term in
Effective Pair Potentials, J. Phys. Chem., Vol 91, No. 24, 1987, pp. 6269–6271
[9] Kolafa Jiri and Perram John W., Cutoff errors in the ewald summation formulae for
point charge systems, Molecular Simulation, 1992, pp. 351–368
[10] Frenkel Daan and Smit Berend: Understanding Molecular Simulation, Academic
Press, San Diego (2002).
[11] Allen M. P. und Tildesley D. J., Computer Simulation of Liquids, Clarendon Press,
Oxford, 1986
[12] Paschek Dietmar and Geiger Alfons, User’s Guide and Manual MOSCITO 4
Performing Molecular Dynamics Simulations, http://ganter.chemie.uni-
dortmund.de/MOSCITO/index.shtml, Accessed April 7, 2003.
[13] Karavias F. and Myers A.L., Isosteric Heats of Multicomponent Adsorption -
Thermodynamics and Computer-Simulations, Langmuir , 7, No. 12, 1991, pp.
3118–3126
[14] Pellenq RJM et al., Grand canonical Monte Carlo simulations of adsorption of polar
and nonpolar molecules in NaY zeolites, Langmuir ,12, 1996, pp. 4768–4783
[15] Woods G.B. and Rowlinson J.S., Computer-Simulations of Fluids in Zeolite-X and
Zeolite-Y, Journal of the Chemical Society - Faraday Transactions II, 85, 1989, pp.
765–781
[16] Flyvbjerg H. und Petersen H. G., Error Estimates on Averages of Correlated Data,
J. Chem. Phys., 91, 1989, pp. 461–466

51
CHARACTERIZATION OF THE DEHYDRATION REACTION OF SEVERAL CRYSTALLINE SALT HYDRATES UNDER THE CONDTIONS OF THE SEASONAL HEAT STORAGE
Claire FERCHAUD1 and Herbert ZONDAG1,2
1 Energy Research Center of the Netherland (ECN), 2 Eindhoven University of Technology, Eindhoven, The Netherlands.
INTRODUCTION
At ECN, research is carried out into seasonal solar heat storage for individual houses,
based on the reversible sorption reaction of water vapor. During summer, salt hydrates
can be dehydrated by solar heat provided by the solar thermal collectors at a
temperature below 150°C. In the present work, the dehydration reactions of four salt
hydrate materials, Li2SO4.H2O, CuSO4.5H2O, MgSO4.7H2O and MgCl2.6H2O, have been
studied by thermal analysis to determine the reaction data for these materials for
seasonal heat storage. The dehydration was carried out at a water vapor pressure of 13
mbar, which is a typical value for the Dutch summer.
LAY-OUT OF THE EXPERIMENTAL SET-UP
Dimensions
The thermal analysis has been carried out with a Simultaneous Thermal Analysis
apparatus (STA 409 PC). This allows measuring the mass loss and the heat flow of the
sample, observed for each phase transition of the material by Thermogravimetry (TG)
and Differential Scanning Calorimetry (DSC). The inlet air at the entrance of the
apparatus has been set at a water vapor pressure of 13 mbar. A moist air flow of 100
ml/min was applied from the bottom to the top of the apparatus surrounding the open
pan of 25 l (5 mm diameter) containing the salt hydrate sample (fig. 1).
Figure 1: Scheme of the STA system and picture of the 25 l aluminum cups used during the
thermal analyses measurements
Material properties
Commercial crystalline powders sieved with a particle size distribution of 100-200 m
have been used for these experiments. The weight of the salt hydrate sample used for
each measurement was around 10.2 mg with +/- 0.2 mg. It corresponds to a
homogeneous mono-layer thickness (maximum 200 m) over the bottom of the
aluminium cup. This quantity of material has been taken as reference to be able to
compare one material to another, in order to avoid a gradient of gas diffusion through
the sample during the measurements.

52
DETAILED DESCRIPTION OF THE MEASURING PROCEDURE
The dehydration of the salt hydrates has been carried out in dynamic mode with a slow
heating rate of 0.5 K/min to approach the equilibrium conditions of the materials. For the
sulfates, the dehydration reaction was carried out between 25 and 150°C. A different
temperature range between 40 and 130°C has been chosen for MgCl2.6H2O for practical
reasons. In-situ X-ray diffraction analyses performed at 13 mbar have shown an
overhydration of MgCl2.6H2O for temperatures below 40°C and a decomposition of the
material in MgOHCl by release of HCl vapors above the temperature of 130°C. The TG
and DSC curves of the dehydration of the four salt hydrates are presented in this study.
Additionally, the temperature of the dehydration reactions (peak temperature), the
reaction enthalpy values and energy density values obtained for these materials under
the practical conditions of the heat storage have been summarized and compared with
the values determined from the NBS data [1]. The energy density values were calculated
with the material density values of the reactant phase of each reaction.
RESULTS
The TG and DSC results in figure 2 shows that the four salt hydrates presented in this
study can store heat under the operational conditions of seasonal heat storage by
removal of water molecules in their material structure, thereby reaching lower hydrated
or anhydrous composition.
Figure 2 : TG (in red) and DSC (in blue) curves of the dehydration reaction at 13 mbar water vapor pressure and a heating rate of 0.5 K/min of (a) Li2SO4.H2O, (b) CuSO4.5H2O, (c)
MgSO4.7H2O and (d) MgCl2.6H2O powders sieved at 100-200 m
The summary of the temperature of the dehydration reactions (peak temperature), the
reaction enthalpy values and energy density values obtained from the thermal analysis
measurements are presented in table 1. The initial composition of magnesium sulfate
hydrate powder has been estimated at MgSO4.6.75H2O instead of MgSO4.7H2O, because
the material was already partially dried as shown on the figure 2c. This phenomenon can
be explained by the fact that the transition of MgSO4·7H2O to MgSO4·6H2O starts at
nearly ambient temperature (25-30°C). Therefore, during the storage and the sieving
step performed before the measurement, 25% of the MgSO4·7H2O powder was
c) d)
b) a)

53
dehydrated and the initial composition of the powder is a mix of MgSO4·7H2O and
MgSO4·6H2O materials. The reaction enthalpy and the energy density values obtained for
the loss of 0.75 water molecule have been recalculated for 1 molecule of water in table 1.
The energy density of the dehydration reaction of MgSO4.6.75H2O in MgSO4.6H2O has
been calculated with the density values of MgSO4.7H2O because the density of
MgSO4.6.75H2O does not exist in the literature (indicated by an * in table 1).
Table 1 : Temperature of transition and enthalpy values of the phase transition observed during
the dehydration reactions of sieved powders of Li2SO4.H2O, CuSO4.5H2O, MgSO4.7H2O and MgCl2.6H2O at 13 mbar water vapor pressure and 0.5 K/min heating rate.
Dehydration reactions
Experimental data NBS data [1]
Tpeak DSC
(°C)
rH
[kJ/mol]
Energy
density
GJ/m3
rH
[kJ/mol]
Energy density
GJ/m3
Li2SO4.H2O (s) → Li2SO4 (s) + H2O (g) 97 41.01 0.71 57.18 0.99
CuSO4. 5H2O (s) → CuSO4. 3H2O (s) + 2H2O (g) 52 89.07 0.81 111.68 1.02
CuSO4. 3H2O (s) → CuSO4. H2O (s) + 2H2O (g) 86 89.44 1.12 114.82 1.44
MgSO4. 6.75H2O (s) → MgSO4. 6H2O(s) + 0.75H2O (g)
[MgSO4. 7H2O (s) → MgSO4. 6H2O (s) + H2O (g)]
39
42.97 (0.75)
58.07 (1)
0.29 (0.75) *
0.39 (1)
59.88
0.41
MgSO4. 6H2O (s) → MgSO4. H2O (s) + 5H2O (g) 72 249.88 1.83 275.75 2.37
MgCl2. 6H2O (s) → MgCl2. 4H2O (s) + 2H2O (g) 85 102.61 0.79 116.37 0.89
MgCl2. 4H2O (s) → MgCl2. 2H2O (s) + 2H2O (g) 118 117.41 1.10 135.61 1.27
The energy density found for each material is directly related to the thermochemical
reactions taking place in the material during the dehydration process. According to the
present results, the crystal energy density of these materials is between 4 times
(Li2SO4.H2O) to 11 times (MgSO4.7H2O) higher than the energy density in water (0.25
GJ/m3). Note however, that the energy density as presented above will be reduced in
practical systems because of the porosity in the packed bed required for the vapor
transport.
An additional disclaimer has to be made about the temperatures of reaction presented in
this paper to model the water vapor sorption process of these materials. The
temperature data presented correspond to the temperatures at which the chemical
reactions take place during the dehydration process. Additional experiments showed that
these temperatures depend on the heating rate applied to the system during the
dehydration process. Then, these temperature results should be only considered to
model a system set with a heating rate at 0.5 K/min. Moreover, the reaction
temperatures presented in this paper should not be taken as reaction temperatures for
the hydration process of these materials. As represented in fig. 3, the temperature of
reaction of the dehydration process is commonly higher than the equilibrium temperature
of the chemical reaction, while the temperature of reaction for the reversible hydration
process is lower.

54
Figure 3: Theoretical representation of the DSC signal obtained for a phase transition
during the dehydration and hydration reactions
CLOSURE
Additional measurements performed with faster heating rates (1, 5, 10 K/min) have also
been carried out for these materials, showing a constant energy density but an increase
of the temperature of the phase transitions. Information on these measurements can be
obtained by contacting Herbert Zondag, ECN – department Thermal Systems, P.O. Box 1,
1755 ZG Petten, The Netherlands, Tel : +31 224 56 4941, email : [email protected].
BIBLIOGRAPHY
[1] D. D. Wagman, W. H. Evans, V. B. Parker, R. H. Schumm, I. Halow, S. M. Balley,
K. L. Churney, R. L. Nuttall, The NBS tables of chemical thermodynamic properties
: selected values for inorganic and C₁ and C₂ organic substances in SI units,
Journal of physical and chemical reference data, 11 (2), (1982)
T transition hydration T transition dehydration
exothermic
DSC signal
Temperature
Hydration transition
Dehydration transition
Equilibrium T(P)
55
SHORT DESCRIPTION OF TASK 42/ ANNEX 24
From past IEA SHC and ECES tasks it was concluded that a broad and basic research and
development initiative is needed to find and improve compact thermal energy storage
materials. The IEA joint Task/Annex 42/24 brings together experts from both the
materials development field and the systems integration fields. In four years, the task
aims at having finished the first steps towards a new generation of thermal storage
technologies.
OBJECTIVE
The overall objective of this task is to develop advanced materials and systems for the
compact storage of thermal energy. This can be subdivided into seven specific
objectives:
to identify, design and develop new materials and composites for compact thermal
energy storage,
to develop measuring and testing procedures to characterise new storage
materials reliably and reproducibly,
to improve the performance, stability, and cost-effectiveness of new storage
materials,
to develop multi-scale numerical models, describing and predicting the
performance of new materials in thermal storage systems,
to develop and demonstrate novel compact thermal energy storage systems
employing the advanced materials,
to assess the impact of new materials on the performance of thermal energy
storage in the different applications considered, and
to disseminate the knowledge and experience acquired in this task.
A secondary objective of this task is to create an active and effective research network in
which researchers and industry working in the field of thermal energy storage can
collaborate.
SCOPE
This task deals with advanced materials for latent and chemical thermal energy storage,
and excludes materials related to sensible heat storage. The task deals with these
materials on three different scales:
material scale, focused on the behaviour of materials from the molecular to the
‘few particles’ scale, including e.g. material synthesis, micro-scale mass
transport, and sorption reactions;
bulk scale, focused on bulk behaviour of materials and the performance of the
storage in itself, including e.g. heat, mass, and vapour transport, wall-wall and
wall-material interactions, and reactor design;
system scale, focused on the performance of a storage within a heating or cooling
system, including e.g. economical feasibility studies, case studies, and system
tests.
Because seasonal storage of solar heat for solar assisted heating of buildings is the main
focus of the SHC IA, this will be one of the primary topics of this task. However, because
there are many more relevant applications for TES, and because materials research is not
and can not be limited to one application only, this task will focus on multiple application
areas.
In the Task kick-off meeting it was decided to subdivide the Applications Subtask into
three Working Groups, corresponding to three different temperature levels of thermal
energy storage, as depicted below.
STRUCTURE
To achieve the maximum amount of cross-fertilisation between the different backgrounds
of the two Implementing Agreements and experts in this Joint Task, the Task is
organised in a matrix-like structure (see diagram below).

56
Theoretical Limits
Heatin
g / D
HW
Coolin
g
Material Engineering / Processing
Test and Characterisation
Numerical Modelling
Application Related Activities
Mate
rial R
ela
ted
Activ
ities
Hig
h T
em
p. A
pplic
atio
ns
Apparatus / Components

57
IEA Solar Heating and Cooling Programme The International Energy Agency (IEA) is an autonomous body within the framework of the
Organization for Economic Co-operation and Development (OECD) based in Paris. Established in
1974 after the first “oil shock,” the IEA is committed to carrying out a comprehensive program of
energy cooperation among its members and the Commission of the European Communities.
The IEA provides a legal framework, through IEA Implementing Agreements such as the Solar
Heating and Cooling Agreement, for international collaboration in energy technology research and
development (R&D) and deployment. This IEA experience has proved that such collaboration
contributes significantly to faster technological progress, while reducing costs; to eliminating
technological risks and duplication of efforts; and to creating numerous other benefits, such as swifter
expansion of the knowledge base and easier harmonization of standards.
The Solar Heating and Cooling Programme was one of the first IEA Implementing Agreements to be
established. Since 1977, its members have been collaborating to advance active solar and passive
solar and their application in buildings and other areas, such as agriculture and industry. Current
members are:
Australia Finland Portugal
Austria France South Africa
Belgium Italy Spain
Canada Mexico Sweden
Denmark Netherlands Switzerland
European Commission New Zealand United States
Germany Norway
A total of 44 Tasks have been initiated, 33 of which have been completed. Each Task is managed by
an Operating Agent from one of the participating countries. Overall control of the program rests with
an Executive Committee comprised of one representative from each contracting party to the
Implementing Agreement. In addition to the Task work, a number of special activities—
Memorandum of Understanding with solar thermal trade organizations, statistics collection and
analysis, conferences and workshops—have been undertaken.
To find Solar Heating and Cooling Programme publications and learn more about the Programme visit
www.iea-shc.org or contact the SHC Secretariat, Pamela Murphy, e-mail: [email protected].
58
Current Tasks & Working Group:
Task 36 Solar Resource Knowledge Management
Task 39 Polymeric Materials for Solar Thermal Applications
Task 40 Towards Net Zero Energy Solar Buildings
Task 41 Solar Energy and Architecture
Task 42 Compact Thermal Energy Storage
Task 43 Solar Rating and Certification Procedures
Task 44 Solar and Heat Pump Systems
Task 45 Large Systems: Solar Heating/Cooling Systems, Seasonal Storages, Heat Pumps
Task 46 Solar Resource Assessment and Forecasting
Task 47 Renovation of Non-Residential Buildings Towards Sustainable Standards
Task 48 Quality Assurance and Support Measures for Solar Cooling
Task 49 Solar Process Heat for Production and Advanced Applications
Completed Tasks:
Task 1 Investigation of the Performance of Solar Heating and Cooling Systems
Task 2 Coordination of Solar Heating and Cooling R&D
Task 3 Performance Testing of Solar Collectors
Task 4 Development of an Insolation Handbook and Instrument Package
Task 5 Use of Existing Meteorological Information for Solar Energy Application
Task 6 Performance of Solar Systems Using Evacuated Collectors
Task 7 Central Solar Heating Plants with Seasonal Storage
Task 8 Passive and Hybrid Solar Low Energy Buildings
Task 9 Solar Radiation and Pyranometry Studies
Task 10 Solar Materials R&D
Task 11 Passive and Hybrid Solar Commercial Buildings
Task 12 Building Energy Analysis and Design Tools for Solar Applications
Task 13 Advanced Solar Low Energy Buildings
Task 14 Advanced Active Solar Energy Systems
Task 16 Photovoltaics in Buildings
Task 17 Measuring and Modeling Spectral Radiation
Task 18 Advanced Glazing and Associated Materials for Solar and Building Applications
Task 19 Solar Air Systems
Task 20 Solar Energy in Building Renovation
Task 21 Daylight in Buildings
Task 22 Building Energy Analysis Tools
Task 23 Optimization of Solar Energy Use in Large Buildings
Task 24 Solar Procurement
Task 25 Solar Assisted Air Conditioning of Buildings Task 26 Solar Combisystems
Task 27 Performance of Solar Facade Components
Task 28 Solar Sustainable Housing
Task 29 Solar Crop Drying
Task 31 Daylighting Buildings in the 21st Century
Task 32 Advanced Storage Concepts for Solar and Low Energy Buildings
Task 33 Solar Heat for Industrial Processes
Task 34 Testing and Validation of Building Energy Simulation Tools
Task 35 PV/Thermal Solar Systems
Task 37 Advanced Housing Renovation with Solar & Conservation
Task 38 Solar Thermal Cooling and Air Conditioning
Completed Working Groups:
CSHPSS; ISOLDE; Materials in Solar Thermal Collectors; Evaluation of Task 13 Houses; Daylight
Research

59
IEA Energy Conservation Through Energy Storage Programme
The International Energy Agency (IEA), based in Paris, is an autonomous agency linked with the
Organisation for Economic Co-operation and Development (OECD). The IEA is the energy forum for
26 Member countries. IEA Member governments are committed to taking joint measures to meet oil
supply emergencies. They have also agreed to share energy information, to co-ordinate their energy
policies and to co-operate in the development of rational energy programmes.
The R&D programme Efficient Energy End-Use Technologies contains 14 different Implementing
Agreements (IAs) of which one is the IA on energy storage. The full name of this IA is Energy
Conservation though Energy Storage (ECES IA). This IA was founded in 2004 and intends to promote
co-operative research, development, demonstrations and exchanges of information regarding
energy conservation through energy storage.
The continued development, application and deployment of energy efficient end-use technologies has
the potential to significantly reduce energy consumption and greenhouse gases in the buildings,
electricity generation, industry, and transport sectors. Energy storage technologies can overcome the
temporal mismatch between energy supply and demand, especially regarding renewable energy
technologies, the use of waste energy and energy from ambient sources such as cold from the natural
environment.
Active participants in ECES IA are at present:
Belgium
Canada
China
Finland
France
Germany
Italy
Japan
Korea
Norway
Sweden
USA
Turkey
Three sponsors are participating in the ECES at the moment:
IF Technology B.V. (Netherlands)
Institute of Heat Engineering, University of Technology of Warsaw (Poland)
Energesis Ingeniería, S.L. (Spain).
Other countries have signed the agreement but are not presently engaged in the activities. Further
countries have recently shown interest in participating in the near future, including countries from
Eastern Europe.
The work within the ECES IA is lead by an Executive Committee (XC) and the work undertaken by
this XC is done by mutual agreements defined in Annexes as listed on the next page. The work is led
by Chairman Halime Paksoy (Turkey) and Secretary Hunay Evliya (Turkey).
To find ECES publications and learn more about the Programme visit http://www.iea-eces.org or
contact the ECES Secretariat, Hunay Evliya, e-mail: [email protected]

60
Ongoing Annexes:
Annex 20 Sustainable Cooling with Thermal Energy Storage
Annex 21 Thermal Response Test for Underground Thermal Energy Storages
Annex 22 Thermal Energy Storage Applications in Closed Greenhouses
Annex 23 Applying Energy Storage in Ultra-low Energy Buildings
Annex 24 Material Development for Improved Thermal Energy Storage Systems
Annex 25 Surplus Heat Management using Advanced TES for CO2 mitigation
Annex 26 Electric Energy Storage: Future Energy Storage Demand
Completed Annexes:
Annex 1 Large Scale Thermal Storage Systems Evaluation
Annex 2 Lake Storage Demonstration Plant in Mannheim
Annex 3 Aquifer Storage Demonstration Plant in Lausanne Dorigny
Annex 4 Short Term Water Heat Storage Systems
Annex 5 Full Scale Latent Heat Storage Installations
Annex 6 Environmental and Chemical aspects of Thermal Energy Storage in Aquifers and
Research and Development of Water Treatment Methods
Annex 7 Innovative and Cost Effective Seasonal Cold Storage Applications
Annex 8 Implementing Underground Thermal Energy Storage Systems
Annex 9 Electrical Energy Storage Technologies for Utility Network Optimization
Annex 10 Phase Change Materials and Chemical Reactions for Thermal Energy Storage
Annex 12 High-Temperature Underground Thermal Energy Storage (HT UTES)
Annex 13 Design, Construction and Maintenance of UTES Wells and Boreholes
Annex 14 Cooling with TES in all Climates
Annex 17 Advanced Thermal Energy Storage Techniques – Feasibility Studies and
Demonstration Projects
Annex 18 Transportation of Thermal Energy Utilizing Thermal Energy Storage Technology
Annex 19 Optimised Industrial Process Heat and Power Generation with Thermal Energy
Storage

IEA SHC/ECES – Task 42/24 – Compact Thermal Energy Storage
APPENDIX “DETAILED EXPERIMENTAL RESULTS FOR SUBMERGED FINNED HEAT EXCHANGER IN PCM BASED THERMAL ENERGY STORAGE” BY NM. J. CHIU AND V. MARTIN
Congealing Process
Inlet T 11 °C Freezing Run A
Freezing Run B
Freezing Run C
Time (s) Tfin (°C) Tpcm (°C)
Time (s) Tfin (°C)
Tpcm (°C)
Time (s) Tfin (°C)
Tpcm (°C)
0 20.31 29.08
0 20.42 29.03
0 23.74 29.01
10 20.22 28.91
10 20.33 28.85
10 23.32 28.99
20 20.12 28.73
20 20.24 28.68
20 22.94 28.95
30 20.05 28.56
30 20.15 28.49
30 22.61 28.91
40 19.96 28.37
40 20.08 28.32
40 22.31 28.86
50 19.88 28.21
50 20.02 28.16
50 22.06 28.79
60 19.81 28.05
60 19.94 27.98
60 21.81 28.71
70 19.73 27.87
70 19.86 27.80
70 21.59 28.63
80 19.68 27.71
80 19.80 27.64
80 21.38 28.52
90 19.62 27.54
90 19.72 27.47
90 21.21 28.42
100 19.55 27.37
100 19.66 27.32
100 21.04 28.31
110 19.49 27.22
110 19.60 27.15
110 20.89 28.19
120 19.43 27.05
120 19.54 27.00
120 20.76 28.06
130 19.37 26.91
130 19.47 26.86
130 20.65 27.93
140 19.30 26.75
140 19.41 26.70
140 20.53 27.81
150 19.25 26.60
150 19.35 26.55
150 20.44 27.65
160 19.19 26.44
160 19.28 26.39
160 20.36 27.52
170 19.12 26.29
170 19.21 26.26
170 20.27 27.38
180 19.07 26.16
180 19.16 26.12
180 20.19 27.23
190 19.00 26.01
190 19.08 25.97
190 20.09 27.10
200 18.95 25.87
200 19.03 25.84
200 20.03 26.95
210 18.90 25.74
210 18.97 25.68
210 19.97 26.82
220 18.84 25.61
220 18.92 25.55
220 19.90 26.67
230 18.78 25.48
230 18.86 25.42
230 19.82 26.51
240 18.73 25.35
240 18.81 25.29
240 19.75 26.38
250 18.69 25.22
250 18.78 25.17
250 19.70 26.25
260 18.64 25.10
260 18.76 25.05
260 19.62 26.11
270 18.59 24.97
270 18.71 24.93
270 19.58 25.99
280 18.55 24.85
280 18.67 24.81
280 19.50 25.85
290 18.51 24.75
290 18.64 24.69
290 19.45 25.72
300 18.48 24.62
300 18.59 24.58
300 19.41 25.60
310 18.44 24.52
310 18.52 24.45
310 19.35 25.46
320 18.40 24.39
320 18.51 24.36
320 19.30 25.35
330 18.37 24.29
330 18.46 24.24
330 19.25 25.22
340 18.33 24.17
340 18.43 24.15
340 19.21 25.11
350 18.30 24.08
350 18.40 24.05
350 19.18 24.99
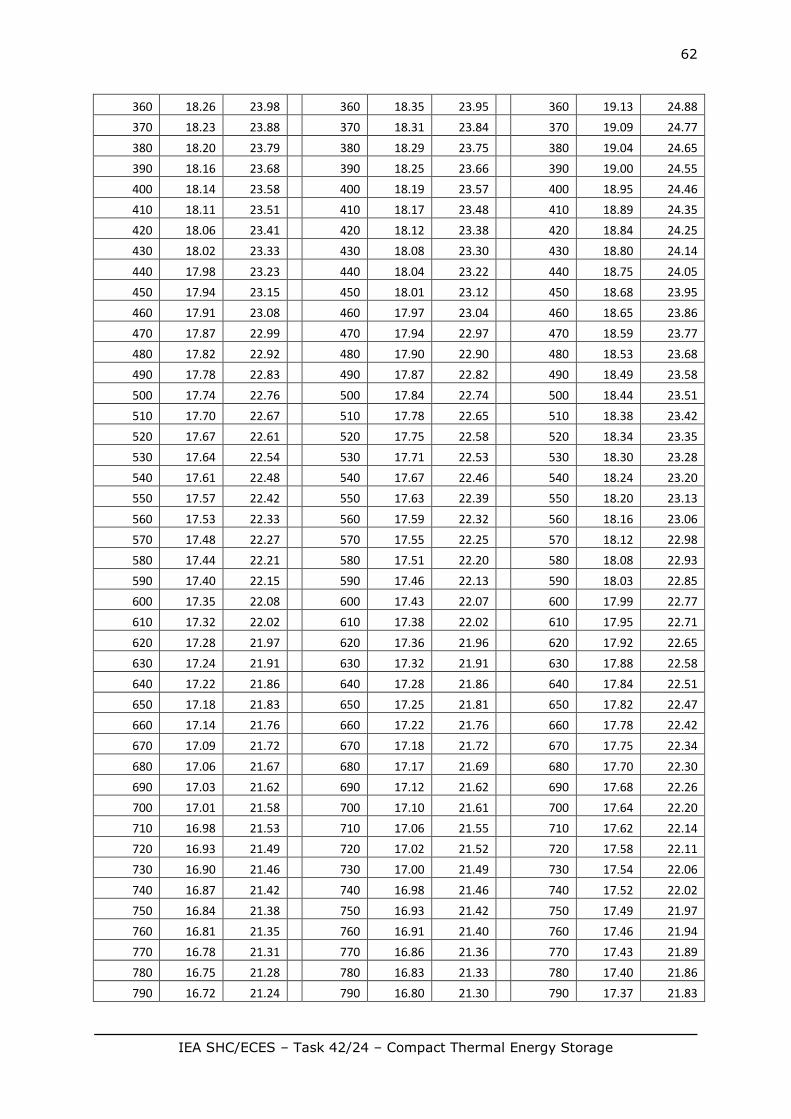
62
IEA SHC/ECES – Task 42/24 – Compact Thermal Energy Storage
360 18.26 23.98
360 18.35 23.95
360 19.13 24.88
370 18.23 23.88
370 18.31 23.84
370 19.09 24.77
380 18.20 23.79
380 18.29 23.75
380 19.04 24.65
390 18.16 23.68
390 18.25 23.66
390 19.00 24.55
400 18.14 23.58
400 18.19 23.57
400 18.95 24.46
410 18.11 23.51
410 18.17 23.48
410 18.89 24.35
420 18.06 23.41
420 18.12 23.38
420 18.84 24.25
430 18.02 23.33
430 18.08 23.30
430 18.80 24.14
440 17.98 23.23
440 18.04 23.22
440 18.75 24.05
450 17.94 23.15
450 18.01 23.12
450 18.68 23.95
460 17.91 23.08
460 17.97 23.04
460 18.65 23.86
470 17.87 22.99
470 17.94 22.97
470 18.59 23.77
480 17.82 22.92
480 17.90 22.90
480 18.53 23.68
490 17.78 22.83
490 17.87 22.82
490 18.49 23.58
500 17.74 22.76
500 17.84 22.74
500 18.44 23.51
510 17.70 22.67
510 17.78 22.65
510 18.38 23.42
520 17.67 22.61
520 17.75 22.58
520 18.34 23.35
530 17.64 22.54
530 17.71 22.53
530 18.30 23.28
540 17.61 22.48
540 17.67 22.46
540 18.24 23.20
550 17.57 22.42
550 17.63 22.39
550 18.20 23.13
560 17.53 22.33
560 17.59 22.32
560 18.16 23.06
570 17.48 22.27
570 17.55 22.25
570 18.12 22.98
580 17.44 22.21
580 17.51 22.20
580 18.08 22.93
590 17.40 22.15
590 17.46 22.13
590 18.03 22.85
600 17.35 22.08
600 17.43 22.07
600 17.99 22.77
610 17.32 22.02
610 17.38 22.02
610 17.95 22.71
620 17.28 21.97
620 17.36 21.96
620 17.92 22.65
630 17.24 21.91
630 17.32 21.91
630 17.88 22.58
640 17.22 21.86
640 17.28 21.86
640 17.84 22.51
650 17.18 21.83
650 17.25 21.81
650 17.82 22.47
660 17.14 21.76
660 17.22 21.76
660 17.78 22.42
670 17.09 21.72
670 17.18 21.72
670 17.75 22.34
680 17.06 21.67
680 17.17 21.69
680 17.70 22.30
690 17.03 21.62
690 17.12 21.62
690 17.68 22.26
700 17.01 21.58
700 17.10 21.61
700 17.64 22.20
710 16.98 21.53
710 17.06 21.55
710 17.62 22.14
720 16.93 21.49
720 17.02 21.52
720 17.58 22.11
730 16.90 21.46
730 17.00 21.49
730 17.54 22.06
740 16.87 21.42
740 16.98 21.46
740 17.52 22.02
750 16.84 21.38
750 16.93 21.42
750 17.49 21.97
760 16.81 21.35
760 16.91 21.40
760 17.46 21.94
770 16.78 21.31
770 16.86 21.36
770 17.43 21.89
780 16.75 21.28
780 16.83 21.33
780 17.40 21.86
790 16.72 21.24
790 16.80 21.30
790 17.37 21.83

63
IEA SHC/ECES – Task 42/24 – Compact Thermal Energy Storage
800 16.68 21.23
800 16.78 21.28
800 17.34 21.78
810 16.65 21.19
810 16.74 21.25
810 17.31 21.77
820 16.62 21.17
820 16.72 21.23
820 17.29 21.73
830 16.60 21.13
830 16.69 21.20
830 17.27 21.69
840 16.58 21.12
840 16.66 21.17
840 17.23 21.67
850 16.56 21.09
850 16.65 21.15
850 17.20 21.64
860 16.53 21.06
860 16.63 21.14
860 17.17 21.60
870 16.51 21.04
870 16.60 21.12
870 17.14 21.57
880 16.48 21.02
880 16.58 21.09
880 17.12 21.54
890 16.44 20.99
890 16.54 21.08
890 17.09 21.52
900 16.42 20.97
900 16.53 21.04
900 17.07 21.50
910 16.40 20.97
910 16.50 21.04
910 17.04 21.48
920 16.38 20.94
920 16.45 21.00
920 17.01 21.44
930 16.35 20.92
930 16.44 20.98
930 17.00 21.42
940 16.34 20.90
940 16.41 20.98
940 16.96 21.40
950 16.32 20.88
950 16.39 20.96
950 16.95 21.37
960 16.30 20.88
960 16.38 20.95
960 16.91 21.35
970 16.26 20.87
970 16.35 20.94
970 16.89 21.33
980 16.24 20.87
980 16.33 20.94
980 16.86 21.29
990 16.22 20.84
990 16.31 20.93
990 16.84 21.28
1000 16.19 20.82
1000 16.29 20.90
1000 16.82 21.25
1010 16.18 20.81
1010 16.26 20.90
1010 16.80 21.24
1020 16.17 20.82
1020 16.24 20.88
1020 16.77 21.22
1030 16.15 20.80
1030 16.22 20.88
1030 16.74 21.21
1040 16.11 20.79
1040 16.21 20.87
1040 16.72 21.20
1050 16.11 20.80
1050 16.18 20.86
1050 16.70 21.19
1060 16.08 20.78
1060 16.18 20.85
1060 16.68 21.17
1070 16.05 20.77
1070 16.15 20.85
1070 16.64 21.17
1080 16.04 20.76
1080 16.14 20.84
1080 16.62 21.17
1090 16.03 20.75
1090 16.11 20.82
1090 16.61 21.16
1100 15.99 20.74
1100 16.08 20.82
1100 16.58 21.15
1110 15.99 20.76
1110 16.07 20.82
1110 16.56 21.15
1120 15.96 20.74
1120 16.06 20.81
1120 16.53 21.15
1130 15.95 20.73
1130 16.05 20.79
1130 16.52 21.13
1140 15.93 20.75
1140 16.01 20.79
1140 16.48 21.14
1150 15.91 20.72
1150 16.00 20.78
1150 16.47 21.13
1160 15.88 20.72
1160 15.98 20.77
1160 16.43 21.13
1170 15.86 20.71
1170 15.97 20.77
1170 16.44 21.12
1180 15.85 20.71
1180 15.95 20.76
1180 16.41 21.12
1190 15.82 20.71
1190 15.94 20.75
1190 16.40 21.12
1200 15.82 20.70
1200 15.92 20.74
1200 16.37 21.10
1210 15.79 20.69
1210 15.89 20.74
1210 16.34 21.10
1220 15.78 20.69
1220 15.88 20.73
1220 16.34 21.09
1230 15.74 20.69
1230 15.86 20.72
1230 16.30 21.07
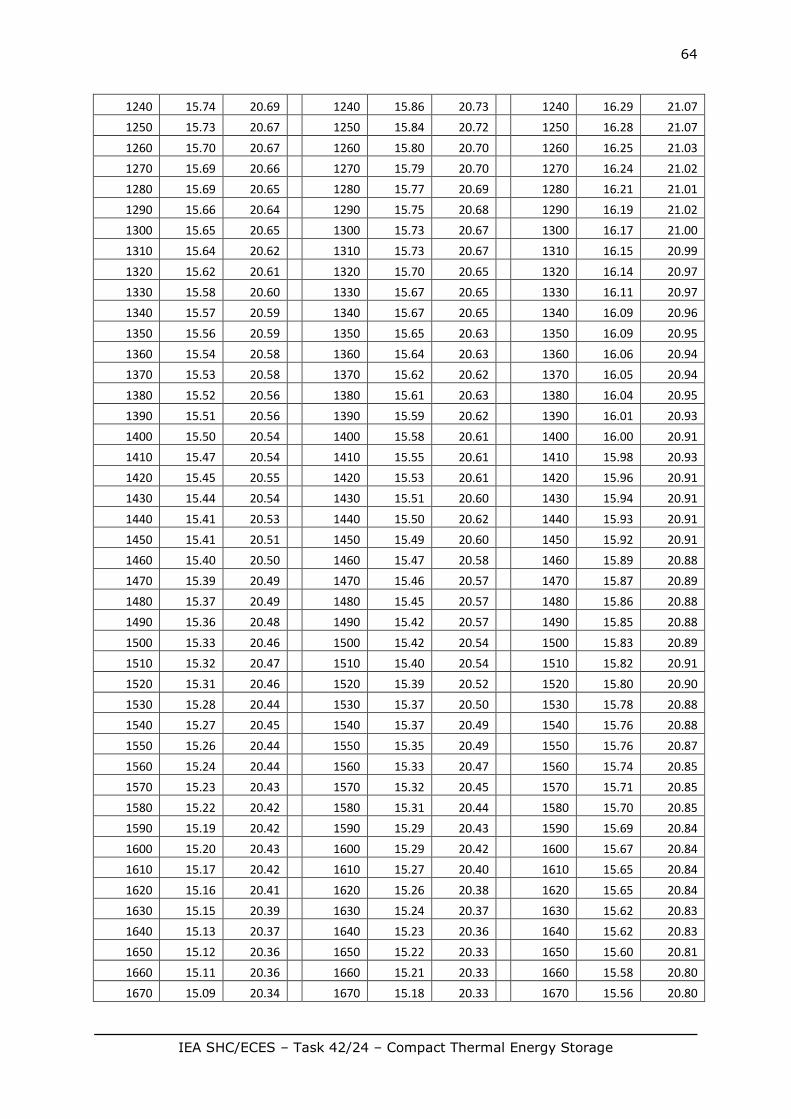
64
IEA SHC/ECES – Task 42/24 – Compact Thermal Energy Storage
1240 15.74 20.69
1240 15.86 20.73
1240 16.29 21.07
1250 15.73 20.67
1250 15.84 20.72
1250 16.28 21.07
1260 15.70 20.67
1260 15.80 20.70
1260 16.25 21.03
1270 15.69 20.66
1270 15.79 20.70
1270 16.24 21.02
1280 15.69 20.65
1280 15.77 20.69
1280 16.21 21.01
1290 15.66 20.64
1290 15.75 20.68
1290 16.19 21.02
1300 15.65 20.65
1300 15.73 20.67
1300 16.17 21.00
1310 15.64 20.62
1310 15.73 20.67
1310 16.15 20.99
1320 15.62 20.61
1320 15.70 20.65
1320 16.14 20.97
1330 15.58 20.60
1330 15.67 20.65
1330 16.11 20.97
1340 15.57 20.59
1340 15.67 20.65
1340 16.09 20.96
1350 15.56 20.59
1350 15.65 20.63
1350 16.09 20.95
1360 15.54 20.58
1360 15.64 20.63
1360 16.06 20.94
1370 15.53 20.58
1370 15.62 20.62
1370 16.05 20.94
1380 15.52 20.56
1380 15.61 20.63
1380 16.04 20.95
1390 15.51 20.56
1390 15.59 20.62
1390 16.01 20.93
1400 15.50 20.54
1400 15.58 20.61
1400 16.00 20.91
1410 15.47 20.54
1410 15.55 20.61
1410 15.98 20.93
1420 15.45 20.55
1420 15.53 20.61
1420 15.96 20.91
1430 15.44 20.54
1430 15.51 20.60
1430 15.94 20.91
1440 15.41 20.53
1440 15.50 20.62
1440 15.93 20.91
1450 15.41 20.51
1450 15.49 20.60
1450 15.92 20.91
1460 15.40 20.50
1460 15.47 20.58
1460 15.89 20.88
1470 15.39 20.49
1470 15.46 20.57
1470 15.87 20.89
1480 15.37 20.49
1480 15.45 20.57
1480 15.86 20.88
1490 15.36 20.48
1490 15.42 20.57
1490 15.85 20.88
1500 15.33 20.46
1500 15.42 20.54
1500 15.83 20.89
1510 15.32 20.47
1510 15.40 20.54
1510 15.82 20.91
1520 15.31 20.46
1520 15.39 20.52
1520 15.80 20.90
1530 15.28 20.44
1530 15.37 20.50
1530 15.78 20.88
1540 15.27 20.45
1540 15.37 20.49
1540 15.76 20.88
1550 15.26 20.44
1550 15.35 20.49
1550 15.76 20.87
1560 15.24 20.44
1560 15.33 20.47
1560 15.74 20.85
1570 15.23 20.43
1570 15.32 20.45
1570 15.71 20.85
1580 15.22 20.42
1580 15.31 20.44
1580 15.70 20.85
1590 15.19 20.42
1590 15.29 20.43
1590 15.69 20.84
1600 15.20 20.43
1600 15.29 20.42
1600 15.67 20.84
1610 15.17 20.42
1610 15.27 20.40
1610 15.65 20.84
1620 15.16 20.41
1620 15.26 20.38
1620 15.65 20.84
1630 15.15 20.39
1630 15.24 20.37
1630 15.62 20.83
1640 15.13 20.37
1640 15.23 20.36
1640 15.62 20.83
1650 15.12 20.36
1650 15.22 20.33
1650 15.60 20.81
1660 15.11 20.36
1660 15.21 20.33
1660 15.58 20.80
1670 15.09 20.34
1670 15.18 20.33
1670 15.56 20.80

65
IEA SHC/ECES – Task 42/24 – Compact Thermal Energy Storage
1680 15.08 20.33
1680 15.18 20.32
1680 15.55 20.78
1690 15.06 20.32
1690 15.16 20.31
1690 15.55 20.77
1700 15.06 20.29
1700 15.15 20.31
1700 15.53 20.75
1710 15.05 20.29
1710 15.13 20.28
1710 15.51 20.73
1720 15.04 20.27
1720 15.13 20.28
1720 15.49 20.73
1730 15.02 20.26
1730 15.12 20.26
1730 15.49 20.69
1740 15.01 20.24
1740 15.11 20.25
1740 15.48 20.69
1750 15.00 20.21
1750 15.11 20.25
1750 15.46 20.67
1760 14.99 20.21
1760 15.09 20.23
1760 15.46 20.64
1770 14.97 20.21
1770 15.06 20.21
1770 15.42 20.64
1780 14.96 20.18
1780 15.06 20.18
1780 15.42 20.63
1790 14.94 20.15
1790 15.06 20.17
1790 15.40 20.62
1800 14.94 20.14
1800 15.05 20.16
1800 15.40 20.61
1810 14.94 20.14
1810 15.03 20.16
1810 15.37 20.61
1820 14.91 20.11
1820 15.02 20.11
1820 15.36 20.59
1830 14.90 20.10
1830 15.00 20.09
1830 15.35 20.59
1840 14.89 20.09
1840 14.99 20.07
1840 15.34 20.59
1850 14.89 20.05
1850 14.99 20.06
1850 15.32 20.58
1860 14.88 20.05
1860 14.97 20.04
1860 15.31 20.56
1870 14.86 20.03
1870 14.95 20.03
1870 15.30 20.55
1880 14.84 20.01
1880 14.95 20.01
1880 15.29 20.52
1890 14.85 19.99
1890 14.93 19.99
1890 15.28 20.50
1900 14.84 19.97
1900 14.93 19.97
1900 15.26 20.50
1910 14.81 19.95
1910 14.91 19.97
1910 15.26 20.49
1920 14.81 19.93
1920 14.90 19.96
1920 15.25 20.47
1930 14.79 19.92
1930 14.89 19.93
1930 15.23 20.47
1940 14.79 19.90
1940 14.88 19.92
1940 15.22 20.46
1950 14.77 19.90
1950 14.86 19.89
1950 15.20 20.45
1960 14.75 19.87
1960 14.86 19.87
1960 15.19 20.43
1970 14.75 19.86
1970 14.85 19.86
1970 15.18 20.41
1980 14.73 19.84
1980 14.84 19.83
1980 15.16 20.41
1990 14.72 19.84
1990 14.81 19.80
1990 15.15 20.38
2000 14.72 19.83
2000 14.82 19.78
2000 15.14 20.38
2010 14.71 19.81
2010 14.79 19.77
2010 15.13 20.36
2020 14.69 19.79
2020 14.78 19.73
2020 15.12 20.34
2030 14.68 19.76
2030 14.78 19.70
2030 15.11 20.32
2040 14.68 19.75
2040 14.76 19.68
2040 15.11 20.29
2050 14.67 19.73
2050 14.76 19.66
2050 15.08 20.27
2060 14.66 19.71
2060 14.74 19.64
2060 15.07 20.24
2070 14.64 19.67
2070 14.74 19.60
2070 15.06 20.22
2080 14.64 19.66
2080 14.73 19.58
2080 15.05 20.18
2090 14.62 19.63
2090 14.71 19.55
2090 15.05 20.16
2100 14.62 19.61
2100 14.70 19.52
2100 15.03 20.14
2110 14.60 19.59
2110 14.69 19.50
2110 15.02 20.10

66
IEA SHC/ECES – Task 42/24 – Compact Thermal Energy Storage
2120 14.59 19.58
2120 14.68 19.49
2120 15.02 20.08
2130 14.58 19.56
2130 14.66 19.45
2130 15.00 20.06
2140 14.57 19.55
2140 14.66 19.43
2140 14.99 20.02
2150 14.56 19.52
2150 14.64 19.41
2150 14.98 19.99
2160 14.55 19.50
2160 14.63 19.38
2160 14.98 19.96
2170 14.54 19.48
2170 14.62 19.35
2170 14.96 19.94
2180 14.54 19.45
2180 14.61 19.34
2180 14.95 19.90
2190 14.52 19.42
2190 14.61 19.32
2190 14.94 19.88
2200 14.51 19.40
2200 14.60 19.29
2200 14.92 19.84
2210 14.50 19.37
2210 14.58 19.25
2210 14.91 19.80
2220 14.50 19.36
2220 14.58 19.22
2220 14.90 19.78
2230 14.48 19.34
2230 14.56 19.20
2230 14.89 19.74
2240 14.47 19.34
2240 14.55 19.17
2240 14.89 19.70
2250 14.46 19.31
2250 14.55 19.16
2250 14.87 19.67
2260 14.45 19.29
2260 14.54 19.13
2260 14.86 19.66
2270 14.44 19.26
2270 14.53 19.11
2270 14.85 19.63
2280 14.43 19.25
2280 14.51 19.06
2280 14.84 19.60
2290 14.42 19.21
2290 14.50 19.02
2290 14.83 19.56
2300 14.40 19.19
2300 14.50 19.03
2300 14.82 19.52
2310 14.41 19.16
2310 14.49 18.99
2310 14.82 19.50
2320 14.39 19.13
2320 14.49 18.97
2320 14.80 19.48
2330 14.39 19.11
2330 14.47 18.93
2330 14.80 19.45
2340 14.37 19.07
2340 14.46 18.92
2340 14.78 19.40
2350 14.37 19.05
2350 14.45 18.90
2350 14.78 19.38
2360 14.35 19.02
2360 14.43 18.86
2360 14.76 19.35
2370 14.34 19.00
2370 14.43 18.83
2370 14.76 19.31
2380 14.32 18.97
2380 14.41 18.80
2380 14.74 19.30
2390 14.31 18.95
2390 14.39 18.78
2390 14.73 19.26
2400 14.31 18.91
2400 14.39 18.74
2400 14.71 19.22
2410 14.31 18.90
2410 14.38 18.73
2410 14.70 19.20
2420 14.28 18.85
2420 14.37 18.70
2420 14.70 19.17
2430 14.28 18.83
2430 14.37 18.68
2430 14.70 19.16
2440 14.27 18.81
2440 14.36 18.65
2440 14.68 19.12
2450 14.26 18.77
2450 14.36 18.62
2450 14.67 19.09
2460 14.25 18.74
2460 14.35 18.60
2460 14.66 19.06
2470 14.25 18.73
2470 14.32 18.57
2470 14.66 19.04
2480 14.23 18.69
2480 14.31 18.54
2480 14.64 19.00
2490 14.22 18.66
2490 14.30 18.53
2490 14.64 18.98
2500 14.21 18.65
2500 14.31 18.49
2500 14.61 18.95
2510 14.21 18.61
2510 14.29 18.47
2510 14.61 18.92
2520 14.20 18.59
2520 14.28 18.43
2520 14.60 18.88
2530 14.20 18.57
2530 14.27 18.41
2530 14.60 18.85
2540 14.19 18.53
2540 14.26 18.39
2540 14.59 18.81
2550 14.18 18.51
2550 14.25 18.36
2550 14.58 18.78

67
IEA SHC/ECES – Task 42/24 – Compact Thermal Energy Storage
2560 14.17 18.49
2560 14.24 18.33
2560 14.56 18.75
2570 14.16 18.45
2570 14.23 18.31
2570 14.55 18.72
2580 14.16 18.43
2580 14.22 18.29
2580 14.54 18.69
2590 14.14 18.39
2590 14.21 18.25
2590 14.53 18.66
2600 14.15 18.37
2600 14.21 18.22
2600 14.52 18.63
2610 14.12 18.35
2610 14.18 18.18
2610 14.52 18.58
2620 14.13 18.31
2620 14.16 18.15
2620 14.50 18.56
2630 14.10 18.28
2630 14.18 18.14
2630 14.49 18.53
2640 14.09 18.26
2640 14.16 18.10
2640 14.48 18.50
2650 14.08 18.23
2650 14.15 18.08
2650 14.48 18.46
2660 14.08 18.21
2660 14.14 18.04
2660 14.46 18.44
2670 14.07 18.19
2670 14.14 18.02
2670 14.45 18.40
2680 14.06 18.16
2680 14.12 18.00
2680 14.43 18.38
2690 14.05 18.11
2690 14.11 17.97
2690 14.44 18.35
2700 14.05 18.10
2700 14.11 17.94
2700 14.42 18.32
2710 14.04 18.07
2710 14.10 17.92
2710 14.41 18.28
2720 14.04 18.06
2720 14.10 17.88
2720 14.40 18.26
2730 14.01 18.02
2730 14.07 17.85
2730 14.39 18.23
2740 14.01 17.99
2740 14.07 17.82
2740 14.38 18.20
2750 13.99 17.97
2750 14.05 17.79
2750 14.37 18.17
2760 13.99 17.93
2760 14.05 17.75
2760 14.37 18.14
2770 13.97 17.91
2770 14.04 17.73
2770 14.36 18.11
2780 13.98 17.89
2780 14.03 17.71
2780 14.34 18.07
2790 13.98 17.87
2790 14.03 17.68
2790 14.32 18.05
2800 13.96 17.83
2800 14.01 17.65
2800 14.32 18.01
2810 13.95 17.81
2810 14.00 17.63
2810 14.30 17.98
2820 13.94 17.78
2820 14.00 17.62
2820 14.30 17.95
2830 13.95 17.75
2830 13.99 17.57
2830 14.29 17.93
2840 13.93 17.72
2840 13.98 17.53
2840 14.28 17.90
2850 13.92 17.69
2850 13.96 17.51
2850 14.27 17.86
2860 13.92 17.67
2860 13.96 17.48
2860 14.26 17.83
2870 13.91 17.64
2870 13.95 17.47
2870 14.25 17.80
2880 13.89 17.63
2880 13.94 17.43
2880 14.24 17.78
2890 13.87 17.58
2890 13.94 17.40
2890 14.24 17.75
2900 13.88 17.56
2900 13.93 17.37
2900 14.22 17.72
2910 13.86 17.53
2910 13.92 17.35
2910 14.21 17.70
2920 13.85 17.50
2920 13.91 17.32
2920 14.20 17.64
2930 13.85 17.48
2930 13.90 17.29
2930 14.19 17.63
2940 13.84 17.45
2940 13.89 17.28
2940 14.18 17.60
2950 13.83 17.40
2950 13.88 17.24
2950 14.18 17.58
2960 13.84 17.39
2960 13.87 17.21
2960 14.16 17.54
2970 13.81 17.37
2970 13.85 17.19
2970 14.16 17.52
2980 13.81 17.34
2980 13.84 17.14
2980 14.14 17.49
2990 13.78 17.30
2990 13.85 17.11
2990 14.13 17.45

68
IEA SHC/ECES – Task 42/24 – Compact Thermal Energy Storage
3000 13.78 17.29
3000 13.83 17.10
3000 14.13 17.44
3010 13.78 17.25
3010 13.81 17.07
3010 14.13 17.40
3020 13.77 17.24
3020 13.80 17.04
3020 14.11 17.37
3030 13.76 17.19
3030 13.80 17.02
3030 14.09 17.33
3040 13.74 17.17
3040 13.80 16.99
3040 14.08 17.32
3050 13.73 17.15
3050 13.78 16.96
3050 14.08 17.28
3060 13.73 17.12
3060 13.79 16.94
3060 14.07 17.27
3070 13.71 17.10
3070 13.77 16.90
3070 14.06 17.23
3080 13.71 17.07
3080 13.76 16.88
3080 14.05 17.21
3090 13.69 17.05
3090 13.76 16.86
3090 14.04 17.18
3100 13.69 17.01
3100 13.74 16.83
3100 14.03 17.15
3110 13.68 16.99
3110 13.74 16.80
3110 14.02 17.12
3120 13.67 16.96
3120 13.73 16.77
3120 14.01 17.09
3130 13.66 16.94
3130 13.71 16.74
3130 14.00 17.06
3140 13.65 16.91
3140 13.70 16.72
3140 13.99 17.05
3150 13.64 16.88
3150 13.70 16.69
3150 13.98 17.01
3160 13.63 16.85
3160 13.68 16.67
3160 13.96 17.00
3170 13.62 16.82
3170 13.68 16.63
3170 13.96 16.96
3180 13.62 16.81
3180 13.68 16.63
3180 13.95 16.94
3190 13.60 16.77
3190 13.67 16.58
3190 13.95 16.91
3200 13.59 16.77
3200 13.65 16.56
3200 13.92 16.89
3210 13.58 16.72
3210 13.64 16.54
3210 13.91 16.85
3220 13.59 16.71
3220 13.64 16.52
3220 13.92 16.83
3230 13.57 16.67
3230 13.62 16.49
3230 13.90 16.80
3240 13.55 16.66
3240 13.61 16.44
3240 13.90 16.78
3250 13.55 16.64
3250 13.61 16.43
3250 13.88 16.76
3260 13.54 16.60
3260 13.59 16.40
3260 13.88 16.73
3270 13.54 16.58
3270 13.58 16.38
3270 13.86 16.69
3280 13.51 16.54
3280 13.57 16.36
3280 13.86 16.67
3290 13.51 16.51
3290 13.56 16.34
3290 13.83 16.65
3300 13.51 16.50
3300 13.56 16.31
3300 13.84 16.62
3310 13.50 16.47
3310 13.54 16.29
3310 13.83 16.59
3320 13.48 16.44
3320 13.54 16.25
3320 13.80 16.57
3330 13.49 16.42
3330 13.53 16.24
3330 13.82 16.55
3340 13.48 16.40
3340 13.50 16.21
3340 13.78 16.52
3350 13.45 16.37
3350 13.49 16.17
3350 13.79 16.50
3360 13.47 16.35
3360 13.48 16.16
3360 13.78 16.46
3370 13.45 16.33
3370 13.47 16.11
3370 13.77 16.45
3380 13.45 16.30
3380 13.47 16.10
3380 13.76 16.42
3390 13.43 16.27
3390 13.48 16.10
3390 13.74 16.40
3400 13.42 16.24
3400 13.46 16.06
3400 13.75 16.38
3410 13.41 16.22
3410 13.45 16.04
3410 13.73 16.35
3420 13.40 16.20
3420 13.43 16.01
3420 13.71 16.32
3430 13.40 16.17
3430 13.42 15.99
3430 13.71 16.30

69
IEA SHC/ECES – Task 42/24 – Compact Thermal Energy Storage
3440 13.38 16.14
3440 13.41 15.96
3440 13.69 16.27
3450 13.36 16.12
3450 13.41 15.94
3450 13.69 16.25
3460 13.35 16.10
3460 13.41 15.92
3460 13.68 16.22
3470 13.36 16.09
3470 13.39 15.89
3470 13.68 16.20
3480 13.35 16.04
3480 13.39 15.87
3480 13.65 16.17
3490 13.34 16.03
3490 13.38 15.85
3490 13.64 16.14
3500 13.33 15.99
3500 13.37 15.81
3500 13.64 16.13
3510 13.32 15.97
3510 13.36 15.79
3510 13.63 16.10
3520 13.31 15.93
3520 13.34 15.77
3520 13.62 16.08
3530 13.30 15.92
3530 13.35 15.74
3530 13.61 16.06
3540 13.29 15.90
3540 13.33 15.72
3540 13.61 16.03
3550 13.27 15.87
3550 13.31 15.68
3550 13.60 16.00
3560 13.27 15.85
3560 13.32 15.68
3560 13.60 15.99
3570 13.26 15.83
3570 13.30 15.64
3570 13.59 15.96
3580 13.24 15.81
3580 13.31 15.63
3580 13.55 15.93
3590 13.23 15.77
3590 13.29 15.59
3590 13.56 15.91
3600 13.23 15.75
3600 13.28 15.58
3600 13.54 15.89
3610 13.22 15.73
3610 13.27 15.55
3610 13.54 15.87
3620 13.21 15.71
3620 13.26 15.55
3620 13.53 15.84
3630 13.21 15.68
3630 13.25 15.50
3630 13.52 15.82
3640 13.19 15.67
3640 13.24 15.48
3640 13.51 15.80
3650 13.18 15.63
3650 13.22 15.46
3650 13.50 15.77
3660 13.17 15.60
3660 13.21 15.44
3660 13.50 15.75
3670 13.16 15.58
3670 13.22 15.41
3670 13.49 15.73
3680 13.17 15.55
3680 13.20 15.38
3680 13.47 15.71
3690 13.15 15.54
3690 13.20 15.36
3690 13.45 15.69
3700 13.14 15.51
3700 13.18 15.35
3700 13.45 15.66
3710 13.14 15.50
3710 13.17 15.34
3710 13.44 15.63
3720 13.13 15.48
3720 13.17 15.31
3720 13.44 15.61
3730 13.12 15.44
3730 13.15 15.28
3730 13.44 15.60
3740 13.11 15.43
3740 13.15 15.25
3740 13.42 15.57
3750 13.11 15.41
3750 13.15 15.25
3750 13.41 15.55
3760 13.09 15.38
3760 13.13 15.21
3760 13.40 15.52
3770 13.07 15.35
3770 13.13 15.19
3770 13.39 15.51
3780 13.08 15.35
3780 13.13 15.17
3780 13.39 15.48
3790 13.08 15.32
3790 13.11 15.15
3790 13.38 15.47
3800 13.05 15.31
3800 13.11 15.14
3800 13.37 15.44
3810 13.05 15.27
3810 13.09 15.12
3810 13.35 15.41
3820 13.03 15.25
3820 13.08 15.09
3820 13.35 15.40
3830 13.03 15.22
3830 13.07 15.07
3830 13.34 15.39
3840 13.02 15.20
3840 13.07 15.06
3840 13.33 15.36
3850 13.02 15.19
3850 13.06 15.04
3850 13.32 15.33
3860 13.02 15.16
3860 13.06 15.02
3860 13.31 15.32
3870 13.00 15.15
3870 13.30 15.30

70
IEA SHC/ECES – Task 42/24 – Compact Thermal Energy Storage
3880 12.99 15.11
3880 13.30 15.27
3890 12.99 15.11
3890 13.28 15.26
3900 12.98 15.09
3900 13.29 15.24
3910 12.96 15.06
3910 13.27 15.20
3920 12.95 15.05
3920 13.26 15.20
3930 12.95 15.02
3930 13.27 15.17
3940 13.23 15.15
3950 13.24 15.12
3960 13.23 15.12
3970 13.22 15.09
3980 13.21 15.08
3990 13.20 15.07
4000 13.19 15.04
4010 13.18 15.01

71
IEA SHC/ECES – Task 42/24 – Compact Thermal Energy Storage
Melting Process
Inlet T 32 °C Melting Run A
Melting Run B
Melting Run C
Time (s) Tfin (°C) Tpcm (°C)
Time (s) Tfin (°C)
Tpcm (°C)
Time (s) Tfin (°C)
Tpcm (°C)
0 22.87 15.08
0 23.01 14.99
0 22.50 15.05
10 22.94 15.18
10 23.12 15.12
10 22.62 15.17
20 23.02 15.30
20 23.20 15.22
20 22.72 15.26
30 23.09 15.42
30 23.28 15.34
30 22.84 15.35
40 23.17 15.54
40 23.35 15.45
40 22.95 15.46
50 23.24 15.65
50 23.44 15.56
50 23.05 15.57
60 23.32 15.77
60 23.51 15.68
60 23.15 15.68
70 23.38 15.89
70 23.56 15.78
70 23.25 15.78
80 23.46 15.98
80 23.64 15.90
80 23.36 15.87
90 23.51 16.10
90 23.71 16.00
90 23.43 15.99
100 23.58 16.22
100 23.78 16.13
100 23.51 16.08
110 23.63 16.31
110 23.84 16.22
110 23.58 16.19
120 23.69 16.42
120 23.91 16.32
120 23.68 16.30
130 23.74 16.53
130 23.97 16.42
130 23.74 16.39
140 23.80 16.63
140 24.02 16.52
140 23.81 16.48
150 23.86 16.73
150 24.08 16.62
150 23.88 16.57
160 23.91 16.83
160 24.13 16.71
160 23.94 16.69
170 23.96 16.93
170 24.19 16.83
170 24.01 16.79
180 24.01 17.03
180 24.23 16.91
180 24.08 16.87
190 24.06 17.11
190 24.27 16.99
190 24.13 16.98
200 24.11 17.21
200 24.33 17.09
200 24.20 17.05
210 24.15 17.30
210 24.39 17.19
210 24.26 17.15
220 24.20 17.40
220 24.44 17.28
220 24.33 17.25
230 24.23 17.49
230 24.49 17.36
230 24.37 17.34
240 24.29 17.58
240 24.52 17.44
240 24.43 17.43
250 24.33 17.66
250 24.56 17.52
250 24.48 17.52
260 24.39 17.75
260 24.61 17.62
260 24.54 17.61
270 24.42 17.83
270 24.66 17.71
270 24.58 17.69
280 24.46 17.92
280 24.70 17.78
280 24.62 17.77
290 24.49 18.01
290 24.75 17.88
290 24.67 17.86
300 24.54 18.08
300 24.78 17.95
300 24.71 17.94
310 24.58 18.16
310 24.83 18.02
310 24.77 18.02
320 24.61 18.22
320 24.86 18.10
320 24.82 18.11
330 24.65 18.32
330 24.90 18.18
330 24.86 18.18
340 24.68 18.39
340 24.95 18.25
340 24.91 18.26
350 24.71 18.46
350 24.98 18.34
350 24.95 18.35
360 24.76 18.54
360 25.03 18.41
360 24.99 18.42
370 24.80 18.61
370 25.06 18.48
370 25.04 18.50

72
IEA SHC/ECES – Task 42/24 – Compact Thermal Energy Storage
380 24.84 18.68
380 25.08 18.55
380 25.08 18.58
390 24.86 18.74
390 25.14 18.62
390 25.11 18.65
400 24.90 18.81
400 25.17 18.68
400 25.14 18.73
410 24.91 18.88
410 25.20 18.76
410 25.20 18.79
420 24.95 18.96
420 25.23 18.83
420 25.22 18.87
430 24.98 19.02
430 25.26 18.90
430 25.27 18.93
440 25.02 19.10
440 25.29 18.96
440 25.30 19.00
450 25.05 19.15
450 25.31 19.03
450 25.34 19.08
460 25.08 19.23
460 25.36 19.09
460 25.36 19.16
470 25.11 19.28
470 25.39 19.15
470 25.40 19.22
480 25.14 19.33
480 25.42 19.21
480 25.44 19.28
490 25.18 19.40
490 25.45 19.28
490 25.47 19.35
500 25.21 19.46
500 25.49 19.34
500 25.50 19.41
510 25.23 19.52
510 25.51 19.39
510 25.54 19.48
520 25.25 19.57
520 25.55 19.45
520 25.56 19.53
530 25.28 19.65
530 25.56 19.51
530 25.60 19.61
540 25.31 19.69
540 25.59 19.56
540 25.63 19.66
550 25.35 19.74
550 25.63 19.62
550 25.66 19.72
560 25.37 19.80
560 25.66 19.67
560 25.70 19.79
570 25.40 19.87
570 25.69 19.72
570 25.72 19.85
580 25.41 19.90
580 25.72 19.78
580 25.77 19.90
590 25.45 19.97
590 25.75 19.83
590 25.79 19.96
600 25.46 20.01
600 25.77 19.89
600 25.81 20.02
610 25.51 20.06
610 25.79 19.95
610 25.86 20.08
620 25.53 20.12
620 25.83 20.00
620 25.89 20.13
630 25.55 20.16
630 25.85 20.05
630 25.90 20.18
640 25.58 20.22
640 25.88 20.10
640 25.93 20.24
650 25.60 20.26
650 25.90 20.14
650 25.96 20.28
660 25.64 20.31
660 25.94 20.20
660 25.98 20.34
670 25.64 20.33
670 25.96 20.24
670 26.00 20.41
680 25.66 20.38
680 26.00 20.28
680 26.04 20.44
690 25.70 20.44
690 26.01 20.31
690 26.06 20.50
700 25.72 20.47
700 26.03 20.36
700 26.09 20.55
710 25.76 20.53
710 26.07 20.42
710 26.11 20.58
720 25.77 20.56
720 26.08 20.45
720 26.13 20.65
730 25.79 20.60
730 26.10 20.51
730 26.18 20.70
740 25.80 20.64
740 26.12 20.55
740 26.19 20.74
750 25.85 20.68
750 26.15 20.59
750 26.22 20.79
760 25.86 20.73
760 26.17 20.63
760 26.23 20.84
770 25.88 20.78
770 26.21 20.68
770 26.28 20.90
780 25.91 20.80
780 26.22 20.72
780 26.30 20.93
790 25.92 20.84
790 26.24 20.76
790 26.32 20.98
800 25.94 20.89
800 26.26 20.81
800 26.33 21.02
810 25.97 20.92
810 26.29 20.83
810 26.36 21.05

73
IEA SHC/ECES – Task 42/24 – Compact Thermal Energy Storage
820 25.99 20.96
820 26.31 20.87
820 26.38 21.10
830 26.02 21.00
830 26.33 20.91
830 26.41 21.16
840 26.02 21.03
840 26.36 20.94
840 26.43 21.18
850 26.05 21.06
850 26.38 20.98
850 26.46 21.23
860 26.07 21.09
860 26.40 21.02
860 26.48 21.26
870 26.08 21.12
870 26.42 21.06
870 26.50 21.32
880 26.10 21.15
880 26.44 21.08
880 26.52 21.34
890 26.14 21.19
890 26.46 21.13
890 26.55 21.38
900 26.15 21.23
900 26.48 21.16
900 26.56 21.43
910 26.18 21.24
910 26.50 21.20
910 26.58 21.46
920 26.19 21.28
920 26.52 21.23
920 26.61 21.48
930 26.21 21.31
930 26.54 21.27
930 26.64 21.53
940 26.22 21.33
940 26.56 21.28
940 26.65 21.57
950 26.25 21.36
950 26.57 21.32
950 26.68 21.61
960 26.25 21.40
960 26.60 21.36
960 26.69 21.64
970 26.29 21.42
970 26.62 21.40
970 26.71 21.68
980 26.31 21.45
980 26.63 21.42
980 26.73 21.71
990 26.34 21.48
990 26.65 21.46
990 26.75 21.73
1000 26.35 21.50
1000 26.67 21.48
1000 26.77 21.77
1010 26.37 21.52
1010 26.70 21.50
1010 26.78 21.80
1020 26.38 21.54
1020 26.71 21.54
1020 26.81 21.84
1030 26.40 21.57
1030 26.73 21.57
1030 26.83 21.86
1040 26.42 21.60
1040 26.75 21.60
1040 26.84 21.90
1050 26.44 21.61
1050 26.76 21.62
1050 26.86 21.93
1060 26.45 21.64
1060 26.79 21.66
1060 26.89 21.98
1070 26.47 21.65
1070 26.80 21.67
1070 26.91 22.00
1080 26.49 21.67
1080 26.82 21.71
1080 26.93 22.02
1090 26.50 21.69
1090 26.83 21.73
1090 26.94 22.06
1100 26.53 21.72
1100 26.85 21.75
1100 26.97 22.09
1110 26.54 21.74
1110 26.89 21.80
1110 26.99 22.11
1120 26.55 21.75
1120 26.89 21.81
1120 26.99 22.14
1130 26.57 21.78
1130 26.92 21.84
1130 27.01 22.17
1140 26.58 21.80
1140 26.92 21.87
1140 27.02 22.19
1150 26.61 21.82
1150 26.95 21.88
1150 27.04 22.21
1160 26.63 21.83
1160 26.97 21.90
1160 27.07 22.24
1170 26.65 21.86
1170 26.98 21.92
1170 27.08 22.28
1180 26.66 21.87
1180 26.99 21.95
1180 27.10 22.30
1190 26.67 21.90
1190 27.01 21.99
1190 27.11 22.33
1200 26.69 21.90
1200 27.02 22.00
1200 27.13 22.34
1210 26.71 21.91
1210 27.05 22.03
1210 27.14 22.37
1220 26.74 21.95
1220 27.07 22.03
1220 27.16 22.41
1230 26.75 21.94
1230 27.08 22.06
1230 27.18 22.43
1240 26.75 21.96
1240 27.09 22.09
1240 27.19 22.44
1250 26.79 21.98
1250 27.11 22.10
1250 27.21 22.46

74
IEA SHC/ECES – Task 42/24 – Compact Thermal Energy Storage
1260 26.80 22.01
1260 27.13 22.14
1260 27.22 22.49
1270 26.80 22.00
1270 27.14 22.16
1270 27.24 22.52
1280 26.83 22.03
1280 27.15 22.16
1280 27.26 22.54
1290 26.84 22.04
1290 27.17 22.19
1290 27.26 22.56
1300 26.86 22.06
1300 27.19 22.21
1300 27.30 22.59
1310 26.86 22.07
1310 27.20 22.23
1310 27.31 22.61
1320 26.89 22.09
1320 27.22 22.25
1320 27.33 22.64
1330 26.90 22.11
1330 27.24 22.27
1330 27.34 22.66
1340 26.92 22.12
1340 27.25 22.29
1340 27.35 22.68
1350 26.93 22.13
1350 27.27 22.31
1350 27.36 22.71
1360 26.94 22.16
1360 27.26 22.33
1360 27.37 22.74
1370 26.97 22.17
1370 27.30 22.35
1370 27.40 22.76
1380 26.98 22.18
1380 27.31 22.38
1380 27.41 22.78
1390 26.99 22.19
1390 27.32 22.39
1390 27.43 22.80
1400 27.00 22.20
1400 27.33 22.40
1400 27.45 22.83
1410 27.02 22.24
1410 27.36 22.43
1410 27.45 22.84
1420 27.03 22.24
1420 27.37 22.44
1420 27.46 22.86
1430 27.05 22.25
1430 27.38 22.46
1430 27.47 22.89
1440 27.06 22.27
1440 27.40 22.48
1440 27.50 22.91
1450 27.08 22.28
1450 27.41 22.51
1450 27.50 22.94
1460 27.09 22.30
1460 27.43 22.53
1460 27.53 22.96
1470 27.10 22.31
1470 27.44 22.54
1470 27.53 22.97
1480 27.12 22.32
1480 27.47 22.56
1480 27.56 22.99
1490 27.14 22.33
1490 27.47 22.57
1490 27.56 23.02
1500 27.14 22.36
1500 27.49 22.60
1500 27.57 23.04
1510 27.15 22.37
1510 27.49 22.61
1510 27.59 23.07
1520 27.17 22.38
1520 27.51 22.64
1520 27.60 23.08
1530 27.19 22.40
1530 27.52 22.66
1530 27.62 23.11
1540 27.20 22.41
1540 27.54 22.69
1540 27.63 23.14
1550 27.21 22.41
1550 27.55 22.70
1550 27.64 23.13
1560 27.23 22.45
1560 27.56 22.72
1560 27.66 23.17
1570 27.23 22.45
1570 27.58 22.72
1570 27.66 23.17
1580 27.27 22.46
1580 27.60 22.74
1580 27.68 23.19
1590 27.26 22.48
1590 27.61 22.77
1590 27.70 23.22
1600 27.28 22.50
1600 27.62 22.78
1600 27.71 23.24
1610 27.31 22.51
1610 27.63 22.80
1610 27.71 23.27
1620 27.34 22.53
1620 27.65 22.83
1620 27.73 23.27
1630 27.34 22.54
1630 27.66 22.85
1630 27.75 23.30
1640 27.35 22.56
1640 27.67 22.86
1640 27.77 23.33
1650 27.36 22.57
1650 27.68 22.88
1650 27.77 23.34
1660 27.38 22.59
1660 27.70 22.90
1660 27.79 23.36
1670 27.39 22.61
1670 27.72 22.93
1670 27.80 23.38
1680 27.39 22.60
1680 27.72 22.93
1680 27.80 23.40
1690 27.41 22.63
1690 27.75 22.97
1690 27.82 23.42

75
IEA SHC/ECES – Task 42/24 – Compact Thermal Energy Storage
1700 27.44 22.66
1700 27.74 22.97
1700 27.84 23.45
1710 27.45 22.67
1710 27.76 22.99
1710 27.85 23.45
1720 27.46 22.68
1720 27.77 23.01
1720 27.86 23.47
1730 27.46 22.69
1730 27.78 23.03
1730 27.88 23.49
1740 27.47 22.71
1740 27.80 23.06
1740 27.88 23.51
1750 27.48 22.72
1750 27.81 23.07
1750 27.89 23.54
1760 27.50 22.74
1760 27.82 23.09
1760 27.90 23.55
1770 27.51 22.75
1770 27.83 23.11
1770 27.92 23.57
1780 27.52 22.79
1780 27.85 23.13
1780 27.94 23.59
1790 27.53 22.79
1790 27.85 23.14
1790 27.95 23.61
1800 27.55 22.80
1800 27.86 23.17
1800 27.95 23.63
1810 27.57 22.82
1810 27.89 23.20
1810 27.97 23.64
1820 27.57 22.83
1820 27.91 23.21
1820 27.98 23.66
1830 27.59 22.85
1830 27.91 23.22
1830 27.99 23.67
1840 27.59 22.86
1840 27.92 23.24
1840 28.01 23.68
1850 27.61 22.88
1850 27.93 23.26
1850 28.01 23.72
1860 27.61 22.89
1860 27.95 23.29
1860 28.03 23.74
1870 27.63 22.91
1870 27.95 23.30
1870 28.03 23.75
1880 27.65 22.93
1880 27.96 23.32
1880 28.04 23.77
1890 27.67 22.95
1890 27.98 23.34
1890 28.06 23.79
1900 27.66 22.96
1900 28.00 23.36
1900 28.07 23.79
1910 27.68 22.98
1910 28.00 23.38
1910 28.08 23.81
1920 27.70 23.00
1920 28.02 23.40
1920 28.11 23.84
1930 27.70 23.00
1930 28.03 23.40
1930 28.11 23.86
1940 27.72 23.03
1940 28.04 23.44
1940 28.13 23.88
1950 27.72 23.03
1950 28.05 23.44
1950 28.12 23.88
1960 27.73 23.05
1960 28.05 23.46
1960 28.14 23.91
1970 27.75 23.08
1970 28.07 23.48
1970 28.14 23.92
1980 27.75 23.09
1980 28.08 23.50
1980 28.16 23.94
1990 27.76 23.11
1990 28.09 23.52
1990 28.16 23.95
2000 27.78 23.13
2000 28.11 23.54
2000 28.18 23.99
2010 27.79 23.13
2010 28.11 23.55
2010 28.19 23.99
2020 27.80 23.16
2020 28.12 23.56
2020 28.21 24.01
2030 27.81 23.19
2030 28.13 23.60
2030 28.22 24.03
2040 27.82 23.19
2040 28.14 23.61
2040 28.22 24.05
2050 27.83 23.21
2050 28.16 23.62
2050 28.23 24.07
2060 27.84 23.22
2060 28.18 23.66
2060 28.24 24.08
2070 27.86 23.25
2070 28.18 23.66
2070 28.26 24.09
2080 27.86 23.25
2080 28.19 23.68
2080 28.26 24.10
2090 27.87 23.27
2090 28.21 23.70
2090 28.26 24.12
2100 27.88 23.30
2100 28.20 23.73
2100 28.29 24.15
2110 27.89 23.29
2110 28.22 23.74
2110 28.29 24.15
2120 27.90 23.33
2120 28.23 23.76
2120 28.31 24.18
2130 27.91 23.33
2130 28.24 23.77
2130 28.31 24.18
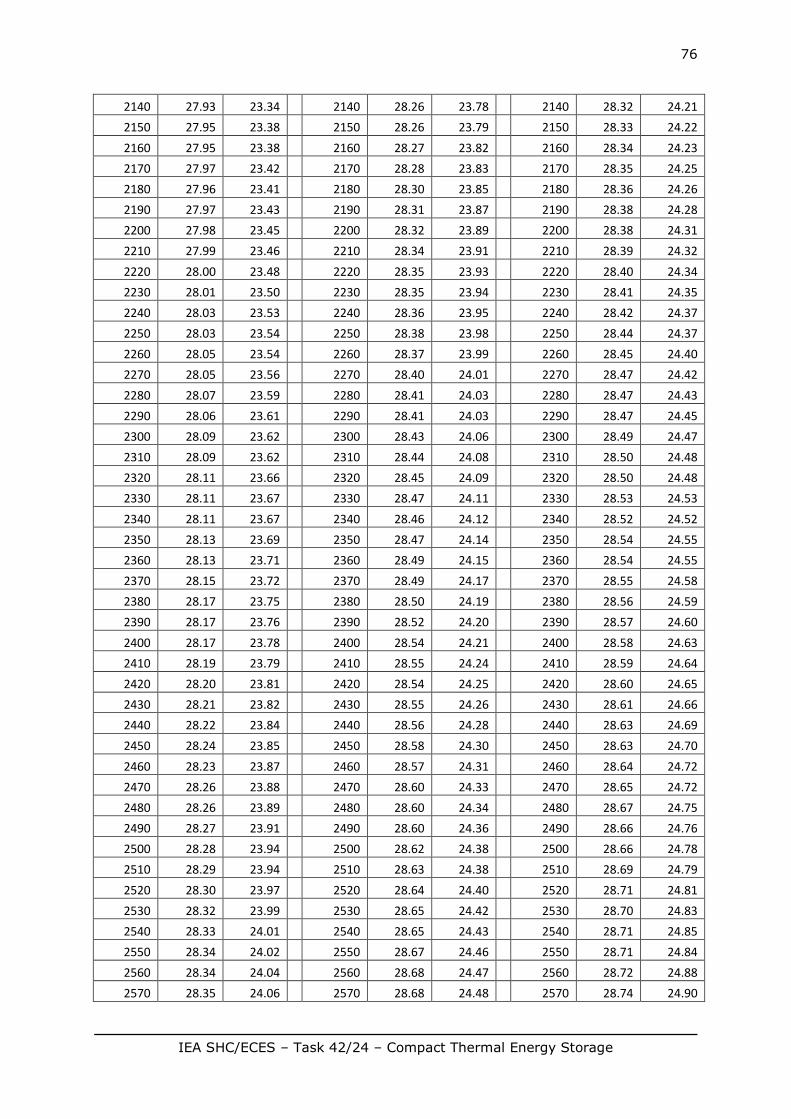
76
IEA SHC/ECES – Task 42/24 – Compact Thermal Energy Storage
2140 27.93 23.34
2140 28.26 23.78
2140 28.32 24.21
2150 27.95 23.38
2150 28.26 23.79
2150 28.33 24.22
2160 27.95 23.38
2160 28.27 23.82
2160 28.34 24.23
2170 27.97 23.42
2170 28.28 23.83
2170 28.35 24.25
2180 27.96 23.41
2180 28.30 23.85
2180 28.36 24.26
2190 27.97 23.43
2190 28.31 23.87
2190 28.38 24.28
2200 27.98 23.45
2200 28.32 23.89
2200 28.38 24.31
2210 27.99 23.46
2210 28.34 23.91
2210 28.39 24.32
2220 28.00 23.48
2220 28.35 23.93
2220 28.40 24.34
2230 28.01 23.50
2230 28.35 23.94
2230 28.41 24.35
2240 28.03 23.53
2240 28.36 23.95
2240 28.42 24.37
2250 28.03 23.54
2250 28.38 23.98
2250 28.44 24.37
2260 28.05 23.54
2260 28.37 23.99
2260 28.45 24.40
2270 28.05 23.56
2270 28.40 24.01
2270 28.47 24.42
2280 28.07 23.59
2280 28.41 24.03
2280 28.47 24.43
2290 28.06 23.61
2290 28.41 24.03
2290 28.47 24.45
2300 28.09 23.62
2300 28.43 24.06
2300 28.49 24.47
2310 28.09 23.62
2310 28.44 24.08
2310 28.50 24.48
2320 28.11 23.66
2320 28.45 24.09
2320 28.50 24.48
2330 28.11 23.67
2330 28.47 24.11
2330 28.53 24.53
2340 28.11 23.67
2340 28.46 24.12
2340 28.52 24.52
2350 28.13 23.69
2350 28.47 24.14
2350 28.54 24.55
2360 28.13 23.71
2360 28.49 24.15
2360 28.54 24.55
2370 28.15 23.72
2370 28.49 24.17
2370 28.55 24.58
2380 28.17 23.75
2380 28.50 24.19
2380 28.56 24.59
2390 28.17 23.76
2390 28.52 24.20
2390 28.57 24.60
2400 28.17 23.78
2400 28.54 24.21
2400 28.58 24.63
2410 28.19 23.79
2410 28.55 24.24
2410 28.59 24.64
2420 28.20 23.81
2420 28.54 24.25
2420 28.60 24.65
2430 28.21 23.82
2430 28.55 24.26
2430 28.61 24.66
2440 28.22 23.84
2440 28.56 24.28
2440 28.63 24.69
2450 28.24 23.85
2450 28.58 24.30
2450 28.63 24.70
2460 28.23 23.87
2460 28.57 24.31
2460 28.64 24.72
2470 28.26 23.88
2470 28.60 24.33
2470 28.65 24.72
2480 28.26 23.89
2480 28.60 24.34
2480 28.67 24.75
2490 28.27 23.91
2490 28.60 24.36
2490 28.66 24.76
2500 28.28 23.94
2500 28.62 24.38
2500 28.66 24.78
2510 28.29 23.94
2510 28.63 24.38
2510 28.69 24.79
2520 28.30 23.97
2520 28.64 24.40
2520 28.71 24.81
2530 28.32 23.99
2530 28.65 24.42
2530 28.70 24.83
2540 28.33 24.01
2540 28.65 24.43
2540 28.71 24.85
2550 28.34 24.02
2550 28.67 24.46
2550 28.71 24.84
2560 28.34 24.04
2560 28.68 24.47
2560 28.72 24.88
2570 28.35 24.06
2570 28.68 24.48
2570 28.74 24.90

77
IEA SHC/ECES – Task 42/24 – Compact Thermal Energy Storage
2580 28.34 24.07
2580 28.70 24.51
2580 28.76 24.91
2590 28.37 24.09
2590 28.70 24.52
2590 28.77 24.92
2600 28.36 24.09
2600 28.71 24.53
2600 28.78 24.94
2610 28.39 24.12
2610 28.73 24.56
2610 28.79 24.97
2620 28.41 24.13
2620 28.73 24.56
2620 28.79 24.98
2630 28.40 24.15
2630 28.75 24.59
2630 28.80 24.99
2640 28.41 24.17
2640 28.77 24.61
2640 28.81 25.01
2650 28.42 24.18
2650 28.76 24.61
2650 28.82 25.03
2660 28.44 24.21
2660 28.76 24.64
2660 28.83 25.03
2670 28.43 24.21
2670 28.79 24.65
2670 28.83 25.06
2680 28.45 24.23
2680 28.79 24.68
2680 28.85 25.07
2690 28.46 24.24
2690 28.81 24.67
2690 28.86 25.09
2700 28.46 24.26
2700 28.81 24.71
2700 28.87 25.11
2710 28.48 24.28
2710 28.82 24.72
2710 28.88 25.12
2720 28.49 24.29
2720 28.84 24.73
2720 28.89 25.14
2730 28.49 24.31
2730 28.84 24.76
2730 28.90 25.15
2740 28.50 24.32
2740 28.85 24.77
2740 28.91 25.17
2750 28.51 24.34
2750 28.86 24.78
2750 28.92 25.21
2760 28.52 24.35
2760 28.86 24.80
2760 28.94 25.22
2770 28.53 24.37
2770 28.87 24.81
2770 28.94 25.23
2780 28.54 24.38
2780 28.88 24.83
2780 28.94 25.24
2790 28.55 24.42
2790 28.89 24.85
2790 28.95 25.26
2800 28.55 24.41
2800 28.91 24.86
2800 28.97 25.29
2810 28.56 24.43
2810 28.91 24.88
2810 28.98 25.29
2820 28.57 24.45
2820 28.92 24.92
2820 28.98 25.33
2830 28.58 24.47
2830 28.94 24.92
2830 28.98 25.34
2840 28.58 24.47
2840 28.94 24.94
2840 29.00 25.36
2850 28.60 24.50
2850 28.94 24.95
2850 29.00 25.37
2860 28.61 24.52
2860 28.96 24.97
2860 29.01 25.39
2870 28.62 24.53
2870 28.96 24.98
2870 29.01 25.40
2880 28.64 24.56
2880 28.98 25.01
2880 29.03 25.43
2890 28.64 24.55
2890 28.97 25.04
2890 29.04 25.45
2900 28.64 24.58
2900 29.00 25.04
2900 29.05 25.46
2910 28.66 24.60
2910 29.00 25.07
2910 29.05 25.48
2920 28.66 24.62
2920 29.02 25.09
2920 29.07 25.50
2930 28.67 24.63
2930 29.02 25.11
2930 29.08 25.52
2940 28.68 24.65
2940 29.03 25.11
2940 29.09 25.54
2950 28.69 24.68
2950 29.04 25.12
2950 29.10 25.56
2960 28.70 24.67
2960 29.04 25.14
2960 29.10 25.58
2970 28.71 24.69
2970 29.07 25.17
2970 29.11 25.61
2980 28.71 24.71
2980 29.05 25.18
2980 29.12 25.60
2990 28.71 24.73
2990 29.06 25.20
2990 29.12 25.63
3000 28.74 24.75
3000 29.07 25.22
3000 29.12 25.66
3010 28.74 24.75
3010 29.08 25.23
3010 29.14 25.68

78
IEA SHC/ECES – Task 42/24 – Compact Thermal Energy Storage
3020 28.75 24.78
3020 29.09 25.26
3020 29.15 25.70
3030 28.75 24.79
3030 29.10 25.26
3030 29.15 25.71
3040 28.79 24.80
3040 29.12 25.29
3040 29.18 25.74
3050 28.78 24.83
3050 29.13 25.31
3050 29.18 25.76
3060 28.80 24.85
3060 29.13 25.32
3060 29.19 25.76
3070 28.79 24.86
3070 29.13 25.33
3070 29.20 25.79
3080 28.80 24.87
3080 29.15 25.36
3080 29.21 25.81
3090 28.81 24.89
3090 29.15 25.37
3090 29.22 25.82
3100 28.83 24.91
3100 29.16 25.39
3100 29.22 25.86
3110 28.83 24.94
3110 29.16 25.41
3110 29.24 25.87
3120 28.84 24.96
3120 29.18 25.44
3120 29.24 25.90
3130 28.84 24.97
3130 29.18 25.46
3130 29.25 25.91
3140 28.85 24.98
3140 29.19 25.47
3140 29.25 25.94
3150 28.88 25.00
3150 29.20 25.49
3150 29.27 25.96
3160 28.87 25.01
3160 29.21 25.52
3160 29.28 25.98
3170 28.88 25.03
3170 29.23 25.53
3170 29.28 26.00
3180 28.89 25.05
3180 29.23 25.56
3180 29.30 26.03
3190 28.90 25.06
3190 29.24 25.57
3190 29.31 26.05
3200 28.91 25.09
3200 29.24 25.59
3200 29.32 26.06
3210 28.92 25.10
3210 29.25 25.61
3210 29.33 26.08
3220 28.93 25.11
3220 29.27 25.62
3220 29.32 26.12
3230 28.94 25.14
3230 29.27 25.64
3230 29.34 26.14
3240 28.95 25.15
3240 29.29 25.67
3240 29.34 26.15
3250 28.96 25.17
3250 29.29 25.68
3250 29.34 26.17
3260 28.97 25.18
3260 29.30 25.71
3260 29.36 26.19
3270 28.97 25.21
3270 29.29 25.73
3270 29.37 26.22
3280 28.98 25.23
3280 29.32 25.75
3280 29.38 26.25
3290 29.00 25.26
3290 29.31 25.78
3290 29.39 26.26
3300 29.00 25.26
3300 29.33 25.81
3300 29.40 26.29
3310 29.00 25.28
3310 29.34 25.82
3310 29.41 26.31
3320 29.01 25.31
3320 29.35 25.84
3320 29.40 26.33
3330 29.04 25.33
3330 29.35 25.87
3330 29.41 26.37
3340 29.04 25.34
3340 29.37 25.89
3340 29.43 26.39
3350 29.04 25.36
3350 29.38 25.91
3350 29.43 26.40
3360 29.05 25.38
3360 29.38 25.94
3360 29.43 26.43
3370 29.06 25.40
3370 29.39 25.95
3370 29.45 26.45
3380 29.06 25.42
3380 29.39 25.98
3380 29.46 26.48
3390 29.08 25.45
3390 29.42 26.01
3390 29.47 26.51
3400 29.08 25.45
3400 29.42 26.03
3400 29.48 26.53
3410 29.10 25.47
3410 29.42 26.05
3410 29.48 26.56
3420 29.09 25.50
3420 29.42 26.07
3420 29.50 26.59
3430 29.11 25.52
3430 29.43 26.09
3430 29.51 26.62
3440 29.10 25.53
3440 29.45 26.12
3440 29.53 26.65
3450 29.13 25.55
3450 29.45 26.14
3450 29.51 26.66
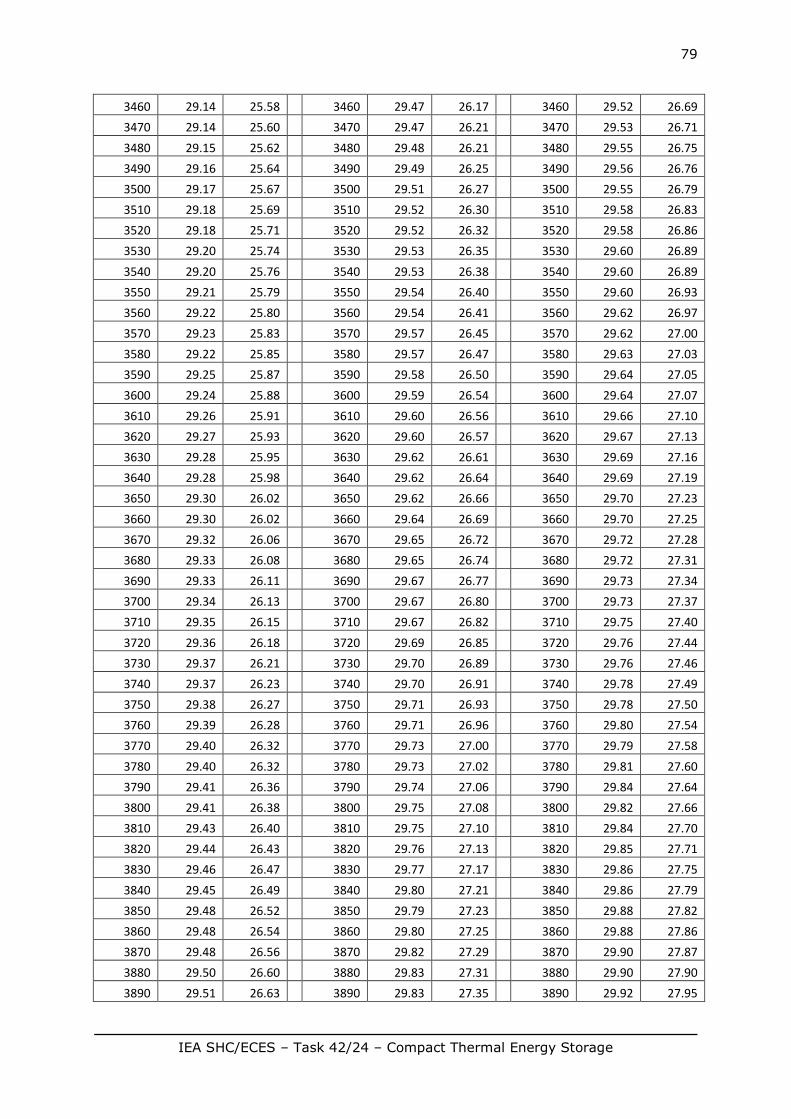
79
IEA SHC/ECES – Task 42/24 – Compact Thermal Energy Storage
3460 29.14 25.58
3460 29.47 26.17
3460 29.52 26.69
3470 29.14 25.60
3470 29.47 26.21
3470 29.53 26.71
3480 29.15 25.62
3480 29.48 26.21
3480 29.55 26.75
3490 29.16 25.64
3490 29.49 26.25
3490 29.56 26.76
3500 29.17 25.67
3500 29.51 26.27
3500 29.55 26.79
3510 29.18 25.69
3510 29.52 26.30
3510 29.58 26.83
3520 29.18 25.71
3520 29.52 26.32
3520 29.58 26.86
3530 29.20 25.74
3530 29.53 26.35
3530 29.60 26.89
3540 29.20 25.76
3540 29.53 26.38
3540 29.60 26.89
3550 29.21 25.79
3550 29.54 26.40
3550 29.60 26.93
3560 29.22 25.80
3560 29.54 26.41
3560 29.62 26.97
3570 29.23 25.83
3570 29.57 26.45
3570 29.62 27.00
3580 29.22 25.85
3580 29.57 26.47
3580 29.63 27.03
3590 29.25 25.87
3590 29.58 26.50
3590 29.64 27.05
3600 29.24 25.88
3600 29.59 26.54
3600 29.64 27.07
3610 29.26 25.91
3610 29.60 26.56
3610 29.66 27.10
3620 29.27 25.93
3620 29.60 26.57
3620 29.67 27.13
3630 29.28 25.95
3630 29.62 26.61
3630 29.69 27.16
3640 29.28 25.98
3640 29.62 26.64
3640 29.69 27.19
3650 29.30 26.02
3650 29.62 26.66
3650 29.70 27.23
3660 29.30 26.02
3660 29.64 26.69
3660 29.70 27.25
3670 29.32 26.06
3670 29.65 26.72
3670 29.72 27.28
3680 29.33 26.08
3680 29.65 26.74
3680 29.72 27.31
3690 29.33 26.11
3690 29.67 26.77
3690 29.73 27.34
3700 29.34 26.13
3700 29.67 26.80
3700 29.73 27.37
3710 29.35 26.15
3710 29.67 26.82
3710 29.75 27.40
3720 29.36 26.18
3720 29.69 26.85
3720 29.76 27.44
3730 29.37 26.21
3730 29.70 26.89
3730 29.76 27.46
3740 29.37 26.23
3740 29.70 26.91
3740 29.78 27.49
3750 29.38 26.27
3750 29.71 26.93
3750 29.78 27.50
3760 29.39 26.28
3760 29.71 26.96
3760 29.80 27.54
3770 29.40 26.32
3770 29.73 27.00
3770 29.79 27.58
3780 29.40 26.32
3780 29.73 27.02
3780 29.81 27.60
3790 29.41 26.36
3790 29.74 27.06
3790 29.84 27.64
3800 29.41 26.38
3800 29.75 27.08
3800 29.82 27.66
3810 29.43 26.40
3810 29.75 27.10
3810 29.84 27.70
3820 29.44 26.43
3820 29.76 27.13
3820 29.85 27.71
3830 29.46 26.47
3830 29.77 27.17
3830 29.86 27.75
3840 29.45 26.49
3840 29.80 27.21
3840 29.86 27.79
3850 29.48 26.52
3850 29.79 27.23
3850 29.88 27.82
3860 29.48 26.54
3860 29.80 27.25
3860 29.88 27.86
3870 29.48 26.56
3870 29.82 27.29
3870 29.90 27.87
3880 29.50 26.60
3880 29.83 27.31
3880 29.90 27.90
3890 29.51 26.63
3890 29.83 27.35
3890 29.92 27.95
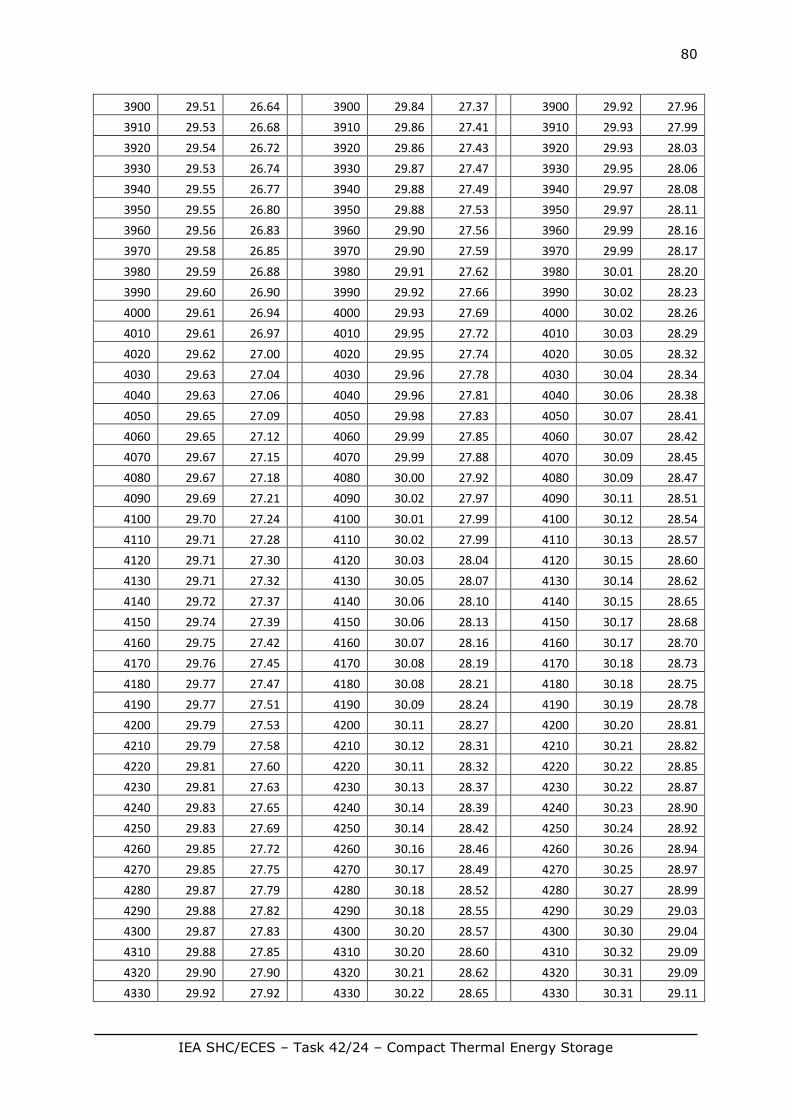
80
IEA SHC/ECES – Task 42/24 – Compact Thermal Energy Storage
3900 29.51 26.64
3900 29.84 27.37
3900 29.92 27.96
3910 29.53 26.68
3910 29.86 27.41
3910 29.93 27.99
3920 29.54 26.72
3920 29.86 27.43
3920 29.93 28.03
3930 29.53 26.74
3930 29.87 27.47
3930 29.95 28.06
3940 29.55 26.77
3940 29.88 27.49
3940 29.97 28.08
3950 29.55 26.80
3950 29.88 27.53
3950 29.97 28.11
3960 29.56 26.83
3960 29.90 27.56
3960 29.99 28.16
3970 29.58 26.85
3970 29.90 27.59
3970 29.99 28.17
3980 29.59 26.88
3980 29.91 27.62
3980 30.01 28.20
3990 29.60 26.90
3990 29.92 27.66
3990 30.02 28.23
4000 29.61 26.94
4000 29.93 27.69
4000 30.02 28.26
4010 29.61 26.97
4010 29.95 27.72
4010 30.03 28.29
4020 29.62 27.00
4020 29.95 27.74
4020 30.05 28.32
4030 29.63 27.04
4030 29.96 27.78
4030 30.04 28.34
4040 29.63 27.06
4040 29.96 27.81
4040 30.06 28.38
4050 29.65 27.09
4050 29.98 27.83
4050 30.07 28.41
4060 29.65 27.12
4060 29.99 27.85
4060 30.07 28.42
4070 29.67 27.15
4070 29.99 27.88
4070 30.09 28.45
4080 29.67 27.18
4080 30.00 27.92
4080 30.09 28.47
4090 29.69 27.21
4090 30.02 27.97
4090 30.11 28.51
4100 29.70 27.24
4100 30.01 27.99
4100 30.12 28.54
4110 29.71 27.28
4110 30.02 27.99
4110 30.13 28.57
4120 29.71 27.30
4120 30.03 28.04
4120 30.15 28.60
4130 29.71 27.32
4130 30.05 28.07
4130 30.14 28.62
4140 29.72 27.37
4140 30.06 28.10
4140 30.15 28.65
4150 29.74 27.39
4150 30.06 28.13
4150 30.17 28.68
4160 29.75 27.42
4160 30.07 28.16
4160 30.17 28.70
4170 29.76 27.45
4170 30.08 28.19
4170 30.18 28.73
4180 29.77 27.47
4180 30.08 28.21
4180 30.18 28.75
4190 29.77 27.51
4190 30.09 28.24
4190 30.19 28.78
4200 29.79 27.53
4200 30.11 28.27
4200 30.20 28.81
4210 29.79 27.58
4210 30.12 28.31
4210 30.21 28.82
4220 29.81 27.60
4220 30.11 28.32
4220 30.22 28.85
4230 29.81 27.63
4230 30.13 28.37
4230 30.22 28.87
4240 29.83 27.65
4240 30.14 28.39
4240 30.23 28.90
4250 29.83 27.69
4250 30.14 28.42
4250 30.24 28.92
4260 29.85 27.72
4260 30.16 28.46
4260 30.26 28.94
4270 29.85 27.75
4270 30.17 28.49
4270 30.25 28.97
4280 29.87 27.79
4280 30.18 28.52
4280 30.27 28.99
4290 29.88 27.82
4290 30.18 28.55
4290 30.29 29.03
4300 29.87 27.83
4300 30.20 28.57
4300 30.30 29.04
4310 29.88 27.85
4310 30.20 28.60
4310 30.32 29.09
4320 29.90 27.90
4320 30.21 28.62
4320 30.31 29.09
4330 29.92 27.92
4330 30.22 28.65
4330 30.31 29.11

81
IEA SHC/ECES – Task 42/24 – Compact Thermal Energy Storage
4340 29.92 27.94
4340 30.23 28.67
4340 30.32 29.15
4350 29.93 27.98
4350 30.25 28.71
4350 30.35 29.16
4360 29.95 28.02
4360 30.26 28.72
4360 30.35 29.18
4370 29.94 28.04
4370 30.26 28.76
4370 30.36 29.21
4380 29.95 28.07
4380 30.27 28.78
4380 30.37 29.23
4390 29.98 28.09
4390 30.27 28.81
4390 30.37 29.24
4400 29.99 28.12
4400 30.29 28.84
4400 30.38 29.27
4410 30.00 28.16
4410 30.30 28.86
4410 30.40 29.31
4420 30.01 28.18
4420 30.31 28.89
4420 30.40 29.32
4430 30.00 28.22
4430 30.31 28.92
4430 30.41 29.35
4440 30.02 28.24
4440 30.32 28.93 4450 30.03 28.26
4450 30.32 28.95
4460 30.04 28.31
4460 30.33 28.99 4470 30.05 28.32
4470 30.35 29.00
4480 30.06 28.35 4490 30.07 28.37 4500 30.07 28.40 4510 30.09 28.45 4520 30.10 28.46 4530 30.12 28.49 4540 30.12 28.51 4550 30.13 28.53 4560 30.13 28.57 4570 30.15 28.60 4580 30.16 28.62 4590 30.16 28.65 4600 30.17 28.69 4610 30.18 28.70 4620 30.21 28.73 4630 30.20 28.77 4640 30.21 28.77 4650 30.24 28.82 4660 30.24 28.84 4670 30.24 28.87 4680 30.27 28.89 4690 30.26 28.91 4700 30.27 28.93 4710 30.28 28.96 4720 30.30 28.99 4730 30.29 29.01