compact – a reclamation soil compaction model part i
TRANSCRIPT

University of KentuckyUKnowledge
Biosystems and Agricultural Engineering FacultyPublications Biosystems and Agricultural Engineering
3-1992
COMPACT – A Reclamation Soil CompactionModel Part I. Model DevelopmentRonald L. BingnerUSDA Agricultural Research Service
Larry G. WellsUniversity of Kentucky, [email protected]
Right click to open a feedback form in a new tab to let us know how this document benefits you.
Follow this and additional works at: https://uknowledge.uky.edu/bae_facpub
Part of the Bioresource and Agricultural Engineering Commons, and the Soil Science Commons
This Article is brought to you for free and open access by the Biosystems and Agricultural Engineering at UKnowledge. It has been accepted forinclusion in Biosystems and Agricultural Engineering Faculty Publications by an authorized administrator of UKnowledge. For more information,please contact [email protected].
Repository CitationBingner, Ronald L. and Wells, Larry G., "COMPACT – A Reclamation Soil Compaction Model Part I. Model Development" (1992).Biosystems and Agricultural Engineering Faculty Publications. 174.https://uknowledge.uky.edu/bae_facpub/174

COMPACT – A Reclamation Soil Compaction Model Part I. Model Development
Notes/Citation InformationPublished in Transactions of the ASAE, v. 35, issue 2, p. 405-413.
The copyright holder has granted the permission for posting the article here.
Digital Object Identifier (DOI)https://doi.org/10.13031/2013.28614
This article is available at UKnowledge: https://uknowledge.uky.edu/bae_facpub/174

COMPACT - A RECLAMATION SOIL COMPACTION MODEL PART I. MODEL DEVELOPMENT
R. L. Bingner, L. G. Wells MEMBER MEMBER ASAE ASAE
ABSTRACT A physically based, event oriented soil compaction
model, known as COMPACT, was developed as a management or research tool to evaluate the effect of surface mining systems on compaction of soil material during reclamation. Simulation of compaction throughout the soil profile at a surface mining reclamation site requires information describing how equipment moves on the site. The compaction processes that are caused by vehicles throughout the soil profile are described by applying the pressure distribution of the surface contact area of a tire or track to determine stresses in the soil profile. A virgin compression curve is then used to determine bulk density at any point within the soil profile. COMPACT predicts compaction of reconstructed patterns, type of vehicles, and type of soil material. Development of the simulation model is described in this article. KEYWORDS. Soil compaction. Modeling.
INTRODUCTION
Federal law mandates that reclaimed land must produce crops at the same level that occurred before surface mining activities began. For crops to produce
at their maximum level, the compaction of the soil should be considered. Research has shown in the agricultural sector that compaction caused by machinery traffic can affect yields (Negi et al., 1981; McKyes et al., 1979; Phillips and Kirkham, 1962; Wittsell and Hobbs, 1965). By simulating the machinery traffic at surface mine sites, the compaction of the soil material can be studied for the best plant growth with the least cost.
The purpose of this study was to develop a physically based model that can be used to simulate the surface-mining reclamation operations in moving soil material, the operations necessary to stabilize the material, and the compaction of the material that results from these operations. Part II (Bingner and Wells, 1992) will describe the performance and applications of the model.
COMPACTION AND SOIL CONDITIONS To understand compaction, the relationships between
soil conditions and compaction need to be examined. If these relationships are known, then the accuracy of
Article has been reviewed and approved for publication by the Power and Machinery Div. of ASAE. Presented as ASAE Paper No. 89-2018.
The authors are Ronald L. Bingner. Agricultural Engineer, USDA-Agricuitural Research Service. National Sedimentation Laboratory. Oxford, MS: and Larry G. Wells, Professor, Agricultural Engineering Dept., University of Kentucky, Lexington.
predicting soil compaction can be improved. Soane (1985) provides a detailed literature review of studies concerning compaction and soil conditions brought about by vehicle traffic and the resulting effect on plant growth.
Extensive studies have been performed to define the relationships between compaction and soil conditions. A detailed compilation of these studies is presented by Barnes et al. (1971). An extensive theoretical analysis of soil conditions related to compaction is found in Lambe and Whitman (1979). Fundamentally, when compaction occurs most of the soil physical properties change. Studies of the influence of compaction of organic matter (Free et al., 1947), rock content (Gordon et al., 1965), permeability (Poskitt, 1969), pore size (Ahmed et al., 1974), and soluble salts (Pohiakas, 1966) show the wide range of parameters related to compaction. These soil parameters are shown to effect compaction, but the major factor is moisture content. Many of the compaction theories only relate soil moisture content to compaction. Barnes et al. (1971) showed moisture content to be a major factor in determining the density of a soil when it is subjected to a load. This is reasonable because liquid or gas has to be expelled from the pore spaces to compress a soil.
SURFACE MINING MODELS Several computer models of surface coal mines have
been developed. Most modeling efforts have been aimed at increasing the efficiency of surface mining operations and thus reducing production costs (Bandopadhyay et al., 1981; Kim and Ibarra, 1981). A computer model focusing on reducing reclamation costs has also been developed (Gibson et al., 1981). Models developed by the Forest Service (1979) can be used in planning and designing surface mining and reclamation operations. These models are concerned with how to remove the mineral material and reclaim the land with the least cost consideration of the interaction of the vehicle and the reconstructed soil and spoil material as operations are performed. If a model could include interactions between vehicles and overburden, certain costs associated with some operations, such as compacting, land ripping, and revegetation, may be reduced.
MODEL DEVELOPMENT The model COMPACT (Compaction of Overburden by
Machinery Processes Associated with Contemporaneous Translocation) was developed to simulate surface mining reclamation operations and resulting compaction caused by the involved vehicles. The program was written in the GASP IV simulation language (Pritsker, 1974), which
VOL. 35(2): MARCH-APRIL 1992 405

contains ANSI FORTRAN 77 standard subroutines that ease the description of the surface mining systems and allows the addition of user-written subroutines. Users determine the GASP IV inputs required by the simulation language to describe the filing system, initial conditions of certain parameters and other related attributes needed to define the GASP IV portion of the simulation. Following the GASP IV inputs, user-defined inputs for COMPACT need to be entered.
The model was developed to simulate traffic pattems of various operations associated with surface area mining and then to predict resulting soil compaction. The model was thus divided into two main components:
1. Simulation of surface area mining operations. 2. Simulation of the compaction of soil material
resulting from surface area mining operations.
SURFACE AREA MINING OPERATIONS COMPONENT The simulation of surface area mining operations was
developed so the information obtained for the vehicles' movements over the mining area could be used to simulate the resulting soil bulk density. Rectangular areas called crossing-sections were defined at various locations within a simulated field. The crossing-sections monitor the movement of vehicles over the field by storing a vehicle's passage over the crossing-section as an entry in a file to be retrieved by the compaction component of COMPACT. The model is a discrete-event simulation using any time increment required by the user to complete the activities for the desired system.
The model has been developed so the following equipment may be used as components of surface area mining systems: (1) Scrapers, (2) Bulldozers, (3) Trucks, (4) Loaders, (5) Draglines, (6) Bucket wheel excavators, and (7) Shovels.
The various component variables and a schedule of operations for a mining system must be provided as input information. Any combination of the above machines can be used so long as a schedule of the correct sequence of operations with each type of equipment is provided as input. Figure 1 demonstrates the equipment that the model simulates and the sequence of operations that surface mining systems normally follow. A complete description of the logic used to move vehicles around and remove or deposit soil material at the mine site is given by Bingner (1988).
COMPACTION SIMULATION COMPONENT The equations and relationships used in COMPACT
were selected or developed to consider the conditions of the soil at the time of vehicle loading and the loading applied to determine the resultant dry bulk density. This section will provide a detailed description of the equations used to density of soil (surface and subsurface horizons) at a surface mine site.
Deformation due to stress in more than one dimension is very difficult for a model to determine. Larson et al. (1980) studied one-dimensional compression of a large number of soils in the laboratory and proposed the following relationship:
where P = Po =
s =
o„ =
P = I P o + » ' w ( S m - S ) | + CJogJH!LJ (1)
dry bulk density (g/cm^), dry bulk density at minimum applied stress (9.8 kPa) and at minimum degree of saturation (g/cm^), slope of bulk density at a given stress versus degree of water saturation, degree of water saturation of the soil material corresponding to maximum soil compressibility (%), degree of water saturation of the soil material (%), primary or virgin compression index, minimum applied normal stress associated with p^ (kPa), and applied vertical stress (kPa).
When this equation is plotted with bulk density versus the logio of the applied stress, a straight line results and is often called the virgin compression curve (VCC) with a slope called the compression index (Cy). At high stress, the VCC becomes non-linear and asymptotically approaches the maximum density of the soil material. This behavior at higher stresses is brought about because the soil material has been compressed such that reduced pore spaces become filled with water, and considerably more stress is required to remove more water and further compress the soil material.
A secondary compression curve (SCC) will result when the soil is subjected to a stress after having been previously subjected to a stress. The SCC can be described by equation 2:
p = p; + qiog(SLj (2)
where p^ is the known density as computed from the previous point on the VCC, and C^ is the slope of the secondary compression curve.
As stated in Lambe and Whitman (1979), "The exact cause of secondary compression is not known...", but could be "...caused by the continued reorientation of particles, possibly influenced by the extrusion of water that is held by the attractive forces from the soil particles". Equation 2 was developed based on the slope of the SCC and a known stress at a known density. The C^ can be measured for a soil after a confined stress is unloaded and the soil expands. The known stress, a ,̂ is assumed in COMPACT to be 9.8 kPa, the minimum applied stress that can be expected. The known density for the SCC (p*) at the known stress will be the same density that is computed for the VCC at an applied stress resulting from the immediate previous vehicle loading. Using the point of density determined from the VCC for an applied stress and 9.8 kPa and Cg, the intersection of the SCC and the VCC can be determined. For repeated loads, any stress below this
406 TRANSACTIONS OF THE A S A E

OVERBURDEN
< UJ
<
O
TOPSOIL
IJ
O
SUBSOL
LLTLI
SPOIL
/NU
SCRAPERS
O
2 Z <
:̂
LOADERS BUCKET UHEEL
EXCAVATORS
fllNERAL
EXCAVATORS
JT^
DRAGLINES POUER SHOVEL
TRUCKS CONVEYORS
GRADERS DOZERS
t t
DOZERS
Figure 1-The equipment COMPACT simulates and the combinations of equipment tliat can be defined.
intersection will follow the SCC and any loads above this intersection will follow the VCC.
The method that is used to determine the density can be illustrated using figure 2. The example shows that if an initial stress, Gi, is applied over virgin soil then the density Pj results. If another stress, 03, is applied over the same soil that is less than the stress at the intersection of WCC and SCC, then P2 results. This secondary compression curve is determined from the density that was determined from Gj as it applies at the minimum stress. Normally, the slope of the SCC is flat relative to the VCC, but the SCC has been distorted for illustration purposes. The SCC continues until the intersection with the VCC. If a third
crossing occurred with an applied stress of G3, beyond the intersection of the SCC and the VCC, the density, P3, is computed from equation 1. If a fourth crossing occurred with a stress of G4, then the density is computed from equation 2 (the SCC) which resulted from the density caused by G3.
The VCC typically has an initial nonlinear portion for the soil materials which partially could define the SCC. As Larson et al. (1980) states, "this is because of soil aggregate densities greater than the bulk densities..." or "...from a major rearrangement of soil particles with respect to each other." This initial curved portion of the VCC was not included by Larson et al. (1980) because no method has yet been described to define it. If the initial
VOL. 35(2): MARCH-APRIL 1992 407

SECONDARY COMPRESSION CUR'
RESULTING FROM <<̂ AND P|
VIRGIN COMPRESSION CURVE
SECONDARY COMPRESSION CURVE ' S RESULTING FROM ^ AND P3
MINIMUM APPLIED STRESS
Figure 2-Example of the method used to determine the density from the stress of a vehicle.
INCREMENT WITH WIDTH
l / 3 6 l h OF TIRE WIDTH SURFACE PRESSURE
TH, 2 - ^
I LOCATION OF SIDE INCREMENT
V ^ V E H I C L E CROSSED
Figure 3~Pressure within the soil at a depth determined from Soehne's surface pressure description.
pass of a vehicle produces a stress great enough to fall in the straight portion of the VCC, then the effect of the initial curved portion will be minimal.
Equation 2 does not show a dependence on the degree of saturation. This is true in that the density values of the s e c do not decrease as the degree of saturation decreases. The Cg has been shown by Lambe and Whitman (1979) to increase when the moisture content increases. Lambe and Whitman (1979) were unable to derive any equation that could explain this increase so any relation would only be approximate, thus this interaction was not included in equation 2.
The secondary compression curve is used without any consideration of the rebound of the soil after the vehicle passes over. Since there is little data to suggest how the material may rebound within a short period, as would be necessary in the simulation of the mining systems, this aspect of the soil was not included. Simulated densities would be expected to be slightly higher than the measured densities because of this, but because the slope of the SCC was small, only small discrepancies might result.
The VCC and the SCC were developed from static compressive loads. Soehne (1958) suggested that the soil compaction resulting from moving tires follows the same relationship as the pressure distribution in the soil from static loading. Determining the pressure distribution from moving tires makes the estimation of the soil compaction much more complex than from static loads. Equations 1 and 2 can then be made to apply to vehicles moving over the soil material when combined with equations that determine the pressure distribution within the soil.
Since equations 1 and 2 are one-dimensional equations, a method was required to determine the applied stress through the depth of the soil material. Soehne (1958) used an equation developed by Froehlich (1934) to develop a method (eq. 3) that applies a point load at the surface, Q, to produce vertical compressive stresses, x̂ , throughout the soil profile. Equation 3 assumes that the soil material is homogeneous and isotropic:
^z = 5 v Q
COS ;^2e (3)
where C^ = vertical compressive stress (kPa), Q = applied load (N), z = depth (cm), V = concentration factor, and 6 = angle formed by a line connecting a point within a
soil mass and the point of load application and a vertical line passing through the point of load application. Thus, directly below the point of application, 6 is 0 and cos 9 = 1 .
As it travels over the surface, a tire does not impart vehicle load at a single point or evenly distribute the load across the tire footprint. Soehne (1958) suggests three relationships that distribute vehicle load and produce various pressure distributions at the tire-soil interface that depend on the concentration factor, v. For a hard, dry soil with a high density, equation 4 is used:
P = P ij max
5!.«
Rl6 i fVS4 .5 (4)
where = surface pressure from the tire at increment
ij (kPa), Pmax = maximum pressure produced by the tire,
described by the expression, 1.125 Pmean* 0^^) Pmean= average pressure over the contact area
(kPa), = one half of the width of the tire, = respective distance of the increment from
the center of the tire at the surface, = Soehne's concentration factor.
R 8ij
For a fairly moist and dense soil, equation 5 will be used:
Py = 5̂
if4.5<v<5.5 (5)
408 TRANSACTIONS OF THE A S A E

IVIHICLE] TO SOIL HMSOAL
Figure 4-Interactions involved which effect the load that the vehicle applies to soil material.
where Pn,ax= l-5Pmean-
Finally for a very wet or soft soil, equation 6 will be used:
Pu= P n u . x h - ^ ; ifv S5.5 (6)
concentration factor can have a major effect on equations 3 through 6, equation 7 was developed:
V = 6 - 2 X P-PlT
Pmax-Pn (7)
Where Pmax= 2.0P^an-
The model assumes that Pmean* ̂ ^̂ average pressure, is the load of the vehicle applied to the tire or track over the contact area of the tire or track. The contact area of the tire, an input to the model, is divided into 36 equal segments along the width, i, and length, j , of the tire footprint. Thus, each width segment is divided into 36 square increments along the length. Each tire increment then has a pressure associated with it as computed from equations 4, 5, or 6. Since Soehne (1958) states that equations 4, 5, and 6 are computed when the concentration factors are 4, 5, or 6, respectively, the model assumes the use of equation 4 when V is less than 4.5, equation 5 when v is between 4.5 and 5.5, and equation 6 when v is greater than 5.5.
Soehne (1958) has shown that the concentration factor can vary with the density of the soil material. Since the
where V = the concentration factor, p = dry bulk density of the soil (g/cm^), Pmax = maximum dry bulk density of the soil (g/cm^), Pmin = minimum dry bulk density of the soil (g/cm^).
The concentration factor has been assumed to vary with the current soil density, the minimum density, and the maximum density of the soil material. The minimum and maximum densities are input parameters to the model but can have different values for various layers with depth. As the density varies, the concentration factor will vary between the values four and six. The values four and six were chosen from the work of Soehne (1958) because four was defined for a hard soil and six was defined for a wet soil. Equation 7 is only an assumption that was seen as necessary to produce an interaction between the soil density and the concentration factor required for equations
VOL. 35(2): MARCH-APRIL 1992 409

I
4^ CROSSING POINT
CROSS
SECTION
I 31
i oV
« -1
2 J
Ul / - j
T—r t 2 3
^ / \ S i l , SIDE I
/ ' ^ CROSSING / I ^ POINT J
'* WIDTH OF TIRE
LAYER 3
f i l l I I I I 1 lO I I I f IJ 14
PLAN VIEW
DISTANCE ALONG SIDE I ( cm *S)
Figure 5>A crossing point of a cross-section and the soil profile below side 1 at the mine sites final state.
3 through 6. Further validation of this assumption is needed.
Once all the surface pressures for each increment are computed, then the stresses within the soil are computed by superposition of stresses which is given by an integration of equation 3, producing equation 8.
a ,= 5v cos :V+2
0 0
where
^j
= surface pressure from tire from the first to the last increment, ij (kPa),
= width of the ij increment of the tire footprint (cm),
= length of the ij increment of the tire footprint (cm), and
6ij(z) = angle between the center of the footprint increment ij and the point in question at depth, z, below the center of the footprint or contact area.
Each tire contact area or footprint is divided into increments ij of di by dj area. For the soil beneath each increment of the tire contact area, the cumulative stress resulting from the pressure associated with the other tire increments are added to determine a final stress within the soil at a given depth (fig. 3). The density equations 1 and 2 are then used with the stress within the soil at each depth increment to determine the compaction. The stress resulting from the static weight of the soil is not included in the equations. For shallow depths, the static weight of the soil would not be much of a factor in determining density. Future development of the model could easily include the static weight of the soil so a more accurate analysis could be made at deeper depths into the soil profile. Equations 1 through 8 represent a method of determining soil compaction on an agricultural field or a reclaimed surface mine site with a minimal requirement in programming and computer run time.
MODEL LOGIC The simulation of soil compaction was developed to
obtain information from the simulation of the surface area mining operations and can be used to determine the soil
2 H
WIDTH OF TIRE m
PRESSURE
f i f l l l f l f LAYER I
Z O I H
T ELEVATION OF DENSITY DETERMINATIONS
T 1 I t 3
T
[ ELEVATION OF MAXIMUM DEPTH OF DENSITY
I I
T 1 \ 1 1 1 1 1 1 c r e 9 lo II iz 13 14 4 5
SIDE INCREMENTS
Figure 6-The first crossing of a point from the example and the resulting elevations of density determinations.
410 TRANSACTIONS OF THE ASAE

WIDTH OF TIRE
4 H
3 H
LAYER 2
ELEVATION OF DENSITY DETERMINATIONS
___j-.---t-i-_-J^_ I ELEVATION OF MAXIMUM DEPTH OF DENSITY
LAYER 1
"T" 5
T" 7
1^
a T" 9 JO 12
"T" 13
"T" 14
SIDE INCREMENTS
Figure 7-The second crossing of a point from the example and the resulting elevations of density determinations.
density at various locations and elevations. This information was stored in a file from the operations simulation component. Each rectangular crossing-section is divided into its four sides, with each side partitioned into 5 cm increments along its length. Each 5 cm side increment has the depth below it subdivided into 5 cm depth increments.
The simulation monitors each vehicle crossing to see which crossing-section has been entered by the vehicle. The range of points that a vehicle's tire or track crossed in the section is determined and placed into the appropriate 5 cm side increments. With the vehicle's pressure on the soil from the weight and contact area, the density calculations can be determined. Figure 4 shows the interactions that would normally be involved to determine the pressure that the vehicle imparts to any soil material. The model does consider these factors except the inflation pressure and the ability of the vehicle's weight to affect the size of the contact area brought about by the tire or track. When a vehicle enters into a crossing-section the following information would be recorded in a file: 1) X, Y crossing point; 2) crossing-section location area identification; 3) elevation of the point (meters); 4) type of soil material; 5) vehicle identification number; 6) total vehicle weight (kg); 7) percent saturation of the soil; 8) direction of vehicle travel (degrees); 9) contact area (cm); 10) width of tire (cm); 11) time vehicle entered the crossing-section; and 12) portion of the tire crossing the crossing-section.
Each point that a vehicle has crossed a crossing-section is retrieved from the storage files starting with the earliest time of a crossing. The density of the soil is then determined from this history of loads occurring over the crossing-section as material was placed on it.
The side that a vehicle enters a crossing-section will be determined according to the point under a tire that crossed a side of the crossing-section. The side of the crossing will then be divided into 5 cm increments. By knowing the width of the tire or track, the side increments that the tire or track will fall into can be determined. For each side increment the tire or track crosses, the pressure of the tire will be applied over the length of the increment based on equations 4, 5, or 6. The stress within the soil will be determined from equation 8 by knowing the weight over the tire or track, the contact area, and the concentration factor that will result from the density of the soil. The pressure over the increment will then be used to determine the density of the soil beneath the side increment. A stress is determined at each 5 cm depth increment below the side increment of the crossing-section. The density equations 1 and 2 are then used with the stress computed at the increment depth.
After density is determined at a depth, COMPACT determines if the density computed by equation 1, the VCC, is less than or equal to the minimum density for the soil layer. When the computed density for the 5 cm increment depth at the side increment is equal to the minimum density, then the soil pressure will no longer have an effect on the density of the soil and the calculations for this 5 cm side increment stops at that 5 cm increment depth. If the computed density is greater than the minimum density, then the depth into the soil increases by 5 cm and the stress within the soil is recalculated.
At the end of the simulation the model determines if any soil has previously been crossed at the same elevation point. If the elevation point has been crossed before and no new elevation has occurred, then a new concentration
VOL. 35(2): MARCH-APRIL 1992 411
5 H
•WIDTH OF TIRE I 1-*:̂ 1^ I I
PRESSURE
4H
1\ ii\ \ i ! i I
LAYER 3
2H 5
1 H
I H — ^
ELEVATION OF DENSITY DETERMINATIONS
LAYER 2
ELEVAIION POINTS OF LAYER 2 AFFECTED
ELEVATION OF MAXIMUM DEPTH OF DENSITY
LAYER 1
7 "T" a
1^ i l ;2
"T" 13 y4
SID^ INCREMENTS
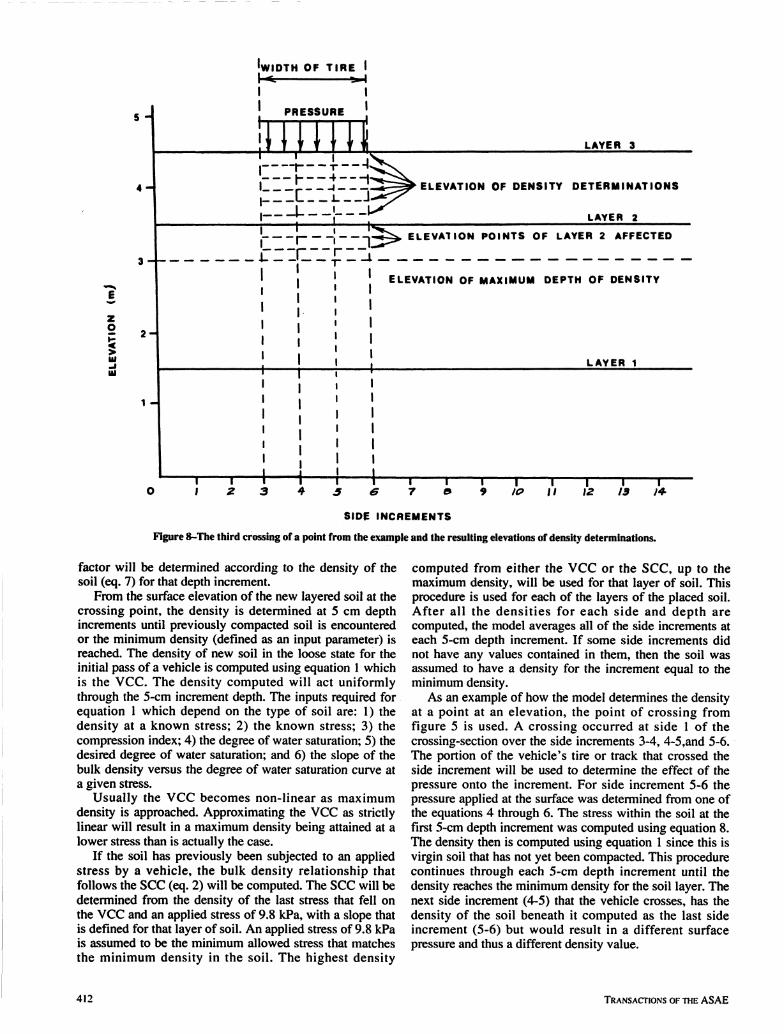
Figure 8~The third crossing of a point from tlie example and the resulting elevations of density determinations.
factor will be determined according to the density of the soil (eq. 7) for that depth increment.
From the surface elevation of the new layered soil at the crossing point, the density is determined at 5 cm depth increments until previously compacted soil is encountered or the minimum density (defined as an input parameter) is reached. The density of new soil in the loose state for the initial pass of a vehicle is computed using equation 1 which is the VCC. The density computed will act uniformly through the 5-cm increment depth. The inputs required for equation 1 which depend on the type of soil are: 1) the density at a known stress; 2) the known stress; 3) the compression index; 4) the degree of water saturation; 5) the desired degree of water saturation; and 6) the slope of the bulk density versus the degree of water saturation curve at a given stress.
Usually the VCC becomes non-linear as maximum density is approached. Approximating the VCC as strictly linear will result in a maximum density being attained at a lower stress than is actually the case.
If the soil has previously been subjected to an applied stress by a vehicle, the bulk density relationship that follows the s e c (eq. 2) will be computed. The SCC will be determined from the density of the last stress that fell on the VCC and an applied stress of 9.8 kPa, with a slope that is defined for that layer of soil. An applied stress of 9.8 kPa is assumed to be the minimum allowed stress that matches the minimum density in the soil. The highest density
computed from either the VCC or the SCC, up to the maximum density, will be used for that layer of soil. This procedure is used for each of the layers of the placed soil. After all the densities for each side and depth are computed, the model averages all of the side increments at each 5-cm depth increment. If some side increments did not have any values contained in them, then the soil was assumed to have a density for the increment equal to the minimum density.
As an example of how the model determines the density at a point at an elevation, the point of crossing from figure 5 is used. A crossing occurred at side 1 of the crossing-section over the side increments 3-4, 4-5,and 5-6. The portion of the vehicle's tire or track that crossed the side increment will be used to determine the effect of the pressure onto the increment. For side increment 5-6 the pressure applied at the surface was determined from one of the equations 4 through 6. The stress within the soil at the first 5-cm depth increment was computed using equation 8. The density then is computed using equation 1 since this is virgin soil that has not yet been compacted. This procedure continues through each 5-cm depth increment until the density reaches the minimum density for the soil layer. The next side increment (4-5) that the vehicle crosses, has the density of the soil beneath it computed as the last side increment (5-6) but would result in a different surface pressure and thus a different density value.
412 TRANSACTIONS OF THE A S A E

From the first crossing of the point (fig. 6), soil was added to the new elevation. The density was determined until the pressure had no affect on the soil density. A second crossing occurred at the point (fig. 7) resulting in a new elevation. The density was computed at new depth increments as before. Since the pressure from the vehicle acted did not reach the first layer, the density below the second crossing point (where the pressure no longer had an effect) remained at the loose density state.
A third crossing occurred at the point (fig. 8), again resulting in a new elevation. The density was determined for each 5-cm depth increment as before until the depth increments reached the depth increments that had been previously compacted. A concentration factor will be determined for the increment that has been previously compacted based on equation 7. This may then change the surface pressure equation that is used and thus the resulting stress within the soil at this depth increment. The density for the previously compacted soil will then be the greater of the density of the VCC or the SCC. When the stress within the soil results in a density, as computed from the VCC, less than or equal to the minimum density then the vehicle no longer affects the density and depth increments be low will remain at the same state as previously calculated or at the loose density.
SUMMARY The formulation of a model to determine resultant bulk
density of reconstructed soil compacted by vehicles is described. The model will help estimate the effectiveness of various surface mining reclamation operations in managing compaction that will affect plant growth and groundwater f low. The model uses equations that determine the soil stresses of many increments beneath a tire or track. Virgin and secondary compression curves are then used to determine soil density, depending on the simulated history of surface stress application, to determine the density at increments in the soil profile.
Using the methods described in this article, a relative prediction of the density profile within a surface mining reclamation site can be made. A relative prediction could then be used to evaluate the various reclamation systems. As improved compaction equations are developed, they can be easily included into the model.
REFERENCES Ahmed, S., C. W. Lovell, Jr. and S. Diamond. 1974. Pore sizes
and strength of compacted clay. J, Geotechnical Eng. Div.y Proc, ASCE 100:407-425.
Bandopadhyay, S., R. V. Ramani and C. B. Manula. 1981. A computer simulation model for a surface coal mine. Bulk Solids Handling 1(1):129-135.
Barnes, K. K., W. M Carleton, H. M. Taylor, R. I. Throckmorton and G. E. Vanden Berg, eds. 1971. Compaction of Agricultural Soils, 106-122. St. Joseph, MI: ASAE.
Bingner, R. L. 1988. A simulation of compaction as a function of soil and machinery characteristics. Unpub. M.S. thesis, University of Kentucky, Lexington.
Bingner, R. L. and L. G. Wells. 1992. COMPACT- A reclamation compaction model: Part II. Sensitivity Analysis and Applications. Transactions of the ASAE (In Ftess).
Forest Service, USDA. 1979. Mining and reclamation in the west. General Technical Report INT-70. Intermountain Forest and Range Experiment Station.
Free, G. R., J. Lamb, Jr. and E. A. Carleton. 1947. Compactibility of certain soils as related to organic matter and erosion. J, Am, Soc, Agron.39:\06&-16.
Froehlich, O. K. 1934. Druckverteilung im Baugrunde (Formulas of Boussineq). Vienna.
Gibson, D. R, E. L. Mooney and D. M. Scott. 1981. Grading western surface mines for post mining land uses. ASAE Paper No. 81-1591. St. Joseph, MI: ASAE.
Gordon, B. B., W. D. Hammond and R. K. Miller. 1965. Effect of rock content on compaction characteristics of clayey gravel. i45rAf5r/> No. 377:31-46.
Kim, Y. C. and M. A. Ibarra. 1981. Truck dispatching by computer simulation. Bulk Solids Handling 1(1): 137-147.
Lambe, T. W. and R. V. Whitman, eds. 1979. Soil Mechanics. SI Version. New York: John Wiley & Sons.
Larson, W. E., S. C. Gupta and R. A. Useche. 1980. Compression of agricultural soils from eight soil orders. Soil Soc. Am. J. 44:450-457.
McKyes, E., S. Negi, E. Douglas, F. Taylor and V. Raghavan. 1979. The effect of machinery traffic and tillage operations on the physical properties of a clay and on yield of silage com. J. Agric. Eng. Res. 24:143-148.
Negi, S. C, E. McKyes, G. S. V. Raghavan and F. Taylor. 1981. Relationship of field traffic and tillage to com yields and soil properties/. ofTerramechanics 18(2):81-90.
Phillips, R. and D. Kirkham. 1962. Soil compaction in the field •and com growth. Agron. J. 54:29-34.
Pohiakas, K. 1966. The effect of soluble salts on the compactibility of four Saskatchewan soils. Canada J. Soil Sci. 46:47-52.
Poskitt, T. J. 1969. The consolidation of saturated clay with variable permeability and compressibility. Geotechnique 19(2):234-252.
Pritsker, A. A. B. 1974. The GASP IV Simulation Language. New York: John Wiley & Sons.
Soehne, W. 1958. Fundamentals of pressure distribution and soil compaction under tractor tires. Agricultural Engineering 39:276-286,290.
Soane, B. D. 1985. Traction and transport systems as related to cropping systems. In Proc. of International Conference on Soil Dynamics, 863-935, June 17-19,1985. Auburn, AL.
Wittsell, L. E. and J. A. Hobbs. 1965. Soil compaction effects on field plant growth. Agron. J. 57:534-537.
VOL. 35(2): MARCH-APRIL 1992 413