como west public school annual · pdf filecomo west public school p & c report ... was the...
TRANSCRIPT

Como West Public School Annual Report
3896
2015

Introduction
The Annual Report for 2015 is provided to the community of Como West
Public School as an account of the school’s operations and achievements
throughout the year.
It provides a detailed account of the progress the school has made to provide
high quality educational opportunities for all students, as set out in the school
plan. It outlines the findings from self-assessment that reflect the impact of
key school strategies for improved learning and the benefit to all students
from the expenditure of resources, including equity funding.
The Annual Report describes the school’s high quality practices across the
three domains of the School Excellence Framework of learning, teaching and
leading. For more information about the School Excellence Framework please
visit: http://www.dec.nsw.gov.au/about-the-department/our-reforms/school-excellence-framework
Principal’s Name:
Vicki Basford
Principal
School contact details:
Como West Public School Wolger Street Como West 2226 [email protected]
9528 9007
Message from the Principal
I am proud of the academic achievements of our students and the ongoing success of the strategies being implemented by the school to create high quality learning experiences.
Firstly, we have a highly dedicated staff who work together to provide an inclusive environment where all students are nurtured and encouraged to achieve their personal best in all that they do.
Every staff member’s passion, dedication, commitment, perseverance, enthusiasm, sense of humour, care and collaboration is admirable. Together, as a team, we have dealt with major Departmental changes to curriculum, student welfare, School Plans and policies. In this current time of change, I thank the teachers for always stepping outside their comfort zones, to ensure the best possible outcomes for our students.
Secondly, our students are a passionate and motivated group of young people who are keen to learn and participate in the range of educational opportunities provided for them at the school.
Student leadership has been developed throughout the school and the 2015 Parliamentarians, Sports Captains, Vice Captains and SRC members have done a remarkable job. They have performed their duties in an exemplary manner and have been role models for others.
Congratulations to our 2015 Year 6 students. They are an incredible group of children who have become responsible, respectful and compassionate adults.
All our K-6 students display our school values and perseverence, giving their utmost to continually demonstrate our school motto: Our Best Always.
Thirdly, Como West Public School enjoys tremendous support from our parent body and local community.

I must acknowledge and thank the school community. We are extremely fortunate to have parents on various committees, parents who assist in the classroom or canteen and our P&C and School Council. Thank you for supporting our students. Our collaboration on projects, fundraising and school events is exemplified in the sense of community, we achieve. Having a genuine sense of community expands further than the gates of the school. Staff collaboration, along with the collaboration and support of the parents and family members of Como West Public, make this an excellent school. Without the staff, students and families, a school is just some buildings. A school becomes a school when the people walk into the buildings and begin working towards a common goal. I am absolutely privileged, as a Principal, to lead such a wonderful, dynamic school. 2015 has been an exceptional year, and we will continue as a school, to be committed to continuous improvement and upholding standards of excellence in 2016. Vicki Basford Principal Como West Public School
P & C Report
2015 proved to be another successful year of fundraising for the Como West P&C committee. The various activities held throughout the year and the approximate amount of monies raised included: Big Bay Out - $22,000 Easter Raffle - $3500 Mother’s Day stall - $1500 Father’s Day Stall - $1500 School Disco - $650 This year saw the ten year anniversary for the Big Day Out. The Big Day Out has gone from an exercise in fundraising to an event that is now a popular tradition within the Como West community. I would like to acknowledge and thank Jacqui Hardwick for her tireless efforts over the past ten years. At the start of 2015, we welcomed Ms Erin Wilson as the new co-ordinator of our Before and After School Care (BASC). Erin has initiated several new programs into the Centre’s daily structure. She has concentrated on raising the Centre’s profile through monthly newsletters and joint ventures with other BASC facilities such as the one at Jannali Public School. It has been lovely to see the positive responses Erin is receiving from the families at Como West. At the start of Term 4, Mr Dean Morters had to unfortunately step down from his role as Canteen Convener. Dean was the lynchpin that ensured a successful school canteen. His many hours of dedication, sweat and hard work are much appreciated, by not only me, but all the students and their parents who use and rely on the healthy options provided at the canteen. A big thank you for all that Dean has done. There have been many other people who have also given their time very generously throughout the year. Although they have not been mentioned personally, their efforts have not gone unnoticed. Without the continued generosity of these people, the numerous ongoing fundraising activities would not be a success. I would like to thank, most sincerely, all those volunteers who have been involved with the P&C this year in their various roles and capacities. It has been a pleasure to be involved with such a caring and enthusiastic parent body. Nicole Wirth President Como West Public School P & C

School Council Report
The School Council at Como West Public School, reviews school policies and procedures which fall outside of the Dept of Education’s guidelines. These policies and procedures are ratified by the School Council to ensure the safety and well-being of the students and to enhance their educational experiences.
The Council’s voluntary representatives are made up of school staff, P&C, parents and the community. Three meetings were held in the 2015 calendar year and the following documents were discussed and ratified.
The School Plan
BYOD (Bring Your Own Device) Policy.
In addition, the School Council also takes the opportunity to acknowledge those students who perform at a high level in the arts, community or the environment. This is recognised by the presentation of the School Council Arts Award.
This award is presented exclusively of sports, citizenship, public speaking, leadership and academia, which are appropriately acknowledged separately by the school.
Congratulations to our worthy 2015 winner for an outstanding performance which highlights the abundance of talent within the school.
As always my thanks to our Principal Vicki Basford, and staff representative, Russell Taunton. Their invaluable insight into the running of the school is presented with clarity and good humour. I sincerely appreciate the efforts of Nicole Wirth our P&C President, and the parent representatives, who always give their time so generously and show an active interest in the School.
I’d also like to thank all the staff members whose efforts are well recognized. Como West Public School students are sometimes sought after and are a welcome addition to high schools around the Sydney metropolitan area.
It is always refreshing to see an active interest in the School Council and it has been a privilege and a pleasure to work with all of you.
With the ongoing management of the government’s “Local Schools - Local Decisions” policy, the School Plan requires continuous community input. The School Council has an active, relevant role in running the school to provide the best outcome for all students.
In a community like Como West, the school is the common thread which ties us all together. Often, as parents of students, parents of ex-students or having been a past student, the school brings the community together. It is where our expectations are passed on to each new generation. Being a participant is a wonderful opportunity to meet fellow members of your community, to discover how your children learn and to have a positive influence on their participation in society as they grow.
Michael Ryan President Como West Public School Council
School background
School vision statement
Como West Public School is an inclusive, cohesive and dynamic learning community, with a highly skilled and committed staff, where students become highly numerate and literate individuals. Our students will develop creative and thinking skills that underpin 21st century learning, while giving their best always, encompassing our school values, embracing change and building our community for our future.
School context
Como West Public is a warm and dynamic school. The school strives to provide the best possible education for every child in a caring atmosphere. The school fosters a stimulating, cohesive, learning environment and delivers quality education that caters for diverse abilities.

A dedicated and professional staff provides quality teaching and learning experiences. The school has a history of outstanding academic, sporting and performing arts achievements. The focus on literacy and numeracy achieves high educational outcomes. Exceptional programs in sport and the performing arts are offered. Student leadership is developed throughout the school. Parents support all school activities and participate in the daily life of the school. Como West Public is recognised in the wider community as being committed to continuous improvement and upholding standards of excellence.
Self-assessment and school achievements
Self-assessment using the School Excellence Framework
This section of the Annual Report outlines the findings from self-assessment using the School Excellence Framework, our school achievements and the next steps to be pursued. The Framework supports public schools throughout NSW in the pursuit of excellence by providing a clear description of high quality practices across the three domains of Learning, Teaching and Leading.
This year, our staff at Como West Public School discussed the School Excellence Framework and its implications for informing, monitoring and validating our journey of excellence. Time was dedicated to thoroughly examine the school plan to determine the elements of the School Excellence Framework that the plan most strongly addressed. Staff reflected on the progress being made across the school based on the expectations identified in the Framework. This provides an important overview to ensure our improvement efforts align with these high level expectations.
In the domain of Learning, Como West is currently between the sustaining and growing and excelling performance measures.
The Learning Culture of the school is supported by a strong, well established, ever developing and improving learning support team. There is community support through the P&C providing additional funds to allow the continuation of early intervention literacy programs for students requiring additional support in their early years of primary school. To ensure continual revision of programs and practices within the school, staff, students and parents complete surveys to assess what is valued, along with staff analysis of NAPLAN data to drive further initiatives to enhance learning outcomes for the students. Looking forward, we will be working on further developing the positive and respectful relationships across the school community with a focus on our productive learning environment and supporting students’ development of strong identities as learners.
In the element of Wellbeing, Como West delivers individualised learning programs that cater to the needs of all students, as supported by the learning and support team. Our values program is explicitly taught by staff and reinforced throughout the year by the SRC and our school based merit award system. The school offers a variety of activities to enhance the school experience for all students’ interests including chess, library, debating, sport, band, choir and dance, just to name a few. The school has strong links with the community through tree planting projects, fundraising for charities, expert guest speakers including grandparents and the fire brigade. Our local businesses support our school through the P&C’s fundraisers, The Big Day Out and through supplying awards for our presentation award ceremony. These include the ANSTO Science Award and the local Chemist’s School Values and Outstanding Service to School Awards. Our next challenge is to develop a comprehensive and inclusive framework to measure the already high levels of cognitive, social, physical and spiritual wellbeing of the students.
With respect to the element of Curriculum and Learning, Como West is excelling. The school has active partnerships as part of a community of schools, and maintains strong links between local high schools and preschools. Our kindergarten orientation program and high school transition programs are highly valued. They effectively support students’ transition into new learning environments to ensure continuity of learning for our students. The transition between classes within the school year by year, is supported by an in-school transition program where teachers meet and discuss individual students’ capabilities. Students requiring additional support throughout transition are given the support they need. In future, we will be working on developing even more innovative delivery mechanisms for our curriculum programs and teaching practices.
In the domain of Assessment and Reporting, parents are involved in parent information sessions and are given the opportunity to discuss their children’s progress regularly through teacher/ parent meetings and parent in-services in literacy and numeracy. The whole staff is involved in NAPLAN data analysis. The Learning and Support Teacher is now incorporating the updated York Assessment Tool to help identify particular target areas for specific students. Next

year we are going to be improving how students use the assessment and reporting process and feedback to reflect on and plan their learning.
The Student Performance Measures indicate our school is excelling. Our NAPLAN results reflect a high achieving school with high growth.
Our major focus in the domain of Teaching has been on collaborative practice for staff members. An important opportunity has been provided to staff members in relation to planning, teaching and growing as a team in each of our stages. The use of technology for learning, the importance of data analysis to inform decision-making, the growing of teaching practice through classroom observations, reflections and feedback, and the development of expertise in vital literacy and numeracy programs and in new syllabuses, all highlight a teaching culture that is moving student learning to a new level.
Our school’s leadership strategy promotes succession planning, distributed leadership and organisational best practice. This is demonstrated by our staff having purposeful leadership roles based on their professional expertise.
The school plan is at the core of our continuous improvement effort. This year, monitoring, evaluation and review processes have been embedded and undertaken routinely. The effective implementation of the school plan has occurred through clear processes and accompanying timelines and milestones. For further development, the school needs to use collaborative feedback and reflection to promote and generate learning and innovation.
School resources at Como West are used strategically to achieve improved student outcomes. Physical learning spaces are used flexibly. Technology, including banks of iPads, class computer lab and shared computer hubs, are accessible to our staff. Management practices and processes underpin school improvement at Como West Public. Through the use of school surveys and involvement in SRC, P&C and School Council meetings, opportunities are available for students and the community to provide constructive feedback on practices and policies.

Strategic Direction 1
Student Learning
Purpose
To improve student learning outcomes in English, Mathematics and 21st century learning.
Overall summary of progress
Our continued school-wide focus on English, Mathematics and 21st century learning has enabled us to achieve significant progress in this strategic direction through a successful approach to student learning.
School practices and processes have been enhanced to monitor and plan for effective student progress in literacy and numeracy. This has enabled us to improve early identification and intervention to provide stronger, more focused support for individual students in partnership with their parents.
The development of deeper understandings of 21st century learning has been achieved through a range of activities and teaching initiatives. This is having a positive impact on the culture of the school, as well contributing to stronger Character, Citizenship, Collaboration, Communication, Creativity and Critical Thinking for our students.
Progress towards achieving improvement measures Resources (annual)
Improvement measure (to be achieved over 3 years)
Progress achieved this year Funds Expended
Increase the percentage of students in Bands 5 & 6 in Year 3 and Bands 7 & 8 in Year 5 in NAPLAN
Achievement and growth in Literacy and Numeracy K-6 will be measured and monitored by PLAN registration moving expected number of clusters
Standardised Testing (Pre & Post) including PM Benchmarking
Teacher programs
NAPLAN reading data reflects high achievement.
Parents attended in-services on Literacy and Numeracy to allow parents to have a greater awareness of how to support their children at home.
All students K-6 have been plotted on PLAN on the literacy continuum with consistent teacher judgement (CTJ) as teachers worked in teams and reviewed assessment data on all students.
All students’ reading levels have been assessed, benchmarked, recorded and saved on the server for access by teachers at the beginning of next year for the establishment of reading groups within new classes.
Teaching programs allow for differentiated learning
$12,514.00
Enhance the level of student ownership of their learning through authentic feedback and collaboratively devised
rubrics. Possible three way interview with parents. Up-skill staff to be able to track students’ numeracy progress through PLAN data. Further consolidation of 21st century learning is required for staff and students.
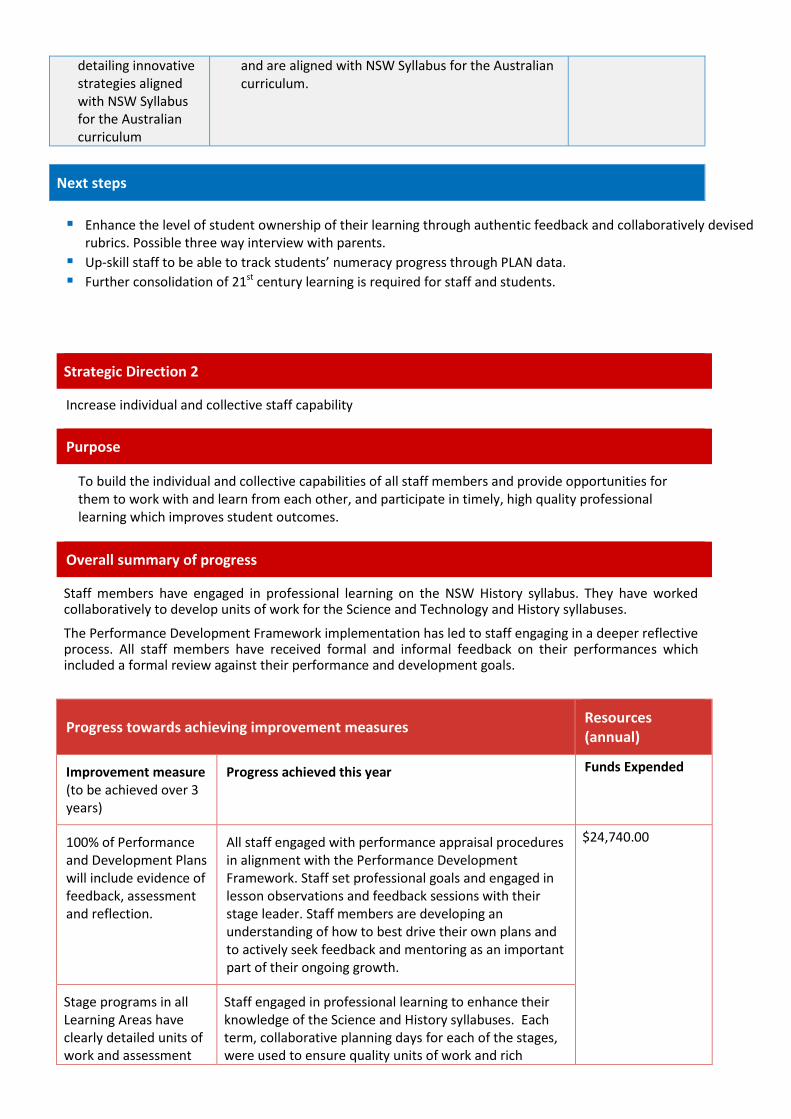
Strategic Direction 2
Increase individual and collective staff capability
Purpose
To build the individual and collective capabilities of all staff members and provide opportunities for them to work with and learn from each other, and participate in timely, high quality professional learning which improves student outcomes.
Overall summary of progress
Staff members have engaged in professional learning on the NSW History syllabus. They have worked collaboratively to develop units of work for the Science and Technology and History syllabuses.
The Performance Development Framework implementation has led to staff engaging in a deeper reflective process. All staff members have received formal and informal feedback on their performances which included a formal review against their performance and development goals.
Progress towards achieving improvement measures Resources (annual)
Improvement measure (to be achieved over 3 years)
Progress achieved this year Funds Expended
100% of Performance and Development Plans will include evidence of feedback, assessment and reflection.
All staff engaged with performance appraisal procedures in alignment with the Performance Development Framework. Staff set professional goals and engaged in lesson observations and feedback sessions with their stage leader. Staff members are developing an understanding of how to best drive their own plans and to actively seek feedback and mentoring as an important part of their ongoing growth.
$24,740.00
Stage programs in all Learning Areas have clearly detailed units of work and assessment
Staff engaged in professional learning to enhance their knowledge of the Science and History syllabuses. Each term, collaborative planning days for each of the stages, were used to ensure quality units of work and rich
detailing innovative strategies aligned with NSW Syllabus for the Australian curriculum
and are aligned with NSW Syllabus for the Australian curriculum.
Next steps

Strategic Direction 2
plans which reflect the content and pedagogy of each syllabus.
assessment tasks were developed. Weekly stage meetings ensured consistent teacher judgement was established.
Next steps
Develop a knowledge and understanding of the NSW History and Geography syllabus for the Australian Curriculum.
Explore the implications of the new evidence-based practices to help improve student performance Report through professional development sessions.
Strategic Direction 3
Implement Quality Systems and Processes
Purpose
To improve the social and emotional wellbeing of school community members. To establish more effective partnerships with families and the wider community.
To strengthen the relationships with local schools and work collaboratively to achieve common goals and provide students with a variety of experiences and opportunities.
To improve whole school effectiveness through streamlined efficient management systems that integrate current technology.
Overall summary of progress
Staff has engaged with the new strategic planning process and are routinely monitoring, evaluating and reviewing milestone implementation and impact. The engagement of the school community more generally in this process is ensuring a strong, positive and strategic approach to the progress of the school.
Progress towards achieving improvement measures Resources (annual)
Improvement measure (to be achieved over 3 years)
Progress achieved this year Funds Expended
Strengthened linkages with the Community Of Schools by engaging common programs which extend student and staff learning opportunities
Throughout 2015, staff and students have had the opportunity to work within and across the COS (Community Of Schools). This has been evidenced through Principal networks, enrichment days in Science & Technology and Mathematics, Learning to Lead and professional learning.
$3,585.00
Involving parents in the daily life of the school, decision making and inservicing on literacy and numeracy
All staff was involved in initiating and delivering a parent forum on super six comprehension strategies and the aspects of numeracy K-6.

Next steps
Positive Behaviour for Learning (PBL) - To create a flexible approach to embedding the elements of PBL that complements our school context and establishes consistency of student playground expectations.
LMBR - Develop skills and knowledge to effectively integrate new finance and management practices. Physical Literacy Continuum-Develop an understanding of the PLC and how it underpins the PDHPE
syllabus document and identifies the growth of students. Parent Forums - To further scaffold parent knowledge of the syllabus and ways that they can support
their children at home in spelling, writing and working mathematically. Stage 3 Parent Information Afternoon - Success of Bring Your Own Device (BYOD) initiative.
Next Step

Key initiatives and other school focus areas
Key initiatives (annual) Impact achieved this year Resources (annual)
Aboriginal background funding
The Individual Learning Plan (ILP) was
reviewed and updated in consultation with
the student and parents.
Personal goals were established in literacy
and numeracy and the process towards
achievement was monitored.
The student is demonstrating above average
levels of progress.
$948
English language proficiency funding
Individual and small group instruction for
students from AELD background improved
students’ language proficiency.
Students demonstrated significant literacy
growth as evidenced by progress on the
literacy continuum.
$13,080
Socio-economic funding and low level adjustment for disability funding
Socio-economic funding and low level
adjustment for disability funding were
combined for initiative programs.
Programs implemented supported targeted
students in literacy and numeracy who
required additional assistance to achieve
grade expectations.
Teaching instruction varied from individual
to small group.
Reading programs focussed on phonemic
awareness and decoding.
Pre test and post test work samples
reflected an average growth of 50% per
student.
$6,240
Support for beginning teachers
Funding was utilised to enable staff to
observe lessons in other classrooms to
enhance their practice.
Attendance at inservices increased
knowledge and understanding of syllabus
content , behaviour management and
$8,040.10

Next Steps
strategies to assist students with special
needs.
Funds were also expended by a staff
member to implement a social skills program
initiative.
Students improved their ability to listen to
instructions, take turns and were equipped
with strategies to resolve conflict.

Mandatory and optional reporting requirements
Student information
It is a requirement that the reporting of information for all students be consistent with privacy and personal information policies.
Student enrolment profile
Student attendance profile
Class sizes
Roll class Year Total in class Total per year
KC K 21 21
KW K 20 20
1DM 1 23 23
1E 1 24 24
2H 2 24 24
2T 2 25 25
3S 3 24 24
3W 3 23 23
4B 4 27 27
4O 4 27 27
1/2M 1 13 25
2 12 25
5/6A 5 18 28
6 10 28
5/6C 5 17 27
6 10 27
5/6S 5 17 28
6 11 28
Workforce information
Reporting of information for all staff must be consistent with privacy and personal information policies.
Workforce composition
Position Number
Principal 1
Assistant Principal(s) 3
Classroom Teacher(s) 18
Learning and Support Teacher(s) 1
Teacher Librarian 1
School Counsellor 1
School Administrative & Support Staff 7
Other positions
Total 32
The2014 Australian Education Regulation requires schools to report on Aboriginal composition of their workforce.
The Aboriginal composition of Como West Public teaching staff is nil.
Teacher qualifications
All teaching staff meet the professional requirements for teaching in NSW public schools.
Qualifications % of staff
Undergraduate degree or diploma 100%
Postgraduate degree 75%
Professional learning and teacher accreditation Significant funds were dedicated for staff professional learning across all subject areas. A total of $34,500 was expended.
Gender 2009 2010 2011 2012 2013 2014 2015
Male 150 164 166 163 175 176 165
Female 163 155 158 166 176 182 185
0
50
100
150
200
250
300
350
400
2009 2010 2011 2012 2013 2014 2015
Stu
den
ts
Year
Enrolments
Male Female
Year 2010 2011 2012 2013 2014 2015 K 96.9 96.0 94.2 96.5 97.8 96.9 1 97.2 95.8 95.5 96.4 98.4 95.6 2 96.8 95.9 95.6 95.9 97.5 96.3 3 96.5 96.5 96.9 96.8 97.5 95.1 4 94.8 95.6 97.3 96.6 97.9 95.4 5 96.0 94.9 96.9 96.6 97.7 96.5 6 93.8 93.4 94.3 96.5 98.0 97.4
Total 96.0 95.5 95.7 96.5 97.8 96.1 K 94.7 94.7 94.3 95.0 95.2 94.4 1 94.2 94.2 93.9 94.5 94.7 93.8 2 94.4 94.2 94.2 94.7 94.9 94.0 3 94.5 94.4 94.4 94.8 95.0 94.1 4 94.5 94.3 94.3 94.7 94.9 94.0 5 94.4 94.2 94.2 94.5 94.8 94.0 6 94 93.8 93.8 94.1 94.2 93.5
Total 94.4 94.3 94.2 94.7 94.8 94.0
Stat
e D
oE
Sch
oo
l

Financial information
Financial summary
This summary covers funds for operating costs and does not involve expenditure areas such as permanent salaries, building and major maintenance.
A full copy of the school’s 2015 financial statement is tabled at the annual general meetings of the parent and/or community groups. Further details concerning the statement can be obtained by contacting the school.
School performance
School-based assessment
NAPLAN
In the National Assessment Program, the results across the Years 3, 5, 7 and 9 literacy and numeracy assessments are reported on a scale from Band 1 to Band 10. The achievement scale represents increasing levels of skills and understandings demonstrated in these assessments.
The My School website provides detailed information and data for national literacy and numeracy testing. Click on the link My School and insert the school name in the Find a school and select GO to access the school data.
NAPLAN - Literacy (including Reading, Writing, Spelling and Grammar and Punctuation)
Date of financial summary 30/11/2015
Income $
Balance brought forward 182648.53
Global funds 208770.54
Tied funds 168901.71
School & community sources 227196.41
Interest 4791.83
Trust receipts 5306.35 Canteen 0.00
Total income 797615.37
Expenditure
Teaching & learning
Key learning areas 20895.39
Excursions 47897.94
Extracurricular dissections 96813.50
Library 8539.20
Training & development 1729.68
Tied funds 160543.92
Casual relief teachers 63613.74
Administration & office 104417.68
School-operated canteen 0.00
Utilities 44470.03
Maintenance 34404.59
Trust accounts 8133.95
Capital programs 16271.00
Total expenditure 607730.62
Balance carried forward 189884.75
0
10
20
30
40
50
1 2 3 4 5 6
Pe
rce
nta
ge o
f st
ud
en
ts
Bands
Percentage in bands:Year 3 Reading
Percentage in Bands
School Average 2011-2015
SSG % in Bands 2015
State DoE % in Bands 2015
Notes: The 'Percentage in Bands' and 'School Average' columns are not shown where overall results are for less than 10 students.
State average band distributions do not include students who were exempted from the tests.
1 2 3 4 5 6
1 2 2 9 12 20
2.2 4.3 4.3 19.6 26.1 43.5
2.1 3.8 8.1 23.7 20.3 41.9
1.2 3.2 11.9 17.2 20.9 45.6
5.3 6.7 20.4 21.1 18.4 27.9
Year 3 NAPLAN Reading
Average score, 2015
Skill Band Distribution
Number in Bands
Percentage in Bands
School Average 2011-2015
SSG % in Bands 2015
State DoE % in Bands 2015
Band
422.4
State DoE
465.6
SSG
467.7
School

1 2 3 4 5 6
0 4 8 11 12 12
0.0 8.5 17.0 23.4 25.5 25.5
0.4 4.6 15.1 18.5 30.7 30.7
0.9 5.0 13.9 19.9 22.0 38.2
5.0 10.7 18.9 20.3 19.0 26.1
0.0 8.5 17.0 23.4 25.5 25.5
0.4 4.6 15.1 18.5 30.7 30.7
Skill Band Distribution
1 2 3 4 5 6
0 2 2 8 10 25
0.0 4.3 4.3 17.0 21.3 53.2
1.3 3.8 7.1 20.6 25.2 42.0
1.8 3.7 6.5 18.7 23.9 45.4
5.1 8.5 13.6 24.0 19.2 29.6
Year 3 NAPLAN Grammar and Punctuation
Band
Number in Bands
State DoE % in Bands 2015
SSG % in Bands 2015
Percentage in Bands
Number in Bands
Band
School Average 2011-2015
Percentage in Bands
SSG State DoE
Average score, 2015 475.8 476.0 431.7
School
State DoE
Average score, 2015 427.5 448.2 413.3
Year 3 NAPLAN Spelling
School SSG
Skill Band Distribution
School Average 2011-2015
SSG % in Bands 2015
State DoE % in Bands 2015
0
5
10
15
20
25
30
35
40
45
1 2 3 4 5 6
Pe
rce
nta
ge o
f st
ud
en
ts
Bands
Percentage in bands:Year 3 Spelling
Percentage in Bands
School Average 2011-2015
SSG % in Bands 2015
State DoE % in Bands 2015
Skill Band Distribution
1 2 3 4 5 6
0 0 5 9 18 15
0.0 0.0 10.6 19.1 38.3 31.9
1.7 2.1 9.2 16.0 42.9 28.2
0.5 1.5 10.6 18.2 46.4 22.8
2.3 5.1 18.5 23.6 36.3 14.2
School Average 2011-2015
State DoESSG
444.6 417.1
Band
Number in Bands
Percentage in Bands
SSG % in Bands 2015
State DoE % in Bands 2015
School
Average score, 2015 454.6
Year 3 NAPLAN Writing
Notes: The 'Percentage in Bands' column is not shown where overall results are for less than 10 students.
State band distributions do not include students who were exempted from the tests.
0
10
20
30
40
50
60
1 2 3 4 5 6
Pe
rce
nta
ge o
f st
ud
en
ts
Bands
Percentage in bands:Year 3 Grammar & Punctuation
Percentage in Bands
School Average 2011-2015
SSG % in Bands 2015
State DoE % in Bands 2015
0
10
20
30
40
50
1 2 3 4 5 6
Pe
rce
nta
ge o
f st
ud
en
ts
Bands
Percentage in bands:Year 3 Writing
Percentage in Bands
School Average 2011-2015
SSG % in Bands 2015
State DoE % in Bands 2015
Notes: The 'Percentage in Bands' column is not shown where overall results are for less than 10 students.
State band distributions do not include students who were exempted from the tests.

3 4 5 6 7 8
2 4 9 10 21 5
3.9 7.8 17.6 19.6 41.2 9.8
1.9 4.4 17.5 27.7 33.0 15.5
1.0 6.4 15.5 25.2 33.0 18.8
5.7 11.6 20.4 24.3 25.5 12.4
Year 5 NAPLAN Spelling
529.9
Percentage in Bands
School Average 2011-2015
School SSG State DoE
Average score, 2015 515.1 501.4
Skill Band Distribution
Band
SSG % in Bands 2015
State DoE % in Bands 2015
Number in Bands
Skill Band Distribution
3 4 5 6 7 8
1 3 11 9 9 18
2.0 5.9 21.6 17.6 17.6 35.3
1.9 3.4 11.7 26.2 29.1 27.7
2.2 5.4 17.3 23.0 25.3 26.8
8.2 12.3 23.5 20.7 18.8 16.5
SSG State DoE
500.9
School
541.5 540.7
Number in Bands
Percentage in Bands
School Average 2011-2015
SSG % in Bands 2015
State DoE % in Bands 2015
Year 5 NAPLAN Grammar and Punctuation
Band
Average score, 2015
3 4 5 6 7 8
0 5 8 10 9 19
0.0 9.8 15.7 19.6 17.6 37.3
1.0 5.3 14.5 31.9 23.2 24.2
1.9 8.0 15.6 23.2 25.6 25.7
5.8 17.3 21.4 20.9 18.7 15.9
543.5Average score, 2015
Year 5 NAPLAN Reading
State DoESSGSchool
494.3530.0
SSG % in Bands 2015
Skill Band Distribution
Band
Number in Bands
Percentage in Bands
State DoE % in Bands 2015
School Average 2011-2015
Notes: The 'Percentage in Bands' and 'School Average' columns are not shown where overall results are for less than 10 students.
State average band distributions do not include students who were exempted from the tests.
0
10
20
30
40
3 4 5 6 7 8
Pe
rce
nta
ge o
f st
ud
en
ts
Bands
Percentage in bands:Year 5 Reading
Percentage in Bands
School Average 2011-2015
SSG % in Bands 2015
State DoE % in Bands 2015
0
10
20
30
40
50
3 4 5 6 7 8
Pe
rce
nta
ge o
f st
ud
en
ts
Bands
Percentage in bands:Year 5 Spelling
Percentage in Bands
School Average 2011-2015
SSG % in Bands 2015
State DoE % in Bands 2015
0
10
20
30
40
3 4 5 6 7 8
Pe
rce
nta
ge o
f st
ud
en
ts
Bands
Percentage in bands:Year 5 Grammar & Punctuation
Percentage in Bands
School Average 2011-2015
SSG % in Bands 2015
State DoE % in Bands 2015
Notes: The 'Percentage in Bands' and 'School Average' columns are not shown where overall results are for less than 10 students.
State average band distributions do not include students who were exempted from the tests.
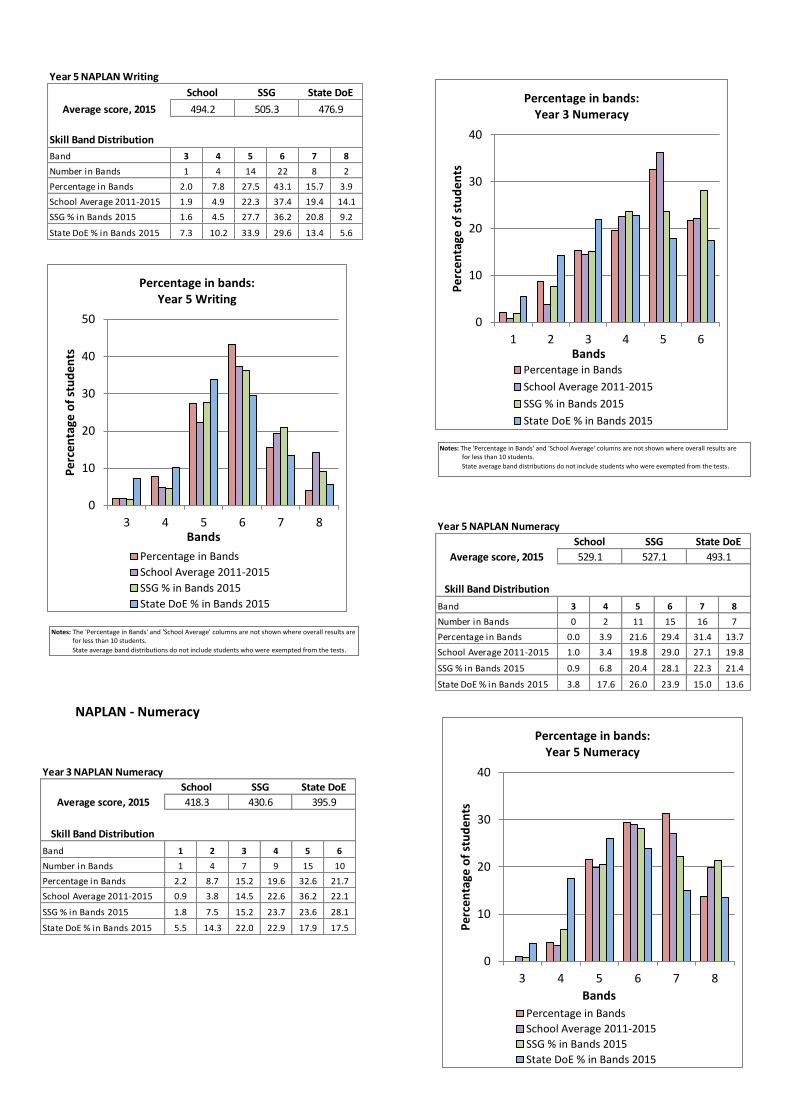
3 4 5 6 7 8
0 2 11 15 16 7
0.0 3.9 21.6 29.4 31.4 13.7
1.0 3.4 19.8 29.0 27.1 19.8
0.9 6.8 20.4 28.1 22.3 21.4
3.8 17.6 26.0 23.9 15.0 13.6
Year 5 NAPLAN Numeracy
527.1529.1
School State DoE
Skill Band Distribution
Average score, 2015
SSG
SSG % in Bands 2015
Number in Bands
Percentage in Bands
School Average 2011-2015
State DoE % in Bands 2015
Band
493.1
0
10
20
30
40
3 4 5 6 7 8
Pe
rce
nta
ge o
f st
ud
en
ts
Bands
Percentage in bands:Year 5 Numeracy
Percentage in Bands
School Average 2011-2015
SSG % in Bands 2015
State DoE % in Bands 2015
NAPLAN - Numeracy
Notes: The 'Percentage in Bands' and 'School Average' columns are not shown where overall results are for less than 10 students.
State average band distributions do not include students who were exempted from the tests.
0
10
20
30
40
50
3 4 5 6 7 8
Pe
rce
nta
ge o
f st
ud
en
ts
Bands
Percentage in bands:Year 5 Writing
Percentage in Bands
School Average 2011-2015
SSG % in Bands 2015
State DoE % in Bands 2015
Notes: The 'Percentage in Bands' and 'School Average' columns are not shown where overall results are for less than 10 students.
State average band distributions do not include students who were exempted from the tests.
0
10
20
30
40
1 2 3 4 5 6
Pe
rce
nta
ge o
f st
ud
en
ts
Bands
Percentage in bands:Year 3 Numeracy
Percentage in Bands
School Average 2011-2015
SSG % in Bands 2015
State DoE % in Bands 2015
Skill Band Distribution
3 4 5 6 7 8
1 4 14 22 8 2
2.0 7.8 27.5 43.1 15.7 3.9
1.9 4.9 22.3 37.4 19.4 14.1
1.6 4.5 27.7 36.2 20.8 9.2
7.3 10.2 33.9 29.6 13.4 5.6
School Average 2011-2015
Year 5 NAPLAN Writing
505.3 476.9Average score, 2015
Number in Bands
Percentage in Bands
SSG % in Bands 2015
State DoE % in Bands 2015
Band
School SSG State DoE
494.2
1 2 3 4 5 6
1 4 7 9 15 10
2.2 8.7 15.2 19.6 32.6 21.7
0.9 3.8 14.5 22.6 36.2 22.1
1.8 7.5 15.2 23.7 23.6 28.1
5.5 14.3 22.0 22.9 17.9 17.5
Skill Band Distribution
State DoE % in Bands 2015
SSG % in Bands 2015
School Average 2011-2015
Percentage in Bands
Number in Bands
Band
SSG
430.6
School
418.3
Year 3 NAPLAN Numeracy
Average score, 2015
State DoE
395.9

2009-2011 2010-2012 2011-2013 2012-2014 2013-2015
School 85.7 90.1 76.3 92.9 78.0
SSG 70.8 93.4 84.5 77.3 84.7
State DoE 75.4 95.4 84.9 80.6 83.9
2009-2011 2010-2012 2011-2013 2012-2014 2013-2015
School 92.3 85.9 94.6 98.7 91.5
SSG 81.6 85.9 81.5 76.3 77.6
State DoE 82.7 81.3 79.4 79.5 71.2
Average progress in Spelling
between Year 3 and 5*
Average progress in Grammar & Punctuation
between Year 3 and 5*
0
50
100
150
2009-2011 2010-2012 2011-2013 2012-2014 2013-2015
Pro
gre
ss
Average progress in Spelling between Year 3 and 5
School SSG State DoE
0
50
100
150
2009-2011 2010-2012 2011-2013 2012-2014 2013-2015
Pro
gre
ss
Average progress in Grammar & Punctuation between Year 3 and 5
School SSG State DoE
Percentage of Year 5 students achieving at or above minimum standard (exempt students
included)
Reading 100.0
Writing 98.0
Spelling 96.1
Grammar & Punctuation 98.0
Numeracy 100.0
2011-2013 2012-2014 2013-2015
School 41.6 45.1 53.9
SSG 63.5 51.3 63.0
State DoE 55.2 49.3 61.3
Average progress in Writing
between Year 3 and 5*
2009-2011 2010-2012 2011-2013 2012-2014 2013-2015
School 71.0 70.2 62.1 99.2 97.3
SSG 74.0 81.5 81.2 79.2 77.8
State DoE 74.0 79.2 85.7 78.8 76.4
2009-2011 2010-2012 2011-2013 2012-2014 2013-2015
School 88.2 91.8 98.9 107.9 105.4
SSG 98.2 103.6 104.4 91.8 98.1
State DoE 95.8 98.2 89.7 89.1 94.1
Average progress in Reading
between Year 3 and 5*
Average progress in Numeracy
between Year 3 and 5*
0
50
100
150
2009-2011 2010-2012 2011-2013 2012-2014 2013-2015
Pro
gre
ss
Average progress in Reading between Year 3 and 5
School SSG State DoE
0
50
100
150
2009-2011 2010-2012 2011-2013 2012-2014 2013-2015
Pro
gre
ss
Average progress in Numeracy between Year 3 and 5
School SSG State DoE
* Average progress data is for matched students from within the school.
Note: For cohorts of less than 10 students, the average progress graphs should not be displayed in the ASR.
97.8
100.0
100.0
100.0
97.8
Percentage of Year 3 students achieving at or
above minimum standard (exempt students
included)
Reading
Writing
Spelling
Grammar & Punctuation
Numeracy
0
100
2011-2013 2012-2014 2013-2015Pro
gre
ss
Average progress in Writing between Year 3 and 5
School SSG State DoE

Parent/caregiver, student, teacher satisfaction
Each year schools are required to seek the opinions of parents, students and teachers about the school. Their responses are presented below.
Staff Survey Results
STATEMENT:
Strongly Agree
Agree
1. The students are the school’s main concern.
86.67% 13.33%
2. The school is connected to its community and welcomes parental involvement.
80.00% 13.33%
3. I have extensive data to discuss a child’s progress with parents.
40.00% 60.00%
4. The school is a friendly school that is tolerant and accepting of all students.
80.00% 20.00%
5. The school has effective welfare programs.
40.00% 53.33%
6. The school teaches and promotes positive values.
86.67% 13.33%
7. The school has a safe and secure learning environment.
80.00% 20.00%
8. Fair discipline exists within the school.
53.33% 40.00%
9. Students at Como West are well behaved and respectful.
26.67% 73.33%
10. The school offers appropriately challenging and supportive programs for its students.
53.33% 46.67%
11. The school maintains a focus on literacy and numeracy.
80.00% 20.00%
12. The school has high expectations for its students and expects them to give their best.
66.67% 33.33%
13. Teachers provide extra support to students who need it.
86.67% 13.33%
14. A wide range of extra curricula programs are being offered e.g. sport, public speaking, music, dance.
93.33% 6.67%
15. There is good student access to computers and strong technology programs and resources.
40.00% 53.33%
16. The school promotes a healthy lifestyle.
40.00% 60.00%
17. The school always aims to improve the quality of teaching and learning.
66.67% 33.33%
18. Como West PS is a good school.
80.00% 20.00%
Student Survey Results
STATEMENT:
Strongly Agree
Agree
1. The teachers are concerned about me.
31.68% 35.15%
2. The school likes parents being part of our school.
50.99% 45.54%
3. My teacher talks to me about my progress.
36.14% 52.97%
4. The school is a friendly school that accepts all students.
62.00% 33.00%
5. The school has good programs that help improve our leadership skills, awareness of safety and ability to care for others.
59.70% 35.82%
6. The school teaches and promotes positive values.
48.99% 42.93%
7. The school has a safe and secure learning environment.
50.00% 43.50%
8. The rules are fair in the school.
43.50% 44.00%
9. Students at Como West are well behaved and respectful.
25.00% 58.50%
10. The school offers appropriately challenging and supportive programs for its students.
44.28% 50.25%

11. The school focuses on literacy and numeracy.
42.71% 47.74%
12. The school expects us to “give our best” always.
77.72% 20.30%
13. Teachers provide extra support to students who need it.
56.93% 39.60%
14. A wide range of extra curricula programs are being offered e.g. sport, public speaking, music, dance.
57.07% 37.37%
15. There is good student access to computers and strong technology programs and resources.
52.97% 42.08%
16. The school promotes a healthy lifestyle.
48.76% 45.77%
17. Como West PS is a good school.
70.85% 21.61%
Parent Survey Results
STATEMENT:
Strongly Agree
Agree
1. The students are the school’s main concern.
35.29% 55.88%
2. The school is connected to its community and welcomes parental involvement.
34.29% 57.14%
3. I find it easy to contact the school to discuss concerns relating to my child.
28.57% 51.43%
4. The school is a friendly school that is tolerant and accepting of all students.
40.00% 48.57%
5.* The school has effective welfare programs.
5.71% 40.00%
6. The school teaches and promotes positive values.
40.00% 51.43%
7. The school has a safe and secure learning environment.
34.29% 60.00%
8. Fair discipline exists within the school.
20.59% 61.76%
9. Students at Como West are well behaved and respectful.
26.47% 67.55%
10.** The school offers appropriately challenging and supportive programs for its students.
14.29% 51.43%
11. The school maintains a focus on literacy and numeracy.
25.71% 57.14%
12. The school has high expectations for its students and expects them to give their best.
37.14% 51.43%
13.*** Teachers provide extra support to students who need it.
17.14% 48.57%
14. A wide range of extra curricula programs are being offered e.g. sport, public speaking, music, dance.
45.71% 45.71%
15.**** There is good student access to computers and strong technology programs and resources.
28.57% 57.14%
16. The school promotes a healthy lifestyle.
34.29% 62.86%
17. The school always aims to improve the quality of teaching and learning.
20.59% 64.71%
18. Como West PS is a good school.
57.14% 31.43%
Only 34 parents responded to the survey. 5. * 34.29% of parents indicated that they didn’t know
if the school had effective welfare programs. 10.** 11.43% of parents indicated that they don’t know if
the school offers appropriately challenging and supportive programs.
13.*** 17.14% of parents indicated that they didn’t know
if the teachers provide extra support to students who need it.
15.**** 11.43% of parents indicated that they didn’t know if there is good student access to computers and strong technology programs and resources

Policy requirements
Aboriginal education
Aboriginal Education
Throughout the year the school has emphasised the importance of our rich indigenous culture by ensuring Aboriginal education has been integrated across all Key Learning Areas.
Students have been instructed in the knowledge of past and present Aboriginal perspectives through providing quality Aboriginal literature and programs.
Students’ recognised Sorry Day, NAIDOC week and Harmony Day, and participated in various associated activities.
Students participated in Yarn Up, a public speaking program that enhances students’ confidence and public speaking abilities, through various workshops. At the end of this program, prepared and impromptu speeches were presented at New South Wales Parliament House.
Our program at Como West Public School fosters understanding, awareness and respect for Aboriginal people. Students are taught to be tolerant of other people’s beliefs, while gaining a greater knowledge and understanding of Australia’s rich, indigenous culture.
Multicultural Education and Anti-racism
Our school has a range of programs and practices which promote inclusivity, cultural awareness, diversity and respect for the cultures and beliefs of all members of the school community.
It is acknowledged that the cultures and beliefs of all individual members of the school enrich our whole community.
We value both similarities and differences. Students from diverse backgrounds are encouraged to be proud of their heritage and to share their customs and beliefs.
Values
Values are taught explicitly in classrooms and through the activities and relationships of the school and its community. Como West Public School has respect and responsibility, along with the other core values of care, integrity and excellence embedded in all its programs and practices.
Programs such as the Student Representative Council, Peer Support, Kindergarten Buddies, election of school Parliament and House Captains foster our school values. Special events including
weekly K - 6 assemblies, Harmony Day, Education Week Open Day, Grandparents’ Day, ANZAC Day and Remembrance Ceremonies upheld the values of respect and responsibility. Students are also taught about safe and respectful relationships and anti-bullying strategies. Students have clear rewards for positive behaviour and are encouraged to accept responsibility for their actions.
Other school programs - The Arts
Band Dance Film By The Sea Choir Public Speaking Debating
Band In 2015, the Como West Public School Band continued their association with Engadine Music. As band director, Mrs Joanne Holloway, provided individual instrument tutors for the students. There was a total of 47 students enrolled in the band. The performing band consisted of 26 students and the training band consisted of 21 students with one performing band member joining the training band to learn another instrument. The training and performing bands participated in the Engadine Music Band Festival with the training band receiving gold and performing band receiving silver awards. Band equipment continued to be updated with the purchase of various percussion instruments. The bands played at Grandparents’ Day, Open Day, The Big Day Out and our presentation evening. During the year, the training and performing bands also showcased their talents in a band evening in the school hall. Performing band members attended a combined schools’ band camp at Stanwell Tops, culminating in a performance for parents. In lieu of this, the training band along with three other schools, took part in Bandtastic at Heathcote PS, where they learned a variety of pieces to perform for parents and friends.

Dance In 2015, 120 students represented the school in three dance ensembles: Junior (Y 1-2), Intermediate (Y 3-4), Senior (Y 5-6) and one Hip Hop dance group. Each ensemble participated in weekly classes under the instruction of professional dance teachers from Ettinghausen’s Dynamic Arts. Students in Years 3-6 were given the opportunity to participate in Hip Hop dance classes taught by Pulse Studios. This year saw 10 girls participating in Hip Hop, eight more than in 2014. Students from all dance groups performed for the school community on Open Day for Education Week, Grandparents’ Day and on our annual school Presentation Night. Students from the Hip Hop, Junior, Intermediate and Senior groups danced at the Kurranulla Dance Festival and the Dance Extravaganza at the Sutherland Entertainment Centre. At Kurranulla, the a competitive dance event, the Junior ensemble won a gold award and were awarded third place in the overall junior division. The Intermediate and Senior ensembles were awarded gold and the Hip Hip group won a bronze award. Twelve dance students successfully auditioned for Schools Spectacular performing in the Matilda Segment for this year’s This is Our World production. Students were involved in four shows over two days at Qantas Credit Union Arena, performing with thousands of dancers from across New South Wales.
Film By The Sea
Film by the Sea is a short film festival that celebrates our city by the sea. Short films are prepared and presented by primary school students from the Sydney region. The project aims to promote student engagement and develop visual literacy through the use of film technology as well as promote collaboration within and between schools. In Term 3, a Year 1 class and Stage 3 students entered films for the festival. The students learnt about the film-making process. They made and submitted their movies, ‘Believe in Your #Selfie’ and ‘I’d Rather.’ The Stage 3 film was shortlisted to be included in the festival. Parents, students and the teachers involved, attended the premiere on 27 October.
Choir
The Choir trained weekly throughout the year to improve vocal control and develop a song repertoire. Students participated in a combined schools’ choir at the Sutherland Shire Schools’ Music Festival held in Term 3. The choirs also performed at K-6 assemblies, Education Week, Open Day and Grandparents’ Day. This year, 46 students participated in the Choir program.

Public Speaking Como West Public School enjoys a fine reputation for public speaking in the Sutherland Shire. This is largely due to its commitment to a whole school public speaking program. As part of the school’s scope and sequence in Speaking and Listening, students from K‐6 participate in an intensive public speaking program in Term 3 each year. Students learn about speech structure and preparation and have many opportunities to develop their presentation skills through a range of stage appropriate speaking and listening activities within the classroom. An information brochure with helpful guidelines for both students and parents was sent home in Term 2 to assist with understanding the requirements of prepared and impromptu speeches. All students participated in their class public speaking activity and finalists were selected to go on to the stage-based competition. From this level, one student from each stage was chosen to represent Como West Public School at the area final. In 2015, Early Stage 1 students were included in area finals for the first time - with success. Two students achieved Highly Commended at the area finals. Students at Como West Public School also participated in the Multicultural Perspectives Public Speaking Competition. Four students went on to represent our school at this competition.
Debating Como West Public School continued its participation in the local Debating Competition which included Jannali East Public School and Woronora River Public School. Students from each school participated in three rounds of debates held at the schools. Our debating team consisted of seven students from Years 3 ‐ 6. The team met and practised for one hour each Wednesday morning before school during Terms 2 and 3. All students involved in the inter‐school competition developed more effective debating skills and an understanding of the roles of each speaker in a debate. They grew in self-confidence and in their understanding of world issues from a global and local perspective. The debating team enjoyed the opportunity to meet students from Jannali East Public School and Woronora River Public School. The competition was both friendly and rewarding.
Sport Our school provides a range of sporting opportunities.
In Term 4, 95 Stage 1 students participated in a
weekly School Swimming Scheme at Sutherland
Leisure Centre. All ability levels were catered for and
water safety was an integral part of each lesson.
The students were presented with a Certificate of
Participation.

The school Swimming Carnival was held in Term 1 at
Engadine Leisure Centre. 27 students (17 boys and
15 girls) went on to represent our school at the Zone
Swimming Carnival. 5 students (1 boy and 4 girls)
progressed to the Area Swimming Carnival. Como
West Public School was placed second at the
Sutherland Zone Carnival.
The Cross Country event was held at our school due
to poor weather in Term 2. Approximately 200
students participated in the various age races. 32
students, four boys and four girls from each age
group, represented the school at the Sutherland
Zone carnival. Of the 32 students, 5 finished in the
top six of their respective races and qualified to
compete at the Area carnival. One student qualified
as a reserve runner for the State carnival. Como
West Public School was placed fifth at the
Sutherland Zone Cross Country Carnival.
The annual K-6 Athletics Carnival was held in Term 3
at the Sylvania Athletics Complex. One student
broke two school records (Senior Girls 800m and
Senior Girls High Jump). Of the school competitors,
45 athletes went to the Zone Carnival and seven
athletes were representatives in the Sutherland
Zone team at the Sydney East Area Carnival held at
Homebush Olympic Park. Two students were
selected to compete at the State Carnival that was
also held at Homebush Olympic Park.
In Term 1 there was a modified competition that
included junior and senior girls touch, junior boys
kanga cricket and senior boys softball. These sports
were non-competitive. In Term 2, the winter
Cronulla/Sutherland PSSA competition had four
netball teams: two junior and two senior teams that
played in Division 2. There was also a junior and a
senior soccer team that played in Division 1. In
summer PSSA, there were teams for boys and girls
teeball, senior girls softball, senior open cricket and
four basketball teams (junior and senior boys and
girls).

The Senior B netball team lost their semi-final and
placed fourth in the competition. The Senior A team
finished third in the competition. Junior girls
basketball teams competed in the Grand Finals.
There were several students selected in various
Sutherland zone sport teams. These included: tennis
(1), cricket (1), boys basketball (3), girls touch (1)
boys softball (2), girls softball (5), rugby league (1).
There were several students selected in six Sydney
East regional teams. These included: softball (1),
water polo (1), touch football (1), rugby league (1)
athletics (2) basketball (1).
In Term 1, five teams (three boys and two girls
teams) competed in a Sharks Basketball tournament.
Throughout the year, Como West Public School
integrated a focus activity/sport for Terms 1 - 4. In
Term 1 there was Bounce gymnastics for Years 3 – 6
and in Term 3 it was a similar program for K – 2
students. There was also a stage based dance
program called ‘Footsteps’ that focused on
presenting an item for Grandparents’ Day. Term 2
had a Little Athletics program for K – 6 and Term 3
had a basketball skills program for students in Years
3 – 6. A dance/fitness program (Dance2BFit) was
organised for Stage 2 and Stage 3 in Term 4.
All students participated in the Premier’s Sporting
Challenge. All students K - 6 were required to
document the amount of time that they spent per
day engaged in physical activity over a ten week
period in Term 3. Bronze, Silver, Gold and Diamond
Certificates were awarded to 3 -6 students according
to the level of achievement attained. All K – 2
students who completed the challenge received a
certificate.