commuting in america 2013 alan e. pisarski preserving the american dream oct 2013
TRANSCRIPT

COMMUTING IN AMERICA 2013
ALAN E. PISARSKI
PRESERVING THE AMERICAN DREAMOct 2013

New approach for CIA based on ACS structure
Not just a book – a series of 16 briefs Briefs are backed by data sets All are downloadable and FREE Co-authored with Dr. Steven Polzin of USF Housed at AASHTO; Supported by the CTPP The intent is continuity for CIA into the future Ability to do updates as data arrive Reports now dated rather than numbered Hello CIA 2013; Good-bye CIA IV

AVAILABILITY Commuting in America 2013
BRIEF NUMBER
COMMUTING IN AMERICA 2013 Products PDF Availability Supporting Data*
1 Introduction Available Now html excel
2 The Role of Commuting in Overall Travel
Available Now html excel
3 Population and Worker Patterns Available Now html excel4 Population and Worker Dynamics Available Now html excel5 The Nature and Pattern of Jobs Nov 2013 html excel6 Job Dynamics Nov 2013 html excel7 Vehicle and Transit Availability Available Now html excel
8 Consumer Spending on Transportation
Nov 2013 html excel
9 How Commuting Influences Travel Dec 2013 html excel10 Commuting Mode Choice Nov 2013 html excel
11 Commuting Departure Time and Trip Time
Nov 2013 html excel
12 Auto Commuting Nov 2013 html excel13 Transit Commuting Nov 2013 html excel14 Bicycling and Walk Commuting Dec 2013 html excel15 Commuting Flow Patterns Dec 2013 html excel
16 The Evolving Role of Commuting Dec 2013 html excel

An attempt at estimating total shares of travel
Table 2-1 Commuting in Perspective
Travel by All Modes 2009 Private Vehicle Travel 2009
Percent of Person Trips
Percent of Person Miles of Travel
Percent of Person Travel Time
Percent of Person Travel Time
Percent of VMT
Percent of Total Roadway VMT
15.6 19.0 18.8 17.9 27.8
761
3.0 6.3 4.6 5.2 9
81.4 74.7 76.6 76.9 63.2
100% 100% 100% 100% 100%
Public and Commercial TravelPublic Vehicle Travel 22
Utility/Service Travel 123
Freight and Goods Movement Travel 104
Total 100%Sources: NHTS 2009, FHWA State Statistical Abstracts, FHWA
1FHWA estimate based on NHTS data.2FHWA estimate using vehicle registration data.3FHWA estimate based on HPMS data and NHTS.4FHWA estimate based on HPMS data.
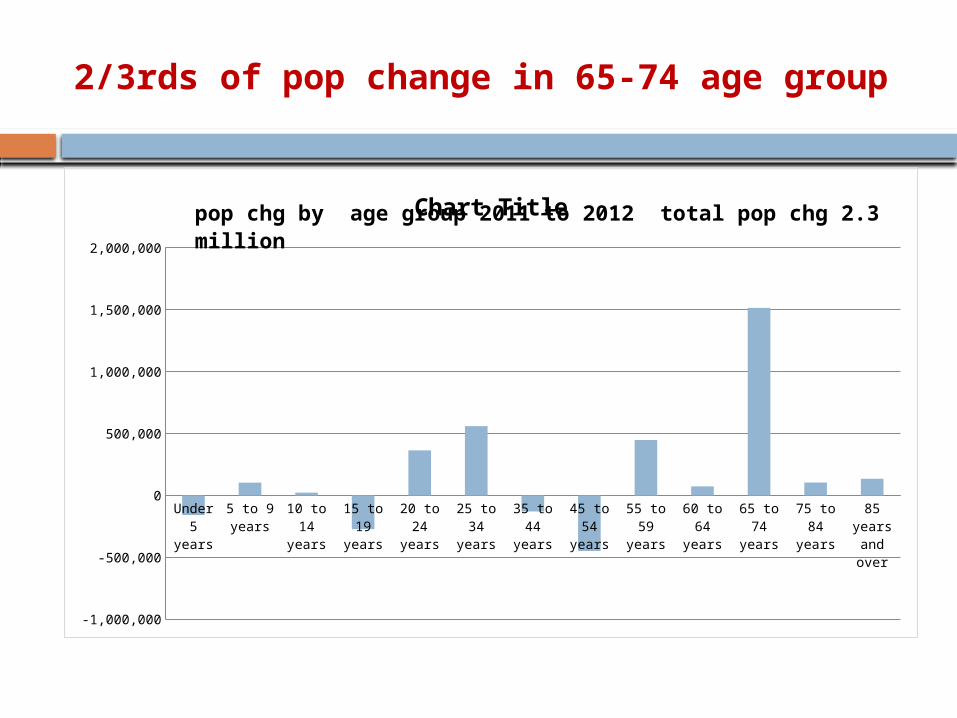
2/3rds of pop change in 65-74 age group
Under 5 years
5 to 9 years
10 to 14 years
15 to 19 years
20 to 24 years
25 to 34 years
35 to 44 years
45 to 54 years
55 to 59 years
60 to 64 years
65 to 74 years
75 to 84 years
85 years and over
-1,000,000
-500,000
0
500,000
1,000,000
1,500,000
2,000,000
Chart Titlepop chg by age group 2011 to 2012 total pop chg 2.3 million

Census Projections
2010-2015 2015-2020 2020-2025 2025-20300
0.5
1
1.5
2
2.5
3
3.5
4
4.5
5
4.399
2.618
1.39799999999999
2.18300000000002
5 YR CHG WORKFORCE AGE GROUP 18-64 (mil-lions)
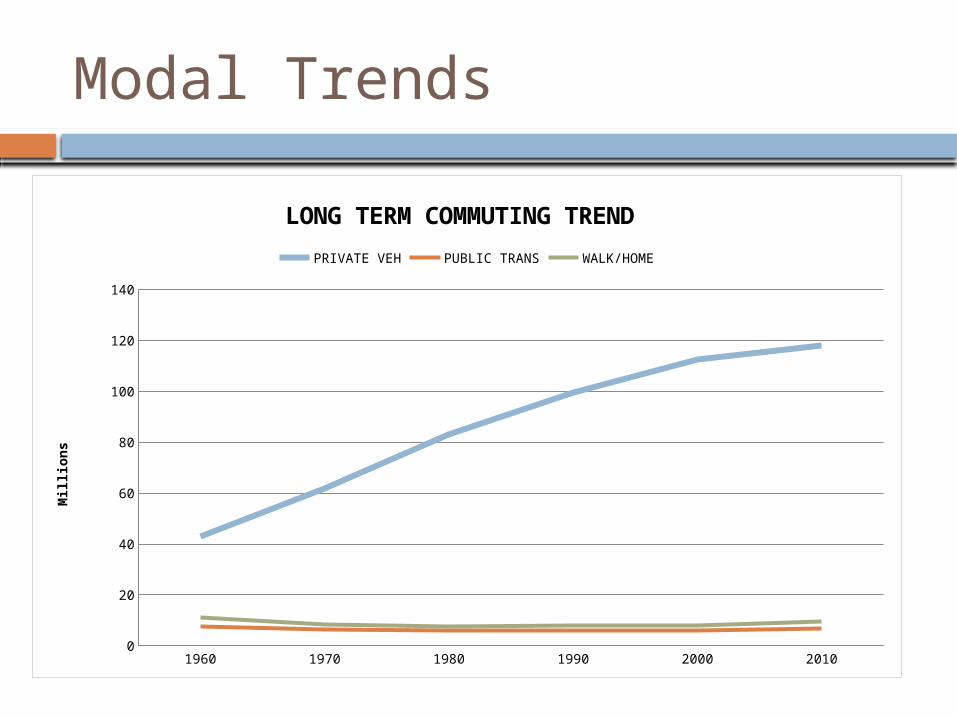
Modal Trends
1960 1970 1980 1990 2000 20100
20
40
60
80
100
120
140
LONG TERM COMMUTING TREND
PRIVATE VEH PUBLIC TRANS WALK/HOME
Millions

2.6 million new commuters in 2012
drove alone carpooled Public transportation Walked Other means Worked at home0
200,000
400,000
600,000
800,000
1,000,000
1,200,000
1,400,000
1,600,000
1,800,000
2,000,0001,820,866
288,289
97,478 81,089155,445 149,814
NET CHANGE IN COMMUTERS by MODE 2011 TO 2012; TOTAL = 2.6 MILLION

The major Group
1980 1990 2000 2010 0%
10%
20%
30%
40%
50%
60%
70%
80%
90%
64.4%
73.2% 75.7%76.6%
19.7%13.4% 12.2%
9.7%
Drive Alone Carpool
Mode S
hare

The Intermediate and Minor Groups
1980 1990 2000 2010 0%
1%
2%
3%
4%
5%
6%
7%
6.2%
5.1%
4.6%
4.9%5.6%
3.9%
2.9% 2.8%
2.3%
3.0%
3.3%
4.3%
Public Transportation Walk Work at Home Taxicab Motorcycle BicycleOther Means
Mode S
hare

What has happened
drove alone70%
carpooled11%
Public transportation 4%
Walked3%
Other means6%
Worked at home6%
MODAL SHARES OF CHANGE 2011 TO 2012

Testing “brand loyalty”
Table 10-3 “Usual” Versus Yesterdays’ Travel Mode, 2009 NHTS
“Usual” Commute Mode On Travel Day, Percent Commuted by
Drove Alone Carpool Transit WalkBicycle Other
Drive Alone 93.5 5.6 0.1 0.5 0.1 0.4
Carpool 42.9 54.8 0.5 1 0 0.8
Public Transportation 13.2 9.2 68.3 6.6 0.8 1.9
Walk 6.1 9.3 3.4 80.2 0.2 0.7
Bicycle 13.8 3.3 6 2.6 73 1.4
Other* 64.1 19 4.2 4.3 0.3 8
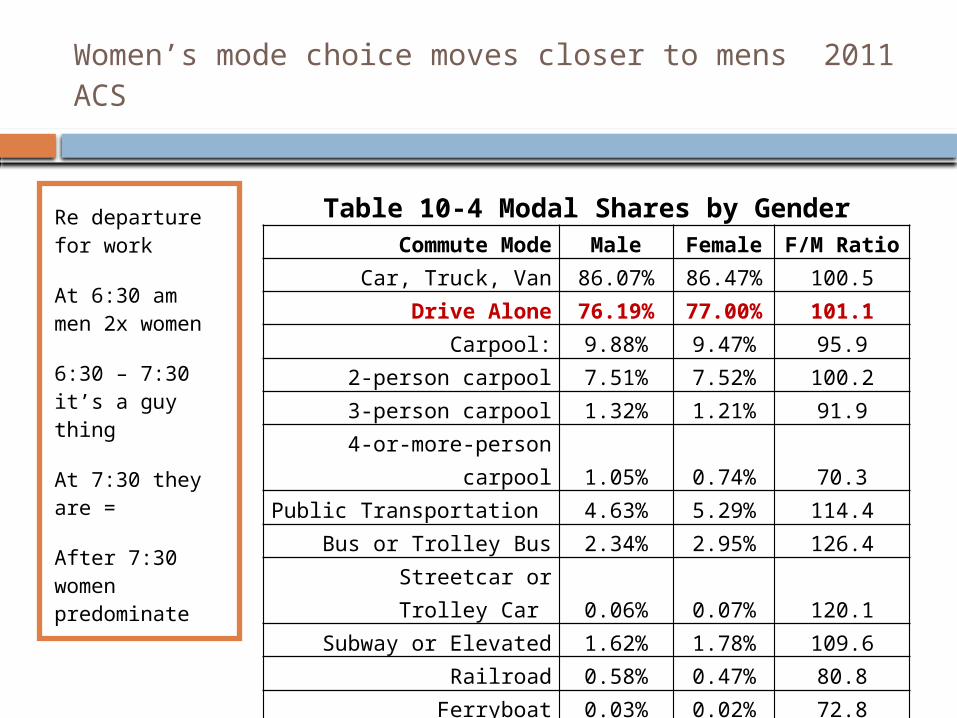
Women’s mode choice moves closer to mens 2011 ACS
Re departure for work
At 6:30 am men 2x women
6:30 – 7:30 it’s a guy thing
At 7:30 they are =
After 7:30 women predominate
Table 10-4 Modal Shares by Gender Commute Mode Male Female F/M Ratio
Car, Truck, Van 86.07% 86.47% 100.5Drive Alone 76.19% 77.00% 101.1
Carpool: 9.88% 9.47% 95.92-person carpool 7.51% 7.52% 100.23-person carpool 1.32% 1.21% 91.9
4-or-more-person carpool 1.05% 0.74% 70.3Public Transportation 4.63% 5.29% 114.4
Bus or Trolley Bus 2.34% 2.95% 126.4 Streetcar or Trolley Car 0.06% 0.07% 120.1
Subway or Elevated 1.62% 1.78% 109.6 Railroad 0.58% 0.47% 80.8
Ferryboat 0.03% 0.02% 72.8Bicycle 0.75% 0.30% 39.7
Walk 2.85% 2.68% 94.1Taxicab, Motorcycle, Other 1.44% 0.86% 59.4
Work at Home 4.26% 4.40% 103.1

A key guide to Commuter flows
1960 1970 1980 1990 2000 20100
5
10
15
20
25
30
35
40
0%
5%
10%
15%
20%
25%
30%
9.4
14.8
20.1
27.5
34.2
37.5
14.5%
19.2%20.8%
23.9%
26.7%27.4%
WORKERS LEAVING THEIR HOME COUNTY TO WORK IN MILLIONS

CIA started tracking this in 1990
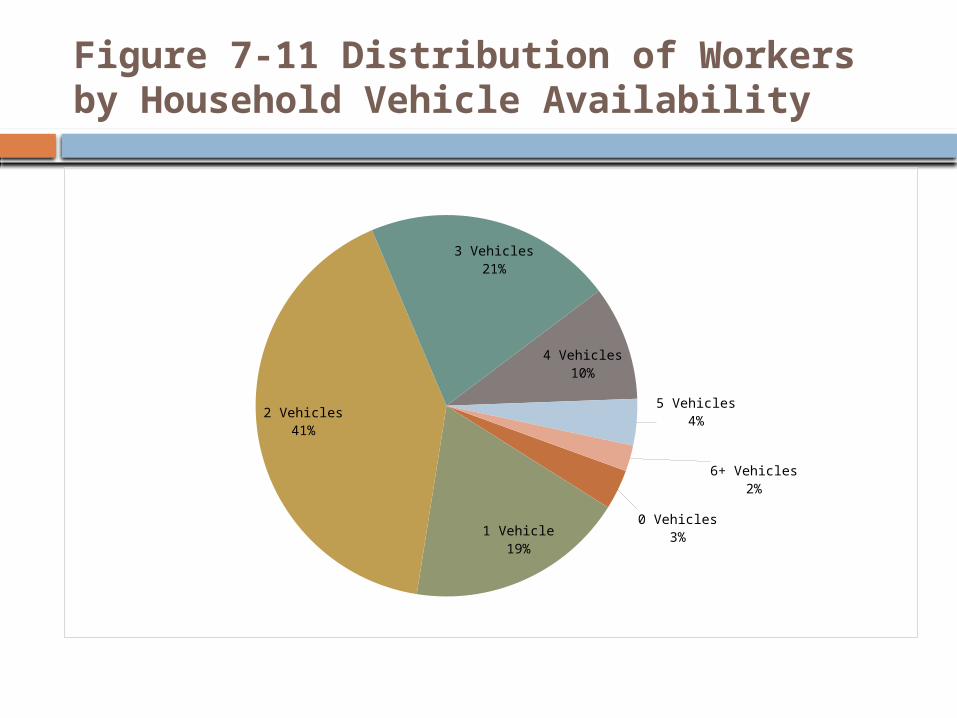
Figure 7-11 Distribution of Workers by Household Vehicle Availability
0 Vehicles3%
1 Vehicle19%
2 Vehicles41%
3 Vehicles21%
4 Vehicles10%
5 Vehicles4%
6+ Vehicles2%
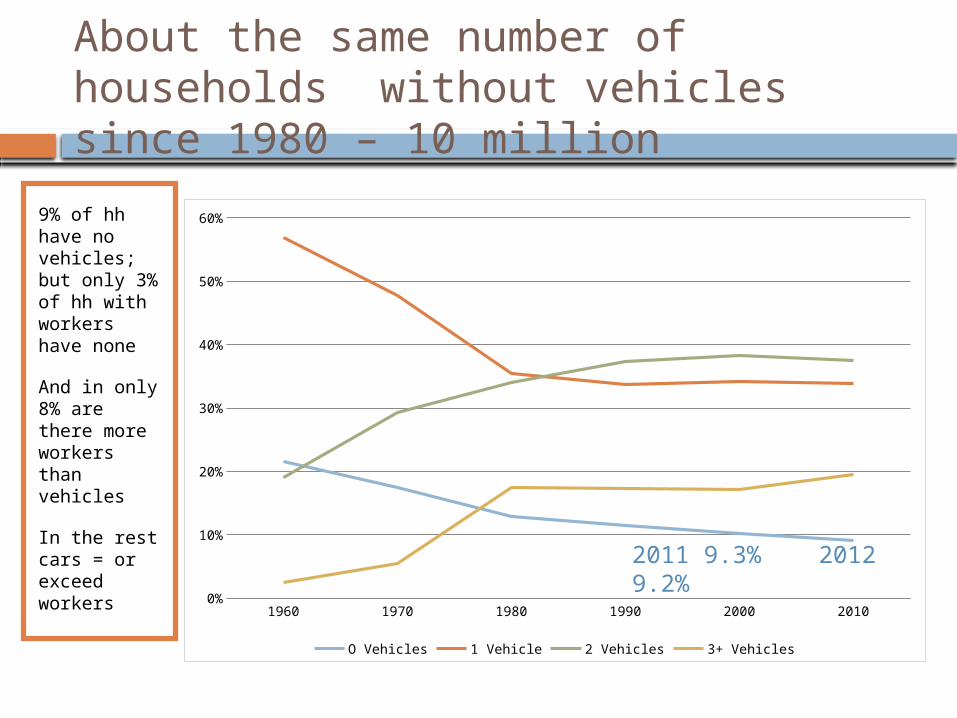
About the same number of households without vehicles since 1980 – 10 million
9% of hh have no vehicles; but only 3% of hh with workers have none
And in only 8% are there more workers than vehicles
In the rest cars = or exceed workers
1960 1970 1980 1990 2000 20100%
10%
20%
30%
40%
50%
60%
O Vehicles 1 Vehicle 2 Vehicles 3+ Vehicles
2011 9.3% 2012 9.2%

Figure 7-9 Long-Term Trend in Households with Zero Vehicles by
Racial/Ethnic Group
1970 1980 1990 2000 20100%
5%
10%
15%
20%
25%
30%
35%
40%
45%
50%
All Black Hispanic

DRAMATIC CHANGES IN TRAVEL TIMES
2000 2001 2002 2003 2004 2005 2006 2007 2008 2009 2010 20110
5
10
15
20
25
30
25.524.4 24.3 24.7 25.1 25 25.3 25.4 25.1 25.3 25.5
Average Travel Time - minutes - this decade
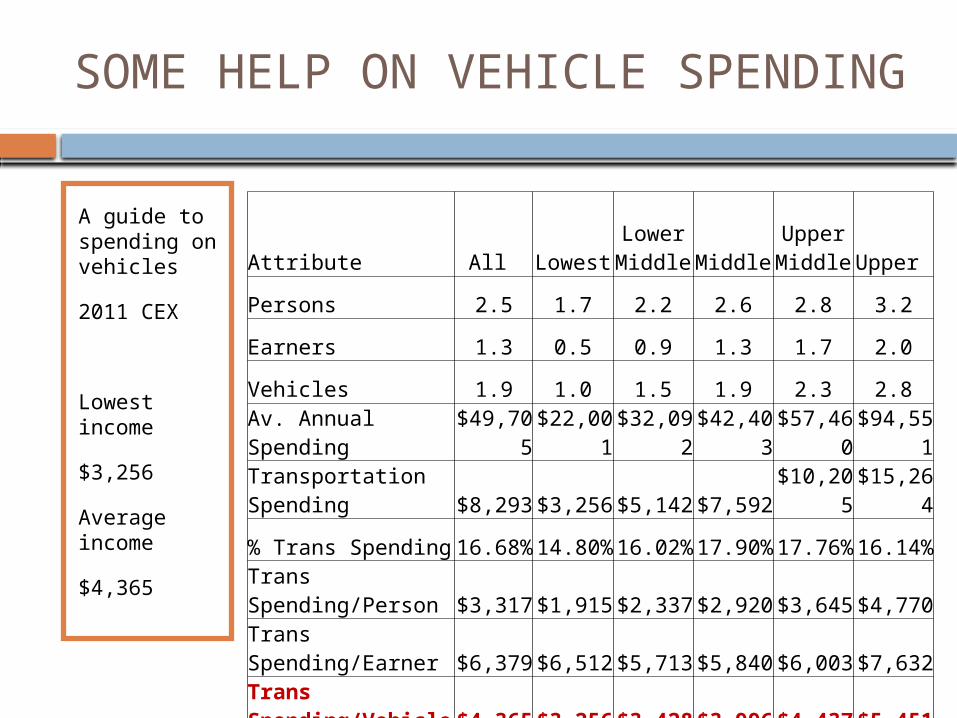
SOME HELP ON VEHICLE SPENDING
A guide to spending on vehicles
2011 CEX
Lowest income
$3,256
Average income
$4,365
Attribute All LowestLower Middle Middle
Upper Middle Upper
Persons 2.5 1.7 2.2 2.6 2.8 3.2
Earners 1.3 0.5 0.9 1.3 1.7 2.0
Vehicles 1.9 1.0 1.5 1.9 2.3 2.8
Av. Annual Spending $49,705 $22,001 $32,092 $42,403 $57,460 $94,551Transportation Spending $8,293 $3,256 $5,142 $7,592 $10,205 $15,264
% Trans Spending 16.68% 14.80% 16.02% 17.90% 17.76% 16.14%
Trans Spending/Person $3,317 $1,915 $2,337 $2,920 $3,645 $4,770
Trans Spending/Earner $6,379 $6,512 $5,713 $5,840 $6,003 $7,632
Trans Spending/Vehicle $4,365 $3,256 $3,428 $3,996 $4,437 $5,451

A QUICK VIEW OF SOME FINDINGS
Growing National Disparities 1000 counties lost population ; 1000 gained 97% of population More of >65 population is at work = circa 15% 28% of households have no workers 2/3rds of workers (93 million) live in households with other workers Commuting remains extremely important but it's share of travel appears to have
stabilized at levels meaningfully below those in prior decades. Personal vehicle commuting retains a dominant share; however, change is limited in
share Carpool losing market share until a 2012 uptick Women more oriented to SOV than men Women’s overall mode distribution moving closer to Men’s The transportation share of consumer spending declined w recession, now in rebound 2011 travel time = 25.5 minutes; identical to 2000 Walk to work (2.77%) share half of share in 1980 (5.6%) Work at home increases from 2 million in 80 to 6 in 2010 Workers working outside their county of residence quadrupled since 1960; now at 27%

Alan E. Pisarski
Thank you
Click icon to add picture
Isn’t it suspicious that the problem is always individual behavior and the solution is always government action? Robert Bradley Jr.