community workforce development report card · report card indicators for the ... percent of...
TRANSCRIPT

1 | P a g e
Community Workforce Development
Report Card
Indicators for the Region’s Talent Pipeline
For North Central Connecticut
2010
Developed in partnership with the community by
This year’s report has been prepared exclusively for the Hartford Business Journal.

2 | P a g e
Overview
This “indicator report” was developed in late 2006 and 2007 by Capital Workforce Partners together with
a wide array of other community stakeholders including the Connecticut Business and Industry
Association, Capitol Region Council of Governments, City of Hartford, Connecticut Economic Resource
Center, the CT Department of Economic and Community Development, Hartford Foundation for Public
Giving and United Way among many others. The indicators are intended to show how the development
of “human capital” in support of the North Central Connecticut region’s talent pipeline is faring as a key
economic competitiveness strategy in light of challenging demographic trends. This report represents the
fourth annual report update of community workforce development indicators first published in The Hartford
Courant in October 2007 and again in November 2008.
The first Community Workforce Development Report Card was driven by and focused on demographic
trends within the Hartford county region. Since that time, like the rest of the country, the region has been
impacted by a severe recession. The environmental context within which this report was developed has
changed in light of this economic phenomenon. Its relevance to business is heightened as both
individuals and companies struggle with the challenges they are facing.
Benchmarks are tracked annually and can be reported, similar to the way The Hartford Courant has been
tracking indicators for construction and city development. They are an important barometer in gauging
the quality of the region’s future workforce and its capacity to respond to the needs of employers and
contribute to the region’s economic vitality. They demonstrate the shortfalls and/or areas of concern, and
highlight the need for the broad talent pipeline system to continue to strategically focus attention

3 | P a g e
collectively on economic development, education and workforce development to ensure economic growth
and vitality for the future.
The broad community has defined four expected results critical to a “healthy” workforce:
1. A workforce employers need
2. Self-sufficient adults
3. A healthy economy
4. Youth ready for post-secondary education and employment
To assess these results, a small number of measurable indicators at the community level were selected
from an extensive list of options.
This Capital Workforce Partners and community-led approach is consistent with the results-based accountability framework (RBA) that is
currently being used by the Connecticut General Assembly Appropriations Committee, the Connecticut Employment and Training
Commission, the Early Childhood Education Cabinet and the City of Hartford Office for Youth Services.
This report features data for each of the selected indicators that were first published on the front
page of the October 14, 2007 Commentary section of The Hartford Courant. Where possible,
included are appropriate comparisons at the state and regional level as well as urban areas within
the region.

4 | P a g e
The North Central region consists of 37 municipalities. The highlighted areas on the map show
which municipalities were considered “urban” for this analysis. Where available, trend data for the
past five or more years is presented. In some cases, where full trends were not available,
“snapshot” comparisons for 2007 and 2008, or similar intervals, are presented in lieu of full trend
data.

5 | P a g e
Result 1: A Workforce Employers Need (Indicators 1-4)
Indicator 1:
Percent of Students Reaching Goal on
Math CAPT Test
Indicator 2:
Percent of Students Reaching Goal on
Reading CAPT Test
Why these are important: Employers need a workforce that is adequately prepared for conducting tasks that require solid math and reading skills. These scores also predict the potential need for remediation when students move into higher education. How is the community doing on these indicators? While there has been some improvement over the last two years, particularly in reading, these scores could still be substantially improved. Also, while there has been a sizeable uptick in our urban areas, these scores are still far lower and require significant
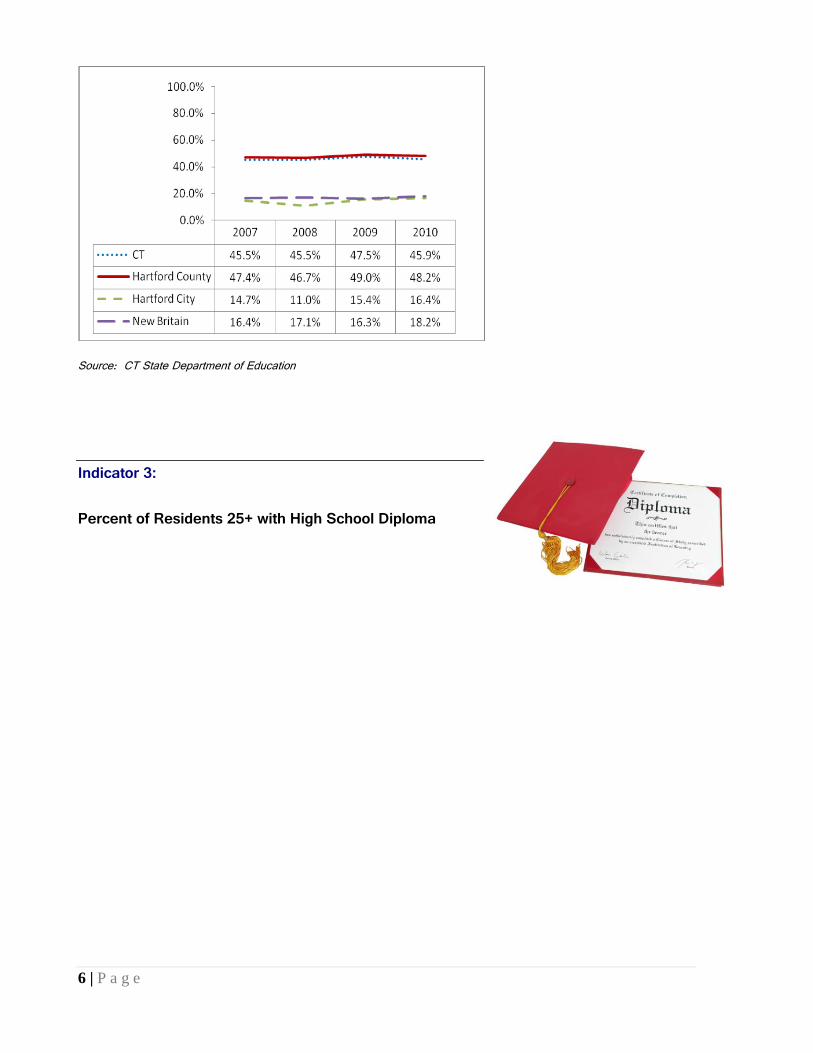
6 | P a g e
Source: CT State Department of Education
Indicator 3:
Percent of Residents 25+ with High School Diploma

7 | P a g e
Source: American Community Survey, US Census Bureau
Why this is important: Again, this is a good indicator of a prepared workforce. Looking at residents over 25 helps to cancel out the sentiment of youth lacking focus, and tends to show who “really ends up” with a high school diploma or equivalent. How is the community doing on this indicator? While the percentage of those 25+ with a high school diploma is fairly high, fully one-third of the residents in Hartford and one-quarter in New Britain do not have a high school diploma. In the City of Hartford, 49% in the 18-24 year old age group have a high school diploma or less. These numbers may be driven by an increase in the recent immigrant population, but they point to a need for more effective and accessible adult education strategies. If recent immigration is the main factor, it may also suggest the need for enhanced English as a Second Language (ESL) and other basic skills services.

8 | P a g e
Indicator 4: Percent of Degrees in Sciences, Engineering, and Technology Awarded by all Connecticut Colleges
Source: CT Department of Higher Education
Why this is important: Many employers in the fields of health, bio-science, and advanced manufacturing need college graduates who hold degrees in science, technology and engineering. How is the community doing on this indicator? As the trend line indicates, the percentage of degrees conferred by the Connecticut colleges has been flat over the last several years. This may suggest the need to intensify recruiting and mentoring of students interested in science and technology, as well as encouraging these students to stay in the state after graduation.

9 | P a g e
Result 2: Self-Sufficient Adults (Indicators 5-6)
Indicator 5:
Percent of Individuals at or Above 200% of Poverty
Source: American Community Survey, US Census Bureau
Why this is important: This is a very important indicator of the extent of poverty in our region, especially in the cities. Two hundred percent of poverty is often used in research as a rough, somewhat optimistic indicator of self-sufficiency. Two hundred percent of the poverty level for a family of three is $36,620 per year. How is the community doing on this indicator? There has been little progress on this measure over the last several years. In the City of Hartford, over half the residents earn less than what it takes to be self-sufficient. In New Britain, nearly 40% of the residents live below the essential self-sufficiency level.

10 | P a g e
Indicator 6:
Percent of Jobs Paying Above $40,000/yr
*Based on forecast through 2014; **Based on forecast through 2016 Source: CTDOL Department of Research
Result 3: A Healthy Economy (Indicators 10-12)
Indicator 7:
Percent Owner-Occupied Homes
Why this is important: This indicator is often used to determine the health of the economy by showing the extent to which people are able to own their own home. How is the community doing on this indicator? While this indicator is lagging behind the recent recessionary effect, it is still showing little or no growth. The cities once again show much lower rates of home ownership than Hartford County or the state as a whole.
Why this is important: This measure shows the percentage of job openings, as projected by the CT DOL Department of Research, that pay above $40,000 per year, a good marker for real self-sufficiency. How is the community doing on this indicator? Even with a slight uptick, about half of the jobs that are expected to be available through 2014 pay less than $40,000 per year. When examined together with the previous trend showing the percent of Hartford residents living below 200% of poverty, it may suggest that higher-paying jobs are less available to them.

11 | P a g e
Source: American Community Survey, US Census Bureau
Indicator 8:
Per Capita Gross Domestic State Product
Why this is important: This indicator shows the extent to which the economy is growing. How is the community doing on this indicator? Due to the recent economic crisis, productivity is down in the US and CT. Also, some of Connecticut’s overall growth trend may be due to lack of growth of the worker population. New England is continuing to become more productive. Connecticut’s trend seems a bit less encouraging, despite its overall high level of production.
Source Source: US Department of Commerce, Bureau of Economic Analysis

12 | P a g e
Indicator 9:
Unemployment Rate
Source: Bureau of Labor Statistics, US Census Bureau
Indicator 10:
Business Starts and Closings
Source: CT Office of the Secretary of State
Why this is important: The unemployment rate is an often-used indicator of general economic health, and is directly related to the ability of job seekers to find and keep employment. How is the community doing on this indicator? Unfortunately, the recent recession has had a sustained negative effect on the unemployment rate. In the cities, the rate is climbing towards 15%.
Why this is important: This is another important indicator of whether or not the economy is encouraging and sustaining business growth. How is the community doing on this indicator? Not good. Business starts are in decline and business closings are increasing, although they were down slightly in the most recent period.

13 | P a g e

14 | P a g e
Result 4: Youth Ready for Post Secondary Education and Employment
Indicator 11:
Percent of Entering 9th Graders Who Graduate in Four Years
Source: CT State Department of Education, ConnCap
Why this is important: Four-year graduation rates (the percentage of entering freshmen who actually graduate four years later) is the new standard measure for graduation and a much better indicator of whether students are effectively making it through high school. How is the community doing on this indicator? While the data available for this indicator is fragmented, 4-year graduation rates are substantially lower than traditional rates. The rate for the City of Hartford has been improving, from 29% in 2005-2006 to 43% in 2008-2009. However, that still leaves more than half the students not graduating on time. Even the rate for CT overall leaves over a quarter of the state’s young adults not graduating in a timely way.

15 | P a g e
Indicator 12: Percent of Students Achieving Goal on 8th Grade Math CMT
Source: CT State Department of Education
Indicator 13: Percent of Students Achieving Goal on 8th Grade Reading CMT
Source: CT State Department of Education
Why these are important: These scores are important indicators of preparation as students move into high school, and are predictive of future success in high school and beyond. How is the community doing on these indicators? These numbers have been steadily improving over the last few years, although the there is still a huge disparity between the scores for Hartford County and the urban areas.

16 | P a g e
Summary
The lack of movement on these indicators over the past few years tells a story. First, much more
work needs to be done in order to show progress on these indicators in North Central Connecticut,
especially in the urban areas. Second, given the current economic difficulties, the region has
faired moderately well to just maintain the levels of the previous years. It could have easily
slipped given the economic challenges it is facing. Consider:
22% of the region’s adults earn less than 200% of the poverty level;
Just 9% of those graduating from Connecticut’s colleges are earning degrees in science,
engineering or technology;
Since this report began in 2006, the region’s unemployment rate has almost doubled, from
4.4% to 8.3%.
While the North Central region’s productivity is increasing, Connecticut’s trend seems to be
less encouraging, despite its overall high level of production.
These are just a few of the reasons that suggest our region’s strong economic foundation
continues to warrant attention, and that education, workforce development and economic
development systems need to collectively work even harder to turn the curve for these
indicators in support of the region’s talent pipeline. In addition, legislative policy needs to

17 | P a g e
support and address these challenges in order to make efficient progress toward more
positive outcomes. It is not going to happen by itself.

18 | P a g e
Capital Workforce Partners Workforce Development Indicator Summary
Indicator Number
Result Areas and Indicator Name CT
Hartford County Hartford City New Britain
Hartford County Percent Change from last most
recent data point
Direction of Change
(up=desired; down=not desired)
A Workforce Employers Need
1 % of students reaching goal on Math CAPT Test (2010) 48.9 48.2 16.5 16.2 -1.6%
2 % of students reaching goal on Reading CAPT Test (2010) 73.4 73.1 44.9 36.8 8.1%
3 % of residents 25+ with high school diploma (2008) 88.2 86.8 66.5 75.8 0.5%
4
% of degrees conferred in science, technology and engineering awarded by CT public colleges and universities (2009) 8.7 4.8%
Self-Sufficient Adults
5 % of individuals at or above 200% of poverty 79.9 77.8 43.5 61.5 -0.6%
6 % of projected job openings paying 40K per year 50.9 1.2%
Healthy Economy
7 % owner-occupied homes (2008) 69.6 66.8 25.7 45.3 -0.6%
8 Per capita gross domestic state product (2008)
50,758 -0.75%
9 Unemployment rate (2009) 8.2 8.3 14.2 11.9 48.2%
10 Ratio of business starts to business closings 1.93 -5.39%
Youth Ready for Post-Secondary Education and Employment
11 % of 9th graders graduating in four years (2005) 80.9 43 (2009) 0.0%
12 % achieving goal on 8th grade Math CMT (2010) 67.5 68.1 32.9 26.9 5.6%
13 % achieving goal on 8th grade Reading CMT (2010) 73.4 73.1 44.9 36.8 8.1%

19 | P a g e
Conclusion
While most of these numbers will not surprise the informed reader, taken in total they
describe a community (at the state, county, and city levels) facing serious challenges,
particularly in the early preparation of youth; support for those adults who have not gained
the skills needed for self-sufficiency; and development of a workforce with the skills
employers demand — all in the context of a very uncertain economy.

20 | P a g e
Acknowledgments
This report was prepared by Julie Geyer, CWP Performance Management Administrator;
Ron Schack Ph.D., Director, The Charter Oak Group, LLC; and Sandra Rodriguez, CWP
Communications Director. The preparers thank the source providers of these valuable
indicator data, the CWP Strategic Management Committee, and the community partners who
had input into the initial selection of the indicators.

21 | P a g e
Capital Workforce Partners. September 2010. All Rights Reserved.
Capital Workforce Partners, One Union Place, Hartford CT 06103 www.capitalworkforce.org