community & strategic priorities€¦ · cvrd presentation outline 1. annual financial planning...
TRANSCRIPT

2019-2023 Proposed
Financial Plan
and Capital Expenditure
Program
Community &
Strategic Priorities

CVRD Presentation Outline
1. Annual Financial Planning Process
2. Financial Planning in a Regional District
3. Strategic Planning
4. 2019 Consolidated Budget
5. Recap and What’s Next

Financial Plan Process
• Proposed FP
• Completed roll
• Tax impacts
Step 1
• Recommended FP
• Updated budgets
Step 2 • Bylaw for adoption
• Revised roll
• March 31 deadline
Step 3

Financial
Planning in a
Regional
District

Participating Services
CVRD Services Provided
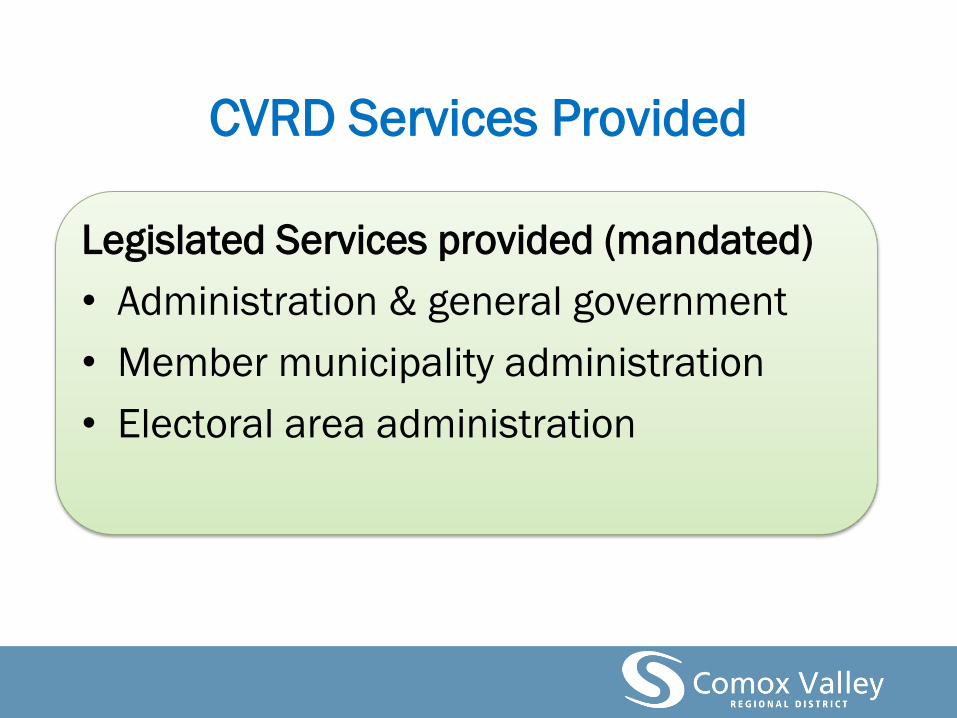
Legislated Services provided (mandated)
• Administration & general government
• Member municipality administration
• Electoral area administration

CVRD Services Provided
• Comox Valley wide
• Comox Valley excluding Denman/Hornby Islands
• Courtenay/Comox
• Courtenay/Comox/Area B
• Comox Valley excluding Denman, Hornby and
Cumberland
• Electoral areas
• Electoral areas excluding Denman/Hornby
• Local service areas (including Denman & Hornby
Islands)


Website Orientation – 2019 Budget
Access the 2019 - 2023 proposed budget at:
www.comoxvalleyrd.ca/currentbudget
select Proposed Financial Plan accordion (+) tab
(in either e-reader or searchable PDF format)
Previous financial plans are available and can be
accessed through the CVRD website link to “past
financial plans” under the finance department

Strategic
Planning

Elected Officials Term of Office 2019-2022
Strategic Planning
Planning Sessions
• Strategic plan workshop – December 19th, 2018
2019 Priorities
• Liquid Waste Management Planning
• Water Treatment Project and Ultraviolet (UV) Protection
• Regional Solid Waste (incl. Regional Organics Composting)
• CVRD Corporate Office
• Regional Growth Strategy
• Fire / Emergency Program Services

CVRD
Consolidated
Proposed
Budget

Services
CapacityEconomic
environment
Assessment values
Taxation levels
Regulatory standards i.e. VIHA
MoE
Staffing
Citizen expectations and perceived value
Fees and permits
Grant
Availability
Demographics
Risk
Management
Challenges & Influences for 2019
Asset
management
Population
Growth

Factors considered in preparing the
2019-2023 Financial Plan
• Balancing of short-term impacts while ensuring long term
fiscal stability and sustainability
• Ensuring sufficient reserve levels for the future – Asset
Management Planning
• Completing projects in progress
• Focus on strategic priorities (i.e. drainage, water
treatment, new corporate building)
• Managing all forms of risk
• Holding requisition levels steady wherever possible to
minimize tax impacts

Total Net
Taxable
Assessed
Values
2010 – 2019
2010 10,299,437,562
2011 10,759,935,767
2012 10,812,934,308
2013 10,824,385,478
2014 10,734,994,308
2015 10,859,342,823
2016 11,146,671,718
2017 12,221,001,501
2018 14,259,241,396
2019 16,559,593,678

Change in Converted Assessed
Value by ParticipantParticipant 2017 2018 % Change
Area A $241,657,411 $273,378,117 13.13%
Area B $176,557,678 $202,001,935 14.41%
Area C $231,860,240 $267,397,823 15.33%
Comox $293,241,346 $340,711,612 16.19%
Courtenay $626,275,362 $718,798,509 14.77%
Cumberland $71,364,938 $90,391,772 26.66%
Total $1,640,956,975 $1,892,679,768 15.34%


2018/19 Assessment Shift ExampleVictim
Services
Program
#200
2018 Requisition 2019 Requisition$
Change
Comox $15,075 $15,195 $120
Courtenay $32,263 $32,117 ($146)
Cumberland $3,662 $4,025 $363
Area A $12,553 $12,304 ($249)
Area B $9,171 $9,092 ($79)
Area C $12,044 $12,035 ($9)
Total $84,768 $84,768 $0

Other Revenue,
22%
Taxation, 27%
Other Transfers, 39%
Debt Proceeds,
13%
2019 REVENUE BUDGET
(includes grants,
reserves, prior years’
surpluses, etc.)
(includes tipping fees,
user rates, etc.)
Total Revenues = $129,933,625

Parcel / Frontage Tax & User Fee Impacts
All frontage taxes with the exception of Black Creek / Oyster
Bay Water have been converted to flat-rate parcel taxes
New equalization parcel tax beginning in 2019 as a result of
amalgamation of several smaller water local service areas
2019 parcel tax rates largely the same as 2018 with the
exception of:
o Jackson Drive Sewer – small parcel tax increase
o Sandwick Water – significant decrease
One new parcel tax to be implemented in 2019 is:
o King Coho Sewer
Small user fee increase in 2019 for Royston Water

Services at Maximum Requisition(at 2019 Completed Roll)
# Service 2019 Maximum
298 Unsightly Premises Extended Service $31,250
Services Repealed in 2019
Due to Amalgamation
Service Repealed Amalgamated with
Tsolum-Farnham Fire Protection (235)Greater Merville Fire Protection
(237)
Arden Road Water LSA (311) Comox Valley Water (305)
Marsden / Camco Road Water LSA (317) Comox Valley Water (305)

Consolidated Requisition Comparison
Jurisdiction 2018 Actual 2019 PB $ Change % Change
Electoral areas w/o CSWM
$14,171,502 $14,809,297 $637,795 4.5%
Municipalities w/o sewer/CSWM
$6,838,175 $7,155,566 $317,391 4.6%
CS Waste
Management$2,570,198 $3,865,768 $1,295,570 50%
Sewer $5,689,323 $6,030,682 $341,359 6.0%
Total $29,269,198 $31,861,313 $2,592,115 8.8%

Requisition by Participant 2013– 2019 (excluding sewer)

Requisition by Participant – Comox(Without Sewer)
2018 2019 $ Change
CS Waste
Management$457,908 $692,966 $235,058
Remaining
requisition$2,015,879 $2,115,754 $99,875
Total (w/o sewer) $2,473,787 $2,808,720 $334,933

Requisition by Participant – Courtenay (Without Sewer)
2018 2019 $ Change
CS Waste
Management$978,228 $1,464,671 $486,443
Remaining
requisition$4,393,696 $4,549,355 $155,659
Total (w/o sewer) $5,371,924 $6,014,026 $642,102
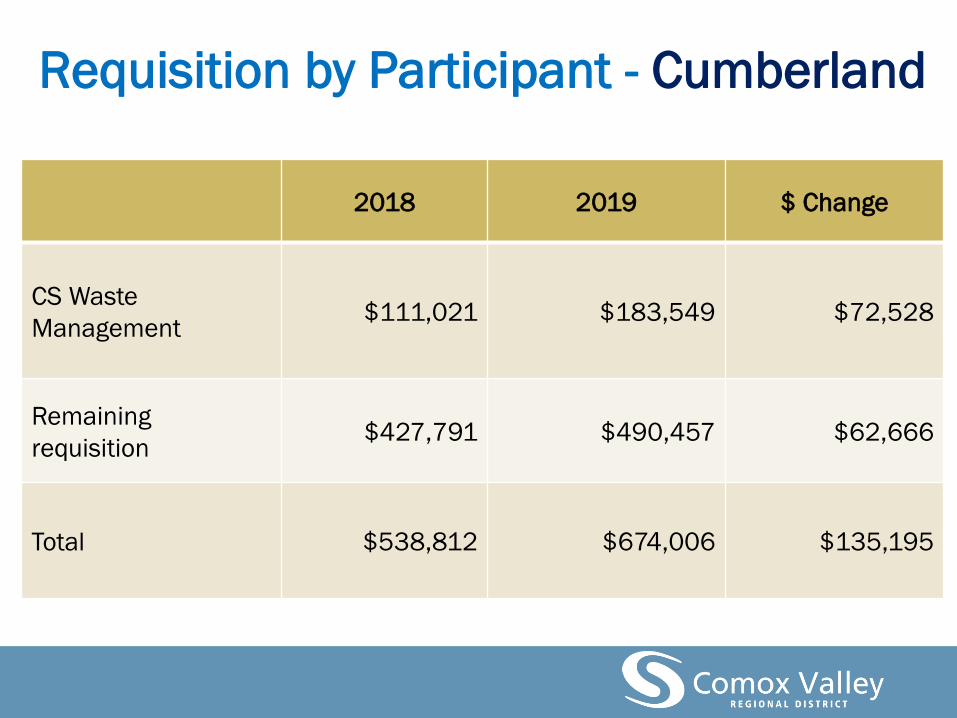
Requisition by Participant - Cumberland
2018 2019 $ Change
CS Waste
Management$111,021 $183,549 $72,528
Remaining
requisition$427,791 $490,457 $62,666
Total $538,812 $674,006 $135,195

Requisition by Participant
Area A (Baynes Sd/DI/HI)
2018 BV 2019 PB $ Change
CS Waste
Management$380,604 $561,120 $180,516
VI Regional Library $460,342 $460,312 ($30)
Remaining
Requisition$2,804,093 $2,954,030 $149,937
Total $3,645,039 $3,975,462 $330,423

Requisition by Participant - Area B
2018 BV 2019 PB $ Change
CS Waste
Management$278.074 $414,617 $136,543
VI Regional Library $336,331 $340,129 $3,798
Remaining
requisition$2,819,460 $2,933,264 $113,804
Total $3,433,865 $3,688,010 $254,145

Requisition by Participant - Area C
2018 BV 2019 PB $ Change
CS Waste
Management$365,174 $548,845 $183,671
VI Regional Library $441,679 $450,242 $8,563
Remaining
requisition$3,457,528 $3,608,905 $151,377
Total $4,264,381 $4,607,992 $343,611

47%
Personnel Costs
14%
Operating Costs
25%
Debt Service
4%
Reserve
Contributions
10%
Budget by Expenditure Type
Capital
Expenditures
Total Expenditures = $129,933,625
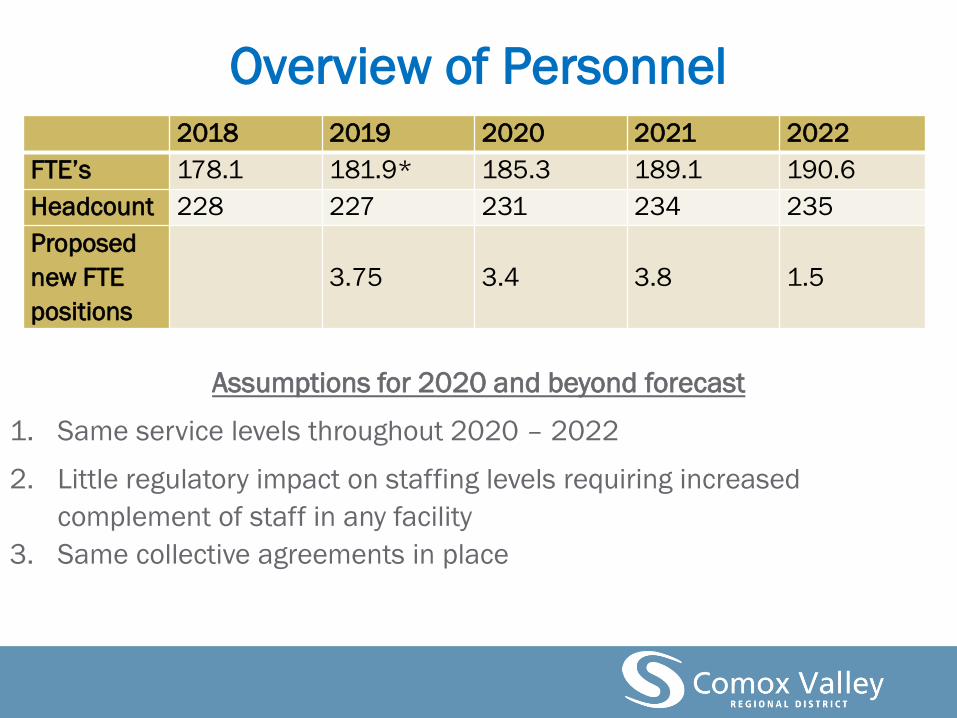
Overview of Personnel2018 2019 2020 2021 2022
FTE’s 178.1 181.9* 185.3 189.1 190.6
Headcount 228 227 231 234 235
Proposed
new FTE
positions
3.75 3.4 3.8 1.5
Assumptions for 2020 and beyond forecast
1. Same service levels throughout 2020 – 2022
2. Little regulatory impact on staffing levels requiring increased
complement of staff in any facility
3. Same collective agreements in place

Position – New FTE Department FTE increase
2019
2020
FTE
2021
FTE
2022 FTE 2023 FTE
Building Maintenance Transit &
Sustainability
.7 to 1.0 in
2020
.3
Water Operator Engineering-Water 1.0 2.0 1.0
Fire Chief DIFR .37
Operator - STP Engineering –
Wastewater
1.0
EA – Water contin. Engineering - Water .7 to 1.0 in
2020
.3
Summer Student Parks .3
Summer Student Parks .3
WMA Engineering – Solid
Waste
.25
Admin Corp Services .5
Student Eng A Engineering – Solid
Waste
.3
NI911 Tech Corporate Services .5
Business Analyst Corporate Services (IT) 1.0
SCADA Corporate Services (IT) 1.0
Help Desk Corporate Services (IT) .5
RM Clerk Corporate Services (IT) .5
Sub Totals 3.75 3.4 3.87 1.5
Cumulative Totals 181.9
FTE
185.3
FTE
189.1
FTE
190.6
FTE
190.6
FTE
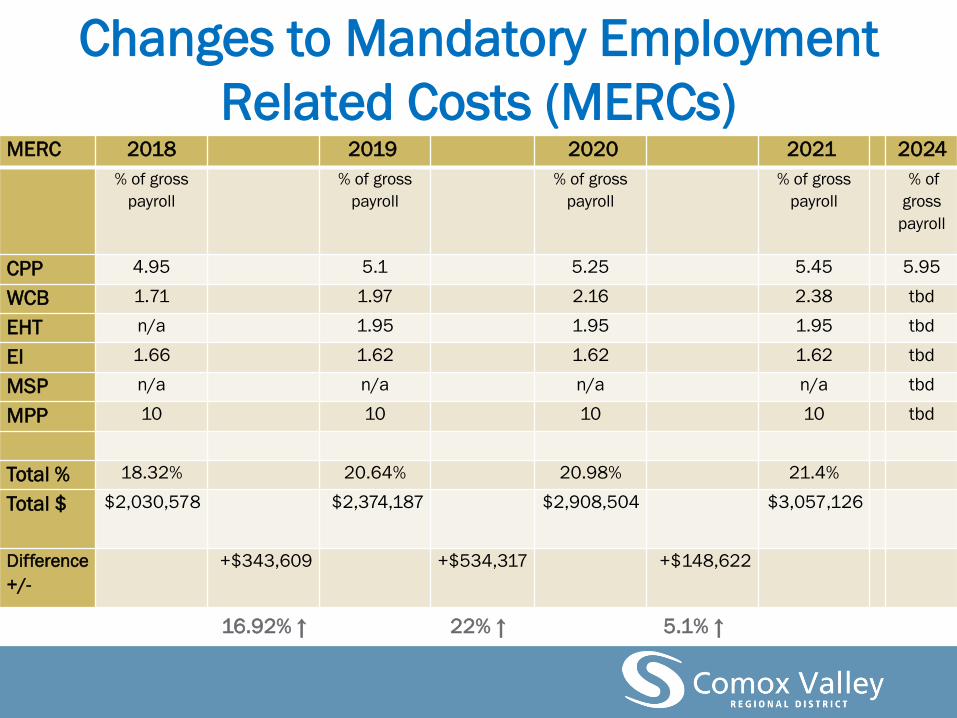
Changes to Mandatory Employment
Related Costs (MERCs)MERC 2018 2019 2020 2021 2024
% of gross
payroll
% of gross
payroll
% of gross
payroll
% of gross
payroll
% of
gross
payroll
CPP 4.95 5.1 5.25 5.45 5.95
WCB 1.71 1.97 2.16 2.38 tbd
EHT n/a 1.95 1.95 1.95 tbd
EI 1.66 1.62 1.62 1.62 tbd
MSP n/a n/a n/a n/a tbd
MPP 10 10 10 10 tbd
Total % 18.32% 20.64% 20.98% 21.4%
Total $ $2,030,578 $2,374,187 $2,908,504 $3,057,126
Difference
+/-
+$343,609 +$534,317 +$148,622
16.92% ↑ 22% ↑ 5.1% ↑

Capital Expenditures Highlights
• Corporate Office Building Project (119)
• CV Water Supply (300) – Water Treatment
Engineering & Construction
• CV Sewerage (335) – continued Sewer
Infrastructure Upgrades and Liquid Waste
Management Planning
• CSWM (391) – Regional Composting Facility
*Capital is funded by Operating Transfers, Reserves, Debt
and Grants (based on availability)
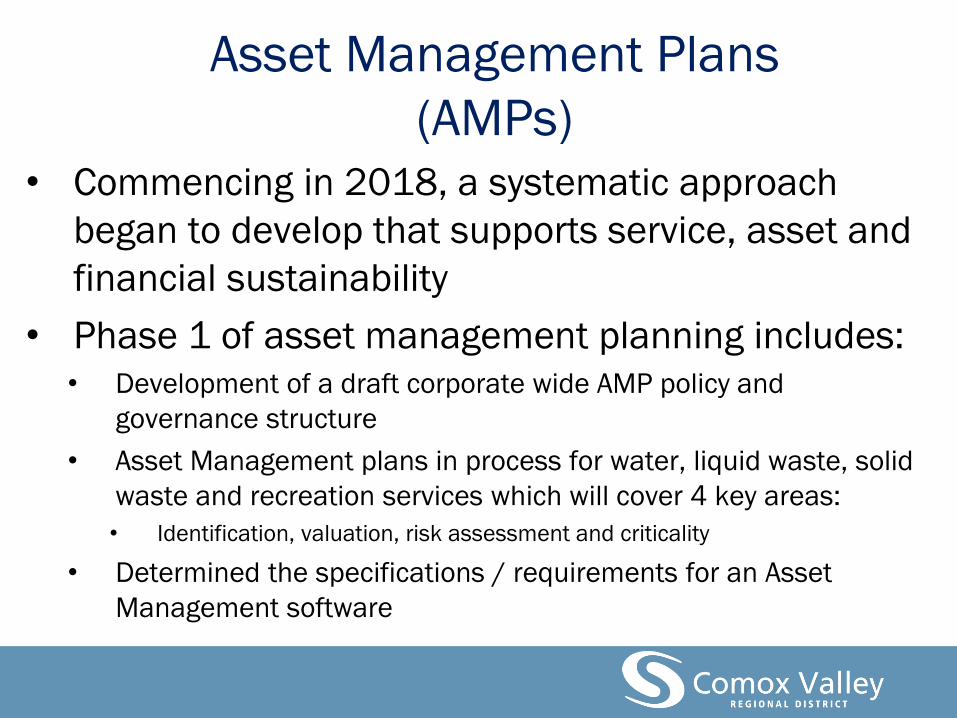
Asset Management Plans
(AMPs)
• Commencing in 2018, a systematic approach
began to develop that supports service, asset and
financial sustainability
• Phase 1 of asset management planning includes:
• Development of a draft corporate wide AMP policy and
governance structure
• Asset Management plans in process for water, liquid waste, solid
waste and recreation services which will cover 4 key areas:
• Identification, valuation, risk assessment and criticality
• Determined the specifications / requirements for an Asset
Management software
Recap CVRD Proposed Budget
• Service budgets will be presented to committees
• Meeting schedule provided on CVRD website
• 2019-2023 CVRD financial plan bylaw for CVRD
Board adoption on March 19th and 21st, 2019
• Consolidated proposed budget and today’s
presentation available on CVRD website at
http://www.comoxvalleyrd.ca/currentbudget
• Tables outlining proposed tax impact per
household by participant to be provided to
Directors as a handout

If
2019
Assessed
value
=
$465,000
2019
Increase
=
$44.96
Cumberland Property Property
Number Function Name 2018 $400,000 2019 $465,000
100 Member Municipality Admin $0.0429 $17.16 $0.0397 $18.46
110 General Administration $0.0107 $4.28 $0.0092 $4.28
150 Regional Feasibility Studies $0.0009 $0.36 $0.0008 $0.37
200 Victim Services $0.0052 $2.08 $0.0045 $2.09
205 CV Justice Centre $0.0024 $0.96 $0.0025 $1.16
265 Search & Rescue $0.0071 $2.84 $0.0065 $3.02
275 911 Answering Service $0.0449 $17.96 $0.0413 $19.20
345 Pesticide Awareness $0.0000 $0.00 $0.0000 $0.00
391 CS Waste Management $0.1575 $63.00 $0.2053 $95.46
450 Emerg Shelter Land Aq. $0.0000 $0.00 $0.0000 $0.00
451 Homelessness Supports $0.0132 $5.28 $0.0114 $5.30
512 Regional Growth Strategy $0.0035 $1.40 $0.0089 $4.14
600 Recreation Grant $0.0172 $6.88 $0.0155 $7.21
645 CV Recreation Complexes $0.2924 $116.96 $0.2524 $117.37
660 Exhibition Grounds $0.0286 $11.44 $0.0257 $11.95
780 Transit $0.1133 $45.32 $0.1086 $50.50
795 CV Airport $0.0198 $7.92 $0.0178 $8.28
$303.84 $348.80

Assessed
value
=
$465,000
2019
Increase
=
$44.96
270 CV Emergency Program
550 CV Economic Development
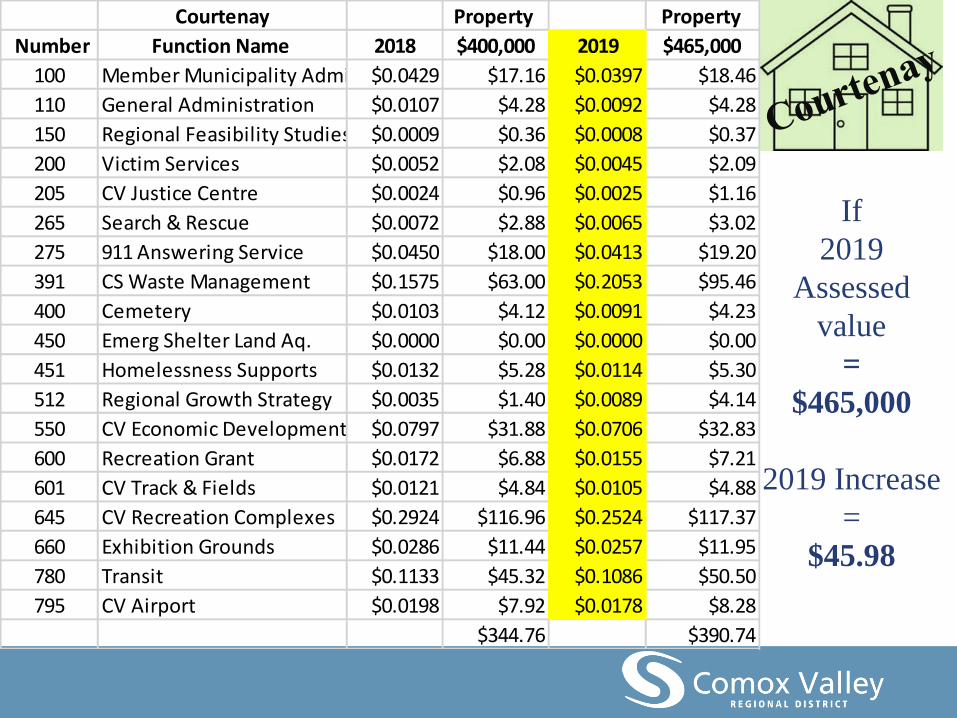
If
2019
Assessed
value
=
$465,000
2019 Increase
=
$45.98
Courtenay Property Property
Number Function Name 2018 $400,000 2019 $465,000
100 Member Municipality Admin $0.0429 $17.16 $0.0397 $18.46
110 General Administration $0.0107 $4.28 $0.0092 $4.28
150 Regional Feasibility Studies $0.0009 $0.36 $0.0008 $0.37
200 Victim Services $0.0052 $2.08 $0.0045 $2.09
205 CV Justice Centre $0.0024 $0.96 $0.0025 $1.16
265 Search & Rescue $0.0072 $2.88 $0.0065 $3.02
275 911 Answering Service $0.0450 $18.00 $0.0413 $19.20
391 CS Waste Management $0.1575 $63.00 $0.2053 $95.46
400 Cemetery $0.0103 $4.12 $0.0091 $4.23
450 Emerg Shelter Land Aq. $0.0000 $0.00 $0.0000 $0.00
451 Homelessness Supports $0.0132 $5.28 $0.0114 $5.30
512 Regional Growth Strategy $0.0035 $1.40 $0.0089 $4.14
550 CV Economic Development $0.0797 $31.88 $0.0706 $32.83
600 Recreation Grant $0.0172 $6.88 $0.0155 $7.21
601 CV Track & Fields $0.0121 $4.84 $0.0105 $4.88
645 CV Recreation Complexes $0.2924 $116.96 $0.2524 $117.37
660 Exhibition Grounds $0.0286 $11.44 $0.0257 $11.95
780 Transit $0.1133 $45.32 $0.1086 $50.50
795 CV Airport $0.0198 $7.92 $0.0178 $8.28
$344.76 $390.74

Assessed
value
=
$465,000
2018
Increase
$45.98
270CV Emergency
Program
Contract
Service
345Pesticide
Awareness
Contract
Service
300CV Water Supply
Service
Municipal
Utility
335CV Sewerage
Service
Municipal
Utility

If 2019
Assessed
value
=
$465,000
2019 Increase
=
$46.00
Comox Property Property
Number Function Name 2018 $400,000 2019 $465,000
100 Member Municipality Admin $0.0429 $17.16 $0.0397 $18.46
110 General Administration $0.0107 $4.28 $0.0092 $4.28
150 Regional Feasibility Studies $0.0009 $0.36 $0.0008 $0.37
200 Victim Services $0.0052 $2.08 $0.0045 $2.09
205 CV Justice Centre $0.0024 $0.96 $0.0025 $1.16
265 Search & Rescue $0.0072 $2.88 $0.0065 $3.02
275 911 Answering Service $0.0450 $18.00 $0.0413 $19.20
391 CS Waste Management $0.1575 $63.00 $0.2053 $95.46
400 Cemetery $0.0103 $4.12 $0.0091 $4.23
450 Emerg Shelter Land Aq. $0.0000 $0.00 $0.0000 $0.00
512 Regional Growth Strategy $0.0035 $1.40 $0.0089 $4.14
550 CV Economic Development $0.0797 $31.88 $0.0706 $32.83
600 Recreation Grant $0.0171 $6.84 $0.0155 $7.21
601 CV Track & Fields $0.0121 $4.84 $0.0105 $4.88
645 CV Recreation Complexes $0.2924 $116.96 $0.2524 $117.37
660 Exhibition Grounds $0.0286 $11.44 $0.0257 $11.95
780 Transit $0.1133 $45.32 $0.1086 $50.50
795 CV Airport $0.0198 $7.92 $0.0178 $8.28
$339.44 $385.44

Assessed
value
=
$465,000
2019
Increase
$46.00
270CV Emergency
Program
Contract
Service
345Pesticide
Awareness
Contract
Service
300CV Water Supply
Service
Municipal
Utility
335CV Sewerage
Service
Municipal
Utility

Area A - All Property Property
Number Function Name 2018 $400,000 2019 $465,000
110 General Administration $0.0107 $4.28 $0.0092 $4.28
130 Electoral Area Administration $0.1523 $60.92 $0.1351 $62.82
150 Regional Feasibility Studies $0.0009 $0.36 $0.0008 $0.37
200 Victim Services $0.0052 $2.08 $0.0045 $2.09
205 CV Justice Centre $0.0024 $0.96 $0.0025 $1.16
265 Search & Rescue $0.0072 $2.88 $0.0065 $3.02
270 CV Emergency Program $0.0105 $4.20 $0.0121 $5.63
271 EA Emergency Program $0.0150 $6.00 $0.0195 $9.07
275 911 Answering Service $0.0450 $18.00 $0.0413 $19.20
295 Noise Control $0.0065 $2.60 $0.0057 $2.65
296 Weed Control $0.0044 $1.76 $0.0046 $2.14
298 Unsightly Premises $0.0048 $1.92 $0.0042 $1.95
299 Fireworks Regulation $0.0017 $0.68 $0.0015 $0.70
340 Liquid Waste Management $0.0655 $26.20 $0.0573 $26.64
345 Pesticide Awareness $0.0000 $0.00 $0.0000 $0.00
391 CS Waste Management $0.1575 $63.00 $0.2053 $95.46
450 Emerg Shelter Land Aq. $0.0000 $0.00 $0.0000 $0.00
530 House Numbering Area A $0.0004 $0.16 $0.0003 $0.14
600 Recreation Grant $0.0172 $6.88 $0.0155 $7.21
630 VI Regional Library $0.2072 $82.88 $0.1684 $78.31
660 Exhibition Grounds $0.0286 $11.44 $0.0257 $11.95
780 Transit $0.1133 $45.32 $0.1086 $50.50
795 CV Airport $0.0198 $7.92 $0.0178 $8.28
$350.44 $393.58

If
2019
Assessed value
$465,000
2019 Increase
(All A)
$43.14
+
(Baynes Sound)
$21.85
=
$64.99
Area A - Baynes Sound Property Property
Number Function Name 2018 $400,000 2019 $465,000
120 Grant in Aid Area A Baynes Snd. $0.0133 $5.32 $0.0113 $5.25
151 Area A Baynes Sd Feasibility Studies $0.0205 $8.20 $0.0175 $8.14
285 Building Inspection $0.0638 $25.52 $0.0552 $25.67
291 Animal Control $0.0234 $9.36 $0.0226 $10.51
451 Homelessness Supports $0.0132 $5.28 $0.0114 $5.30
500 Planning $0.3150 $126.00 $0.3041 $141.41
512 Regional Growth Strategy $0.0035 $1.40 $0.0089 $4.14
550 CV Economic Development $0.0797 $31.88 $0.0706 $32.83
601 CV Track & Fields $0.0121 $4.84 $0.0105 $4.88
615 Arts & Culture $0.0132 $5.28 $0.0124 $5.77
621 Parks & Greenways $0.2703 $108.12 $0.2339 $108.76
645 CV Recreation Complexes $0.2924 $116.96 $0.2524 $117.37
686 Comfort Stations $0.0038 $1.52 $0.0033 $1.53
691 Heritage Conservation A Baynes Snd $0.0024 $0.96 $0.0020 $0.93
$450.64 $472.49
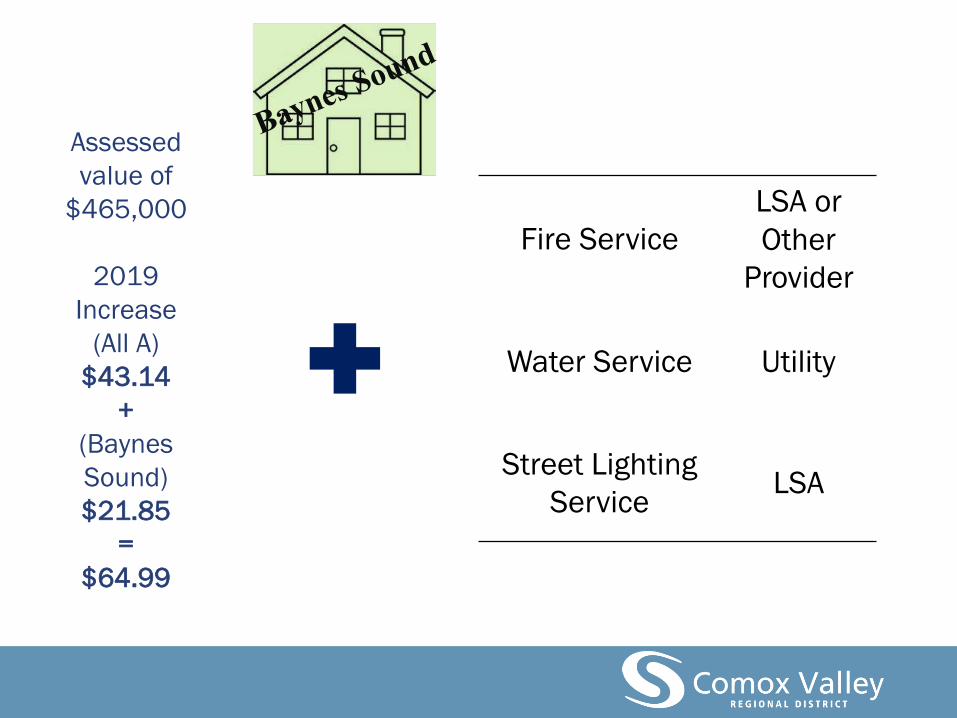
Assessed
value of
$465,000
2019
Increase
(All A)
$43.14
+
(Baynes
Sound)
$21.85
=
$64.99
Fire Service
LSA or
Other
Provider
Water Service Utility
Street Lighting
ServiceLSA

If 2019
Assessed
value
$465,000
2019
Increase
(All A)
$43.14
+
(Denman
Island)
$91.95
=
$135.09
Area A - Denman Island Property Property
Number Function Name 2018 $400,000 2019 $465,000
123 Denman Island - Grant in Aid $0.0322 $12.88 $0.0293 $13.62
154 Denman Island Feasibility Studies $0.0098 $3.92 $0.0089 $4.14
215 Denman Island Fire Protection $0.7490 $299.60 $0.7535 $350.38
362 Denman Island Garbage Collection $0.1798 $71.92 $0.1788 $83.14
555 Denman Island Economic Dev $0.1293 $51.72 $0.1178 $54.78
605 Denman Island Recreation $0.0394 $15.76 $0.0359 $16.69
607 Denman/Hornby Rec Complex Cont $0.0291 $11.64 $0.0274 $12.74
619 Denman Island Parks & Greenways $0.2066 $82.64 $0.2001 $93.05
675 Denman Island Community Hall $0.1033 $41.32 $0.1177 $54.73
694 Denman Island - Heritage Conserv. $0.0027 $1.08 $0.0025 $1.16
$592.48 $684.43

Water Service LSA
Street Lighting LSA
Land Use PlanningOther
Provider
Assessed
value
$465,000
2019
Increase
(All A)
$43.14
+
(Denman
Island)
$91.95
=
$135.09

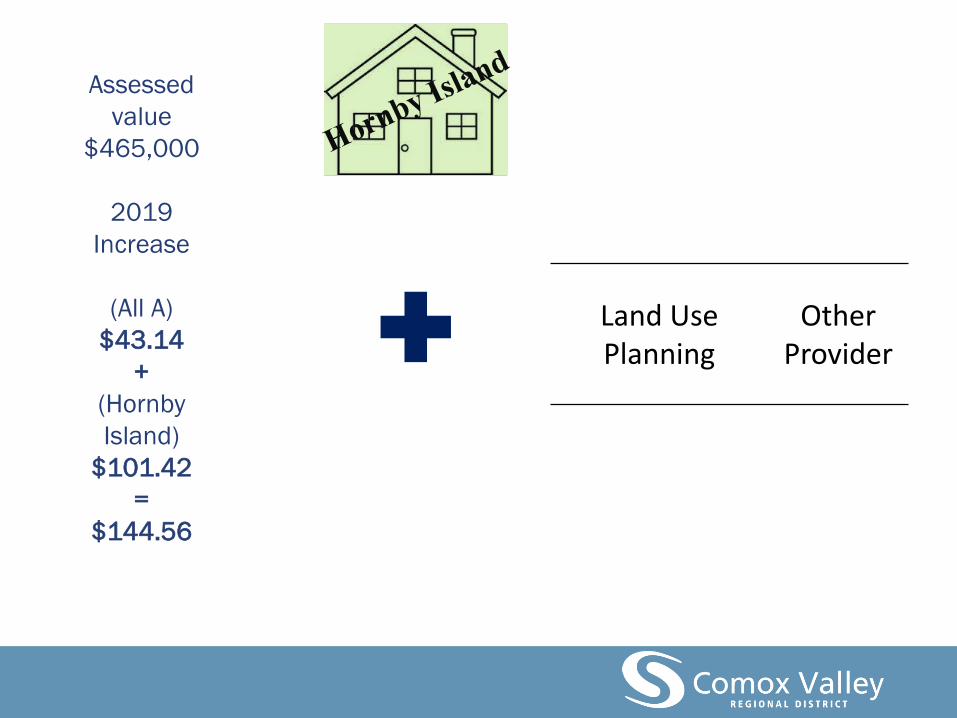
If 2019
Assessed
value
$465,000
2019
Increase
(All A)
$43.14
+
(Hornby
Island)
$101.42
=
$144.56
Area A - Hornby Island Property Property
Number Function Name 2018 $400,000 2019 $465,000
124 Hornby Island Grant in Aid $0.0273 $10.92 $0.0262 $12.18
155 Hornby Island - Feasibility Studies $0.0144 $5.76 $0.0138 $6.42
220 Hornby Island Fire Protection $0.9121 $364.84 $0.9156 $425.75
360 Hornby Island Garbage Disposal $0.4056 $162.24 $0.3646 $169.54
556 Hornby Island Economic Dev $0.1221 $48.84 $0.1169 $54.36
606 Hornby Island Recreation $0.0406 $16.24 $0.0471 $21.90
607 Denman/Hornby Rec Complex Cont $0.0291 $11.64 $0.0274 $12.74
620 Hornby Island Parks & Greenways $0.2746 $109.84 $0.2628 $122.20
670 Hornby Island Community Hall $0.1222 $48.88 $0.1170 $54.41
688 Hornby Island Comfort Station $0.0275 $11.00 $0.0258 $12.00
695 Hornby Island - Heritage Conserv. $0.0026 $1.04 $0.0025 $1.16
$791.24 $892.66
Assessed
value
$465,000
2019
Increase
(All A)
$43.14
+
(Hornby
Island)
$101.42
=
$144.56
Land Use Planning
Other Provider

If 2019
Assessed
value
$465,000
2019
Increase
=
$65.48
Area B Property Property
Number Function Name 2018 $400,000 2019 $465,000
110 General Administration $0.0107 $4.28 $0.0092 $4.28
121 Grant in Aid Area B $0.0174 $6.96 $0.0152 $7.07
130 Electoral Area Administration $0.1523 $60.92 $0.1351 $62.82
150 Regional Feasibility Studies $0.0009 $0.36 $0.0008 $0.37
152 Feasibility Studies - Area B $0.0069 $2.76 $0.0060 $2.79
200 Victim Services $0.0052 $2.08 $0.0045 $2.09
205 CV Justice Centre $0.0024 $0.96 $0.0025 $1.16
265 Search & Rescue $0.0072 $2.88 $0.0065 $3.02
270 CV Emergency Program $0.0105 $4.20 $0.0121 $5.63
271 EA Emergency Program $0.0150 $6.00 $0.0195 $9.07
275 911 Answering Service $0.0450 $18.00 $0.0413 $19.20
285 Building Inspection $0.0638 $25.52 $0.0552 $25.67
291 Animal Control $0.0234 $9.36 $0.0226 $10.51
295 Noise Control $0.0065 $2.60 $0.0057 $2.65
296 Weed Control $0.0044 $1.76 $0.0046 $2.14
298 Unsightly Premises $0.0048 $1.92 $0.0042 $1.95
299 Fireworks Regulation $0.0017 $0.68 $0.0015 $0.70
340 Liquid Waste Management $0.0655 $26.20 $0.0573 $26.64
345 Pesticide Awareness $0.0000 $0.00 $0.0000 $0.00
391 CS Waste Management $0.1575 $63.00 $0.2053 $95.46
400 Cemetery $0.0103 $4.12 $0.0091 $4.23
450 Emerg Shelter Land Aq. $0.0000 $0.00 $0.0000 $0.00
451 Homelessness Supports $0.0132 $5.28 $0.0114 $5.30
500 Planning $0.3150 $126.00 $0.3041 $141.41
512 Regional Growth Strategy $0.0035 $1.40 $0.0089 $4.14
531 House Numbering Area B $0.0004 $0.16 $0.0004 $0.19
550 CV Economic Development $0.0797 $31.88 $0.0706 $32.83
600 Recreation Grant $0.0172 $6.88 $0.0155 $7.21
601 CV Track & Fields $0.0121 $4.84 $0.0105 $4.88
615 Arts & Culture $0.0132 $5.28 $0.0124 $5.77
621 Parks & Greenways $0.2703 $108.12 $0.2339 $108.76
630 VI Regional Library $0.2072 $82.88 $0.1684 $78.31
645 CV Recreation Complexes $0.2924 $116.96 $0.2524 $117.37
660 Exhibition Grounds $0.0286 $11.44 $0.0257 $11.95
686 Comfort Stations $0.0038 $1.52 $0.0033 $1.53
692 Heritage Conservation - Area B $0.0057 $2.28 $0.0050 $2.33
780 Transit $0.1133 $45.32 $0.1086 $50.50
795 CV Airport $0.0198 $7.92 $0.0178 $8.28
$802.72 $868.20

Fire Protection LSA
Water Service LSA
Sewer Service LSA
Street Lighting LSA
Assessed
value
$465,000
Area B
2019
Increase
=
$65.48

If 2019
Assessed
value
$465,000
2019
Increase
=
$62.96
Area C Property Property
Number Function Name 2018 $400,000 2019 $465,000
110 General Administration $0.0107 $4.28 $0.0092 $4.28
122 Grant in Aid - Area C $0.0380 $15.20 $0.0329 $15.30
130 Electoral Area Administration $0.1523 $60.92 $0.1351 $62.82
150 Regional Feasibility Studies $0.0009 $0.36 $0.0008 $0.37
153 Feasibility Studies - Area C $0.0056 $2.24 $0.0049 $2.28
200 Victim Services $0.0052 $2.08 $0.0045 $2.09
205 CV Justice Centre $0.0024 $0.96 $0.0025 $1.16
265 Search & Rescue $0.0072 $2.88 $0.0065 $3.02
270 CV Emergency Program $0.0105 $4.20 $0.0121 $5.63
271 EA Emergency Program $0.0150 $6.00 $0.0195 $9.07
275 911 Answering Service $0.0450 $18.00 $0.0413 $19.20
285 Building Inspection $0.0638 $25.52 $0.0552 $25.67
291 Animal Control $0.0234 $9.36 $0.0226 $10.51
295 Noise Control $0.0065 $2.60 $0.0057 $2.65
296 Weed Control $0.0044 $1.76 $0.0046 $2.14
298 Unsightly Premises $0.0048 $1.92 $0.0042 $1.95
299 Fireworks Regulation $0.0017 $0.68 $0.0015 $0.70
340 Liquid Waste Management $0.0655 $26.20 $0.0573 $26.64
345 Pesticide Awareness $0.0000 $0.00 $0.0000 $0.00
391 CS Waste Management $0.1575 $63.00 $0.2053 $95.46
450 Emerg Shelter Land Aq. $0.0000 $0.00 $0.0000 $0.00
451 Homelessness Supports $0.0132 $5.28 $0.0114 $5.30
500 Planning $0.3150 $126.00 $0.3041 $141.41
512 Regional Growth Strategy $0.0035 $1.40 $0.0089 $4.14
532 House Numbering Area C $0.0004 $0.16 $0.0003 $0.14
550 CV Economic Development $0.0797 $31.88 $0.0706 $32.83
600 Recreation Grant $0.0172 $6.88 $0.0155 $7.21
601 CV Track & Fields $0.0121 $4.84 $0.0105 $4.88
615 Arts & Culture $0.0132 $5.28 $0.0124 $5.77
621 Parks & Greenways $0.2703 $108.12 $0.2339 $108.76
630 VI Regional Library $0.2072 $82.88 $0.1684 $78.31
645 CV Recreation Complexes $0.2924 $116.96 $0.2524 $117.37
660 Exhibition Grounds $0.0286 $11.44 $0.0257 $11.95
686 Comfort Stations $0.0038 $1.52 $0.0033 $1.53
693 Heritage Conservation - Area C $0.0043 $1.72 $0.0037 $1.72
780 Transit $0.1191 $47.64 $0.1086 $50.50
795 CV Airport $0.0198 $7.92 $0.0178 $8.28
$808.08 $871.04

Assessed
value
$465,000
Area C
2019
Increase
=
$62.96
Fire Protection LSA
Water Service LSA
Street Lighting LSA

Thank you
Questions?