community report -...
TRANSCRIPT

P.O. Box 610, Maricopa, Arizona 85139 (520) 568-9098 | www.maricopa-az.gov
Community RepoRt
2013
INTERIM CITY HALL:45145 W. Madison Ave.
Maricopa, Arizona 85139
FUTURE CITY HALL:39700 W. Civic Center Plaza
Maricopa, Arizona 85138

Government Mayor & Council, City Manager, City Organizational Chart
Population Race, Growth Trend, Projections, Income Profile, Workforce
Housing & Property Home Sales And Permit Activity, Assessed Value, Five-Year Value Comparison
Property Tax Total Tax Rate, City of Maricopa Tax Rate, Current Land Use
Fiscal Strength Budget, General Fund, and All Funds
Economics Employers and Economic Development Projects
Business Activity New Businesses, Licensing & Permitting, Business Support
Quality of Life Recreation & Library, Quality Municipal Services
Investments & Prosperous Future Capital Investments, Infrastructure, and Projects
Additional Resources Directory, Connect with the City, Acknowledgements
3
5
7
11
13
15
17
19
21
ECONOMIC SUSTAINABILITYMaricopa will be a leading regional partner, providing
growth opportunities for new companies, entrepreneurs and expanding companies by delivering high quality services, sites, and talent to local, regional, national,
and international businesses.
To provide residents with a safe and secure community that has the amenities and opportunities for all to enjoy while
offering a high standard of living and quality of life.
To safeguard the City’s state of well-being; by preventing harm to life, property, and the environment and ensuring
the complete safety of our residents, businesses, and all who work in, visit, or travel through our community.
To provide a safe and efficient transportation system to the citizens of Maricopa that facilitates the orderly and efficient
movement of people, goods, and services.
Offer highly effective, fiscally responsible, creative and open service to citizens that exceeds the expectations of
the community.
QUALITY OF LIFE
TRANSPORTATION
PUBLIC SAFETY
QUALITY MUNICIPAL SERVICES
City of Maricopa Priorities
MISSION STATEMENTThe mission of the City of Maricopa is to be open,
responsive and accountable while serving the public with integrity.
25
tABLe oF ContentS
1 2

The City of Maricopa provides diverse amenities, police, and fire protection for the community. It operates under
a Council-Manager form of government with a Mayor and six Council members. The Mayor and City Council members are elected at large on a nonpartisan ballot. The Mayor is elected at large every two years; the Council members are elected every four years, biennially. There are no term limits for the Mayor or City Council members.
The City Council is responsible for setting public policy, approving the City’s annual budget, entering
agreements, providing executive leadership, making planning and development decisions, and adopting new
codes and ordinances.
Back row, pictured left to right: Councilmember Peggy Chapados, Councilmember Bridger Kimball, Councilwoman Julia R. Gusse, Councilmember Leon Potter. Front row, pictured left to right: Vice Mayor Edward Farrell, Mayor Christian Price, Councilmember Marvin L. Brown.
government government
mAyoR AnD CounCiL
89
San Francisco
Los AngelesLos Angeles
San DiegoSan Diego
Las VegasLas Vegas
Salt Lake CitySalt Lake City
PhoenixPhoenix
TucsonTucson
AlbuquerqueAlbuquerque
El PasoEl Paso
MaricopaMaricopa
HermosilloHermosillo
Rocky PointRocky PointNogalesNogales
DenverDenver
RenoReno
MEXICO
CACA
NVNV
UTUT COCO
NMNM
TXTX
AZAZ
100 MI
500 MI
750 MI
As Arizona’s 88th municipality, the City of Maricopa was incorporated on October 15, 2003. Maricopa city limits encompass approximately 45 square miles, with a planning area of 278 square miles, and is home to 44,946 residents - a more than 4,080% increase since the year 2000, when the population was under 1,500. Located only 35 minutes from Sky Harbor Airport, Maricopa offers residents and businesses the experience of a small-city atmosphere that is within a short distance to two major metropolitan areas.
City oF mARiCopA
City oRGAniZAtionAL CHARt
The City of Maricopa operates under a Council-Manager form of government, which combines the political leadership of elected officials with the managerial expertise of a professionally-trained, local government manager appointed to the position of City Manager by the City Council.
Maricopa City Manager Brenda S. Fischer joined the City in May 2011. She oversees all departments that comprise the City of Maricopa organization. A credentialed City Manager from the International City/County Management Association, she has served the public sector for more than 17 years. Ms. Fischer has extensive experience in public administration, strategic planning, organizational development, issue management, intergovernmental relations, project management, communications, and employee relations.
City mAnAGeR
Mayor & Council
Advisory Boards Council CommitteesAttorney Magistrate
Citizens
City Manager
City Clerk
Finance/Admin. Services
Fire
Human Resources
Police
Assistant City Manager
Economic Development
Community Services
Development Services
3 4

LABOR & WORKFORCEThe average household size in Maricopa is currently 3.00. The number of families in Maricopa is 11,617. This provides a significant number of young working adults in the community.
The median age in Maricopa is 31.4, compared to the U.S. median age of 37.3.
Maricopa’s labor pool is also highly educated, with 48.7% holding a bachelor’s degree or advanced degree and an astounding 89% having at least some college education. By providing local opportunities for higher education, Central Arizona College’s new Maricopa campus ensures that the City will continue to have the skilled workforce needed to attract industry and support sustainable economic growth.
popuLAtion
GROWTH TRENDSince 2008, the City population has grown overall by 28.4%.
YEAR POPULATION % CHANGE
2012 44,946 1.1
2011 44,450 2.2
2010 43,482 5.3
2009 39,429 6.5
2008 35,000 16.4
Sources: University of Arizona Eller College of Management, Economic and Business Research Center, U.S. Census Bureau, Arizona Department of Economic Security 2012 Population Estimates
PROjECTIONsThe following are population projections for the City of Maricopa, assuming an average 5% rate of growth.
YEAR POPULATION
2017 47,048
2020 54,464
2025 69,511
2030 88,716
2040 144,509
2050 235,390
Sources: ESRI Community Analyst Projections; Elliott D. Pollack & Company, City of Maricopa Economic Development Department
71% 87%16 +MILES
AGE DISTRIBUTION
EDUCATIONAL ATTAINMENT (Head of Household)
Under 15 13,060Age 16 and up 30,422Age 18 and up 29,346Age 21 and up 28,242Age 65 and up 2,762Age 85 and up 121
Average household size 3.03
Maricopa
67.5 %
70 %
65 %
30 %
6.4 %
.3 % Age Number
EMPLOYMENT CHARACTERISTICS
Finance/Insurance/Professional ServicesEducationRetailMedical/HealthcareManufacturing
Work outside Maricopa
Would prefer to work in Maricopa
Average Commute
16%
11.1%
11.5%
11.9 %
TOP INDUSTRIES FOR EMPLOYMENT
Data Sources
Data Sources
98.2%
9.5%
10.3%
15.9%
6.0%
23.7% 292
14,359
16,667
5,565
32.8%
48.7% 15.9%High school graduate or higher
Bachelor's degree or higher
Master's degree or higher
High school graduate or GED
Some college, no degree
Some technical or vocational school
Associate’s degree
Bachelor’s degree
Graduate degree or doctorate
HOUSEHOLD INCOME
HOUSEHOLDS
$63,992
$24,065
$70,692
2000 2005 2010 2016 (prj)
12.9%
SAFETY FIRST Valley Cities Comparison: 2nd Lowest Overall
2026
3232
34.438
48.559
64.86969.3
0 18 35 53 70
Gilbert
Maricopa
Scottsdale
El Mirage
Chandler
Mesa
Phoenix
Tempe
Casa Grande
Tucson
Glendale
Maricopa
1,040
26,661
41,309
5,088
POPULATION GROWTH
44,450
Maricopa | Casa Grande | Chandler | Gilbert | Goodyear
40353025201510 5 0
2000 2003 2006 2009 2011
1
4.9
25.6
39.742.7
Maricopa vs Other Cities (x Larger Than 2000)POPULATION GROWTH
2000 2003 2006 2009 2011
Median Age 31.2
2000 and 2010 U.S. Census2005 Special Census2012 ESRI BAO Projection
2008-2010 American Community Survey2010 U.S. Census
Data Source2010 U.S. Census
Data SourceCity of Maricopa 2009 Labor Survey, Prepared by Elliott D. Pollack & Company
Data SourcesArizona Dept of AdministrationU.S. Census
Data SourceFBI Uniform Crime Reports, Overall crime rate per 1,000 residents (FY 2010-2011)
Data SourceCity of Maricopa 2009 Labor Survey, Prepared by Elliott D. Pollack & Company
Data SourcesArizona Dept of Administration Annual Estimates2000 U.S. Census
Median household income
Mean household income
Per capita income
INCOmE AND NET WORTHHOUSEHOLD INCOME NUMBER PERCENTAGE
<$15,000 5,548 36.7
$15,000-$34,999 1,586 10.5
$35,000-$49,999 1,062 7.0
$50,000-$74,999 1,364 9.0
$75,000-$99,999 928 6.1
$100,000-$149,999 1,384 9.2
$150,000-$499,999 2,231 14.7
$500,000+ 1,000 6.6
Median Net Worth $40,027
Average Net Worth $223,764
Median Household Income $41,063
Average Household Income $52,121
Sources: U.S. Census Bureau, Census 2010 Summary File 1. Esri Forecasts for 2012 and 2017
POPULATION POPULATION
A significant housing boom in the early 2000s led to a stunning rate of growth in the Maricopa community. The City of Maricopa was the fastest growing city in the sixth fastest growing county in America from 2000 to 2006, according to Forbes Magazine.
From 2000 to 2010, Maricopa experienced more than
4,080% growth and was the fastest growing small city in the
United States according to the U.S. Census Bureau.
Though recent growth has fallen off this record pace, the City continues to draw new residents and seasonal visitors. The 2008 global financial crisis and ongoing economic downturn have drastically slowed new home construction and sales nationwide. Despite this, Maricopa has grown by 14.6% or an average annual rate of 3.6% since 2008.
RACE
RACE MARICOPA ARIZONA U.S.A.
White 70.2% 57.4% 63.4%
Black or African American 9.7% 4.5% 13.1%
Persons of Hispanic or Latino Origin 8.5% 30.1% 16.7%
Persons Reporting Two or More Races 5.3% 2.5% 2.3%
Asian 4.1% 3.0% 5.0%
American Indian and Alaskan Native 2.0% 5.2% 1.2%
Native Hawaiian and Other Pacific Islander 0.3% 0.3% 0.2%
Source: U.S. Census Bureau, 2010 Census
71% 87%16 +MILES
AGE DISTRIBUTION
EDUCATIONAL ATTAINMENT (Head of Household)
Under 15 13,060Age 16 and up 30,422Age 18 and up 29,346Age 21 and up 28,242Age 65 and up 2,762Age 85 and up 121
Average household size 3.03
Maricopa
67.5 %
70 %
65 %
30 %
6.4 %
.3 % Age Number
EMPLOYMENT CHARACTERISTICS
Finance/Insurance/Professional ServicesEducationRetailMedical/HealthcareManufacturing
Work outside Maricopa
Would prefer to work in Maricopa
Average Commute
16%
11.1%
11.5%
11.9 %
TOP INDUSTRIES FOR EMPLOYMENT
Data Sources
Data Sources
98.2%
9.5%
10.3%
15.9%
6.0%
23.7% 292
14,359
16,667
5,565
32.8%
48.7% 15.9%High school graduate or higher
Bachelor's degree or higher
Master's degree or higher
High school graduate or GED
Some college, no degree
Some technical or vocational school
Associate’s degree
Bachelor’s degree
Graduate degree or doctorate
HOUSEHOLD INCOME
HOUSEHOLDS
$63,992
$24,065
$70,692
2000 2005 2010 2016 (prj)
12.9%
SAFETY FIRST Valley Cities Comparison: 2nd Lowest Overall
2026
3232
34.438
48.559
64.86969.3
0 18 35 53 70
Gilbert
Maricopa
Scottsdale
El Mirage
Chandler
Mesa
Phoenix
Tempe
Casa Grande
Tucson
Glendale
Maricopa
1,040
26,661
41,309
5,088
POPULATION GROWTH
44,450
Maricopa | Casa Grande | Chandler | Gilbert | Goodyear
40353025201510 5 0
2000 2003 2006 2009 2011
1
4.9
25.6
39.742.7
Maricopa vs Other Cities (x Larger Than 2000)POPULATION GROWTH
2000 2003 2006 2009 2011
Median Age 31.2
2000 and 2010 U.S. Census2005 Special Census2012 ESRI BAO Projection
2008-2010 American Community Survey2010 U.S. Census
Data Source2010 U.S. Census
Data SourceCity of Maricopa 2009 Labor Survey, Prepared by Elliott D. Pollack & Company
Data SourcesArizona Dept of AdministrationU.S. Census
Data SourceFBI Uniform Crime Reports, Overall crime rate per 1,000 residents (FY 2010-2011)
Data SourceCity of Maricopa 2009 Labor Survey, Prepared by Elliott D. Pollack & Company
Data SourcesArizona Dept of Administration Annual Estimates2000 U.S. Census
Median household income
Mean household income
Per capita income
25,000
50,000
75,000
100,000
125,000
150,000
175,000
200,000
225,000
250,000
2017 2020 2025 2030 2040 2050
5 6

Since 2011, the City has experienced modest recovery in the local housing market as evidenced by lower vacancy rates, foreclosure resales, rising home prices, and increased permit activity and new home construction.
mEDIAN HOmE PRICE TRENDsMaricopa’s median home prices reached a low in 2011 but are showing signs of recovery after a four-year high in 2012.
YEAR SALES MEDIAN PRICE
2012 2,434 $113,950
2011 3,550 $94,900
2010 3,050 $106,375
2009 2,460 $104,086
2008 2,095 $148,293
Source: ASU W.P. Carey School of Business Real Estate Study Reports. Consistent data reports not available prior to 2008
sINGLE FAmILy HOusING PERmITs
CALENDAR YEAR PERMITS
2012 312
2011 120
2010 186
2009 400
2008 913
2007 2,535
2006 2,471
2005 6,613
Source: City of Maricopa Development Services Department
HOusING PERmIT FORECAsTs
YEAR CONSERVATIVE BASELINE AGGRESSIVE
2012 80 150 360
2013 80 220 440
2014 150 300 600
2015 250 500 1,000
2016 350 700 1,400
Sources: Elliott D. Pollack & Company, University of Arizona, RL Brown, and City of Maricopa Development Services Department
Over the past five years, Maricopa has strongly weathered the storm of the recession in terms of months inventory of listed homes and home vacancy rates.
In 2009, the City of Maricopa began monitoring months inventory of housing in the community through a partnership with Elliott D. Pollack & Company. Maricopa has consistently outperformed many cities in the valley in terms of months’ supply of listings, indicating that homes on the market in Maricopa are being bought and occupied at a faster rate and staying vacant for less time.
According to data from Global Water Resources, a local water and wastewater utility provider, in January 2012, the home vacancy rate was 7.3%, which dropped to 5.8% by November 2012.
HouSinG & pRopeRty
HOUSING & PROPERTY HOUSING & PROPERTY
0
300
600
900
1,200
1,500
2012 2013 2014 2015 2016
Conservative Baseline Aggressive
50
200
350
500
650
800
950
2008 2009 2010 2011 2012
7 8

5-yEAR COmPARIsON OF FuLL CAsH vALuE OF TAxABLE PROPERTyIf no statutory method is prescribed by Arizona State Statute, full cash value is synonymous with market value. Since 2005, the full cash value of taxable property has increased by 380% due to the significant number of single-family residential homes built in the mid-2000s. Since the peak in 2009, the value of taxable property has decreased by 42.3% due to declining values coupled with a significant slow down of single-family residential homes being constructed.
YEAR MARICOPA CASA GRANDE QUEEN CREEK FLORENCE CHANDLER
2012 VALUE 1,869,964,570 3,015,946,656 31,697,611 775,868,360 21,102,582,630
% CHANGE (4.5) (1.1) (2.8) (0.2) (5.8)
2011 VALUE 1,958,703,545 3,050,404,674 32,599,261 777,362,233 22,396,334,191
% CHANGE (15.3) (8.2) (42.8) (4.0) (18.5)
2010 VALUE 2,311,499,618 3,323,460,273 56,945,159 810,034,125 27,493,103,377
% CHANGE (28.7) (11.4) (29) (14.2) (11.3)
2009 VALUE 3,242,443,844 3,750,566,469 80,185,122 943,857,841 31,011,422,761
% CHANGE 8.2 2.8 2.9 4.4 5.8
2008 VALUE 2,996,553,713 3,650,128,387 77,889,287 904,396,868 29,299,993,619
% CHANGE 47.7 N/A N/A N/A N/A
Sources: Maricopa County Treasurer’s Office, Pinal County Treasurer’s Office
AssEssED vALuE
YEAR VALUE % CHANGE
2012 1,869,964,570 -4.5
2011 1,958,703,545 -15.3
2010 2,311,499,618 -28.7
2009 3,242,443,844 8.2
2008 2,996,553,713 47.7
2007 2,029,089,506 178.5
2006 728,591,537 87.3
2005 389,058,101 n/a
Source: Pinal County Treasurer’s Office
HOUSING & PROPERTY HOUSING & PROPERTY
-50%
0%
50%
100%
150%
200%
2006 2007 2008 2009 2010 2011 2012
9 10

FIsCAL yEAR LEvy COLLECTIONs
FY ENDED LEVY
% COLLECTED WITHIN FY OF
LEVY
CALCULATED TO THE END OF THE CURRENT YEAR
2012 $11,475,826 90.5 90.5%
2011 $11,250,307 97.2 99.5%
2010 $9,242,329 96.0 99.5%
2009 $8,044,384 94.9 99.4%
2008 $5,740,847 94.7 99.0%
Source: City of Maricopa Finance Department
TOTAL TAx RATE
2012 2013
City of Maricopa 5.0892 36.9% 5.1934 36.9%
Pinal County 3.6888 26.7% 3.5190 25.0%
Pinal County Jr. College 1.7279 12.5% 1.7551 12.5%
Maricopa Unified School District 1.5971 11.6% 1.6709 11.9%
Other Special Districts 0.6164 4.5% 0.6481 4.6%
Electrical District #3 0.4227 3.1% 0.5447 3.9%
State School Equalization 0.3928 2.8% 0.4717 3.4%
Pinal County Flood 0.1700 1.2% 0.1700 1.2%
Pinal County Library 0.0970 0.7% 0.0970 0.7%
Total 5.0892 100% 5.1934 100%
Sources: City of Maricopa Finance Department, Pinal County Treasurer’s Office
CITy OF mARICOPA TAx RATE
2012 2013 % CHANGE
Primary Tax Rate 4.4364 4.5017 1.5
Secondary Tax Rate 0.6528 0.6917 6.0
Total 5.0892 5.1934
Source: City of Maricopa Finance Department
PROPERTY TAX PROPERTY TAX11 12
ExAmPLE TAx BILL CALCuLATION
OVERLAPPING CITY ONLY
Assessed Value $100,000 $100,000
Assessment Ratio 0.10000 0.10000
Net Assessed Value $10,000 $10,000
Tax Rate/$100 Net Assessed Value 14.0699 5.1934
Annual Property Tax Bill $1,406.99 $519.34
Source: City of Maricopa Finance Department
GENERAL PLAN LAND usE
LAND USE TYPE % OF TOTAL
Master Planned Community 23
Low Density Residential 20
Park/Open Space 16
Rural 13
Medium Density Residential 11
Office/Employment 8
Commercial 3
High Density Residential 2
Agricultural 1
Light Industrial 1
Mixed Use 1
Public/Institutional 1
Source: City of Maricopa General Plan
Master Planned CommunityLow Density ResidentialPark/Open SpaceRuralMedium Density ResidentialOffice/EmploymentCommercialHigh Density ResidentialAgriculturalLight IndustrialMixed UsePublic/Institutional
Master Planned CommunityLow Density ResidentialPark/Open SpaceRuralMedium Density ResidentialOffice/EmploymentCommercialHigh Density ResidentialAgriculturalLight IndustrialMixed UsePublic/Institutional
Master Planned CommunityLow Density ResidentialPark/Open SpaceRuralMedium Density ResidentialOffice/EmploymentCommercialHigh Density ResidentialAgriculturalLight IndustrialMixed UsePublic/Institutional
Master Planned CommunityLow Density ResidentialPark/Open SpaceRuralMedium Density ResidentialOffice/EmploymentCommercialHigh Density ResidentialAgriculturalLight IndustrialMixed UsePublic/Institutional
Master Planned CommunityLow Density ResidentialPark/Open SpaceRuralMedium Density ResidentialOffice/EmploymentCommercialHigh Density ResidentialAgriculturalLight IndustrialMixed UsePublic/Institutional
Master Planned CommunityLow Density ResidentialPark/Open SpaceRuralMedium Density ResidentialOffice/EmploymentCommercialHigh Density ResidentialAgriculturalLight IndustrialMixed UsePublic/Institutional
Master Planned CommunityLow Density ResidentialPark/Open SpaceRuralMedium Density ResidentialOffice/EmploymentCommercialHigh Density ResidentialAgriculturalLight IndustrialMixed UsePublic/Institutional
Master Planned CommunityLow Density ResidentialPark/Open SpaceRuralMedium Density ResidentialOffice/EmploymentCommercialHigh Density ResidentialAgriculturalLight IndustrialMixed UsePublic/Institutional
Master Planned CommunityLow Density ResidentialPark/Open SpaceRuralMedium Density ResidentialOffice/EmploymentCommercialHigh Density ResidentialAgriculturalLight IndustrialMixed UsePublic/Institutional
Master Planned CommunityLow Density ResidentialPark/Open SpaceRuralMedium Density ResidentialOffice/EmploymentCommercialHigh Density ResidentialAgriculturalLight IndustrialMixed UsePublic/Institutional
Master Planned CommunityLow Density ResidentialPark/Open SpaceRuralMedium Density ResidentialOffice/EmploymentCommercialHigh Density ResidentialAgriculturalLight IndustrialMixed UsePublic/Institutional
Master Planned CommunityLow Density ResidentialPark/Open SpaceRuralMedium Density ResidentialOffice/EmploymentCommercialHigh Density ResidentialAgriculturalLight IndustrialMixed UsePublic/Institutional
Master Planned CommunityLow Density ResidentialPark/Open SpaceRuralMedium Density ResidentialOffice/EmploymentCommercialHigh Density ResidentialAgriculturalLight IndustrialMixed UsePublic/Institutional
The General Plan is a policy document that guides growth and development in the City. State law requires communities to adopt a General Plan and review it every 10 years. The City’s current General Plan was approved by voters in May 2006. However, since the adoption of the General Plan, there has been significant growth and development within the corporate limits, the planning boundary, and the region in general, with varying degrees of impacts. The General Plan Update is scheduled to start in fall 2013. The following chart shows the City’s future land use at buildout.
LAND usE
Of the total tax bill for Fiscal Year 2013, the City of Maricopa
receives 36.9%.
The property tax rates reflect both primary property tax rates, which can be used for City operations, and secondary property tax rates, which can only be used for principal, and interest cost on bonds. The tax rates are net of a unilateral reduction in the primary tax rates for the different taxing jurisdictions by the Pinal County Treasurer.
pRopeRty tAX
City of MaricopaLow Density ResidentialPark/Open SpaceRuralMedium Density ResidentialOffice/EmploymentCommercialHigh Density ResidentialAgricultural
Master Planned CommunityLow Density ResidentialPark/Open SpaceRuralMedium Density ResidentialOffice/EmploymentCommercialHigh Density ResidentialAgriculturalLight IndustrialMixed UsePublic/Institutional
Master Planned CommunityLow Density ResidentialPark/Open SpaceRuralMedium Density ResidentialOffice/EmploymentCommercialHigh Density ResidentialAgriculturalLight IndustrialMixed UsePublic/Institutional
Master Planned CommunityLow Density ResidentialPark/Open SpaceRuralMedium Density ResidentialOffice/EmploymentCommercialHigh Density ResidentialAgriculturalLight IndustrialMixed UsePublic/Institutional
Master Planned CommunityLow Density ResidentialPark/Open SpaceRuralMedium Density ResidentialOffice/EmploymentCommercialHigh Density ResidentialAgriculturalLight IndustrialMixed UsePublic/Institutional
Master Planned CommunityLow Density ResidentialPark/Open SpaceRuralMedium Density ResidentialOffice/EmploymentCommercialHigh Density ResidentialAgriculturalLight IndustrialMixed UsePublic/Institutional
Master Planned CommunityLow Density ResidentialPark/Open SpaceRuralMedium Density ResidentialOffice/EmploymentCommercialHigh Density ResidentialAgriculturalLight IndustrialMixed UsePublic/Institutional
Master Planned CommunityLow Density ResidentialPark/Open SpaceRuralMedium Density ResidentialOffice/EmploymentCommercialHigh Density ResidentialAgriculturalLight IndustrialMixed UsePublic/Institutional
Master Planned CommunityLow Density ResidentialPark/Open SpaceRuralMedium Density ResidentialOffice/EmploymentCommercialHigh Density ResidentialAgriculturalLight IndustrialMixed UsePublic/Institutional
Master Planned CommunityLow Density ResidentialPark/Open SpaceRuralMedium Density ResidentialOffice/EmploymentCommercialHigh Density ResidentialAgriculturalLight IndustrialMixed UsePublic/Institutional

ALL FuNDs: Fy11-12GENERAL FUND SPECIAL REVENUE FUNDS DEBT SERVICE FUND CAPITAL PROJECTS FUNDS TOTAL
RevenuesProperty Taxes $10,826,301 $- $- $- $10,826,301 Sales Taxes 6,833,629 767,995 7,601,624 Franchise Taxes 285,739 285,739 Licenses, Fees, and Permits 480,342 480,342 Intergovernmental Revenue 8,889,307 5,720,911 14,610,218 Charges for Services 512,393 8,836 521,229 Fines & Forfeitures 431,180 431,180 Investment Income 59,838 10,243 42,626 112,707 Miscellaneous 495,937 19,389 1,171,423 1,686,749
Total Revenues 28,814,666 5,759,379 - 1,982,044 36,556,089 Expenditures by Function
General Governmental 5,514,748 1,722,480 1,264,879 8,502,107 Public Safety 14,440,871 294,622 96,962 14,832,455 Community Services 1,905,550 24,348 1,929,898 Development Services 2,032,666 2,531,561 1,533,817 6,098,044 Capital Outlay 1,753,976 703,659 3,680,691 6,138,326 Debt Service 276,901 1,792,508 2,069,409
Total Expenditures 25,924,712 5,276,670 1,792,508 6,576,349 39,570,239 Other Financing Sources
Sale of Assets 211,200 211,200 Transfers In - 2,092,402 35,042,868 37,135,270
Transfers Out (37,135,270) (37,135,270)Total Other Financing Sources (uses) (36,924,070) - 2,092,402 35,042,868 211,200 Changes in Fund Balance (34,034,116) 482,709 299,894 30,448,563 (2,802,950)Beginning Fund Balance 55,364,181 10,227,497 (334,556) 39,742,973 105,000,095 Ending Fund Balance $21,330,065 $10,710,206 $(34,662) $70,191,536 $102,197,145 Source: City of Maricopa Finance DepartmentNote: Beginning in FY2012, CIP projects were no longer presented in the General Fund
GENERAL FuND: Fy11-12 FuND BALANCE AND COmPARIsONs
2011 2012 2013 BUDGET 2012 VS. 2013 BUDGET % CHANGERevenues
Property Taxes $9,912,700 $10,826,301 $10,032,647 $(793,654) -7.3Sales Taxes 7,454,918 6,833,629 6,120,000 (713,629) -10.4Franchise Taxes 315,240 285,739 272,000 (13,739) -4.8Licenses, Fees and Permits 320,909 480,342 408,250 (72,092) -15.0Intergovernmental Revenue 3,685,563 8,889,307 9,841,190 951,883 10.7Charges for Services 544,625 512,393 285,470 (226,923) -44.3Fines & Forfeitures 470,509 431,180 470,000 38,820 9.0Investment Income 126,128 59,838 110,000 50,162 83.8Miscellaneous 254,129 495,937 367,360 (128,577) -25.9
Total Revenues 23,084,721 28,814,666 27,906,917 (907,749) -3.2Expenditures by Function
General Governmental 6,317,926 5,514,748 8,587,554 3,072,806 55.7Public Safety 13,658,478 14,440,871 15,358,712 917,841 6.4Community Services 1,818,910 1,905,550 2,388,830 483,280 25.4Development Services 3,132,746 2,032,666 2,385,994 353,328 17.4Capital Outlay 6,851,199 1,753,976 9,095 (1,744,881) -99.5Debt Service 612,921 276,901 1,065,323 788,422 284.7
Total Expenditures 32,392,180 25,924,712 29,795,508 3,870,796 14.9Other Financing Sources
Sale of Assets 438,460 211,200 - (211,200) -100.0Transfers In -
Transfers Out - (37,135,270) - 37,135,270 -100.0Total Other Financing Sources (uses) 438,460 (36,924,070) - 36,924,070 -100.0Changes in Fund Balance (8,868,999) (34,034,116) (1,888,591) 32,145,525 -94.5Beginning Fund Balance 64,233,180 55,364,181 21,330,065 (34,034,116) -61.5Ending Fund Balance $55,364,181 $21,330,065 $19,441,474 $(1,888,591) -8.9Source: City of Maricopa Finance DepartmentNote: Beginning in FY2012, CIP projects were no longer presented in the General Fund
To view a full copy of the City of Maricopa Annual Budget Book or the Comprehensive Annual Financial Report (CAFR), visit the Finance Department page of the City website at maricopa-az.gov. These documents include detailed analysis and explanations of the funds summaries in the table below.
On August 29, 2012, the Government Finance Officers Association of the United States and Canada (GFOA) awarded the City the GFOA’s Certificate of Achievement for Excellence in Financial Reporting for its Fiscal Year 2010-2011 Comprehensive Annual Financial Report (CAFR). This is the first time the City has received the award for its annual financial report. The award is the highest form of recognition in the area of governmental accounting and financial reporting.
FISCAL STRENGTH FISCAL STRENGTH
FiSCAL StRenGtH
13 14

BANNER HEALTH CENTERThe Banner Health Center is the first major medical facility in Maricopa and opened in May 2012. Made possible through a public-private partnership between the City and Banner Health, the 40,000 square-foot
facility provides primary and specialty medical care. Banner has plans to expand the center and its services as local demand requires. Since opening, Banner Health has hired 29 employees to work at the Maricopa location, 19 of which are local residents. The new jobs created at the center provided a number of these employees an opportunity to both live and work in Maricopa.
CENTRAL ARIZONA COLLEGE (CAC)CAC’s new Maricopa campus opened for business in January 2013. Construction of phase one, consisting of approximately 76,000 square feet, commenced in December 2011. CAC’s 25-year master plan calls for the campus
to accommodate more than 20,000 students on an annual basis with a gross square footage of 720,000 feet. CAC will continue to provide services out of its Maricopa Center, 2,640 square feet of leased space on John Wayne Parkway.
DIGNITy HEALTH ARIZONAThe healthcare provider formally announced plans for current and long-term expansion into Maricopa. An urgent care center is set to open in 2013. The center will have on-site radiology and lab capabilities, and will see patients of all ages. The company also purchased 18.56 acres in the City and has long-term plans for a 34,000 square foot, free-standing emergency hospital with treatment rooms, surgical suites, patient beds, and outpatient imaging.
mAjOR EmPLOyERsEmployers listed below include the City’s top employers as well as key local economic drivers.
EMPLOYER INDUSTRY EST. # OF EMPLOYEES
Harrah's Ak-Chin Casino Resort* Gaming 725
Maricopa Unified School District Schools 598
Walmart Department Stores 235
City of Maricopa Municipal Government 213
Fry's Food Store Grocers-Retail 200
Volkswagen Proving Grounds Automotive Testing 150
Pinal Feeding Company Inc. Agriculture 120
McDonald's (2 store total) Fast Food 87
Ak-Chin Farms* Agriculture 84
USDA Arid-Land Agricultural Research Center* Agricultural Research 80
Bashas Grocers-Retail 79
Legacy Traditional School Schools 78
University of Arizona Maricopa Agricultural Center* Agricultural Research 67
Southern Dunes Golf Club* Tourism 60
Sequoia Pathway Academy Schools 56
Arizona Castings Inc.* Aluminum Foundries 50
Electrical District 3* Electrical Companies 41
Duke at Rancho El Dorado Tourism 40
Ace Hardware Hardware-Retail 35
Scott's Miracle Gro Agriculture 33
Banner Health Center Medical 29
Note: Areas marked with an asterisk (*) are outside of the City limits but within the City’s planning area Source: 2012 data was obtained via telephone calls to each major employer; data as of November 28, 2012
The City continues to see expansion in healthcare, higher education, retail, and service industries as businesses look to fill gaps in the local economy and meet the needs of Maricopa’s growing population.
eConomiC DeVeLopment pRoJeCtS
ECONOMICS ECONOMICS
empLoyeRS
NEW RETAIL DEvELOPmENTThere have been signs of resurgence in the local retail market with new development and renewed interest from retailers. The Shops at The Wells, a 13,000 square foot retail center, opened in the fall of 2012 in front of Walmart. Building permits were pulled for the retail center in late December 2011 with site prep work starting in March 2012. Tenants at the center include PAC Dental, Great Clips, Papa John’s Pizza, Cricket Wireless, and more.
Aaron’s, a national retailer of lease-to-own electronics, appliances and furniture, started construction on its new 7,000 square foot store at Edison Place in early fall 2012 and opened in late December. In addition, two prime retail sites along John Wayne Parkway were purchased by a Phoenix-area development company in 2011 and 2012, and they are working to secure retail tenants.
COmmERCIAL vACANCy RATEsCommercial vacancy rates in Maricopa are a key indicator of business activity and needs in the community. For the past three years, Maricopa has enjoyed a lower than average overall vacancy rate. This is due to two factors: there is growing demand for space for business operations in the City; and there is also an overall lack of available space in the local market for those businesses to move into.
0
5
10
15
20
25
30
2010 2011 2012
Maricopa Buckeye Casa Grande Chandler Goodyear
15 16

sHOP LOCAL CAmPAIGNThe City has initiated a Shop Local campaign to raise awareness of the many benefits of shopping locally and encourage residents to shop local whenever possible. As part of this campaign, a Shop Local contest was launched in April 2012. Shoppers submit receipts for local purchases to the program website and are entered into a monthly contest for a chance to win a $100 gift certificate valid at nearly 50 participating businesses. Initially scheduled to run through November, the Maricopa City
Council voted to extend this pilot program through June 2013.
BusINEss INCuBATORIn July of 2012, the City was awarded USDA grant funds to launch its first small business incubator, which will open in early 2013. The Maricopa Center for Entrepreneurship (MCE) will provide business training and business incubation services to local start-up companies.
EsTRELLA BusINEss PARKThe City conducted a feasibility study to determine the viability of developing approximately 50 acres of City-owned land as a mixed-use business park. The City is now exploring partnership opportunities with interested industrial and office developers for the master planning, lease/purchase and development of the site. The goal is to seed and spur development of a business park which will provide employment opportunities for local residents, allow expanding businesses to remain in Maricopa and facilitate the relocation of industry to Maricopa.
BuSineSS SuppoRt
2012 NEW sTOREFRONT BusINEss
COMPANYCAPITAL
INVESTMENT EMPLOYEES OPEN DATE
Aaron's $512,820 6 December 2012
Banner Health Center $10,553,376 29 May 2012
Cilantro's Mexican Cocina $1,300 10 April 2012
Copa Craze $4,000 2 August 2012
Crossfit Maricopa $500 4 August 2012
Desert Eyecare Center $36,000 2 November 2012
Great Clips $104,410 10 November 2012
HomeSmart Success Real Estate $500 6 October 2012
Honeycutt Coffee Company $150,350 4 October 2012
Ismile Nails & Spa $21,500 4 November 2012
Maricopa Home Center $104,410 3 October 2012
Mountain Brooks Environmental -- 1 November 2012
Papa John's Pizza $119,027 31 November 2012
San Tan Oral Surgery -- 4 January 2012
Sprint Fast Wireless $8,000 5 March 2012
TOTAL $11,616,193 121
Sources: City of Maricopa Development Services and Economic Development Departments
PERmIT & LICENsE ACTIvITy By FIsCAL yEAR
YEAR BUSINESS LICENSESSINGLE FAMILY
BUILDING PERMITSCOMMERCIAL
BUILDING PERMIT
2012 1,174 225 35
2011 946 111 72
2010 723 382 44
2009 1,193 402 92
2008 970 1,596 146
Source: City of Maricopa Development Services Department
In 2012, the City issued 119 new business licenses to home-based businesses out of a total of 341 overall new licenses, accounting for 35% of all new business licenses issued. As many of those new licenses represent out-of- town businesses that require licensing to do business within the community, it is important to note that 54% of all new 2012 business licenses that are Maricopa-based are also home-based.
sALEs TAx COLLECTIONsSales tax collections decreased dramatically after 2009 due to lower levels of construction sales tax collected. However, openings of additional retail offerings such as Big O Tires and Walmart have allowed for moderate continued increases since 2010.
FY ENDED TAX COLLECTED
2012 $6,904,365
2011 $6,876,866
2010 $5,928,900
2009 $9,815,332
Source: City of Maricopa Finance Department
BUSINESS ACTIVITY BUSINESS ACTIVITY
BuSineSS ACtiVity
FAÇADE ImPROvEmENT PROGRAmThe Maricopa City Council has shown its commitment to the Heritage District by approving funding for a façade improvement program. Commercial and residential property owners and tenants are now able to receive reimbursements for eligible, pre-approved façade improvements. The program is designed to stimulate revitalization as well as spur private, commercial investment by requiring that applicants match any City funding received.
Economic development efforts are guided by the Economic Development Strategic Plan adopted by the Maricopa City Council in June 2011. Historically an agricultural community, Maricopa is home to a thriving cluster of agritech businesses and research facilities. The City, in 2012, launched the following initiatives aimed at supporting local business growth, encouraging redevelopment, and attracting larger employers to the community:
S H O PL O C A L
PARTICIPATING BUSINESS
SUPPORTING COMMUNITY PARKS, PROGRAMS, SAFETY SERVICES AND LOCAL AMENITIES
L E A R N M O R E AT S H O P L O C A L . M A R I C O PA - A Z . G O V
17 18

The City is dedicated to offering a wide variety of opportunities for citizens to connect with the local government, and is continually working to enhance its service offerings to the community.
24/7 CITy HALL INITIATIvEThe City has new enhanced hours at City Hall. With the new hours, it launched City Hall 24/7, a host of online services designed to make doing business or connecting with the City as easy as clicking on a web link. Examples of current online services include:
• Applying for employment with the City • Signing up for a Parks and Recreation Class • Reporting a Code violation or repair request• Making a Public Records Request• Viewing current and archived City Council meetings • Searching for available commercial properties
LEADERsHIP ACADEmyThe City recently began its fifth year of offering Leadership Academy classes to residents interested in gaining an in-depth understanding of City operations. The Maricopa City Council, in 2012, also made attendance at Leadership Academy a requirement for future Advisory Board, Committee and Commission members. Since inception, the program has graduated 134 from the program.
QuALity muniCipAL SeRViCeS
QuALity oF LiFe
The City offers a high quality of life for current and prospective residents. Existing facilities include an 8,000 square foot public library at the corner of Smith-Enke Road and Porter Road, and Pacana Park, a 28-acre community park with soccer and baseball fields, basketball courts, a ramada and tiny tot play area, and catch and release lake.
2012 LIBRARy INFORmATION CATEGORY TOTAL
Items in City collection 32,060
Items loaned 253,872
Patron visits 150,794
Residents with library cards 32,522
New library cards 4,410
Inter-library loans 19,594
Story Time programs 206
Story Time attendance 4,309
Summer reading program participants 800
Internet use visitations 22,365
Source: Maricopa Public Library
2012 RECREATION INFORmATION PROGRAM TYPE PARTICIPANTS
Friday Open Gym basketball 3,096
Super Teens 2,340
Maricopa In Motion 940
Camps, art & music 347
General interest 249
Teen tournaments & contests 233
Dance & gymnastics classes 191
Open gym (Pathways) 108
Maricopa E-Team & Youth Council 87
Summer Fun & Fitness Camp 85
Source: City of Maricopa Community Services Department
QUALITY OF LIFE QUALITY OF LIFE
LIBRARyThe Maricopa Public Library is an active center, with programs such as Story Times, book clubs, Read to the Dog, Arizona Reads Month, Dr. Seuss’s Birthday Celebration, summer and winter reading programs, Food for Fines Month(s), Fun Van, pumpkin decorating contest, What’s In
Your Library and Mr. and Mrs. Claus. The Library is now officially a member of the Pinal County Library District eBooks program which has access to more than 1,000 titles. All you need is a device such as a Nook, iPhone or iPad, Kobo reader, Android phone or tablet device and a library card with a PIN number.
RECREATIONThe City sponsors many community events and programs such as the annual Fishing Derby (500 participants), Salsa Festival (15,000 attendees), Holiday Homes & Businesses on Parade, Mysterious Mansion Mayhem, and 4th of July Celebration. Information on recreation programs offered in Maricopa can be found in the Activity Guide published at least three times a year. Participation rates for some of the many teen and youth programs offered in Maricopa are listed in the table to the right.
COFFEE WITH THE CHIEFIn late 2011, Police Chief Steve Stahl began a monthly “Coffee with the Chief” program held at various locations throughout the community. Open to the public, it is an opportunity for residents to meet the Chief, ask questions and find out what’s happening in the Police Department.
REDEVELOPMENT AND BLIGHT REMOVALA number of initiatives are aimed at ensuring that Maricopa residents enjoy a safe and aesthetically pleasing community. The City’s Copa Cares program holds three special cleanup events per year. In 2012, the Maricopa City Council approved the creation of policies for the abatement of burned structures in the City, and the graffiti abatement team has abated over 1,600 graffiti images, 95% of which were completed within 24 hours of notice. The City of Maricopa also provides a method for residents to safely dispose of Christmas trees by dropping them off at a designated City property. Since the inception of this program, 2,175 trees have been safely chipped and disposed.
EFFORTS IN SUSTAINABILITYIn 2012, Maricopa completed a grant-funded solar rebate program that was designed to encourage the installation of photovoltaic (PV) systems on residential or commercial buildings. The City provided a monetary rebate incentive of 60 cents per DC watt installed, up to $3,000 per household or commercial building. The program rebated a total of 36 Maricopa residents with an average rebate of $2,769 per participant, and a total of 241,627 kWh of renewable energy was generated. This amount of energy is equivalent to annual CO2 emissions from 33 passenger vehicles.
19 20
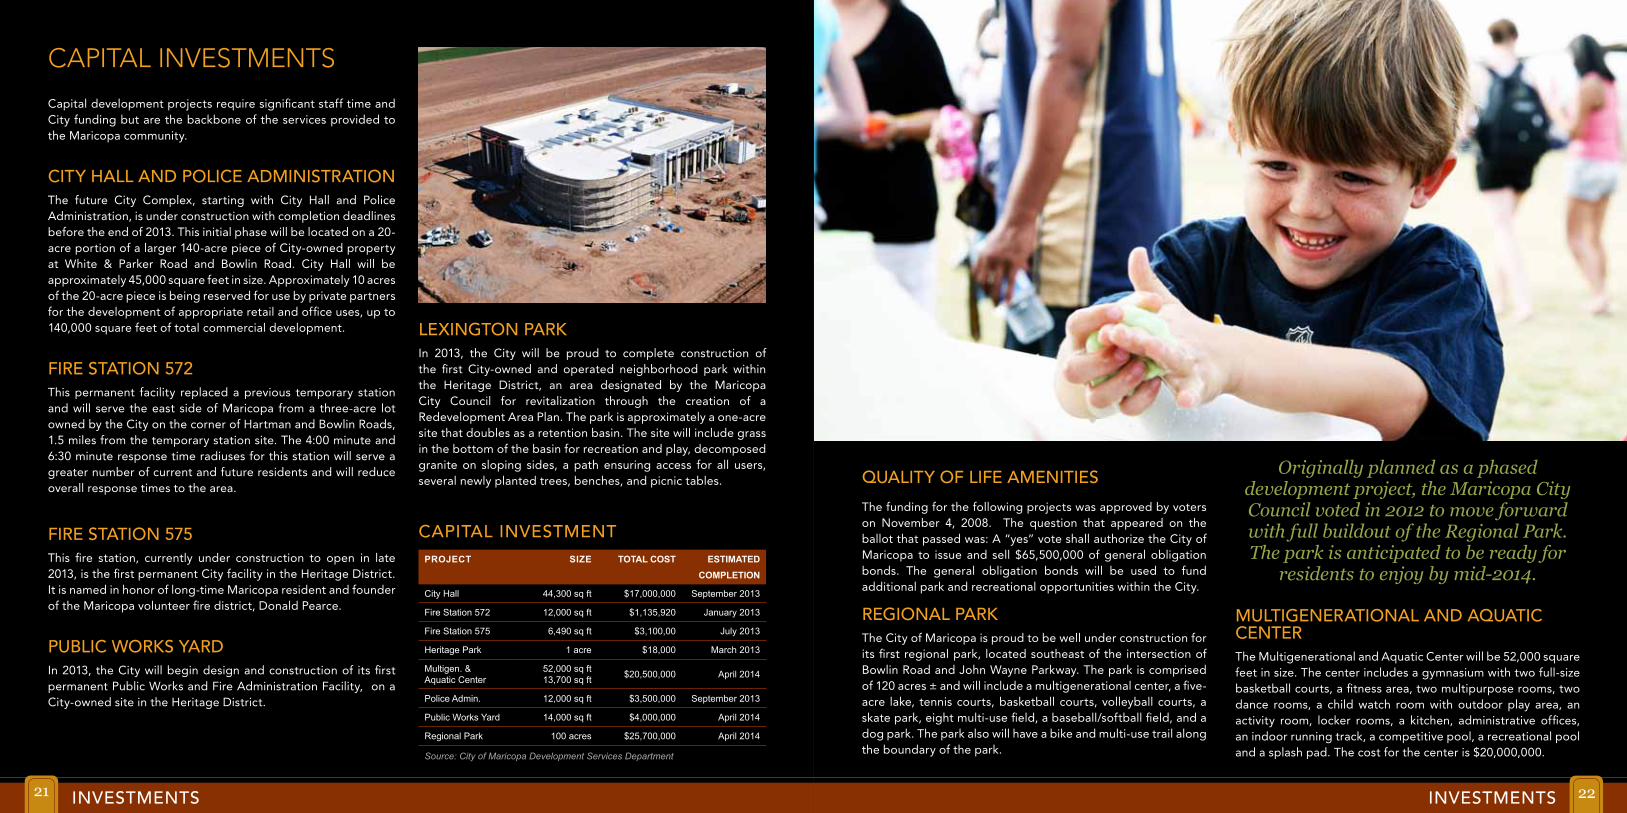
Capital development projects require significant staff time and City funding but are the backbone of the services provided to the Maricopa community.
CITy HALL AND POLICE ADmINIsTRATIONThe future City Complex, starting with City Hall and Police Administration, is under construction with completion deadlines before the end of 2013. This initial phase will be located on a 20-acre portion of a larger 140-acre piece of City-owned property at White & Parker Road and Bowlin Road. City Hall will be approximately 45,000 square feet in size. Approximately 10 acres of the 20-acre piece is being reserved for use by private partners for the development of appropriate retail and office uses, up to 140,000 square feet of total commercial development.
FIRE sTATION 572This permanent facility replaced a previous temporary station and will serve the east side of Maricopa from a three-acre lot owned by the City on the corner of Hartman and Bowlin Roads, 1.5 miles from the temporary station site. The 4:00 minute and 6:30 minute response time radiuses for this station will serve a greater number of current and future residents and will reduce overall response times to the area.
FIRE sTATION 575This fire station, currently under construction to open in late 2013, is the first permanent City facility in the Heritage District. It is named in honor of long-time Maricopa resident and founder of the Maricopa volunteer fire district, Donald Pearce.
PuBLIC WORKs yARDIn 2013, the City will begin design and construction of its first permanent Public Works and Fire Administration Facility, on a City-owned site in the Heritage District.
QuALITy OF LIFE AmENITIEs
The funding for the following projects was approved by voters on November 4, 2008. The question that appeared on the ballot that passed was: A “yes” vote shall authorize the City of Maricopa to issue and sell $65,500,000 of general obligation bonds. The general obligation bonds will be used to fund additional park and recreational opportunities within the City.
REGIONAL PARKThe City of Maricopa is proud to be well under construction for its first regional park, located southeast of the intersection of Bowlin Road and John Wayne Parkway. The park is comprised of 120 acres ± and will include a multigenerational center, a five-acre lake, tennis courts, basketball courts, volleyball courts, a skate park, eight multi-use field, a baseball/softball field, and a dog park. The park also will have a bike and multi-use trail along the boundary of the park.
CApitAL inVeStmentS
CAPITAL INvEsTmENTPROJECT SIZE TOTAL COST ESTIMATED
COMPLETION
City Hall 44,300 sq ft $17,000,000 September 2013
Fire Station 572 12,000 sq ft $1,135,920 January 2013
Fire Station 575 6,490 sq ft $3,100,00 July 2013
Heritage Park 1 acre $18,000 March 2013
Multigen. & Aquatic Center
52,000 sq ft 13,700 sq ft $20,500,000 April 2014
Police Admin. 12,000 sq ft $3,500,000 September 2013
Public Works Yard 14,000 sq ft $4,000,000 April 2014
Regional Park 100 acres $25,700,000 April 2014
Source: City of Maricopa Development Services Department
INVESTMENTS INVESTMENTS
LExINGTON PARKIn 2013, the City will be proud to complete construction of the first City-owned and operated neighborhood park within the Heritage District, an area designated by the Maricopa City Council for revitalization through the creation of a Redevelopment Area Plan. The park is approximately a one-acre site that doubles as a retention basin. The site will include grass in the bottom of the basin for recreation and play, decomposed granite on sloping sides, a path ensuring access for all users, several newly planted trees, benches, and picnic tables.
Originally planned as a phased development project, the Maricopa City Council voted in 2012 to move forward with full buildout of the Regional Park. The park is anticipated to be ready for
residents to enjoy by mid-2014.
muLTIGENERATIONAL AND AQuATIC CENTERThe Multigenerational and Aquatic Center will be 52,000 square feet in size. The center includes a gymnasium with two full-size basketball courts, a fitness area, two multipurpose rooms, two dance rooms, a child watch room with outdoor play area, an activity room, locker rooms, a kitchen, administrative offices, an indoor running track, a competitive pool, a recreational pool and a splash pad. The cost for the center is $20,000,000.
21 22

inFRAStRuCtuRe inVeStmentS & pRoJeCtS
ZONING CODE REWRITEThe City has begun its first comprehensive Zoning Code Rewrite. The purpose of the project, which is estimated to be completed in November 2013, is to comprehensively deliver a Zoning Code that enhances the quality of the community while allowing for faster development processes.
sIDEWALK CONNECTIvITy IN RETAIL CORRIDOR The intent of this user-friendly project is to provide pedestrian connectivity to shopping by constructing sidewalks on State Route 238 from the Acacia Crossing subdivision to State Route 347, and on State Route 347 from the Cobblestone subdivision to State Route 238. This is an Arizona Department of Transportation (ADOT) grant-funded project. Construction will begin in late 2013 and complete by the end of 2014. Initial delays, due to conflicts with sidewalk ramps and right-of-way acquisition, are nearly resolved.
PROSPEROUS FUTURE PROSPEROUS FUTURE
I-11 & INTERmOuNTAIN WEsT CORRIDOR sTuDyInitiated in September 2012, this project is in the early stages of advancement. It will study factors including Economic Development, Environment and Sustainability, Land Use and Community Development.
sTATE ROuTE 347 GRADE sEPARATIONSince 2008, the City has identified the need for a grade separation at State Route 347 and the Maricopa-Casa Grande Highway as its most critical transportation priority. A Design Concept Report is currently underway at a cost of $1 million, with an additional $7.4 million set aside in the City’s Capital Improvement Projects (CIP) fund for future project phases. The City continues to seek additional regional, state and federal funding to make this project a reality.
The City’s rapid expansion in its first decade has created significant infrastructure development needs. Maricopa is addressing many key projects in order to adequately support future growth.
EAsT-WEsT CORRIDOR sTuDyPinal County and the cities of Casa Grande and Maricopa have partnered in the preparation of a long-range transportation study to include the area bounded by State Route 347, to the west, Interstate 10 to the east, the Gila River Indian Community to the north, and Interstate 8 to the south. This study builds upon two previously completed studies: Regionally Significant Route for Safety and Mobility Plan (Pinal County), and the I-8/I-10 Hidden Valley Transportation Framework Study (Maricopa Association of Governments). The City of Maricopa is now in the second phase of the study with initial report findings under review.
FLOOD PLAIN REmAPPING EFFORTsIn the spring of 2010, the Federal Emergency Management Agency (FEMA), Pinal County Flood Control District, and the City joined forces to initiate updated floodplain maps for Maricopa based on the outcome of the incorporated jurisdiction’s first formal master drainage study. By December 2011, FEMA released the first set of preliminary maps for the agency’s review of the new floodplain configuration reflective of the recent hypergrowth experienced by Maricopa in the areas of residential subdivisions, supporting roadway networks, and correlating drainage features. After the review of the preliminary maps, the City sponsored three technical appeals spearheaded by property owners of land substantially affected by the redelineated floodplains on the preliminary maps.
On December 20, 2012, the City of Maricopa received FEMA approval of the hydraulics and hydrology portion of all three technical appeals (Vekol Wash and Vekol Tributary; Southside 1 and Southside 2; and Sacaton Flows). As the remapping process presses forward, FEMA is currently preparing draft map panels to incorporate the approved appeal information. Following City review and approval, a six-month waiting period must pass prior to the effective date for finalization of the map panels. The outstanding portions of the remapping process, including production and distribution of final panels and adoption by the Maricopa City Council, are aimed for completion by spring 2014.
ADDITIONAL INFRAsTRuCTuRE PROjECTs A large number of additional infrastructure, road and transportation improvement projects are underway or planned for FY13-14. These include:
• Widening of intersections at Honeycutt and Porter Roads and Smith-Enke and Porter Roads
• Signalization at Honeycutt and White and Parker Roads, and Honeycutt Road and State Route 347
• Relocation of Amtrak Station to site adjacent to new Public Works Yard
23 24

ACKNOWLEDGmENTs
The City of Maricopa Community Report is published annually by the Communications & Marketing Division of the City Manager’s Office. The 2013 issue is the inaugural issue of this publication.
Danielle Casey, Assistant City ManagerRuben Garcia, Media SpecialistLaTricia Woods, Public Information Officer
Thanks to the following directors for the contributions of their departments to this annual publication:
Wade Brannon, Fire ChiefVanessa Bueras, City ClerkJennifer Campbell, Director of Community ServicesTom Duensing, Director of Finance & Administrative ServicesRobert Goodhue, Interim Director of Development ServicesMicah Miranda, Director of Economic DevelopmentKaren Shaffer, Director of Human ResourcesSteve Stahl, Police Chief
Special recognition is also extended to the following staff members who contributed significantly to the content:
Dustin Frye, Permit TechnicianKazi Haque, Planning ManagerBrad Hinton, Development/CIP Project ManagerPaul Jepson, Assistant to the City ManagerKelli Kurtz, Senior Engineering Plans ExaminerMichael Winer, Economic Development Coordinator
CityofMaricopa
Maricopa, AZ City Hall
myMaricopa20
City of Maricopa Economic Development
CityOfMaricopa
http://facebook.maricopa-az.gov
http://twitter.maricopa-az.gov
http://youtube.maricopa-az.gov
http://linkedin.maricopa-az.gov
http://flickr.maricopa-az.gov
CONNECT WITH THE CITy
ADDITIONAL RESOURCES ADDITIONAL RESOURCES25 26
General Number
mayor & City Council
City manager
City Clerk
Code Compliance
Community services
Development services
Economic Development
Finance Department
Fire Department
Graffiti Hotline
Human Resources
Library
Police Department
Public Information
Purchasing
silent Witness
Transit services (COmET)
(520) 568-9098
(520) 316-6820
(520) 316-6811
(520) 316-6970
(520) 316-6927
(520) 316-6960
(520) 316-6920
(520) 316-6990
(520) 316-6850
(520) 568-3333
(520) 316-6900
(520) 316-6805
(520) 568-2926
(520) 316-6800
(520) 316-6995
(520) 316-6846
(520) 316-6900
(520) 316-6959
(520) 316-6841(520) 316-6833(520) 316-6816
City of Maricopa Official Websitewww.maricopa-az.gov
2013 marks a big year for Maricopa - we are turning 10 this October! You will see this anniversary logo on all of our publications this year as we countdown to the big day, October 15.
Look for many exciting events, programs and activities to take place this year. There may even be a cake and candles! We hope you join us in the celebration.
10 yEAR ANNIvERsARy