community infrastructure plan 2011 – 2031 …...community infrastructure plan 2011 – 2031...
TRANSCRIPT

Community Infrastructure Plan 2011 – 2031 (Revised 2015) – DRAFT FOR PUBLIC COMMENT
1
Community Infrastructure Plan 2011 – 2031 (Revised 2015)
‘Hip to be in the Square’ Event - Darius Wells Library and Resource Centre
Revised June 2015
First Version October 2009

Community Infrastructure Plan 2011 – 2031 (Revised 2015) – DRAFT FOR PUBLIC COMMENT
2
CONTENTS
1 EXECUTIVE SUMMARY .......................................................................................................................... 6
2 INTRODUCTION..................................................................................................................................... 15
3 METHODOLOGY.................................................................................................................................... 18
3.1 STAGE 1 REVIEW OF PLANNING FRAMEWORK .................................................................................... 19 3.2 STAGE 2 COMMUNITY INFRASTRUCTURE PLANNING PRINCIPLES AND CATCHMENTS ............................. 19 3.3 STAGE 3 COMMUNITY PROFILE .......................................................................................................... 19 3.4 STAGE 4 COMMUNITY NEEDS ASSESSMENT ....................................................................................... 19 3.5 STAGE 5 COMMUNITY INFRASTRUCTURE HIERARCHY AND PLANNING STANDARDS ............................... 20 3.6 STAGE 6 SUPPLY AND DEMAND ANALYSIS ......................................................................................... 20 3.7 STAGE 7 COMMUNITY INFRASTRUCTURE PLAN ................................................................................... 20
4 STRATEGIC PLANNING FRAMEWORK .............................................................................................. 20
4.1 JANDAKOT STRUCTURE PLAN (JSP) .................................................................................................. 21 4.2 DRAFT EASTERN RESIDENTIAL INTENSIFICATION CONCEPT (ERIC) ..................................................... 22 4.3 DRAFT LOCAL PLANNING STRATEGY .................................................................................................. 23
5 COMMUNITY PROFILE AND DEMOGRAPHIC ANALYSIS ................................................................ 24
5.1 HISTORY .......................................................................................................................................... 25 5.2 POPULATION .................................................................................................................................... 26 5.3 AGE STRUCTURE .............................................................................................................................. 26 5.4 HOUSEHOLDS AND FAMILIES ............................................................................................................. 28 5.5 CULTURAL DIVERSITY ....................................................................................................................... 29 5.6 EMPLOYMENT AND OCCUPATION ....................................................................................................... 30 5.7 INCOME AND OCCUPATION ................................................................................................................ 32 5.8 SOCIAL DISADVANTAGE .................................................................................................................... 33
6 POPULATION GROWTH AND PROJECTIONS ................................................................................... 34
6.1 POPULATION GROWTH 2011 TO 2016 .............................................................................................. 38 6.2 POPULATION GROWTH 2016 TO 2021 .............................................................................................. 38 6.3 POPULATION GROWTH 2021 TO 2026 ............................................................................................... 39 6.4 POPULATION GROWTH 2026 TO 2031 ............................................................................................... 39
7 COMMUNITY NEEDS ASSESSMENT .................................................................................................. 39
7.1 KEY FINDINGS AND OUTCOMES ......................................................................................................... 40 7.2 STRATEGIC INFRASTRUCTURE PROJECTS .......................................................................................... 40
7.2.1 Community Knowledge and Resource Centre (Darius Wells) ................................................... 40 7.2.2 Sub-Regional Sporting Ground - Thomas Oval/Kelly Park ........................................................ 41 7.2.3 Wells Beach Foreshore Upgrade (Park and Boating Facility) ................................................... 41 7.2.4 District Youth Centre (The Zone) ............................................................................................... 41 7.2.5 District Sporting Grounds (Orelia Oval and Medina Oval extension/upgrade) .......................... 41 7.2.6 Destination Park - Calista .......................................................................................................... 42

Community Infrastructure Plan 2011 – 2031 (Revised 2015) – DRAFT FOR PUBLIC COMMENT
3
7.2.7 Rural Community Facilities – Wandi Community Centre ........................................................... 42 7.2.8 Animal Shelter ............................................................................................................................ 42 7.2.9 Works Depot .............................................................................................................................. 43 7.2.10 Civic Administration Centre ................................................................................................... 43 7.2.11 Redevelopment of Retirement Villages ................................................................................. 43
8 COMMUNITY PLANNING FRAMEWORK ............................................................................................. 43
8.1 PLANNING CATCHMENTS ................................................................................................................... 43 8.2 COMMUNITY INFRASTRUCTURE HIERARCHY ....................................................................................... 45 8.3 NEIGHBOURHOOD LEVEL ................................................................................................................... 45 8.4 LOCAL LEVEL ................................................................................................................................... 45 8.5 DISTRICT LEVEL ............................................................................................................................... 46 8.6 SUB-REGIONAL LEVEL ...................................................................................................................... 46 8.7 COMMUNITY INFRASTRUCTURE PLANNING STANDARDS ...................................................................... 46 8.8 PRINCIPLES ...................................................................................................................................... 48
9 SUPPLY AND DEMAND ANALYSIS ..................................................................................................... 49
9.1 NEIGHBOURHOOD COMMUNITY INFRASTRUCTURE .............................................................................. 49 9.1.1 Neighbourhood Parks ................................................................................................................ 49
9.2 LOCAL COMMUNITY INFRASTRUCTURE ............................................................................................... 52 9.2.2 Local Sporting Grounds (with either a Community Sports Facility Building A or B, or, a Pavilion) 55 9.2.3 Local Community Centre ........................................................................................................... 57
9.3 DISTRICT COMMUNITY INFRASTRUCTURE ........................................................................................... 59 9.3.1 District Parks .............................................................................................................................. 59 9.3.2 District Sporting Ground ............................................................................................................. 59 9.3.3 District Community Centre ......................................................................................................... 61 9.3.4 District Youth Centre .................................................................................................................. 61 9.3.5 Branch Library ............................................................................................................................ 62 9.3.6 Dry Recreation Centre ............................................................................................................... 64
9.4 SUB-REGIONAL COMMUNITY INFRASTRUCTURE .................................................................................. 64 9.4.1 Destination Park - Calista .......................................................................................................... 64 9.4.2 Wells Beach Foreshore Upgrade (Park and Boating Facility) .................................................. 65 9.4.3 Sub-Regional Sporting Ground (Thomas Oval/Kelly Park). ..................................................... 66 9.4.4 Community Knowledge and Resource Centre (Darius Wells Library and Resource Centre) 67 9.4.5 Sub-Regional Recreation and Aquatic Centre .......................................................................... 68 9.4.6 Arts and Cultural Centre (Upgrade) .......................................................................................... 68
10 COMMUNITY INFRASTRUCTURE PLAN 2011 – 2031........................................................................ 69
10.1 DISTRICT A ...................................................................................................................................... 69 10.1.1 Population .............................................................................................................................. 70 10.1.2 Neighbourhood Community Infrastructure ............................................................................ 71 10.1.3 Local Community Infrastructure ............................................................................................. 72 10.1.4 District Community Infrastructure .......................................................................................... 73 10.1.5 Sub-Regional Community Infrastructure ............................................................................... 74

Community Infrastructure Plan 2011 – 2031 (Revised 2015) – DRAFT FOR PUBLIC COMMENT
4
10.1.6 Other Community Infrastructure (not forming part of developer contributions) ..................... 74 10.2 DISTRICT B ...................................................................................................................................... 76
10.2.1 Population .............................................................................................................................. 76 10.2.2 Neighbourhood Community Infrastructure ............................................................................ 77 10.2.3 Local Community Infrastructure ............................................................................................. 78 10.2.4 District Community Infrastructure .......................................................................................... 79 10.2.5 Sub-Regional Community Infrastructure ............................................................................... 80 10.2.6 Other Community Infrastructure (not forming part of developer contributions) ..................... 80
10.3 DISTRICT C ........................................................................................................................................... 82 10.3.1 Population .............................................................................................................................. 82 10.3.2 Neighbourhood Community Infrastructure ............................................................................ 83 10.3.3 Local Community Infrastructure ............................................................................................. 83 10.3.4 District Community Infrastructure .......................................................................................... 84 10.3.5 Sub-Regional Community Infrastructure ............................................................................... 86 10.3.6 Other Community Infrastructure (not forming part of developer contributions) ..................... 86
10.4 DISTRICT D ...................................................................................................................................... 88 10.4.1 Casuarina Wellard ................................................................................................................. 88 10.4.2 Wandi ..................................................................................................................................... 88 10.4.3 Sub-Regional Community Infrastructure ............................................................................... 89 10.4.4 Other Community Infrastructure (not forming part of developer contributions) ..................... 89

Community Infrastructure Plan 2011 – 2031 (Revised 2015) – DRAFT FOR PUBLIC COMMENT
5
TABLES
Table 1 Population by Age Group 2006 and 2011 Table 2 Household and Family Type 2006 and 2011 Table 3 Cultural Diversity 2006 and 2011 Table 4 Employment Status 2006 and 2011 Table 5 Occupation 2006 and 2011 Table 6 Weekly Household Income 2011 Table 7 Socio-Economic Disadvantage 2011 Table 8 Population Projections 2011 – 2031 Table 9 Development Contribution Areas Table 10 District A Population Projections Table 11 District A Community Infrastructure Plan Table 12 District B Population Projections Table 13 District B Community Infrastructure Plan Table 14 District C Population Projections Table 15 District C Community Infrastructure Plan Table 16 Civic Requirements - Infrastructure Plan 2011 -2031 FIGURES Figure 1 Jandakot Structure Plan (JSP) Figure 2 Draft ERIC district structure plan and community infrastructure map Figure 3 Local Planning Strategy long term land use Figure 4 Area Population Projections Figure 5 District Map Figure 6 District A Map Figure 7 District B Map Figure 8 District C Map Figure 9 District D Map Figure 10 Community Infrastructure Plan 2011-2031 (revised 2015) APPENDICES Appendix 1 Community Needs Assessment Overview Appendix 2 Community Infrastructure Planning Standards

Community Infrastructure Plan 2011 – 2031 (Revised 2015) – DRAFT FOR PUBLIC COMMENT
6
1 Executive Summary
The City of Kwinana is experiencing rapid growth that is set to continue for at least the next twenty years. By 2031, the City’s population will have nearly doubled from 36,145 residents in 2014 to more than 70,000. Most of these new community members will reside in the newly created urban areas either side of the Perth - Mandurah rail line and Kwinana Freeway, but, there will also be increases as a result of infill development. An essential role of local government is to provide community facilities for its residents. This plan sets out the City’s priorities to provide such community infrastructure until 2031. Much of the community infrastructure in this plan will be funded partially or wholly through development contributions but this plan also includes a significant number of community facilities that the City will provide with its own funding or via grants. The City was keen to consider all of its needs for community infrastructure in a holistic way aware that only some facilities can be funded via a contributions scheme. This enables the City to make sound financial decisions as to the delivery of the infrastructure based on forward estimates of costs and to provide information to the public such as Capital Expenditure Plans showing the estimated timing and costs of the facilities. This plan is a review of the Community Infrastructure Plan prepared by the then Town of Kwinana in 2009. That plan supported an amendment to the City’s Town Planning Scheme (Amendment No 115) which introduced developer contributions for certain community facilities infrastructure (sometimes referred to as ‘soft infrastructure’) under the scheme for a period between 2011 until 2031. The standards and methodology used, as well as the items identified in that Community Infrastructure Plan (CIP) were endorsed by the Western Australian Planning Commission (WAPC) which considered it against its State Planning Policy (SPP) for developer contributions (SPP No.3.6). That scheme amendment was gazetted in 2012 and has been in operation since with the City progressively developing community facilities. As the CIP is now some six years old, and Amendment 115 gazetted three years ago, the City has chosen to review the CIP 2011 – 2031. This review is important as there has been planning decisions made by the WAPC which have affected the distribution of population across the City. As community infrastructure requirements reflect population need, it has been critical to ensure that community infrastructure is reviewed to account for the population change and distribution. The major changes in population are discussed in more detail in this plan and are in the areas known as Wellard West, Wellard East, Mandogalup as well as changes in the rate of growth overall. This review has used the same methodology and processes for assessing community need and community provision as it did in 2009 as supported by the WAPC. It also applies to the same twenty year time period, 2011 to 2031 which is already established in the City’s planning scheme and supported by the WAPC. As in 2009, the City used Community Perspectives, specialist consultants in this field to assist in this review. A consideration of the community profile and population growth, a community needs assessment and planning framework, and then, supply and demand analysis was undertaken. This work formed the basis for a CIP which identifies the need for facilities and their general locations. In some areas, more structure planning is required to

Community Infrastructure Plan 2011 – 2031 (Revised 2015) – DRAFT FOR PUBLIC COMMENT
7
define specific locations whilst, in others, locations are known. A number of community facilities have been built since the CIP was first prepared and associated amendments considered and adopted by Council and the WAPC. These include Darius Wells Library and Resource Centre (referred to in the CIP as the Community Knowledge and Resource Centre), The Zone (District Youth Centre) both within the Kwinana City Centre and two Community Centres, the William Bertram Community Centre in Bertram and the John Wellard Community Centre in Wellard Village. Both are important centres for their local communities and are located in amongst accessible and active Neighbourhood Centres.
John Wellard Community Centre
Overall, the review proposes changes in only a few select but important areas and this is largely a result of increases or decreases in populations in various localities as well as the overall rate of growth. The key changes proposed are:-
Changes in the provision of District Sporting Ground needs in Districts A and B.
A district level sports ground is required for a population of 25,000 people. Due to the reduction in the projected developable area for the Mandogalup cell, the population projection for District A has reduced to approximately 12,000 people, thereby removing the need for a stand alone facility within District A. However there is still a need for residents within District A to have access to a district level sports facility and no equivalent facility is

Community Infrastructure Plan 2011 – 2031 (Revised 2015) – DRAFT FOR PUBLIC COMMENT
8
planned for the communities to the north (Hammond Park). It is recommended that a multi district sporting ground be provided within District B for the combined population of Districts A and B of 36,558 persons. The District Sporting Ground (serving districts A & B) will provide 10-12 multi purpose hard courts for tennis, basketball and netball, as well as a pavilion, parking and landscaping. This facility will require 3 hectares. The likely location of the District Sporting Ground in District B means that residents in District A will be within the 6km catchment of the multi district facility. This facility would be developed in conjunction with an accompanying strategy of shared use of sporting grounds and facilities with the Department of Education and at other locations. This is an alternative strategy for the provision of district sporting needs to that anticipated in 2009 and this has been brought about by the population changes and the constraints of land assembly for large playing field areas. It’s a strategy which focuses on a combination of shared use of sporting grounds at schools in combination with the utilisation of local sporting grounds to provide facilities for clubs and sporting organisations. It will entail the provision of toilets and shade as a minimum (with some having kiosks and storage space) at selected sporting grounds to provide for club and recreational use. The City already has shared use arrangements for sporting fields in District C (Gilmore College) and similar agreements would be further applied across Districts A and B.
Changes in the provision of District Community Centre needs via the provision of Larger Local Community Centres
In some locations, further planning and design detail and reductions in the population has resulted in the removal of some facilities such as a Local Community Centre in Mandogalup or in Wellard West, a Local Sporting Grounds whilst in others, it is proposed to merge District Community Centre needs into Larger Local Community Centres designed to address need. These changes are brought about to meet community need in a pragmatic way against standards which would apply to the provision of facilities.
Introduction of a District D for the Rural areas
The draft 2015 CIP has introduced a new district for the primarily rural areas east of the Kwinana Freeway. Whilst not part of the contribution plan and with no new items for community infrastructure proposed by the 2015 CIP for District D, the purpose of this new district is to incorporate the projected population for this district in the CIP and to then assess and plan for community infrastructure during future reviews of the CIP. The recommendations of the CIP will also inform future long term financial planning by the City. As no community facilities are required for this area, no new development contribution area is proposed by the accompanying Scheme Amendment.
Timing of infrastructure items
Amendment 115 made provision that each community infrastructure item will ‘generally be

Community Infrastructure Plan 2011 – 2031 (Revised 2015) – DRAFT FOR PUBLIC COMMENT
9
provided when 50% of the population catchment for the facility is achieved.’ However, whilst reviewing the CIP, and in particular, the Capital Expenditure Plan (which sets out the timing of infrastructure items, and sources of funding), it became apparent that, primarily due to the different growth rates of population being experienced than that anticipated in 2009, providing the facilities at the 50% point of the population growth would mean that the bulk of the infrastructure would need to be provided over a short period of time and this would place considerable strain on the City finances, primarily as the City would need to pre-fund half of the infrastructure item through borrowing. It was determined that the more financially responsible trigger point for the delivery of community infrastructure items was at least 75% of the predicted population catchment for the facility is achieved. By changing the trigger point from 50% to at least 75%, it enables the City to collect a greater proportion of the funds from developers for the item, and reduces the borrowing costs and liabilities than if the facility was provided at 50%. The downside to this change is that the facilities will be delivered to the community at a later stage of the population growth, however this change is considered necessary given the City’s desire to deliver the community infrastructure facilities in a fiscally responsible and sustainable way.
This reviewed CIP supports a new Scheme Amendment 145 to the City’s Planning Scheme which will amend the current Developer Contribution Plans (the DCP’s) in the scheme to take account of the changes to the community infrastructure proposed under this review. Both Amendment 145 and the revised CIP will be advertised simultaneously seeking public comment as they reflect each other. Another scheme amendment, Amendment 100A, while it deals primarily with different types of infrastructure such as road improvements and drainage (sometimes referred to as ‘Hard Infrastructure’) is also connected to the revised CIP as it also addresses Public Open Space (POS). In some locations, additional POS is required to facilitate the community facilities. Amendment 100A is also intended to be advertised at the same time as the revised CIP and Amendment 145 so that the public and interested stakeholders can gain a holistic appreciation of the CIP and its relationship to the contribution schemes. Finally, to assist the reader in gaining an understanding of the key changes between the 2009 CIP and the 2015 Review, a breakdown of the population and community facilities for each of the three Community Infrastructure Districts, A, B and C is provided below. District A
Area Current CIP (2009) projected population at 2031
Draft CIP (2015) projected population at 2031
Change
District A 13,461 12,129 1,332 (-9.9%)
DCA8 Mandogalup 6,042 3,780 2,262 (-37.4%)
DCA9 Wandi / Anketell North 7,419 8,349 930 (12.5%)

Community Infrastructure Plan 2011 – 2031 (Revised 2015) – DRAFT FOR PUBLIC COMMENT
10
District A: Consists of DCA8 – Mandogalup and DCA9 – Wandi / Anketell
Current CIP (2009) item Revised CIP (2015) item
Comment
1 District Sports Ground
located within District A –
Mandogalup
1 District
Sporting Ground
that serves
Districts A and
B
As discussed above, due to the reduction in population
in District A, there is no longer the need for a stand
alone facility within that district. However there is still a
need for residents within District A to have access to a
district level sporting facilities, particularly hard courts
for tennis, netball and basketball, and pavilion. It is
recommended that a District Sporting Ground that
serves both Districts A and B be provided, and that the
facility be located within District B. The ground will
provide 10-12 multi purpose hard courts for tennis,
basketball and netball, as well as a pavilion, parking
and landscaping. The likely location of the District
Sporting Ground in District B means that residents in
District A will be within the 6km catchment of the
facility. This facility would be developed in conjunction
with an accompanying strategy to meet district
recreation need of shared use of sporting grounds and
facilities at schools and at other local sporting grounds.
1 District Community Centre No District
Community
Centre
A district level community centre is required for a
population of 25,000 people. The reduced population
projected for District A no longer warrants a stand
alone facility and therefore a larger scale local
community centre is recommended. This is proposed at
the Wandi District Centre.
DCA8 Mandogalup - local items:
2 Local Community Centres 1 Local
Community
Centre
Due to the reduced population projected for the
Mandogalup cell, there is now only demand for one
Local Community Centre to be located within
Mandogalup.
1 Local Sports Ground
without Pavilion
1 Local Sports
Ground with
Community
Sporting Facility
Building A
(shared use)
It is proposed that a Community Sporting Facility
Building A be provided for the Local Sports Ground in
Mandogalup. This facility will likely be shared with the
planned Primary School in Mandogalup. The
Community Sporting Facility Building A will provide
toilets.
Community Infrastructure Plan 2011 – 2031 (Revised 2015) – DRAFT FOR PUBLIC COMMENT
11
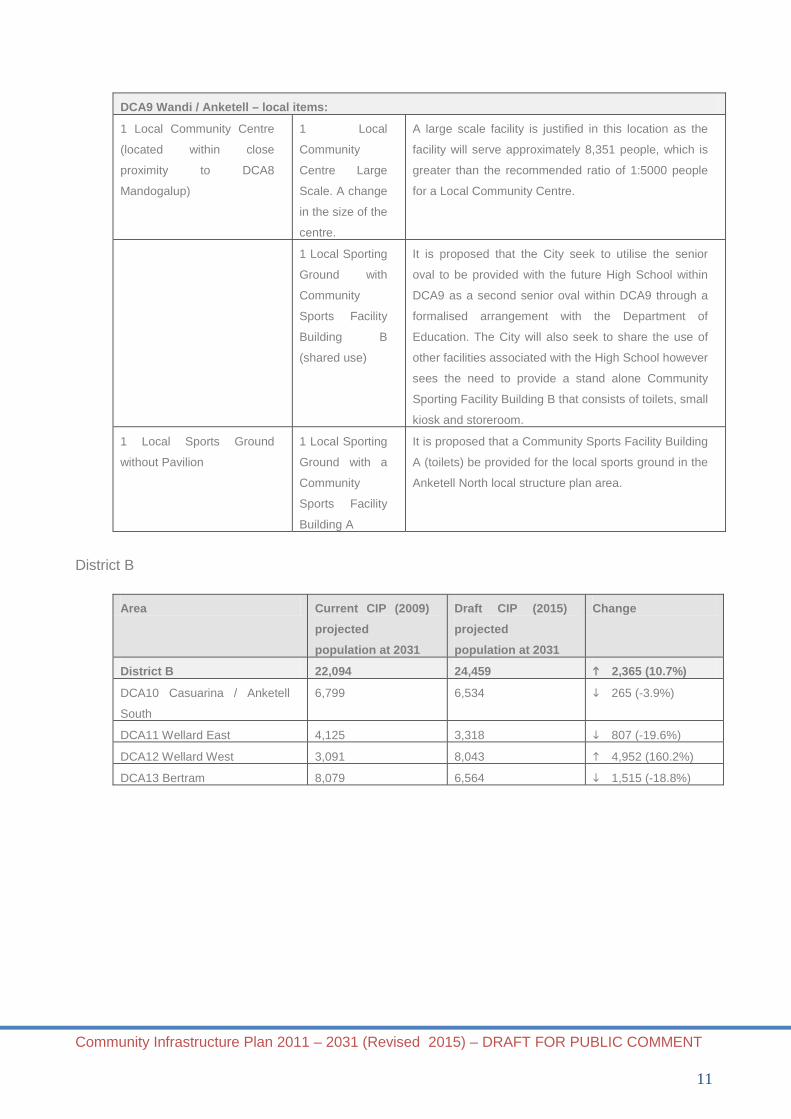
DCA9 Wandi / Anketell – local items:
1 Local Community Centre
(located within close
proximity to DCA8
Mandogalup)
1 Local
Community
Centre Large
Scale. A change
in the size of the
centre.
A large scale facility is justified in this location as the
facility will serve approximately 8,351 people, which is
greater than the recommended ratio of 1:5000 people
for a Local Community Centre.
1 Local Sporting
Ground with
Community
Sports Facility
Building B
(shared use)
It is proposed that the City seek to utilise the senior
oval to be provided with the future High School within
DCA9 as a second senior oval within DCA9 through a
formalised arrangement with the Department of
Education. The City will also seek to share the use of
other facilities associated with the High School however
sees the need to provide a stand alone Community
Sporting Facility Building B that consists of toilets, small
kiosk and storeroom.
1 Local Sports Ground
without Pavilion
1 Local Sporting
Ground with a
Community
Sports Facility
Building A
It is proposed that a Community Sports Facility Building
A (toilets) be provided for the local sports ground in the
Anketell North local structure plan area.
District B
Area Current CIP (2009) projected population at 2031
Draft CIP (2015) projected population at 2031
Change
District B 22,094 24,459 2,365 (10.7%)
DCA10 Casuarina / Anketell
South
6,799 6,534 265 (-3.9%)
DCA11 Wellard East 4,125 3,318 807 (-19.6%)
DCA12 Wellard West 3,091 8,043 4,952 (160.2%)
DCA13 Bertram 8,079 6,564 1,515 (-18.8%)

Community Infrastructure Plan 2011 – 2031 (Revised 2015) – DRAFT FOR PUBLIC COMMENT
12
District B: Consists of DCA10 – Casuarina/Anketell South, DCA11 Wellard East, DCA12 Wellard West and
DCA13 Bertram
Current CIP (2009) item
Revised CIP (2015) item
Comment
1 District Sports
Ground
1 District
Sporting
Ground
The current CIP (2009) requires a District Sports Ground to be
provided within District B, specifically within the Casuarina cell
of District B. Due to the reduced population of District A, but
still recognising the need for residents of District A to have
access to a District Sporting Ground this facility will now serve
Districts A and B. The facility will comprise of hard courts for
tennis, basketball and netball as well as a pavilion building,
associated parking and landscaping.
DCA10 Casuarina - local items:
Current CIP (2009) item
Revised CIP (2015) item
Comment
1 Local Sports Ground
without Pavilion
1 Local
Sporting
Ground with
Community
Sports
Facility
Building B
It is proposed that the City seek to utilise the senior oval to be
provided with the future High School within DCA10 as a
second senior oval within DCA10 through a formalised shared
use arrangement with the Department of Education. The City
will also seek to shared the use of other facilities associated
with the High School but does see the need to provide a
Community Sports Facility Building B that consists of toilets,
small kiosk and storeroom.

Community Infrastructure Plan 2011 – 2031 (Revised 2015) – DRAFT FOR PUBLIC COMMENT
13
DCA11 Wellard East - local items:
Current CIP (2009) item
Revised CIP (2015) item
Comment
1 Local Sports Ground
with Pavilion
No Local
Sports Ground
A Local Sporting Ground should be provided for every 5,000
persons, and therefore, whilst a Local Sporting Ground within
Wellard East better reflected the originally projected population
(3,964 persons), due to the likely reduced population (2,970),
such a facility is more difficult to support particularly if a
comparable facility is located close by. Further, the Local
Sporting Ground identified in the 2009 CIP conceptually
anticipated that sufficient space would be available for a senior
sporting ground. More detailed analysis of the site and its land
form constraints as part of recent planning work indicates that
the size of playing fields originally envisaged is unable to be
achieved at the site.
Related to this, both the 2009 CIP and revised CIP have
identified the need for sports grounds (senior ovals) in the
northern adjoining Casuarina cell (DCA10), with the local
sports ground likely to be provided in the southern portion of
the cell in conjunction with the future High School. This detail
is being progressed by the City with the preparation of a high
level structure plan for the Casuarina cell.
It is the City’s Community Planning Consultant and the
Planning and Community Development team’s view that given
the constraints and uncertainty with the Livestock Holding
facility and reduced lot yield within DCA12, the land form
constraints on the size of the local sports ground and the
likelihood that a senior sports ground will be located close by
in the Casuarina cell, the utility and need for this Local
Sporting Ground in DCA12 is much diminished and is no
longer required.
DCA12 Wellard West – local items:
1 Local Sports Ground
with Pavilion
1 Local
Sporting
ground with
combined
Local
Community
Centre /
Pavilion
Due to a projected increase in population within this cell
resulting from the recent rezoning of Rural land to
Urban/Urban Deferred, there is the need for an additional
Local Community Centre. However as there is limited land
available within the Wellard West local structure plan area, it is
necessary for the Local Community Centre to be combined
and co-located with the Local Sporting Ground with Pavilion.

Community Infrastructure Plan 2011 – 2031 (Revised 2015) – DRAFT FOR PUBLIC COMMENT
14
DCA13 Bertram – local items:
1 Local
Sporting
Ground with
Community
Sports Facility
Building A
The City has a current shared use arrangement with Bertram
Primary School to use the senior playing field as a Local
Sporting Ground however there are no public toilet facilities.
The population of Bertram is still growing and there is a need
to provide public toilets at this ground and therefore a
Community Sports Facility Building A is proposed.
District C
Area Current CIP (2009) projected population at 2031
Draft CIP (2015) projected population at 2031
Change
District C 36,207 32,000 4,207 (-11.6%)
DCA14 Wellard / Leda 13,398 11,436 1,962 (-14.6%)
DCA15 Medina / Orelia /
Parmelia / Calista
22,809 20,564 2,224 (-9.8%)
District C: Consists of DCA14 – Wellard / Leda and DCA15 – Medina / Orelia / Parmelia / Calista Current CIP (2009) item
Revised CIP (2015) item
Comment
1 District Sporting Ground (Medina Oval extension/upgrade)
District C is currently serviced by the recently upgraded Orelia Oval for district sporting playing fields. However other district level facilities such as tennis courts, netball/basketball courts, lawn bowl greens and necessary club infrastructure are provided at various locations within District C and most of these facilities will reach the end of their economic life in the next 10 – 15 years. It is proposed that these facilities be combined in an upgraded multi-purpose shared facility at Medina Oval to cater for the existing population and project infill population within District C.
DCA14 – Wellard / Leda - local items: 1 Local
Sporting Ground with Pavilion extension
There exists a Local Sporting Ground with a Pavilion in Wellard however due to the demand on the Pavilion and the projected increase in population, an extension to the existing Pavilion is necessary. The extension will provide additional storage space for sporting groups to cater for the volume of equipment required at this facility.

Community Infrastructure Plan 2011 – 2031 (Revised 2015) – DRAFT FOR PUBLIC COMMENT
15
1 Local Sports Ground
1 Local Sports Ground with Community Sporting Facility Building A
A shared use Local Sports Ground is planned for the future High School site in Wellard. There is a need for public toilets to be provided at this site for the projected population of DCA14 and therefore a Community Sports Facility Building A is proposed.
New District D
Whilst not proposed to be included in the City’s Town planning scheme under any contribution scheme, the revised 2015 CIP has introduced a new district for the primarily rural areas east of the Kwinana Freeway. The purpose of this new district, District D, is to incorporate the projected population for this district in the CIP and to then assess and plan for community infrastructure accordingly, particularly during future reviews of the CIP.
Sub-Regional Infrastructure
There is one proposed change to the Sub-Regional Community Infrastructure items in the 2015 CIP from the 2009 CIP. Thomas Oval / Kelly Park provides sub-regional sporting facilities to the broader population of the City and a new multi-purpose pavilion at Thomas Oval / Kelly Park was recently constructed. However, further works are necessary to create fully functional sub-regional sports facility. These works include the redevelopment of the hard court area, construction of a set of change rooms on the eastern side of the ground and renovation of the original pavilion. It is therefore proposed that a new Sub-Regional Infrastructure item be included for Thomas Oval / Kelly Park extension/upgrade. 2 Introduction
The City of Kwinana is located in the outer southern suburbs of the Perth Metropolitan Region, approximately 30 kilometres south of the Perth CBD. It is bounded by the City of Cockburn in the north, Shire of Serpentine Jarrahdale in the east, the City of Rockingham in the south, and the Indian Ocean in the west. The City of Kwinana is situated in a major growth corridor in the south west metropolitan area and encompasses a total land area of nearly 120 square kilometres, with substantial industrial, rural and rural-residential areas, and some commercial areas. According to the Australian Bureau of Statistics (ABS), the City of Kwinana had a 2014 estimated residential population (ERP) of 36,145 which equates to a rate of growth of 2,306 persons per year (45 people a week) since the ABS Census 2011 which was 29,227. By percentage, Kwinana is currently the fastest growing local government area in Perth’s south-west metropolitan area and the fourth fastest growing area in Western Australia. This pattern of significant growth is expected to continue and by 2031 the City of Kwinana is estimated to have a population of 71,521. Beyond 2031, the ultimate population of the City of Kwinana is expected to reach towards 100,000 people.
Community Infrastructure Plan 2011 – 2031 (Revised 2015) – DRAFT FOR PUBLIC COMMENT
16
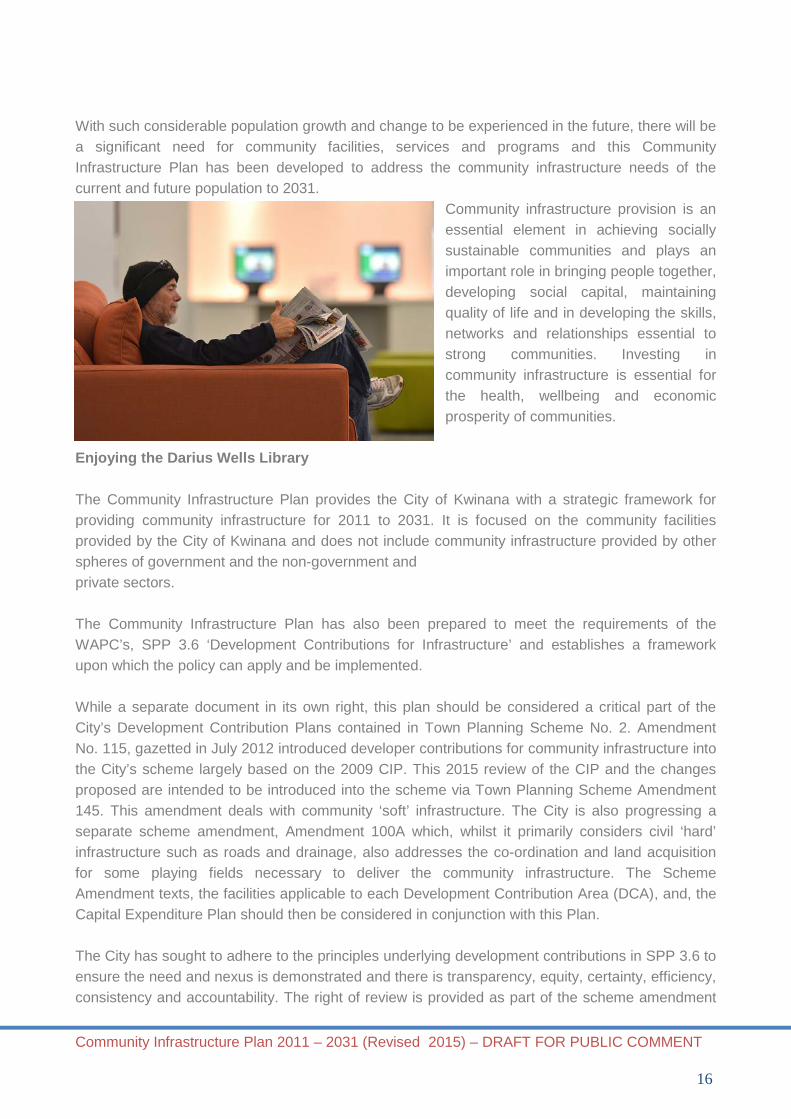
With such considerable population growth and change to be experienced in the future, there will be a significant need for community facilities, services and programs and this Community Infrastructure Plan has been developed to address the community infrastructure needs of the current and future population to 2031.
Community infrastructure provision is an essential element in achieving socially sustainable communities and plays an important role in bringing people together, developing social capital, maintaining quality of life and in developing the skills, networks and relationships essential to strong communities. Investing in community infrastructure is essential for the health, wellbeing and economic prosperity of communities.
Enjoying the Darius Wells Library The Community Infrastructure Plan provides the City of Kwinana with a strategic framework for providing community infrastructure for 2011 to 2031. It is focused on the community facilities provided by the City of Kwinana and does not include community infrastructure provided by other spheres of government and the non-government and private sectors. The Community Infrastructure Plan has also been prepared to meet the requirements of the WAPC’s, SPP 3.6 ‘Development Contributions for Infrastructure’ and establishes a framework upon which the policy can apply and be implemented. While a separate document in its own right, this plan should be considered a critical part of the City’s Development Contribution Plans contained in Town Planning Scheme No. 2. Amendment No. 115, gazetted in July 2012 introduced developer contributions for community infrastructure into the City’s scheme largely based on the 2009 CIP. This 2015 review of the CIP and the changes proposed are intended to be introduced into the scheme via Town Planning Scheme Amendment 145. This amendment deals with community ‘soft’ infrastructure. The City is also progressing a separate scheme amendment, Amendment 100A which, whilst it primarily considers civil ‘hard’ infrastructure such as roads and drainage, also addresses the co-ordination and land acquisition for some playing fields necessary to deliver the community infrastructure. The Scheme Amendment texts, the facilities applicable to each Development Contribution Area (DCA), and, the Capital Expenditure Plan should then be considered in conjunction with this Plan. The City has sought to adhere to the principles underlying development contributions in SPP 3.6 to ensure the need and nexus is demonstrated and there is transparency, equity, certainty, efficiency, consistency and accountability. The right of review is provided as part of the scheme amendment

Community Infrastructure Plan 2011 – 2031 (Revised 2015) – DRAFT FOR PUBLIC COMMENT
17
process and via the scheme provisions for development contributions (which largely follow the model scheme text).
Community Infrastructure Plan 2011 – 2031 (Revised 2015) – DRAFT FOR PUBLIC COMMENT
18
The only variation to SPP 3.6 relates to the period for which community infrastructure is identified and is able to be contributed towards by development. The policy suggests that a community infrastructure plan should be limited to a 10 year timeframe and that development should contribute to that infrastructure within the 10 year horizon, from commencement of development. This reflects the need for certainty to the community and industry that community facilities will be provided from moneys contributed and a link established with 10 year financial plans established by Local Governments. The WAPC provided its support for this variation as part of its support for the former Scheme Amendment 115. As discussed, the City is fortunate in that it has a strong planning framework in place that outlines detailed planning for a full ‘build out’ of the City. As a consequence, the City can identify the full scope of facilities at sub-regional, district and local levels until at least 2031. The City took the view that this principle should be varied in application of this policy with a longer timeframe of 20 years applying (2011 to 2031). The reasons for this were:-
o The existing City Centre, surrounding residential suburbs and the extent of urban development for new growth areas under the Jandakot Structure Plan provides for finite boundaries for urban development. There are no larger district areas yet to be planned for and developed.
o For these areas (existing and future residential), there has been substantial detailed planning undertaken for the full ‘build out’ of the City. As such, the City can identify the full scope of facilities at sub-regional, district and local levels with a high degree of certainty.
o Rather than one central growth front, the City has fragmented urban fronts with spots of growth in different localities. This results in growth rates across DCA’s taking time to reach sufficient points to trigger facility construction (even for local facilities) but does not negate the need for such facilities for the communities.
o The City has taken a conservative view to the timing of the provision of infrastructure and can demonstrate via its financial planning that it can meet the costs of the provision of this infrastructure across the 20 year period.
It is considered that there is certainty to the community that the infrastructure identified can be developed in the location and timeframe set. This approach has been supported by the WAPC as part of its adoption of Town Planning Scheme No 2 Amendment 115. The CIP is also a key part of the fourth pillar of the Kwinana 2030 Vision: It’s all here - services, facilities, diverse lifestyles - and community infrastructure planning and provision has and will continue to be directed by this vision. 3 Methodology
As a twenty year strategic document, the City of Kwinana has employed an extensive process in developing the CIP and this has involved engaging community planning and population experts, architects and quantity surveyors and a multi-disciplined team of staff from the City of Kwinana.
Community Infrastructure Plan 2011 – 2031 (Revised 2015) – DRAFT FOR PUBLIC COMMENT
19
The following stages were undertaken in completing the CIP.
3.1 Stage 1 Review of Planning Framework
The first stage of the project commenced with a review of the land use planning framework which exists for the City of Kwinana as this should underpin the development of the CIP. The land use planning framework sets the basis for decision making about residential development and community needs and provides the spatial context to consider provision and addressing of community needs.
3.2 Stage 2 Community Infrastructure Planning Principles and Catchments
This stage involved the development of a set of guiding principles for developing and implementing the CIP. These principles specifically relate to the WAPC SPP3.6 and the City has sought to adhere to the requirements and principles included in that policy. Community infrastructure planning catchments were then devised and this involved analysing the current settlement patterns, growth fronts, spatial catchments, physical barriers and population. This established four distinct ‘District’ catchment areas within the City of Kwinana, three made up of small urban cells plus one rural catchment area. These four Districts form the planning catchments of the Community Infrastructure Plan. The smaller urban cells make up the DCA’s which are detailed in SPP3.6. Eight (8) DCA’s are provided plus one rural area is proposed for community infrastructure provision across the City.
3.3 Stage 3 Community Profile
A comprehensive demographic analysis of the City of Kwinana was undertaken to provide a good understanding of the characteristics of the population. The nature of any place, and the socio-cultural profile have a major influence on the community infrastructure required and current and future trends. Id population experts developed the Community Profile which enables the analysis of data across the last three ABS Census and provides an indication of how the City of Kwinana’s population has changed over the last ten years Population projections to 2031 were also prepared for the City of Kwinana and the eight Development Contribution Areas that make up the CIP.
3.4 Stage 4 Community Needs Assessment
The City of Kwinana has undertaken a range of community need assessment studies and plans that feed into the CIP. These studies have involved community and stakeholder engagement and are reflected in the community infrastructure hierarchy, planning standards and benchmarks, supply and demand analysis and the identified priorities, and the timing of infrastructure provision in the CIP.

Community Infrastructure Plan 2011 – 2031 (Revised 2015) – DRAFT FOR PUBLIC COMMENT
20
3.5 Stage 5 Community Infrastructure Hierarchy and Planning Standards
A Community Infrastructure Hierarchy was developed and formulated taking into account the general geographical and spatial characteristics of the City of Kwinana, as well as the distribution of the current and future population. The Community Infrastructure Hierarchy provides a framework for the provision of community facilities and guides what facilities are provided at sub-regional, district, local and neighbourhood levels. It is also integrated with land use and transport planning. In 2004, the City of Kwinana developed a schedule of Community Infrastructure Planning Standards to guide the provision of a comprehensive range of facilities and services including education, health, aged care and emergency services. The local government component of the standards have been reviewed and refined for the CIP and this has been based on research and a review of existing levels of provision in City of Kwinana and other similar LGAs. Quantitative benchmarks as well as qualitative elements, such as planning and design guidelines were developed and emerging best practice and trends in the function, planning and design of community facilities were also considered in formulating Community Infrastructure Planning Standards.
3.6 Stage 6 Supply and Demand Analysis
A supply and demand analysis was then undertaken based on the outcomes and key findings from the Community Profile, Community Needs Assessment and the application of the Community Infrastructure Hierarchy and Planning Standards. The supply and demand analysis focuses on each Development Contribution Area and results in a clear picture of the community infrastructure required in each DCA plus the rural area and across the City of Kwinana.
3.7 Stage 7 Community Infrastructure Plan
The Community Infrastructure Plan was then developed which sets out the community facilities required over the 20 years from 2011 to 2031.Costings for infrastructure items were then developed and this involved the development of indicative concept plans and costings by architects and quantity surveyors. This has allowed the development of a Capital Expenditure Plan and Development Contribution Plan for each DCA as required by the WAPC SPP3.6 ‘Development Contributions for Infrastructure’. 4 Strategic Planning Framework
The land use planning framework which exists for the City of Kwinana has underpinned the development of the Community Infrastructure Plan because it sets the basis for decision making about community needs and provides the spatial context to consider provision and addressing of community needs. This is relevant for the application of SPP 3.6 ‘Development Contributions for Infrastructure’ in that there is a clear spatial nexus between community need and land use planning for the local government.
Community Infrastructure Plan 2011 – 2031 (Revised 2015) – DRAFT FOR PUBLIC COMMENT
21
The detailed land use planning undertaken by the City provides a holistic picture of the future urban fabric of the City and allows the City to understand its community needs at a sub-regional, district and local level. This will not always be the case in other local governments where large parcels or districts of land which may be identified on regional land use planning documents have not reached a point where detailed district planning has occurred. As such, there is uncertainty about community needs in those geographic areas and a total holistic consideration of community needs and requirements is difficult to determine. The City of Kwinana is fortunate in this regard because it has detailed planning in place and a clear understanding of its community needs to ‘build out’. The City is able to state its community facility needs with confidence based on the application of standard and accepted ratios for the facilities, plans about where these facilities are to be located, and how much they will cost to provide. As will be discussed, the hierarchy in the levels of the facilities is readily determined and the City can be broken down into sub-regional, district and local levels for the provision of the community facilities. Some facilities are small and only meet the need of an immediate population within a nearby spatial catchment whilst other facilities service the whole City (sub-region). These local levels serve as the basis for Development Contribution Areas wherein landowners within these areas will be asked to contribute to infrastructure provision.
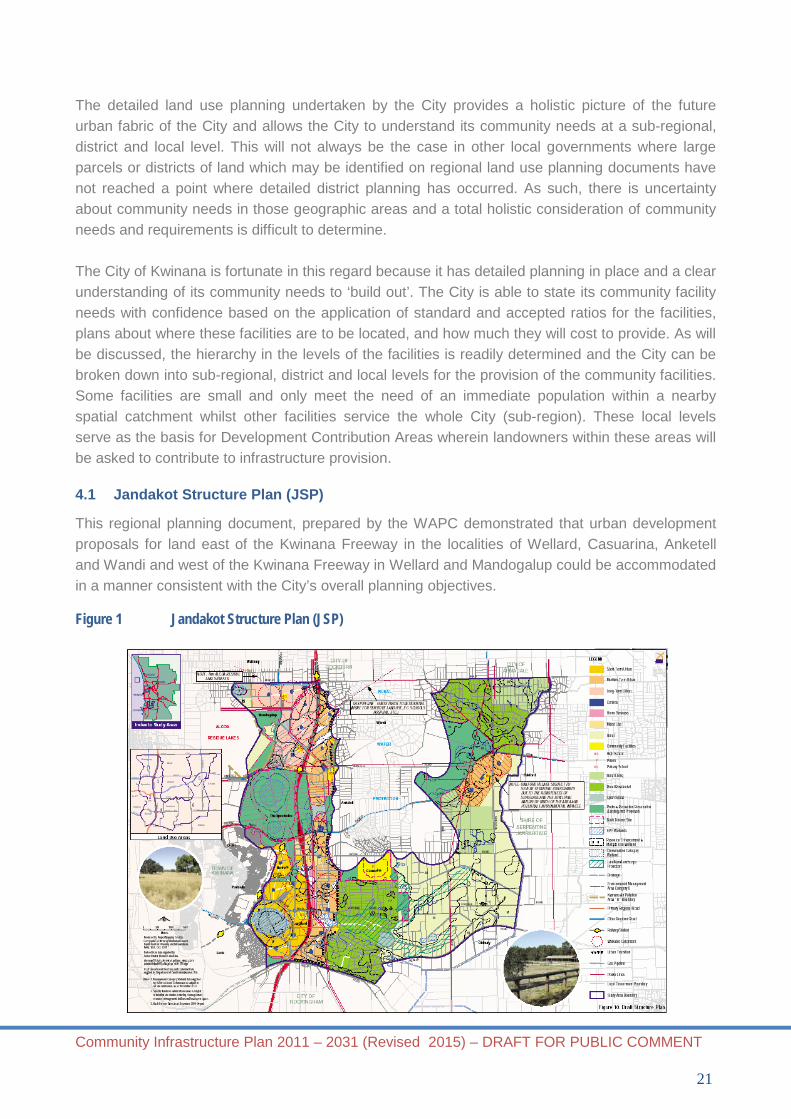
4.1 Jandakot Structure Plan (JSP)
This regional planning document, prepared by the WAPC demonstrated that urban development proposals for land east of the Kwinana Freeway in the localities of Wellard, Casuarina, Anketell and Wandi and west of the Kwinana Freeway in Wellard and Mandogalup could be accommodated in a manner consistent with the City’s overall planning objectives. Figure 1 Jandakot Structure Plan (JSP)

Community Infrastructure Plan 2011 – 2031 (Revised 2015) – DRAFT FOR PUBLIC COMMENT
22
The JSP sets the framework within which future local structure planning, local Town Planning Scheme Amendments and subdivision could be undertaken. The planning took account of the existing residential areas of the City and newly approved structure planning for the Orelia, Parmelia, Bertram, Leda and Wellard areas and identified some key land uses as part of the future urban development of the new urban cells along the Kwinana Freeway and railway line. These included the extent of urban cells, major transport nodes (including railway stations) major local and district centres, schools and conservation areas.
4.2 Draft Eastern Residential Intensification Concept (ERIC) The draft ERIC district structure planning built on the work undertaken by the WAPC for the Jandakot Structure Plan by examining land uses in more detail for the urban growth areas of the Mandogalup, Wandi, Anketell, Casuarina and Wellard areas. Undertaken by the City, it aimed to define land use for the new growth areas of the City in much greater clarity and detail. Whilst it is now being superseded in some areas with more land specific local structure planning, this strategic document remains a valuable guide to integrated planning for the Kwinana region. In developing ERIC, a Community Infrastructure Study was undertaken to identify the types of community facilities likely to be needed, location criteria and approximate land requirements for each of the facilities. The study not only included local government community facilities, but also State Government and private sector facilities, thereby encompassing the wide range of community infrastructure likely to be required by the some 40,000 people anticipated to live in the ERIC structure plan area. Figure 2 Draft ERIC district structure plan and community infrastructure map

Community Infrastructure Plan 2011 – 2031 (Revised 2015) – DRAFT FOR PUBLIC COMMENT
23
While the need for community facilities is largely influenced by the demographic and socio-economic characteristics of an area, where a community is yet to be established the use of appropriate planning standards is essential to determine ‘indicative’ requirements to ensure the necessary land area is set aside for community purposes in the early planning stages, and in the right locations in relation to other land uses. The distribution of community facilities was anticipated by the draft ERIC plan. The CIP refined the work undertaken as part of the ERIC planning exercise and consider community facility needs more holistically for the whole City.
4.3 Draft Local Planning Strategy
The City is also preparing a draft Local Planning Strategy (LPS) as part of the review of its City Planning Scheme and the draft LPS addresses land use planning across the local government area for both the short and long terms. As well as consideration of the City’s industrial, rural and commercial areas, the draft LPS incorporates the existing City Centre with surrounding residential suburbs identified in the district planning undertaken for the ERIC area. It integrates the planning of the existing growth suburbs of Wellard Village, Bertram, Parmelia and Orelia, with the older parts of the Kwinana City and the new urban growth corridor along the freeway and rail line. The Local Planning Strategy has a series of sub strategies including, but not limited to, a Local Commercial Strategy, Local Industrial Strategy, Transport Strategy and Local Housing Strategy. The Local Housing Strategy is of particular relevance to this Community Infrastructure Plan as it proposes marginal increases in density across much of the existing older parts of the City to promote redevelopment in these areas. It also includes the City Centre which is located off Gilmore Avenue. It is in the City Centre that a number of key sub-regional and district facilities are being provided in response to future demands and needs including the Darius Wells Library and Resource Centre, the Zone Youth Space and the Recquatic, a recreation and aquatic centre. The City Centre is the key activity node for the City of Kwinana and extensions to the Market Place Shopping Centre, streetscape improvements and other approved office/commercial developments will further enhance this site as the pre-eminent node for shopping and community interaction in the City.

Community Infrastructure Plan 2011 – 2031 (Revised 2015) – DRAFT FOR PUBLIC COMMENT
24
Figure 3 Local Planning Strategy long term land use
Importantly, the planning strategy defines the long term boundaries of the urban land use across the City. It defines the ‘build out’ of the City based on adopted strategies of the WAPC and this is relevant as there is certainty in the planning process that the infrastructure the City is proposing to provide will be needed. The Council adopted the draft Local Planning Strategy in December 2014 for the purposes of consultative advertising. The consultative advertising has recently finished and the City is preparing the document for consideration of the Council for formal submission to the WAPC for consent to advertise. 5 Community Profile and Demographic Analysis
An on-going understanding of the profile of the City of Kwinana is essential to planning and providing community infrastructure because the makeup of any place, including its history, culture and population, has a major impact on determining the types of community facilities and services that will be required.

Community Infrastructure Plan 2011 – 2031 (Revised 2015) – DRAFT FOR PUBLIC COMMENT
25
The City of Kwinana engaged .id consulting®, a company of demographers, housing analysts and forecasters to prepare the community profile as well as population forecasts to the year 2031, both of which have guided planning for the provision of community infrastructure over the next 20 years. The two latest Census’s undertaken by the ABS were 2006 and 2011. A comparison of data between these two census dates is educational and reveals trends. The next Census is anticipated in 2016 and will provide further detail about the City’s demographic profile.
5.1 History
The City of Kwinana was established in the early 1950’s by the Western Australian State Government as part of its strategy to develop the then newly proclaimed south of Perth heavy industrial precinct. This decision was a landmark undertaking for the State and signalled its emergence as a manufacturing force. With State Government assistance, in the form of an attractive incentive package, the first major firm attracted to the area was the BP Refinery. Subsequently other large enterprises, such as the BHP Iron and Steel blast furnace, which at its peak employed some 1,200 workers, located to what has become known as the State’s premier industrial area, Kwinana. Construction of the heavy industry manufacturing plants required far more skilled labour than was available at the time and so, to overcome this problem, the State Government embarked on a migrant attraction programme. The mostly British tradesmen and their families recruited as part of this initiative were settled in Kwinana, and to a lesser extent Rockingham. As part of this process, Medina, the first suburb to be created in the now City of Kwinana, was opened up as a State housing area. Predominantly the families that moved there were newly arrived skilled migrants of Anglo Celtic descent, being senior staff employed by the companies that established in area. In contrast to the construction and commissioning phases, much of the labour needed to operate the plants was semiskilled or unskilled and as a result a large number of employment opportunities created were taken up by migrants, including those from central Europe. This boom in industrial development saw the population of Kwinana double between 1966 and 1971. Unfortunately, the combination of an economic downturn in the 1970s, and a shift towards increased mechanisation and automation, saw employment numbers fall drastically, especially following the closure of the BHP blast furnace. By the late 1970’s, most, if not all senior company staff had relocated to other Perth suburbs along with those people who had the capacity and will to leave Kwinana. As a consequence of this exodus, vacant homes in Kwinana were offered by the State Housing Authority to people across Perth facing difficult circumstances. The City of Kwinana’s profile as a place to live was further impacted by a State Government decision to build a prison in the suburb of Casuarina some three kilometres east of the residential area.

Community Infrastructure Plan 2011 – 2031 (Revised 2015) – DRAFT FOR PUBLIC COMMENT
26
Ultimately, through circumstance and as a consequence of government policy of the day, a high proportion of socially and economically disenfranchised people came to live in Kwinana resulting in the City becoming one of the most disadvantaged communities in the metropolitan area.
5.2 Population
Based on the most recent ABS data, at 2014, the City’s population was 36 145. The City includes the suburbs and localities of Anketell, Bertram, Calista, Casuarina, Hope Valley, Kwinana Beach, Kwinana Town Centre, Leda, Mandogalup, Medina, Naval Base, Orelia, Parmelia, Postans, The Spectacles, Wandi and Wellard. At the ABS 2006 Census, the population was 23,195 and between then and the 2014 population of 36,145, the City grew by just under 13,000 people, which represents a significant growth in population of 36%, or an average annual growth rate of 4.5%. With approximately 1,300 hectares of urban land to be released within the ERIC planning area, it is anticipated that with the steady continuous release of residential land, population will continue to grow at a rate of about 4% to 5% over the next 20 years. While the overall growth rate remains high, since the 2009 CIP was prepared, there have been planning decisions made which have affected the distribution and rates of population growth across the City. As community infrastructure requirements reflect population needs, it was important to ensure facilities are reviewed to account for this and community need met. These changes are detailed under Part 6 ‘Population Growth and Projections’.
5.3 Age Structure
The age structure of the City of Kwinana provides key insights into the level of demand for age based services and facilities such as child care. It is also an indicator of the City of Kwinana's residential role and function and how it is likely to change in the future. Using the two latest Census dates, from the table below it is evident that the City of Kwinana has a higher proportion of people in the younger age groups (under 15) and a lower proportion of people in the older age groups (65+) than WA. Overall, 22.9% of the population are aged between 0 and 15, and 9.4% are aged 65 years and over, compared with 19.7% and 12.3% respectively for WA. With 25% of the population aged 20-34 years, young singles and very young families make up a significant part of the City of Kwinana’s population. Older singles and young to older families also make up a sizable part of Kwinana’s population, with 27% of the population aged 35-54 years. Both these demographic indicators relate directly to the high population of children and teenagers in the area, which in turn establishes a strong argument to ensure community facilities are provided to support the community needs of this significant demographic.
Community Infrastructure Plan 2011 – 2031 (Revised 2015) – DRAFT FOR PUBLIC COMMENT
27
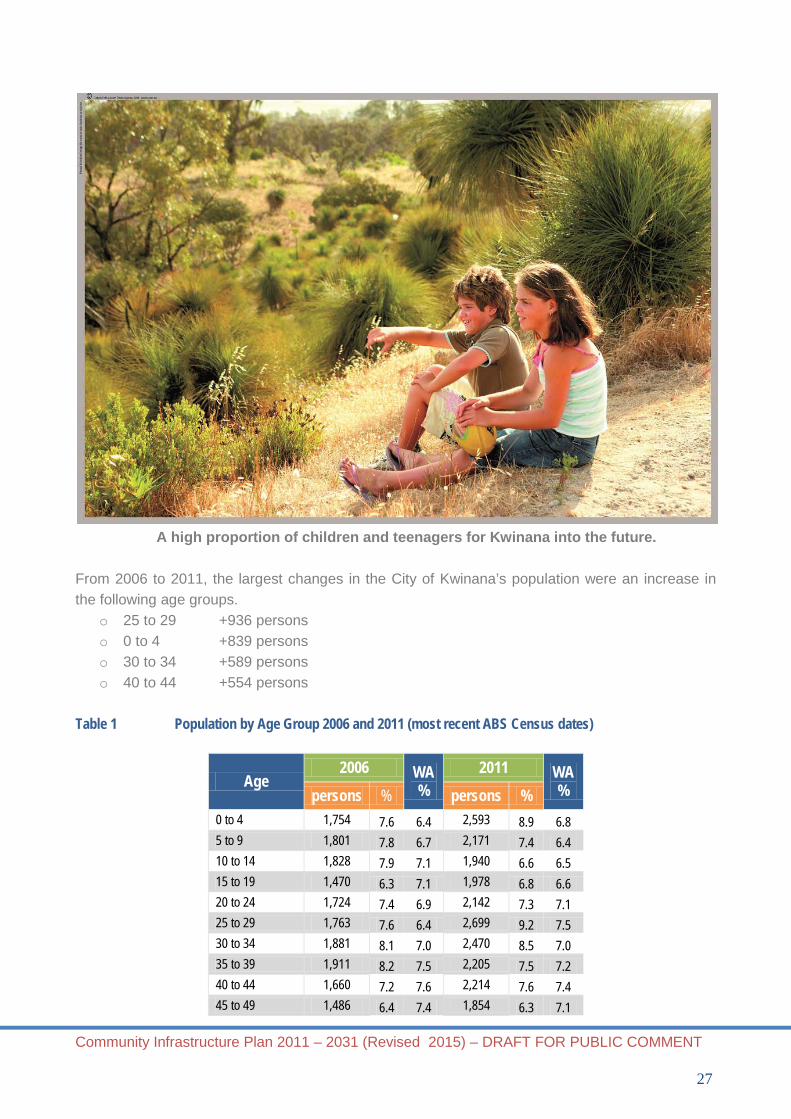
A high proportion of children and teenagers for Kwinana into the future.
From 2006 to 2011, the largest changes in the City of Kwinana’s population were an increase in the following age groups.
o 25 to 29 +936 persons o 0 to 4 +839 persons o 30 to 34 +589 persons o 40 to 44 +554 persons
Table 1 Population by Age Group 2006 and 2011 (most recent ABS Census dates)
Age 2006 WA
% 2011 WA
% persons % persons % 0 to 4 1,754 7.6 6.4 2,593 8.9 6.8 5 to 9 1,801 7.8 6.7 2,171 7.4 6.4 10 to 14 1,828 7.9 7.1 1,940 6.6 6.5 15 to 19 1,470 6.3 7.1 1,978 6.8 6.6 20 to 24 1,724 7.4 6.9 2,142 7.3 7.1 25 to 29 1,763 7.6 6.4 2,699 9.2 7.5 30 to 34 1,881 8.1 7.0 2,470 8.5 7.0 35 to 39 1,911 8.2 7.5 2,205 7.5 7.2 40 to 44 1,660 7.2 7.6 2,214 7.6 7.4 45 to 49 1,486 6.4 7.4 1,854 6.3 7.1

Community Infrastructure Plan 2011 – 2031 (Revised 2015) – DRAFT FOR PUBLIC COMMENT
28
50 to 54 1,335 5.8 6.8 1,601 5.5 6.7 55 to 59 1,211 5.2 6.3 1,398 4.8 6.0 60 to 64 1,012 4.4 4.6 1,223 4.2 5.4 65 to 69 784 3.4 3.6 914 3.1 3.9 70 to 74 646 2.8 2.9 729 2.5 3.0 75 to 79 454 2.0 2.4 518 1.8 2.2 80 to 84 272 1.2 1.7 318 1.1 1.7 85+ 203 0.9 1.4 260 0.9 1.5
Total 23,195 100 100 29,227 100 100 ABS Census 2006 and 2011
Source: id Consulting
5.4 Households and Families
The City of Kwinana's household and family structure is one of the most important demographic indicators. It reveals the area's residential role and function, era of settlement and provides key insights into the level of demand for services and facilities, as most are related to age and household types. According to the ABS 2011 Census, the City of Kwinana’s dominant household type is couples with children which increased from 30% in 2006 to 32% in 2011. While the proportion of couples without children has marginally decreased, the proportion of one parent families has increased to over 13%. The City of Kwinana’s household structure is similar to the Western Australian average, except for the much larger proportion of one parent families and lone person households. From 2006 to 2011, the largest changes in family/household types in the City of Kwinana were:
o Couples with children +822 households o Couples without children +424 households o One parent families +399 households o Lone person +308 households

Community Infrastructure Plan 2011 – 2031 (Revised 2015) – DRAFT FOR PUBLIC COMMENT
29
Table 2 Household and Family Type 2006 and 2011 (most recent ABS Census dates)
Household Type 2006 WA %
2011 WA % number % number %
Couples with children 2,548 29.8 30.3 3,370 31.7 30.7 Couples without children 2,103 24.6 25.3 2,527 23.7 25.9 One parent families 1,012 11.8 9.8 1,411 13.3 9.6 Other families 78 0.9 1.2 129 1.2 1.2 Group household 231 2.7 3.3 340 3.2 3.7 Lone person 1,899 22.2 22.9 2,207 20.7 22.2 Other not classifiable household 643 7.5 5.0 601 5.6 4.0 Visitor only households 40 0.5 2.2 61 0.6 2.7
Total 8,554 100 100 10,646 100 100 ABS Census 2006 and 2011
Source: id Consulting
5.5 Cultural Diversity
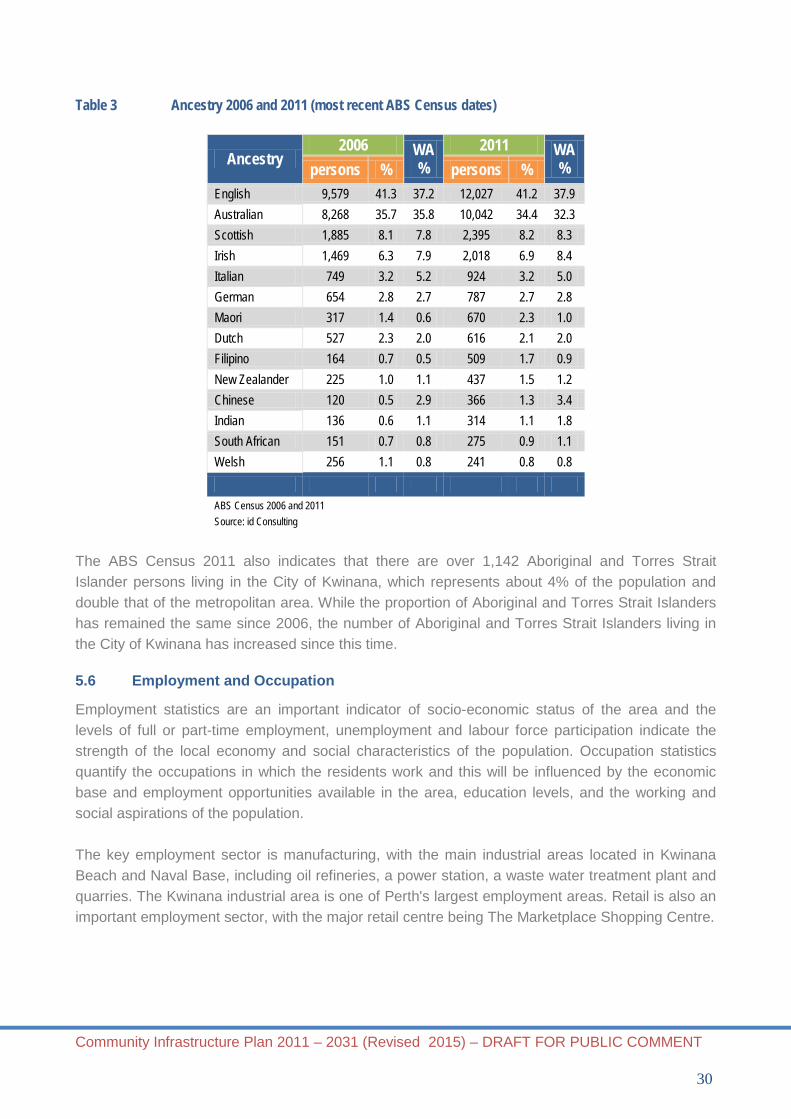
Different cultural groups typically have a variety of different needs and priorities and how and what services and facilities are provided can vary in different cultures. This should be taken into account in planning and providing facilities to ensure they are inclusive of the needs of the different cultural groups in the population. From the table below which defines the cultural association and ethnic background of an individual going back three generations, the most dominant ancestry groups in the City of Kwinana are:
o English 12,027 people or 41.2% o Australian 10,042 people or 34.4% o Scottish 2,395 people or 8.2% o Irish 2,018 people or 6.9% o Italian 924 people or 3.2%
From the ABS Census 2006, the largest changes in the reported ancestries of the population were:
o English +2,448 persons o Australian +1,774 persons o Irish +549 persons o Scottish +510 persons
The major differences between the ancestries of the population in the City of Kwinana compared with WA are:
o A larger percentage of people with Australian ancestry 34.4% compared to 30.1% o A larger percentage of people with English ancestry 41.2% compared to 37.6% o A larger percentage of people with Māori ancestry 2.3% compared to 1.0% o A smaller percentage of people with Chinese ancestry 1.3% compared to 4.2%
Community Infrastructure Plan 2011 – 2031 (Revised 2015) – DRAFT FOR PUBLIC COMMENT
30
Table 3 Ancestry 2006 and 2011 (most recent ABS Census dates)
Ancestry 2006 WA
% 2011 WA
% persons % persons % English 9,579 41.3 37.2 12,027 41.2 37.9 Australian 8,268 35.7 35.8 10,042 34.4 32.3 Scottish 1,885 8.1 7.8 2,395 8.2 8.3 Irish 1,469 6.3 7.9 2,018 6.9 8.4 Italian 749 3.2 5.2 924 3.2 5.0 German 654 2.8 2.7 787 2.7 2.8 Maori 317 1.4 0.6 670 2.3 1.0 Dutch 527 2.3 2.0 616 2.1 2.0 Filipino 164 0.7 0.5 509 1.7 0.9 New Zealander 225 1.0 1.1 437 1.5 1.2 Chinese 120 0.5 2.9 366 1.3 3.4 Indian 136 0.6 1.1 314 1.1 1.8 South African 151 0.7 0.8 275 0.9 1.1 Welsh 256 1.1 0.8 241 0.8 0.8 ABS Census 2006 and 2011 Source: id Consulting
The ABS Census 2011 also indicates that there are over 1,142 Aboriginal and Torres Strait Islander persons living in the City of Kwinana, which represents about 4% of the population and double that of the metropolitan area. While the proportion of Aboriginal and Torres Strait Islanders has remained the same since 2006, the number of Aboriginal and Torres Strait Islanders living in the City of Kwinana has increased since this time.
5.6 Employment and Occupation
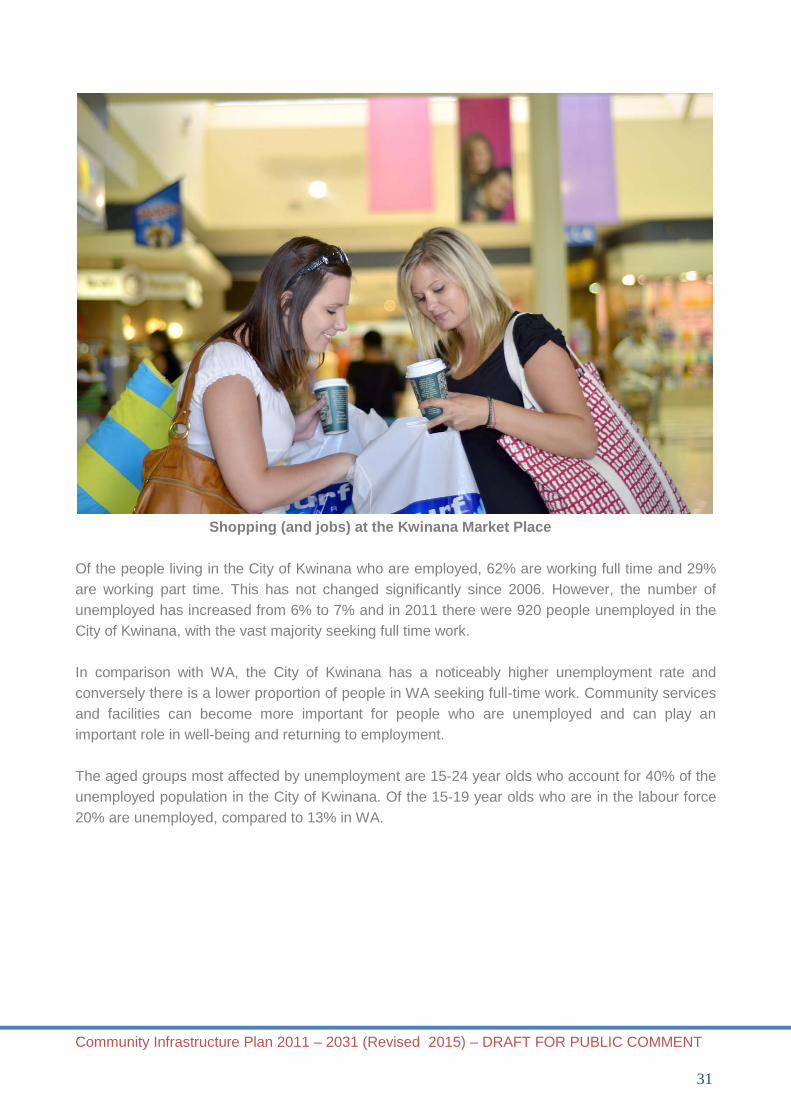
Employment statistics are an important indicator of socio-economic status of the area and the levels of full or part-time employment, unemployment and labour force participation indicate the strength of the local economy and social characteristics of the population. Occupation statistics quantify the occupations in which the residents work and this will be influenced by the economic base and employment opportunities available in the area, education levels, and the working and social aspirations of the population. The key employment sector is manufacturing, with the main industrial areas located in Kwinana Beach and Naval Base, including oil refineries, a power station, a waste water treatment plant and quarries. The Kwinana industrial area is one of Perth's largest employment areas. Retail is also an important employment sector, with the major retail centre being The Marketplace Shopping Centre.
Community Infrastructure Plan 2011 – 2031 (Revised 2015) – DRAFT FOR PUBLIC COMMENT
31
Shopping (and jobs) at the Kwinana Market Place
Of the people living in the City of Kwinana who are employed, 62% are working full time and 29% are working part time. This has not changed significantly since 2006. However, the number of unemployed has increased from 6% to 7% and in 2011 there were 920 people unemployed in the City of Kwinana, with the vast majority seeking full time work. In comparison with WA, the City of Kwinana has a noticeably higher unemployment rate and conversely there is a lower proportion of people in WA seeking full-time work. Community services and facilities can become more important for people who are unemployed and can play an important role in well-being and returning to employment. The aged groups most affected by unemployment are 15-24 year olds who account for 40% of the unemployed population in the City of Kwinana. Of the 15-19 year olds who are in the labour force 20% are unemployed, compared to 13% in WA.

Community Infrastructure Plan 2011 – 2031 (Revised 2015) – DRAFT FOR PUBLIC COMMENT
32
Table 4 Employment Status 2006 and 2011 (most recent ABS Census dates)
Employment Status 2006 WA
% 2011 WA
% persons % persons % Employed 9,258 94.2 96.2 12,732 93.3 95.3 Employed full-time 6,070 61.7 61.0 8,450 61.9 60.7 Employed part-time 2,855 29.0 32.5 3,962 29.0 32.6 Hours worked not stated 333 3.4 2.7 320 2.3 1.9 Unemployed 572 5.8 3.8 920 6.7 4.7 Looking for full-time work 392 4.0 2.2 610 4.5 2.8 Looking for part-time work 180 1.8 1.6 310 2.3 1.9
Total 9,830 100 100 13,652 100 100 ABS Census 2006 and 2011 Source: id Consulting
In comparison with the rest of WA, there are far more people in the City of Kwinana employed in the manufacturing and retail trade industry and fewer people employed in the property and business industry, and the education, health and community services field. In 2011, the three most popular occupations were Technicians and Trades Workers, Clerical and Administrative Workers and Labourers which account for 48.1% of the employed residents. Table 5 Occupation 2006 and 2011 (most recent ABS Census dates)
Occupation 2006 WA
% 2011 WA
% persons % persons % Managers 738 8.0 12.5 988 7.8 12.2 Professionals 853 9.2 18.6 1,369 10.8 19.9 Technicians and Trades Workers 2,003 21.6 16.4 2,653 20.9 16.7 Community /Personal Service Workers 873 9.4 8.9 1,355 10.6 9.4 Clerical and Administrative Workers 1,216 13.1 14.5 1,836 14.4 14.4 Sales Workers 811 8.8 9.4 1,169 9.2 8.6 Machinery Operators And Drivers 1,172 12.7 7.3 1,524 12.0 7.6 Labourers 1,422 15.4 10.9 1,635 12.8 9.7 Inadequately described 172 1.9 1.6 195 1.5 1.5
Total 15+ 9,260 100 100 12,724 100 100 ABS Census 2006 and 2011
Source: id Consulting
5.7 Income and Occupation
According to the ABS Census 2011, one in four households in the City of Kwinana earn less than $42,000 per year and would be described as low income households while 13.7% would be described as a high income households. In comparison with WA the City of Kwinana has far more low and medium income households and far fewer higher income households.

Community Infrastructure Plan 2011 – 2031 (Revised 2015) – DRAFT FOR PUBLIC COMMENT
33
However, between 2006 and 2011 the proportion of low income households has declined by about 4% and the proportion of medium to high income households has increased. This would indicate that on the whole, household income in the City of Kwinana is improving. With a higher proportion of low to middle income households in the City of Kwinana, the level of demand for public and not for profit services and facilities can be expected to be higher than other more affluent areas. Affordability will be a key issue particularly for seniors, students, unemployed people, young people, one-parent families and other low income groups. Table 6 Weekly Household Income 2011 (most recent ABS Census date)
ABS Census 2006 and 2011
Source: id Consulting
5.8 Social Disadvantage
The SEIFA Index of Disadvantage measures the relative level of socio-economic disadvantage based on a range of Census characteristics and in 2011 the City of Kwinana scored 968.1. This is well behind Perth, Western Australian and Australia. However, the areas of Bertram, Wellard (West) and Wellard (East) and Wandi all score better than Perth and Western Australia reflecting that the level of disadvantage is not the same across the City of Kwinana. A lower score on the index means a higher level of disadvantage.
number %Negative Income/Nil Income 11 0.8 1.4$1-$199 34 2.4 1.4$200-$299 55 3.9 2.3$300-$399 120 8.5 5.4$400-$599 150 10.6 8.1$600-$799 130 9.2 7.1$800-$999 89 6.3 6.9$1000-$1249 104 7.4 7.0$1250-$1499 106 7.5 6.8$1500-$1999 150 10.6 11.1$2000-$2499 87 6.1 8.1$2500-$2999 78 5.5 9.8$3000-$3499 41 2.9 5.5$3500-$3999 20 1.4 2.6$4000-$4999 19 1.3 2.1$5000 or more 5 0.4 2.0Not stated 214 15.1 12.5
Total 3,043 100 100
Weekly Household Income 2011 WA%

Community Infrastructure Plan 2011 – 2031 (Revised 2015) – DRAFT FOR PUBLIC COMMENT
34
Table 7 Socio-Economic Disadvantage 2011 (most recent ABS Census date)
Relative Socio-Economic Disadvantage 2011
Calista – Medina 873 Parmelia - Kwinana Town Centre 915 Orelia 938 Leda 965 City of Kwinana 968 Australia 1002 Western Australia 1,021 Perth 1033 Bertram 1041 Wellard (West) 1053 Wellard (East) 1,071 Wandi 1096 ABS Census 2006 and 2011 Source: id Consulting
Through history and circumstance, a high proportion of socially disadvantaged people have come to live in the City of Kwinana and today the area is one of the most disadvantaged communities in the metropolitan area. This social-economic disadvantage is clearly evident in the City of Kwinana’s lower income levels, education levels, one parent families and much higher unemployment rates, one person households and public housing. Research undertaken by the Department of Health-South Metropolitan Health Unit, Curtin University and Alcoa Research Centre for Stronger Communities highlights other factors of socio-economic disadvantage:
o High levels of contact with the Department for Child Protection and Family Support o High levels of adverse health outcomes o High levels of domestic violence and drug and substance misuse o Delays in speech and language development in children accessing childcare in Kwinana.
6 Population Growth and Projections
The City of Kwinana’s population projections have been based on the ABS Census 2011 and predicted dwelling yields resulting from a review of land availability, existing structure plans and emerging development interests and proposals. While the timing of development has been estimated, residential development depends on many factors such as interest rates, availability of finance and government spending and both small and large changes, such as the Global Financial Crisis can affect the pace of development and therefore population growth. Hence, the population projections will be reviewed on a regular basis.
Community Infrastructure Plan 2011 – 2031 (Revised 2015) – DRAFT FOR PUBLIC COMMENT
35
The following changes to the planning context since 2009 and their implications to the respective Development Contribution Areas (DCA’s) and contribution ‘districts’ set under scheme Amendment 115 are discussed as follows.
1. Amendments to the Metropolitan Region Scheme (‘MRS’) to facilitate ERIC and the
Jandakot Structure Plan The population projections of the current CIP were based largely on the draft ERIC plan which projected development over large areas of former rural land. Since that time, a number of amendments to the MRS to rezone this land to either Urban or Urban Deferred have occurred and therefore the City now has a much clearer picture of the likely development over the next twenty years, particularly within the ERIC plan area. 2. Recent amendments to the MRS within Wellard West Since the preparation of the CIP and associated DCPs, significant portions of land within Wellard have been rezoned from Rural to Urban or Urban Deferred by the Western Australian Planning Commission (WAPC) thereby allowing for urban development. These areas weren’t anticipated for development during the preparation of the 2009 CIP given the constraints on the land (and, in some locations, such as the western side of Bollard Bulrush, hadn’t been supported by the Council). Such land includes: o The southern land and small northern portion of land adjoining the Bollard Bulrush wetlands
– MRS 1224/27, lifting of Urban Deferred; o The eastern land adjoining the Bollard Bulrush wetlands – MRS 1296/27, lifting of Urban
Deferred; o The western land adjoining the Bollard Bulrush wetlands – MRS1189/57, rezoning from
Rural to Urban Deferred. These new areas capable of residential development have impacted on the original dwelling and population projections undertaken during 2009. For example, the dwelling projection for DCA12 – Wellard West was 1,100 dwellings in 2009, however due to the MRS amendments, this dwelling projection is now 2,979 as a result of approximately 110 additional hectares of land being made available for residential development. 3. Reduced residential developable area of the Mandogalup cell (DCA8) The portion of the Mandogalup cell closest to the Kwinana Freeway was zoned Urban in February 2014 however the area of developable land is significantly less than that originally envisaged by the Eastern Residential Intensification Concept (ERIC) plan and the area accounted for in the current CIP. These plans anticipated the decommissioning of ALCOA’s residue disposal area and the consequential reduction in the required air quality buffer surrounding these facilities within the short to mid term. However, during the lifting of the urban deferment zone at Mandogalup earlier last year, it became clear that ALCOA’s operations in the residual disposal area would continue in the medium term and therefore the urban deferment lifting applied only to land outside of a 1.5km buffer from the disposal area. Until this issue is resolved or at least progressed further, it is recommended that planning for the

Community Infrastructure Plan 2011 – 2031 (Revised 2015) – DRAFT FOR PUBLIC COMMENT
36
residential development in this area be based upon the current Urban zoned land only. The current CIP plans for a population of 6,042 persons in Mandogalup by 2031 (approximately 2,158 dwellings), however under the current Urban zoning at 2015, the likely population by 2031 is estimated at 3,780 persons (1,400 dwellings). As a result, and in recognition that the ALCOA air quality buffer is unlikely to be significantly reduced/removed in the near future (20 years), the projected dwelling yields for Mandogalup have reduced, thereby reducing the demand for a number of community infrastructure items. 4. Reduced residential developable area of the Wellard East cell (DCA12) The current CIP projects a population within DCA12 by 2031 of 4,125 persons (1,468 lots). However this projection was based on the entire area of DCA12 being zoned ‘Urban’ under the MRS, as was intended by the ERIC plan. Currently, the south eastern corner of DCA12 is still zoned ‘Urban Deferred’ as a result of its close proximity to the livestock holding facility on Telephone Lane within the City of Rockingham. There are restrictions on residential land uses within a 1km buffer distance from the holding facility and it is unlikely that this buffer distance or the land use restrictions will be reviewed in the medium to longer term (10-20 years). It should also be noted that the WAPC recently refused a request by landowners in the Livestock Holding buffer area to rezone the land to Urban. As a consequence, the likely yield from DCA12 in the medium future will be approximately 1,229 lots – a population of 3,318 persons. 5. The varied rate of development uptake within the urban development cells Development within the urban development cells, particularly Wandi, Wellard East and Wellard West, has generally progressed ahead of the forecasts contained in the current CIP, however infill development hasn’t eventuated as rapidly as expected within the established areas of Kwinana (primarily District C). The varying rate of development needs to be reflected in a revised CIP as this will impact on the planning and construction dates for each facility. Taking account of the above, the 2031 population projections are based on the six areas outlined in the map below and Table 8 shows five year population projections for each area. It is noted that the figure for the total population in Table 8 is in the order of 570 people lower than the City of Kwinana’s population referred to in the earlier demographic profiling and this is because, for the purpose of the population projections, the Casuarina Prison population has been excluded.
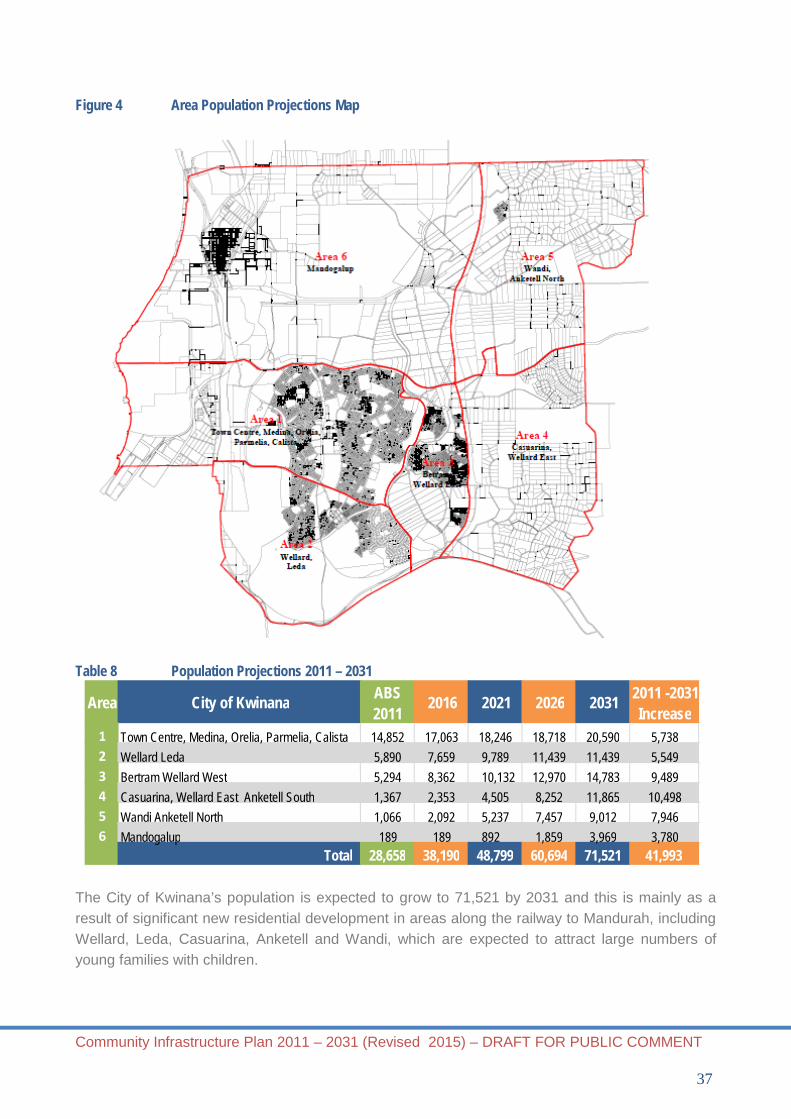
Community Infrastructure Plan 2011 – 2031 (Revised 2015) – DRAFT FOR PUBLIC COMMENT
37
Figure 4 Area Population Projections Map
Table 8 Population Projections 2011 – 2031
The City of Kwinana’s population is expected to grow to 71,521 by 2031 and this is mainly as a result of significant new residential development in areas along the railway to Mandurah, including Wellard, Leda, Casuarina, Anketell and Wandi, which are expected to attract large numbers of young families with children.
Area City of Kwinana ABS 2011
2016 2021 2026 2031 2011 -2031 Increase
1 Town Centre, Medina, Orelia, Parmelia, Calista 14,852 17,063 18,246 18,718 20,590 5,738 2 Wellard Leda 5,890 7,659 9,789 11,439 11,439 5,549 3 Bertram Wellard West 5,294 8,362 10,132 12,970 14,783
9,489
4 Casuarina, Wellard East Anketell South 1,367 2,353 4,505 8,252 11,865 10,498 5 Wandi Anketell North 1,066 2,092 5,237 7,457 9,012 7,946 6 Mandogalup 189 189 892 1,859 3,969 3,780
Total 28,658 38,190 48,799 60,694 71,521 41,993
Community Infrastructure Plan 2011 – 2031 (Revised 2015) – DRAFT FOR PUBLIC COMMENT
38
With respect to existing areas, Calista and Medina are expected to attract some younger families, while losing some young adults leaving home. Leda and Orelia are expected to continue to attract families in their development phase. Parmelia and the Kwinana City Centre area, by contrast are expected to attract young adults in their teens and twenties in a similar fashion to an inner city area. From 2011 to 2031, Area 4 Casuarina, Wellard East Anketell South is expected to experience the greatest level of growth with a current population of 1,367, expected to grow to 11,865 by 2031, or by an average of 525 people every year. Area 3 Bertram Wellard West area is expected to increase by 9,489 to 14,783 people by 2031 and this area will experience the second highest population increase. The population of Area 5 Anketell North is expected to increase to 9,012 people by 2031. Area 1 Town Centre, Medina, Orelia, Parmelia, Calista is expected to grow by 5,738 people from 14,852 in 2011, to 20,590 by 2031. Area 2 Wellard, Leda area will experience the lowest level of population growth involving 5,549 additional people. This represents a doubling of the current population to 11,439 by 2031. Area 6 Mandogalup which has a very small current population of 189, is expected to grow to 3,969 people by 2031 which, whilst a significant increase, is currently constrained from reaching long term population as projected by the Jandakot District Structure Plan and ERIC by the existing air quality buffer zone surrounding the ALCOA industry.
6.1 Population Growth 2011 to 2016
From 2011 to 2016, the City of Kwinana’s population is expected to increase by 9,532 people to 38,190 and this represents a substantial increase of 33.3%. This involves an average increase of 1,906 people and 706 dwellings per year for this period. The largest to smallest growth expected from 2011 to 2016 is as follows.
o Bertram Wellard West 3,068 people o Town Centre Medina, Orelia, Parmelia, Calista 2,211 people o Wellard Leda 1,768 people o Wandi Anketell North 1,026 people o Casuarina, Wellard East, Anketell South 985 people o Mandogalup 0 people
6.2 Population Growth 2016 to 2021
Between 2016 and 2021, the population of the City of Kwinana is expected to increase by 10,609 people, or an average of 2,122 per year which would equate to 786 dwellings per year for this period. The largest to smallest growth expected from 2016 to 2021 is as follows.
o Wandi Anketell North 3,145 people o Casuarina, Wellard East, Anketell South 2,152 people o Wellard and Leda 2,130 people o Bertram Wellard West 1,770 people
Community Infrastructure Plan 2011 – 2031 (Revised 2015) – DRAFT FOR PUBLIC COMMENT
39
o Town Centre Medina, Orelia, Parmelia, Calista 1,183 people o Mandogalup 703 people
6.3 Population Growth 2021 to 2026
From 2021 to 2026 the population of the City of Kwinana is expected to increase by 11,895, or an average of 2,379 people and 881 dwellings per year. The largest to smallest growth expected from 2021 to 2026 is as follows.
o Casuarina, Wellard East Anketell South 3,747 people o Wandi Anketell North 2,220 people o Bertram Wellard West 2,838 people o Wellard Leda 1,650 people o Mandogalup 967 people o Town Centre Medina, Orelia, Parmelia, Calista 473 people
6.4 Population Growth 2026 to 2031
Between 2026 and 2031 the population of the City of Kwinana is expected to increase by 10,962 people, or an average of 2,192 per year which would equate to 812 dwellings per year for this period. The largest to smallest growth expected from 2026 to 2031 is as follows.
o Casuarina, Wellard East Anketell South 3,613 people o Mandogalup 2,110 people o Town Centre Medina, Orelia, Parmelia, Calista 1,871 people o Bertram Wellard West 1,637 people o Wandi Anketell North 1,555 people o Wellard Leda 0 people
7 Community Needs Assessment
The City of Kwinana has a long established and experienced role in community needs assessment and the planning of community facilities, services and programs. It first completed a comprehensive Community Needs Assessment in 1994. Since this time, the City of Kwinana has maintained an ongoing commitment to understanding community needs and priorities, having now completed a wide range of studies involving extensive community needs assessment and stakeholder and public engagement. These key studies form part of the community needs assessment for the Community Infrastructure Plan. o Community Infrastructure Study o Community Resource and Knowledge Centre Feasibility Study o Kwinana Youth Facility Feasibility Study o Community Infrastructure Study - Jandakot Structure Plan o Parks for People: Public Open Space Upgrade Strategy This proactive role in community planning ensures that the City of Kwinana has an accurate picture of community needs and a good understanding of the capacity of existing facilities and services to meet current and future demand, as the population grows and changes over time.
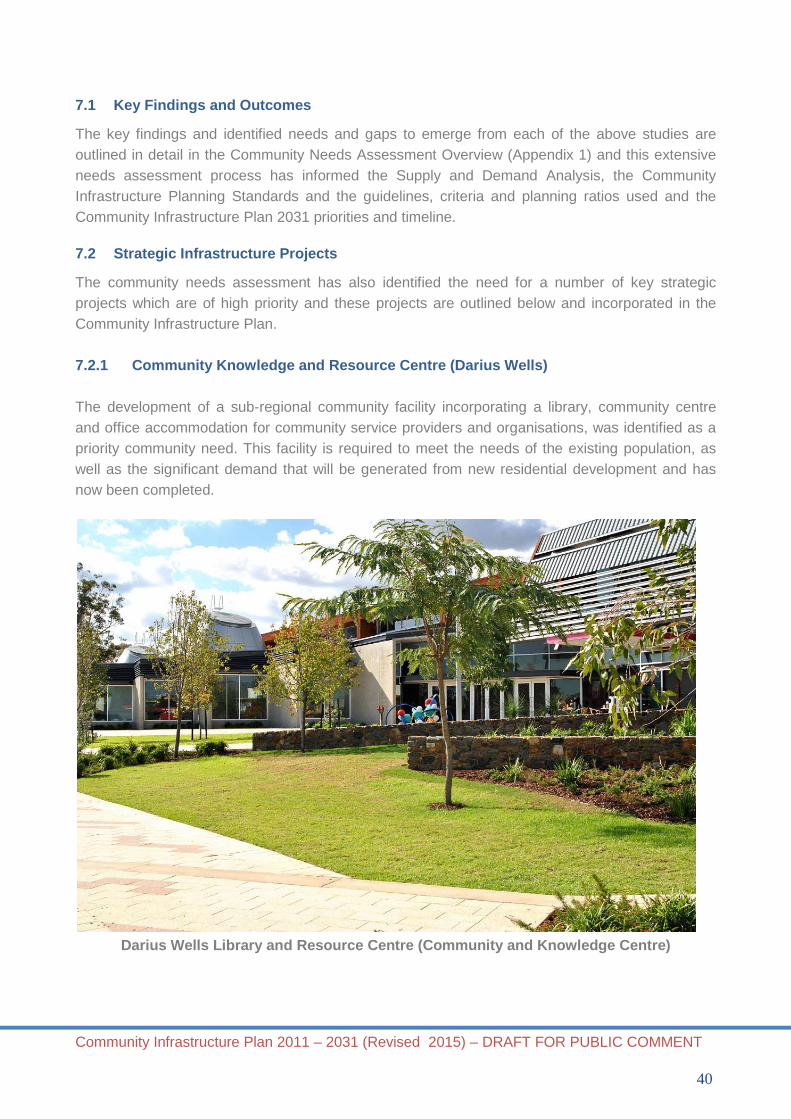
Community Infrastructure Plan 2011 – 2031 (Revised 2015) – DRAFT FOR PUBLIC COMMENT
40
7.1 Key Findings and Outcomes
The key findings and identified needs and gaps to emerge from each of the above studies are outlined in detail in the Community Needs Assessment Overview (Appendix 1) and this extensive needs assessment process has informed the Supply and Demand Analysis, the Community Infrastructure Planning Standards and the guidelines, criteria and planning ratios used and the Community Infrastructure Plan 2031 priorities and timeline.
7.2 Strategic Infrastructure Projects
The community needs assessment has also identified the need for a number of key strategic projects which are of high priority and these projects are outlined below and incorporated in the Community Infrastructure Plan. 7.2.1 Community Knowledge and Resource Centre (Darius Wells) The development of a sub-regional community facility incorporating a library, community centre and office accommodation for community service providers and organisations, was identified as a priority community need. This facility is required to meet the needs of the existing population, as well as the significant demand that will be generated from new residential development and has now been completed.
Darius Wells Library and Resource Centre (Community and Knowledge Centre)

Community Infrastructure Plan 2011 – 2031 (Revised 2015) – DRAFT FOR PUBLIC COMMENT
41
7.2.2 Sub-Regional Sporting Ground - Thomas Oval/Kelly Park The establishment of a sub-regional sporting ground with a capacity to cater for a high standard of sport was identified as a priority community need. The existing population has reached a point where a considerable demand for this standard of facility has been generated and this demand will continue to increase with the additional population generated from new residential development. The redevelopment of facilities at the Thomas Oval/Kelly Park precinct, to establish a sub-regional sporting facility was identified as the most cost effective and land efficient option at the time. A multi-purpose shared pavilion has been constructed and ground redevelopment has occurred, however, additional work is still required to create a fully functional sub-regional sports facility. This work includes redevelopment of the hard court area, construction of a set of change rooms on the eastern side of the ground and renovation of the original pavilion. Appropriate planning for district facilities to service the new residential areas should assist with managing requirements for further expansion of facilities at Thomas Oval/Kelly Park in the future. 7.2.3 Wells Beach Foreshore Upgrade (Park and Boating Facility) Although the City of Kwinana is wholly bounded by the Indian Ocean to the west, the majority of this foreshore land is fronted by the heavy industries within Kwinana Beach and Naval Base. Kwinana Beach and Wells Park has perpetually been the primary waterfront recreation area for Kwinana residents and the poor condition and lack of facilities in this precinct have been identified as a priority upgrade to accommodate community need. Facilities to support the recreational use of the beach and Cockburn Sound are required to meet the needs of both the existing population and the additional demand generated from new residential development. The redevelopment of Wells Park has been identified as the most effective and cost efficient option to cater for the existing and future demand for boating, fishing and beach recreation. Stage 1 of this redevelopment has been completed. 7.2.4 District Youth Centre (The Zone) A large-scale district level youth centre incorporating a range of services, programs and spaces for youth activities and recreation, was identified as a priority community need and was completed in 2012. This district centre will serve the broader City area until future planned district youth facilities are provided for in Wandi and Casuarina. 7.2.5 District Sporting Grounds (Orelia Oval and Medina Oval extension/upgrade) Without adequate pavilion facilities on any sports grounds to cater for district level sport and competition, a district sports ground with facilities was identified as a priority community need. The existing population generates a need for one district sports ground and the most effective and cost efficient option identified was the development of a district level sporting pavilion on Orelia Oval.
Community Infrastructure Plan 2011 – 2031 (Revised 2015) – DRAFT FOR PUBLIC COMMENT
42
This facility will meet the demand generated from the existing and new residential population in Wellard (DCA 14) and within District C. This new facility has been completed. Other district level facilities are located throughout District C and at some time in the future, when they have reached the end of their economic life, these should be co-located at Medina Oval. The construction of a multipurpose facility to house sporting groups and community groups currently located on the site, and relocation of the tennis club from Calista Oval to the Medina Oval location, will be necessary in 10 – 15 years time. 7.2.6 Destination Park - Calista The lack of any significant parkland to provide for the higher order and diverse passive recreation and leisure opportunities required for the size of the current and future population was identified as a major gap in parks provision and a priority community need. The redevelopment of the Calista Oval site to a sub-regional or ‘destination park’ has been identified as the most effective and cost efficient way of achieving a high order parkland facility to meet the needs and demands generated from the future population. 7.2.7 Rural Community Facilities – Wandi Community Centre Although populations are much smaller in rural areas, the need for community facilities to undertake local sport and recreational activities is important. Currently the City has two rural community centres; Casuarina Hall Reserve / Community Centre (Mortimer Road and Barker Road, Casuarina), and Wandi Hall Reserve / Community Centre (De Haer Rd, Wandi). Having a concentrated woodworking membership base, the Wandi Community Centre has an established need for the replacement and expansion of the current workshop to provide more suitable woodworking and recreation space for the diverse user population. The rural areas east of the freeway are very established and quite different in population mix and culture from the urban communities west of the freeway. The people who live there enjoy larger lots suited to a rural and/or equestrian lifestyle and the facilities that have developed in these communities reflect those lifestyle choices. Wandi is case in point where equestrian, recreation, sporting, hobby and community meeting spaces are co-located. This facility attracts members from much wider than the Wandi area, making this an activity hub for not only the rural residents of Casuarina, Wellard and Wandi but the increasing eastern urban populations as well. This is not proposed to be funded through developer contributions. 7.2.8 Animal Shelter The development of a new animal shelter was identified as a priority community need due to the poor condition and standard of the existing animal shelter. This facility is considered inadequate in terms of meeting the demand from the existing population and current standards. With additional new residential development, the level of demand on the animal shelter will increase. This is not proposed to be funded through developer contributions.

Community Infrastructure Plan 2011 – 2031 (Revised 2015) – DRAFT FOR PUBLIC COMMENT
43
7.2.9 Works Depot With the rapidly expanding population, the need for a new and more centrally located Works Depot has been identified. The existing facility is considered to be just adequate to meet the demand from the existing population, with additional demand generated by the new residential development, a modern contemporary facility will be required. This is not proposed to be funded through developer contributions. 7.2.10 Civic Administration Centre The current civic administration building is just adequate to meet the requirements of the current population. Expansion of office accommodation into other buildings that the City owns will be a requirement to meet the demands generated by the anticipated residential growth, and ultimately a new civic administration centre will be required. This is not proposed to be funded through developer contributions. 7.2.11 Redevelopment of Retirement Villages The City currently operates two retirement villages. One is a lease for life facility that was constructed in the late 1990’s early 2000’s, the other is a rental complex which is a joint venture with the Department of Housing, constructed in the 1970’s. These units will require redevelopment in the future. This is not proposed to be funded through developer contributions. 8 Community Planning Framework
The preparation of the CIP has relied on an extensive Community Planning Framework incorporating planning catchments, a hierarchy for infrastructure provision, infrastructure planning standards and guiding principles, outlined below.
8.1 Planning Catchments
In developing a geographic framework for the Community Infrastructure Plan, growth fronts and population projections have been reviewed and mapped. Based on spatial catchments, relationships to existing commercial and community facilities and physical boundaries, the Community Infrastructure Plan is based on a four ‘district’ structure, as the following map indicates. This has also taken into consideration the location of surrounding district and regional centres and the existing and planned community facilities in the surrounding LGAs of the City of Cockburn, City of Rockingham and Shire of Serpentine Jarrahdale.
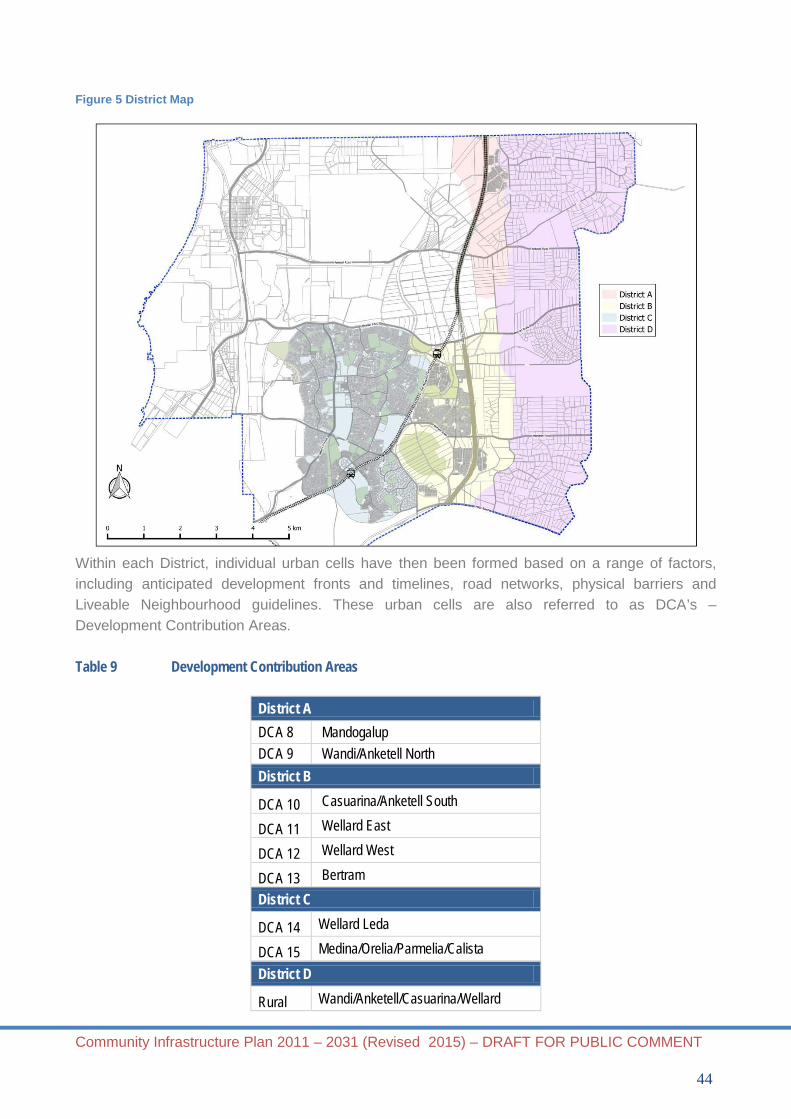
Community Infrastructure Plan 2011 – 2031 (Revised 2015) – DRAFT FOR PUBLIC COMMENT
44
Figure 5 District Map
Within each District, individual urban cells have then been formed based on a range of factors, including anticipated development fronts and timelines, road networks, physical barriers and Liveable Neighbourhood guidelines. These urban cells are also referred to as DCA’s – Development Contribution Areas. Table 9 Development Contribution Areas
District A DCA 8 Mandogalup DCA 9 Wandi/Anketell North District B
DCA 10 Casuarina/Anketell South
DCA 11 Wellard East
DCA 12 Wellard West
DCA 13 Bertram District C
DCA 14 Wellard Leda
DCA 15 Medina/Orelia/Parmelia/Calista District D
Rural Wandi/Anketell/Casuarina/Wellard

Community Infrastructure Plan 2011 – 2031 (Revised 2015) – DRAFT FOR PUBLIC COMMENT
45
8.2 Community Infrastructure Hierarchy
Community Infrastructure operates within a hierarchy of provision with the function, scale, design and management of infrastructure determined by the catchment and size of the population the facility or service is required to serve. A ‘structure’ to community infrastructure provision is an important tool for not only planning infrastructure, but also for achieving good connectivity between community facilities and services and other urban features, such as the transport system, town centre and commercial precincts. Having a clear hierarchy for providing community infrastructure also facilitates the potential for the appropriate co-location of facilities and the creation of community and civic hubs. A Community Infrastructure Hierarchy is also an essential tool in maintaining an equitable, accessible and efficient distribution of community facilities across the City.
8.3 Neighbourhood Level
A Neighbourhood catchment involves a population in the order of 1,250–2,000 people, or about 440-740 dwellings and should have a walkable radius of 250m, without major roads or physical barriers traversing the area. Neighbourhood level facilities should be well connected by footpaths and cycle ways and a neighbourhood should have safe, walkable connections to public transport stops and local level facilities. Facilities at the neighbourhood level are generally confined to parks and playgrounds, with residents most likely to help each other out with child minding, carpooling and other informal help at this level and hence a neighbourhood is the base level for community development.
8.4 Local Level
A Local catchment involves a population in the order of 5,000 to 8,000 people, or about 1,850 to 3,700 dwellings and should have a walkable radius of 400m without major roads or physical barriers traversing the area. Each local area is typically made up of four neighbourhoods, with local facilities well positioned to enable good accessibility for each neighbourhood. Local facilities usually include primary schools, community centres, local parks, public toilets and outdoor courts and sportsgrounds with many of these facilities also providing a base for the delivery of services, such as playgroup, family support services and lifestyle and fitness programs. Facilities provided at the local level provide the opportunity for local residents to interact, share common interests, build relationships and develop skills and resources essential to building a strong sense of community and active civic engagement. Local facilities also provide the space for community events and programs. Local level facilities should be easily accessible by public transport, footpaths and cycle ways and may also be co-located with other local facilities, or form part of a local community hub.

Community Infrastructure Plan 2011 – 2031 (Revised 2015) – DRAFT FOR PUBLIC COMMENT
46
8.5 District Level
A District catchment involves a population in the order of 25,000 to 35,000 people, or 9,300 to 11,100 dwellings and typically encompasses five to six local catchments. It is often defined by major roads or physical barriers. Community facilities provided at the District level must cater for a large geographic area and hence a wide range of community needs, including more complex or specialist services or facilities, such as higher level sporting codes. District level facilities can also accommodate office space for community or sporting organisations and also provide larger spaces for higher order community programs and events that attract people from across the district. District level facilities and services also resource or support Local level infrastructure and should ideally be integrated and co-located with other District level community facilities and the district level town centre or commercial hub, where appropriate. District level community facilities should also be central to the local catchments they serve, with good connectivity between all local catchments.
8.6 Sub-Regional Level
A Sub-Regional catchment involves a population in the order of 75,000 to 100,000 people, or 28,000 to 37,000 dwellings. This catchment is defined by the City of Kwinana’s municipal boundaries, which covers an area of 120km2. Community infrastructure at the sub-regional level is required to cater for a significant population and therefore involves large scale facilities, such as aquatic centres and major sporting and cultural facilities that draw people from across the region. Sub-Regional community infrastructure also has an important role in resourcing and supporting facilities and services at a District level and should ideally be integrated within the city centre precinct, where appropriate, and co-located with other Sub-Regional level community infrastructure to form a regionally significant community hub. Sub-Regional community infrastructure should be in close proximity to public transport to improve accessibility.
8.7 Community Infrastructure Planning Standards
The City of Kwinana developed an extensive schedule of Community Infrastructure Planning Standards with the study into the community infrastructure requirements of the Eastern Residential Intensification Concept (District Structure Plan).

Community Infrastructure Plan 2011 – 2031 (Revised 2015) – DRAFT FOR PUBLIC COMMENT
47
In addition to local government infrastructure, the standards and guidelines also encompassed all government facilities and services, including hospitals, tertiary institutions, schools, police and emergency services, as well as facilities and services provided by the private and non-government sector. This process involved extensive consultation with a myriad of government agencies and other organisations. In developing the local government component of these standards, a ‘baseline’ standard was also established by equating the current level of provision of various facilities in the City of Kwinana to a population ratio, such as one community centre for every 5,000 people (1:5,000). Also, a comparative analysis of planning standards utilised by other outer metropolitan growth LGAs in Australia was also undertaken, including the City of Swan, City of Armadale, City of Wanneroo, Shire of Melton (Vic), City of Wyndham (VIC) and City of Penrith (NSW). This work established an ‘industry benchmark’ to inform and guide the development of the City of Kwinana’s standards. The City of Kwinana has undertaken a major review of the Community Infrastructure Planning Standards in 2009 and most recently in 2014/15 to ensure that these standards and guidelines still have a sound and strong rationale and also reflect changing trends and best practice in the sustainable provision of community infrastructure in local government. The 2014/15 review also involved an appraisal of the planning standards used and the related level of provision in the surrounding LGAs. It has been identified that there is generally a lower standard and level of provision in the City of Rockingham and the City of Cockburn, compared to the City of Kwinana. However, additional research has established that the City of Kwinana’s Community Infrastructure Planning Standards are sound and consistent with the industry norm. This is supported by the following reports.
o Guidelines for provision of Community Infrastructure, prepared by the Parks & Leisure WA in 2011 is the most recent report on planning standards, which aims to provide a reference point and establish guidelines for the provision of community infrastructure.
o Planning for Community Infrastructure in Growth Areas (2008), prepared by Australian Social and Recreation Research (ASRR) on behalf of six urban growth LGAs in Victoria. This report documented community facility and service standards used by each LGA and developed a common framework of planning standards.
This review also involved a more detailed investigation of the planning standards for public open space (POS) given the growing recognition that a shortage of sports grounds is emerging in many developing areas, with parks also becoming smaller and less functional. With the heightened emphasis on active and healthy lifestyles, better POS outcomes must be achieved to ensure there is an adequate level of both active and passive open space.

Community Infrastructure Plan 2011 – 2031 (Revised 2015) – DRAFT FOR PUBLIC COMMENT
48
More detailed standards and requirements for passive and active public open space have been developed and these include a formula to estimate the area of POS a population requires. This is based on WAPC Policy 2.3 and 1955 Stephenson Hepburn report which equates 10% POS to 3.36ha per 1,000 people. Under Liveable Neighbourhoods 2% can be restricted POS, such as natural areas, wetlands and swales/detention basins, with 8% of POS for unrestricted use, such as passive and active recreation. This would equate to approximately 2.68ha per 1,000 people. Of this 2.68ha, it has been estimated that 50% should be set aside for sporting grounds and 50% for parks and passive uses. The planning standards for parks and sporting grounds reflect this and balance the provision of active and passive space. The current POS Upgrade Strategy has also informed these standards and guidelines. The 2014/15 CIP Standards are attached and have been applied to the projected population of each District to provide an indication of the community facilities required (Appendix 2).
8.8 Principles
Principles were formulated to guide the development of the CIP and these have also be utilised to guide the implementation of the plan. These principles set out the underlying philosophy that should be followed in the planning, design and provision of community infrastructure. Equity and Access All members of the community, regardless of income, gender, background, age, cultural background or disability, should have fair and equal access to community infrastructure. Need and Demand The provision of community infrastructure should be based on sound evidence of need and established priorities, with resources being allocated in accordance with these priorities. Maximising the Use of Existing Infrastructure The capacity and use of existing community infrastructure should be maximised in addressing the needs of the current and future population. Consultation and Engagement The community and all relevant stakeholders should be consulted and engaged in community infrastructure planning and provision. Co-location and Resource Sharing Community infrastructure should be located to optimise land efficiencies, sharing of resources and the creation of active community ‘hubs’. Integration and Sustainability Community infrastructure should be integrated with land use and transport planning and should be designed and provided in an environmentally sustainable manner.
Community Infrastructure Plan 2011 – 2031 (Revised 2015) – DRAFT FOR PUBLIC COMMENT
49
Timeliness and Flexibility Community infrastructure should be planned and provided in a timely manner to ensure facilities are available when needed and that facilities can adapt to meet changing community needs over time. 9 Supply and Demand Analysis
The Supply and Demand Analysis culminates the findings from the demographic analysis, population projections and the community needs assessment and identifies the current and future demand for neighbourhood, local, district and sub-regional community infrastructure.
9.1 Neighbourhood Community Infrastructure
The only community facilities that are provided at the Neighbourhood level are Neighbourhood Parks. 9.1.1 Neighbourhood Parks Neighbourhood Parks provide a well-designed play space with equipment and natural play opportunities. They provide both active and passive elements to assist children develop their physical, cognitive and social skills. Neighbourhood Parks provide an environment for casual recreation, physical activity and relaxation for all age groups. Current Supply There are currently 67 Neighbourhood Parks in the City of Kwinana and based on the 2014 population of 36,145 and the planning ratio 1:2,000 people, there would appear to be an oversupply. However, when taking into account physical barriers, all Neighbourhood Parks are required to achieve a park within the required distance of 400 metres, or a five minute walk from most dwellings.

Community Infrastructure Plan 2011 – 2031 (Revised 2015) – DRAFT FOR PUBLIC COMMENT
50
Ridley Park Medina The Parks for People: POS Upgrade Strategy has also highlighted the need to improve and upgrade the following parks highlighted with an asterisk. District A Mandogalup
o Mandogalup Reserve Wandi o Labbatt Gardens
District B Bertram
o Everglades Park * o Berry Park * o Ascot Park o Millbrook Park o Parkfield Park o Daintree Park * o Greenham Park o Darton POS o Kendal Reserve o Chipperton Park o Ludlow Park o Cleopatra Park o Belgravia Dampland (Nature) o Sanctuary Reserve (Nature) o Squires Reserve (Nature)

Community Infrastructure Plan 2011 – 2031 (Revised 2015) – DRAFT FOR PUBLIC COMMENT
51
District C Leda
o English Park o Rogan Park * o Riley Park * o Feilman Park
Calista o Gawler Park * o Wellard Road POS (Nature) *
Kwinana Town Centre o Town Park * o Council Green
Orelia o Rutherford Square Park o Oakham Park (Nature) o Partridge POS (Nature) o Littlemore Park (Nature) o Reilly Reserve (Nature) o Maycock Park (Nature) o Richard POS (Nature) o Clark Place(Nature) o Menli POS (Nature) o Nathaniel Way (Nature) o Jeffers Reserve (Nature) o Dowling Park (Nature) o Dent POS (Nature)
Parmelia
o Barney Park * o Bournan Park * o Brandon Park * o Oakfield Park * o Ince Park o Kirkland Park * o Newstead Park o Morrit Park o Warner Park o Hefron POS (Nature) o Welbourne POS (Nature) o Blackboy POS (Nature) o McKanna Gardens (Nature)
Community Infrastructure Plan 2011 – 2031 (Revised 2015) – DRAFT FOR PUBLIC COMMENT
52
o Darkins POS (Nature) o Durrant Ave (Nature) o Sutherland Reserve (Nature) o Sutherland South Res o Corrigin Park (Nature)
Medina o Ridley Park o Seabrook POS (Nature) o Bryan Mainwaring Reserve (Nature) o Oakley POS (Nature)
Wellard
o Lambeth Gardens o Weaver POS (Nature) o Crofter POS (Nature) o Cooper POS (Nature) o Wheelwright POS (Nature) o Millar Rd Reserve (Nature)
District D
o Banksia Reserve (Nature)
Planning Ratio
o 1:2,000 people o 1:1,000 people if taking into account likely physical barriers
Need From 2011 to 2031, an additional population of 42,294 is expected. It’s estimated that a minimum of 21 additional Neighbourhood Parks are likely to be required. Depending on physical barriers such as roads or natural features the final number will only be evident at the structure plan design stage and additional Neighbourhood Parks may be required to meet the requirement of achieving a park within 400 metres of most dwellings. Land area required
o 0.5 hectares each
9.2 Local Community Infrastructure
Community facilities provided at the Local level include local parks, local community centres and sports grounds.

Community Infrastructure Plan 2011 – 2031 (Revised 2015) – DRAFT FOR PUBLIC COMMENT
53
Local Parks Local Parks provide a well-designed play space with equipment and natural play opportunities for 0-12 year olds. They provide both active and passive elements to assist children and young people develop their physical, cognitive and social skills. Local Parks provides an environment for casual recreation, physical activity and relaxation for all age groups and also provide a focal point for community interaction and activity. Current Supply There are currently 28 Local Parks in the City of Kwinana and based on the 2014 population estimate of 36,145 and the planning ratio 1:5,000 people, there would seem to be an oversupply of Local Parks. However, when taking into account physical barriers and the existing quality of some parks, all Local Parks are required and the POS Upgrade Strategy has also highlighted the need to improve and upgrade the following parks highlighted with an asterisk. District A
Wandi o Bruny Park o Honeywood Park
District B
Bertram o Prince Regent Park * o Centennial Park o Moombaki Park o Price Parkway
District C
Wellard o Abingdon Park o Wellard Park o Pimlico Gardens o Maldon Park o Rushbrook Park o Gemstone Park o Henley Reserve (Nature) Leda o Djilba View POS o Whyatt Gardens * o Henley Reserve (Nature) o Wellard Southern Wetlands (Nature)
Community Infrastructure Plan 2011 – 2031 (Revised 2015) – DRAFT FOR PUBLIC COMMENT
54
Orelia o Sandringham Park o Hennessy Park o Varris Way Park *
Medina o Hewison Park o Apex Rotary Park o Harry McGuigan Park *
Calista o Harrison Way Park * o Rhodes Park
Parmelia o Skottowe Park o Sicklemore POS
Naval Base o Challenger Beach – with public toilet
District D Nil Planning Ratio
o 1:5,000 o 1:2,500 people if taking into account likely physical barriers
Need Between 2011 and 2031, an additional population of 42,294 is expected. It’s estimated that a minimum of 9 additional Local Parks are likely to be required. Depending on physical barriers such as roads or natural features that will only be evident at the structure plan design stage, additional Local Parks may be required to meet the requirement of achieving a park within 800 metres of most dwellings. Land area required
o 1.0 – 1.5 hectares each
Community Infrastructure Plan 2011 – 2031 (Revised 2015) – DRAFT FOR PUBLIC COMMENT
55
9.2.2 Local Sporting Grounds (with either a Community Sports Facility Building A or B, or, a Pavilion)
A Local Sporting Ground is a multipurpose sports and recreation facility incorporating a grass active playing space with training level lighting that can accommodate a wide variety of sports. A Local Sporting Ground is typically shared by a minimum of two clubs and includes one to two multipurpose hard courts and other facilities such as cricket practice nets depending on what sport is played. A Local Sporting Ground also provides for informal physical activity and passive recreation, such as jogging, walking, fitness programs and dog exercise and includes play equipment, seating, picnic table, BBQ, drinking fountain, toilets and shade at a minimum. A Local Sporting Ground can be one of the following:-
Local Sporting Ground with Community Sports Facility Building A (shared use) This refers to all of the above. The Community Facility Building will be developed alongside the playing field to provide toilets and some shade. Local Sporting Ground with Community Sports Facility Building B (shared use) This is all of the above but will be a shared facility with either a high school or primary school. The Community Facility Building will be developed to provide toilets, a small kiosk, storage and some shade. Local Sporting Ground with Pavilion All of the above, with the addition of a Pavilion, which incorporates change rooms for two teams, umpires change room, kitchen/kiosk, first aid room, public toilets, storage space and clubroom. The facility can also be used for other community uses, such as scouts, exercise classes and children’s holiday programs.
Current Supply There are currently four Local Sporting Grounds without a pavilion and one Local Sporting Ground with pavilion. While there is a sports ground in Wandi, it is not of a sufficient standard to enable sports to be played on due to the uneven surface. Based on the 2014 population estimate of 36,145, it would appear there is a shortage of one Local Sports Ground. However, taking into account that Orelia sports ground is a District level facility, this can also fulfil the function of a Local Sports Ground and therefore the current supply is considered adequate.
Community Infrastructure Plan 2011 – 2031 (Revised 2015) – DRAFT FOR PUBLIC COMMENT
56
District A o Nil
District B o Bertram Oval – without pavilion or public toilets
District C
o Rhodes Park – without pavilion, but with kiosk facilities and public toilets o Chisham Oval – without pavilion, but with toilets o Wellard Oval – with pavilion o Medina Oval – without pavilion, but with toilets
District D o Wandi Oval – poor quality surface
Planning Ratio
o 1:5,000 people Need Between 2011 and 2031, an additional population of 42,294 is expected and a further 8 Local Sporting Grounds will be required. There will be six new Local Sporting Grounds provided as joint use facilities within the three Districts, with either a Community Sports Facility Building A or B, or Pavilion as described above. In addition, two existing Local Sporting Grounds in Bertram and Wellard will gain a Community Sports Facility Building A thereby improving their use and practicality for the growing community. The recently completed pavilion at Thomas Oval / Kelly Park can also serve the function of a Local Sporting Ground for District C. It is further noted that the extension/upgrade of Medina Oval as a District Sporting Ground, will also provide Local Sporting Ground functions for District C. The extension/upgrade of Medina Oval will incorporate a shared use pavilion, tennis courts, hockey surface and bowling greens, and facilities for the existing community groups who have purpose built facilities on the site – Scouts, Girl Guides and Rotary. Land area required
o 4.6 hectares – Local Sporting Ground with Community Sports Facility Building A o 7.2 hectares – Local Sporting Ground with either Community Sports Facility Building B
or Pavilion

Community Infrastructure Plan 2011 – 2031 (Revised 2015) – DRAFT FOR PUBLIC COMMENT
57
9.2.3 Local Community Centre Local Community Centres (which can also be referred to as a Local Community House), provide a multipurpose community building to cater for a range of social, learning, personal development, health and lifestyle activities and programs. They incorporate a main hall area, activity area(s), meeting rooms, kitchen, wet activity areas, offices and storage spaces. Local Community Centres cater for all age groups and are a vital resource for creating and building a sense of community and supporting individuals and families. Local Community Centres are capable of accommodating multiple uses and activities at any one time and flexible spaces enable programs and activities to vary over time, depending on local community needs. This includes playgroups, afterschool care, health and fitness, leisure and learning programs, youth groups, seniors groups, counselling and self-help groups. They also incorporate outdoor spaces such as courtyard, childrens play ground, recreation area for young people and green space.
William Bertram Community Centre (located at the Bertram Neighbourhood Centre) A Local Community Centre Large Scale may be required to serve a larger catchment depending on the need. Such a centre may consist of more than one hall area, activity / meeting rooms, office or storage space or larger kitchens. This is detailed further in Appendix 2.

Community Infrastructure Plan 2011 – 2031 (Revised 2015) – DRAFT FOR PUBLIC COMMENT
58
Current Supply There are currently six Local Community Centres within the City of Kwinana and based on the 2014 population of 36,145, there is a current deficit of two Local Community Centres. This deficit is addressed however given the Darius Wells Library and Resource Centre, a Sub-Regional community centre, also fulfils the function of a local community centre for the surrounding area. Similarly, the John Wellard Community Centre is considerably larger than the average Local Community Centre and also fulfils the function of a Local Community Centre. District A
o Nil District B
o Bertram Community Centre District C
o Frank Konecny Family Centre o Medina Hall – with public toilets o Wellard Community Centre
District D
o Wandi Community Centre – including tennis courts, community hall, woodworking workshop, recreation hall, and , meeting rooms.
o Casuarina Wellard Community Centre Planning Ratio
o 1:5,000 people - Local Community Centre o 1:5,000 people or greater- Local Community Centre Large Scale
Need By 2031, a further seven Local Community Centres will be required. A new District Community Centre is to be provided in District B and this can also function as a Local Community Centre for the surrounding population. One Local Community Centre Large Scale is required for Wandi, local community centre required for Mandogalup, Casuarina, Wellard East and Wellard West. Land area required
o 0.5 hectares (Local Community Centre) o 0.7 hectares (Local Community Centre Large Scale)
Building area required
o 750m2

Community Infrastructure Plan 2011 – 2031 (Revised 2015) – DRAFT FOR PUBLIC COMMENT
59
9.3 District Community Infrastructure
Community facilities provided at the District level include community centres, sports grounds, libraries and recreation centres. 9.3.1 District Parks District parks provide higher level recreational and conservation spaces for the community. District parks may include destination parks, large scale wildflower reserves, walking trails, skate parks or dog parks. Current Supply The City has four district parks at present. District C
o Sloan’s Reserve o Wildflower Reserve o Peace Park o Chisham Square
9.3.2 District Sporting Ground A District Sporting Ground is a multipurpose sporting hub that is designed to have flexible capacity to cater for a diverse and changing range of field sports over time, while also integrating opportunities and infrastructure for passive recreation and physical activity. A District Sporting Ground also caters for competitive and social tennis, netball/basketball and lawn bowls. Current Supply The City of Kwinana has one District Sports Ground for field sports, with facilities for a variety of other sports located throughout the community . District C
o Orelia Oval - with pavilion o Kwinana Tennis Club – Calista o Kwinana Bowling Club – Medina o Kwinana Skate Park – Calista o Derbal Field BMX Club – Medina
Planning Ratio
o 1:25,000 people

Community Infrastructure Plan 2011 – 2031 (Revised 2015) – DRAFT FOR PUBLIC COMMENT
60
Need With a 2014 population of 36,145, one District Sports Ground is required to meet the needs of the current population. The additional population of 35,376 by 2031 will require additional District level Sporting Facilities, which ideally should be located towards the northern portion of District B, easily accessible to residents of District A whose population is no longer sufficient to justify a District level facility on its own. This facility will serve as a multi-district sporting facility as there won’t be an equivalent facility for residents of District A, either in District A or within the future communities to the north in Hammond Park. Because the land in Districts A and B is constrained, there are inherent difficulties in assembling sufficient land at this location to provide all facilities required for a comprehensive District Level Sporting hub in one co-located facility. This might typically be a large multi-district facility of 15-20 hectares with multiple sports grounds for football, soccer, cricket, athletics etc as well as hard courts and pavilion (typically comprising toilets/ showers, change rooms, umpires change room, first aid room, kitchen, bar, function room, clubroom area, kiosk and office space). It is therefore intended that a similar model of provision to District C is employed where the facilities provided at this location will essentially be multi purpose hard court based, and facilities for field sports and other recreational pursuits will be located throughout both Districts A and B provided through shared use agreements with the Department of Education and/or co-located with other facilities such as facilities for youth. In adopting this model of provision, it is necessary to plan for public toilets and other facilities such as kiosks and equipment storage space at district parks and sports grounds in each district catchment area. As the basis of the provision of ovals and facilities for field sports requires shared use agreements with the Department of Education, it is critical that joint planning processes for the design and delivery of these ovals and facilities is agreed upon with the Department. It is important that formal shared use agreements (such as Memorandums of Understandings) be achieved in this regard. Some shared agreements and design projects are already in place or underway and discussions about further shared use are ongoing. The smaller District Sporting Ground (serves Districts A & B) will include hard courts (10-12 tennis courts or netball/basketball courts, or 2 lawn bowl greens) depending on the sporting and club interests generated from the catchment, and a pavilion comprising of two main (3 shower/3 toilets) and two smaller (2 shower/2 toilets), change rooms, umpires change room, first aid room, kitchen, bar, function room, clubroom area, kiosk and office space. The facility would also incorporate outdoor spaces such as BBQ area, play ground, passive green areas, shade and seating and may form part of a green corridor and also provides for informal physical activity, such as jogging, walking and dog exercise and passive recreation.

Community Infrastructure Plan 2011 – 2031 (Revised 2015) – DRAFT FOR PUBLIC COMMENT
61
Land area required o District Sporting Ground (Orelia Oval) – 8.6 hectares o District Sporting Ground (serves Districts A & B) – 3 hectares
9.3.3 District Community Centre District Community Centres are large scale multipurpose community centres that cater for the higher order social and community needs generated from surrounding local catchments. They provide a diverse range of universal activities and programs, including performance space. District Community Centres can also provide the base for the delivery of community services, such as child health clinics and can also accommodate office space for community organisations involved in the delivery of services or programs at the District level, as well as visiting government services. A District Community Centre can also provide the facilities for adult day care and other specialised functions and may resource and provide outreach programs, activities and services to Local Community Centres. Current Supply While the 2014 population of 36,145 justifies the provision of a District Community Centre, there are no District Community Centres in the City of Kwinana. However, the Darius Wells Library and Resource Centre is a Sub-Regional centre that fulfils the function of a District Community Centre, hence current demand is met. Planning Ratio
o 1:25,000 people Need Between 2011 and 2031, with an additional population of 42,294, one new District Community Centre will be required and this should be located in District B. Land area required
o 0.7 - 1 hectare Building area required
o 1,000m2 9.3.4 District Youth Centre A District Youth Centre is a multipurpose community facility catering for young people (12-24 years) by providing a range of facilities, programs, services and activities that target their needs and interests.

Community Infrastructure Plan 2011 – 2031 (Revised 2015) – DRAFT FOR PUBLIC COMMENT
62
A District Youth Centre caters for both indoor and outdoor activities and provides a base for youth services and youth workers. It can also provide outreach programs and activities for young people at Local Community Centres. Current Supply The 2014 population of 36,145 justifies the provision of a District Youth Centre, and the Zone Youth Centre has been constructed within District C. Further District Youth Centres are required in Districts A and B. The Zone Youth Centre encompasses office space for youth organisations and visiting government services and programs. It can be expected to provide outreach services or programs to District Youth Centres given its central location within the Kwinana City Centre. Planning Ratio
o 1:3,000 10-19 year olds (1:25,000 people) Need Between 2011 and 2031, with an additional population of 42,294, a District Youth Centre will be required in District B. While the population of District A falls short of the District level catchment, a District Youth Centre will also be required in District A, given that the number of young people in new land releases areas is typically very high, District A is somewhat isolated and many young people do not have independent transport. Land area required
o 0.7 hectares Building area required
o 2,277m2 9.3.5 Branch Library Libraries provide a centre for learning, knowledge and access to information and ideas with a wide range of reference, fiction, non-fiction, children, young adult, large print, special genre and specialist collections. Libraries also provide public access to information and communication technology resources, they cater for community learning and development programs, and are community hubs in their own right.

Community Infrastructure Plan 2011 – 2031 (Revised 2015) – DRAFT FOR PUBLIC COMMENT
63
Darius Wells Library
Current Supply While the 2014 population of 36,245 justifies the provision of a Branch Library, this is provided for by the Sub-Regional Library, which is part of the Darius Wells Library and Resource Centre, hence current demand is met. Planning Ratio
o 1:35,000 people Need Between 2011 and 2031, with an additional population of 42,294, one Branch Library is required to serve District A and B and this should be located in the commercial centre of District A. Land area required
o 0.8 hectare Building area required
o 1,790m2

Community Infrastructure Plan 2011 – 2031 (Revised 2015) – DRAFT FOR PUBLIC COMMENT
64
9.3.6 Dry Recreation Centre Dry Recreation Centres provide a multipurpose indoor space for a wide variety of competitive and social sports, including basketball, netball, volleyball, badminton, indoor soccer, hockey and bowls. Dry Recreation Centres also cater for a range of fitness, health and recreational activities and can also provide a space for community and cultural events. They can also deliver fitness and recreation programs to other community facilities, such as Local Community Centres. Current Supply There is currently one Dry Recreation Centre in the City of Kwinana and based on the 2015 population of 36,145 this centre meets current demand. Planning Ratio
o 1:35,000 people Need Between 2011 and 2031, with an additional population of 42,294, one additional Dry Recreation Centre is required to serve District A and B and this should be located in the commercial centre of District A. Land area required
o 1.6 hectares Building area required
o 5,000m2
9.4 Sub-Regional Community Infrastructure
Community facilities provided at the Sub-Regional level include parks, community centres, libraries, sports grounds, recreation centres and aquatic centres. 9.4.1 Destination Park - Calista A Destination Park is a major Sub-Regional level park which may have one or two significant attractions, such as a theme park, water playground or skate park, or a collection of smaller elements. Serving a large catchment, a high standard and diverse range of playground infrastructure is provided for children, young people, adults of all ages and people of all abilities. A Destination Park incorporates an active grassed area, passive green spaces, picnic and BBQ areas, seating and shade. As a Sub-Regional park, a Destination Park caters for all age groups and abilities and brings people together from across the Districts. It also accommodates community and cultural events.
Community Infrastructure Plan 2011 – 2031 (Revised 2015) – DRAFT FOR PUBLIC COMMENT
65
Current Supply There are currently no Destination Parks in the City of Kwinana. However, one is proposed adjacent to the City Centre on the Calista Oval Site. Planning Ratio
o 1: 75,000 people Need Based on the 2014 population of 36,145, there is a growing need for one Destination Park. This will compensate for the absence of larger, formalised parks in the City of Kwinana. In saying that though it should be noted that the City is surrounded by significant areas of natural bushland to which the community has easy access. The Destination Park on Calista Oval is currently being planned, it will be required to cater for the 2031 population of 71,521 and will address this need. The skate park component of the park has reached the end of its economic life and needs immediate replacement. Land area required
o 6.7 hectares 9.4.2 Wells Beach Foreshore Upgrade (Park and Boating Facility) The Wells Beach Foreshore and boat launching ramp is a Sub-Regional community facility that provides the infrastructure for launching boats and supporting the use of the beach, swimming and other water activities, such as canoeing and fishing. The Boat Launch and Beach Park encompasses a boat ramp, jetty, toilets/showers, active and passive green spaces, large covered shelter, BBQ areas, picnic shelters and a diverse range of playground infrastructure, for both children and young people. Infrastructure is provided to a high standard as a Boat Launch Ramp and Beach Park serves a significant population across all Districts. Current Supply There is an existing boat ramp and beach facility at Wells Park, however this has no capacity to cater for anything other than local level use and is in a deteriorated condition. The proposed foreshore upgrade and redevelopment of the Wells Park area will address this requirement. Planning Ratio
o 1: 75,000 people

Community Infrastructure Plan 2011 – 2031 (Revised 2015) – DRAFT FOR PUBLIC COMMENT
66
Need Based on the 2014 population of 36,145, there is a current need for one Boat Launch Ramp and Beach Park. One sub-regional standard Boat Launch Ramp and Beach Park will be required to cater for the 2031 population of 71,521 and the redevelopment of the Wells Park Precinct will address this requirement. Land area required
o 9 hectares 9.4.3 Sub-Regional Sporting Ground (Thomas Oval/Kelly Park). A Sub-Regional Sporting Ground is a major sporting facility accommodating a high standard of sport for the respective codes played in the LGA catchment. A Sub-Regional Sporting Ground accommodates ‘A’ grade teams/clubs, league and pennant level sport organised by the respective State Sporting Associations and the standard of playing surfaces and supporting infrastructure is compatible with this level of sport. A Sub-Regional Sporting Ground typically includes six to eight sporting grounds, or could be a combination of one premier ground and three or four other quality training and competitive level grounds. A Sub-Regional Sporting Ground also incorporates a major Pavilion which encompasses change rooms, a number of clubrooms and associated facilities. A Sub-Regional Sporting Ground also incorporates outdoor spaces such as a terraced/mounded viewing area, large playground, passive green areas, shade, picnic tables, seating and BBQ area. A Sub-Regional Sporting Ground also provides a venue for major community events and festivals and may form part of a green corridor. Current Supply The City of Kwinana has one Sub-Regional Sporting Ground at Thomas Oval/Kelly Park. District C
o Kwinana Golf Course o Thomas Oval/Kelly Park.
District D
o Magenup Equestrian Centre . Need With an expected 2031 population 71,521, no further sub-regional sporting grounds will be required and a pavilion was constructed recently at the sporting ground. However, the existing hard court area of Thomas Oval requires upgrading, and the original pavilion will require extension and modernisation of the change rooms and kiosk and this is anticipated to take place in 2022-2024.

Community Infrastructure Plan 2011 – 2031 (Revised 2015) – DRAFT FOR PUBLIC COMMENT
67
Land area required o Not applicable (existing)
9.4.4 Community Knowledge and Resource Centre (Darius Wells Library and Resource
Centre)
A Community Knowledge and Resource Centre is a major sub - regional community facility with an integrated range of components that form a community hub, accommodating a wide range of services and programs. This centre encompasses a Sub-Regional Library and a Sub-Regional Community Centre and caters for the broad range of universal services required across all population groups. It may also accommodate targeted or specialist services and programs. The Library and Resource Centre also accommodates regional level community organisations and visiting government services and programs. It can be expected to provide outreach services or programs to District Community Centres.
Fun at Darius Wells Library and Resource Centre Current Supply The Darius Wells Library and Resource Centre was recently completed and is located in the Kwinana City Centre. Planning Ratio
o 1:75,000 people Need With an expected 2031 population of 71,521, no further Community Knowledge and Resource Centres will be required. Land area required
o Not applicable (existing)

Community Infrastructure Plan 2011 – 2031 (Revised 2015) – DRAFT FOR PUBLIC COMMENT
68
9.4.5 Sub-Regional Recreation and Aquatic Centre A Sub-Regional Recreation and Aquatic Centre is a multipurpose recreation, sporting and leisure facility that serves the population across all Districts and provides a high standard of facility. It caters for all ages and abilities A Sub-Regional Recreation and Aquatic Centre typically includes a 25m heated pool, leisure pool, hydrotherapy pool, spa, four indoor courts, fully equipped gym, activity rooms, crèche, meeting and office space, kitchen, function room and café. A Sub-Regional Recreation and Aquatic Centre caters for a diverse range of programs and activities such as swimming, water aerobics, hydrotherapy, indoor sports, exercise and fitness and may also provide specialist programs, such as pre-natal fitness. Current Supply The Sub-Regional Recreation and Aquatic Centre was built some years ago and has recently been upgraded to reflect a regional level facility. It is known as the Kwinana Recquatic. Planning Ratio
o 1:75,000 people Need With an expected 2031 population of 71,521 no further Sub-Regional Recreation and Aquatic Centre will be required. However, it is noted that the Hydrotherapy pool in the existing centre will need retiling in five years. This is not proposed to be funded through developer contributions. Land area required
o Not applicable (existing) 9.4.6 Arts and Cultural Centre (Upgrade) A Sub-Regional Arts Centre is a multipurpose community facility catering for the performing arts interests and skills development needs that arise from a Sub-Regional population and may include theatre, drama, dance, visual arts and music. A Sub-Regional Arts Centre typically includes a theatre with 200 - 400 seating capacity, smaller studio theatre, dance and rehearsal spaces, activity rooms, meeting rooms, function room, kitchen and bar area and outdoor performance areas. A Sub-Regional Arts Centre caters for live theatre and performances, major concerts and events and also provides a diverse range of arts and cultural activities and programs across all age groups and abilities.

Community Infrastructure Plan 2011 – 2031 (Revised 2015) – DRAFT FOR PUBLIC COMMENT
69
Current Supply There is currently one Sub-Regional Arts Centre in the City of Kwinana, the Koorliny Arts Centre which has the capacity to meet current demand. Planning Ratio
o 1: 100,000 Need With an expected 2031 population of 71,521 no further Sub-Regional Arts and Cultural Centre will be required. It is noted that a major refurbishment of the existing centre will be required in the next five years. This is not proposed to be funded through developer contributions. Land area required
o Not applicable (existing) 10 Community Infrastructure Plan 2011 – 2031
The following discussion about community facilities need and provision is broken down under each of the four districts and their respective DCA’s. This discussion should be considered with Figure 10 which provides spatial instruction as to the proposed locations of the facilities (where possible). In some instances, such as local parks, the final location of facilities will not be determined until the local structure planning and subdivision stage. For others, the locations shown on Figure 10 are indicative and require further detailed consideration.
10.1 District A
District A is located in the northern area of the City of Kwinana, on both the east and west side of the Kwinana Freeway. The area is largely semi-rural at present and includes those areas of Mandogalup, Wandi and Anketell that are within the Urban Growth Boundary. District A is made up of two Development Contribution Areas:
o DCA 8 Mandogalup o DCA 9 Wandi/Anketell North

Community Infrastructure Plan 2011 – 2031 (Revised 2015) – DRAFT FOR PUBLIC COMMENT
70
Figure 6 District A
10.1.1 Population District A population is set to grow to 12,129 people by 2031 and will make up approximately 18% of the City of Kwinana’s population at this time. While the current population of District A is small, most of this is located in DCA 9 and this area will continue to accommodate the larger share to 2031. The Jandakot District Structure Plan and Eastern Residential Intensification Concept plan envisaged a future population within Mandogalup of up to 6,000 people. However this projection was based largely on the consolidation and eventual closure of the ALCOA tailings dams and then a revision and reduction of the Air Quality Buffer associated with this industry. Indications from ALCOA and the State Government are that the tailings dams won’t be decommissioned within the timeframe previously planned for and therefore it is unlikely that the Mandogalup cell will achieve this residential population. Further, the recently released Perth and Peel @ 3.5 Million strategy, now subject to public review, identifies future industrial use for significant parts of the locality within 1 kilometre of the tailing dams. Therefore, the population projections for this plan have been revised to deal with the existing MRS Urban zoned land, which is outside of a 1.5km buffer to the tailings dams. If this situation changes within the 20 year period of this plan, these population projections will need to be reviewed. On this basis, DCA 8 Mandogalup will accommodate a 2031 population of 3,780 based on the existing MRS Urban zoned land.

Community Infrastructure Plan 2011 – 2031 (Revised 2015) – DRAFT FOR PUBLIC COMMENT
71
Table 10 District A - Population Projections
While District A has a 2031 population that is lower than the population threshold for District level facilities of 25,000 to 35,000, based on the Community Infrastructure Hierarchy outlined in Section 7, there is a strong rationale for recognising this area as a District. District A borders with the City of Cockburn and the growth suburbs of Aubin Grove and Hammond Park, each with a 2031 population forecast of 8,995 and 9,052 respectively. A sizable part of this population will be closer to the District Centre proposed in the Local Planning Strategy on Anketell Road in District A, than Cockburn Central in the City of Cockburn. The City of Kwinana is already servicing these areas, with demand for community facilities coming from both Aubin Grove and Hammond Park. This is likely to increase over time, especially with the low level of current and future community infrastructure that is proposed for this population in the City of Cockburn’s Plan for the District. 10.1.2 Neighbourhood Community Infrastructure Neighbourhood Parks DCA 8 Mandogalup will require a minimum of two Neighbourhood Parks and DCA 9 Wandi/Anketell North will require a minimum of four Neighbourhood Parks. However, further Neighbourhood Parks may well be required at the structure planning stage to achieve a Neighbourhood Park within a 400 metre radius of most dwellings, taking into account access barriers such as roads and major power lines.

Community Infrastructure Plan 2011 – 2031 (Revised 2015) – DRAFT FOR PUBLIC COMMENT
72
10.1.3 Local Community Infrastructure Local Community Centre There are no existing Local Community Centres in District A. The Mandogalup Community Centre is located within the locality of Mandogalup, close to the District boundary, and has a Fire Station, public toilets and tennis courts, but is not sufficient to fully serve the role of a Local Community Centre for the future population of DCA8 – Mandogalup. Therefore the population of DCA 8 Mandogalup will generate the requirement for one new Local Community Centre to be located within DCA8. In DCA 9 Wandi/Anketell North, one Local Community Centre will also be required, however this will need to be a large scale centre, given this centre will be required to serve a population of 8,349. This is also essential given this area is relatively isolated from any other community facilities and is also some distance from the Kwinana City Centre. Local Sporting Grounds There are currently no Local Sporting Grounds in District A. One Local Sporting Ground without a Pavilion, but with a public toilet and shade (Local Sporting Ground with Community Sports Facility Building A) will be required in DCA 8 Mandogalup. The population of DCA 9 will also generate the need for one Local Sporting Ground with a Pavilion and this is proposed adjoining the Wandi Primary School site. Further, a Local Sporting Ground with Community Sports Facility Building B is required to be situated adjoining the high school at Wandi. The Community Sports Facility Building will be developed to provide toilets, a small kiosk, storage and some shade. A Local Sporting Ground with Community Sports Facility Building A is required in Anketell North. Local Parks District A does not currently have any Local Parks and with the population growth, DCA 8 Mandogalup will require a minimum of one Local Park. DCA 9 Wandi/Anketell North has 2 local parks. Additional Local Parks are likely to be required at the structure planning stage to achieve an easily accessible Local Park within an 800 metre radius of most dwellings, without any significant barriers.

Community Infrastructure Plan 2011 – 2031 (Revised 2015) – DRAFT FOR PUBLIC COMMENT
73
10.1.4 District Community Infrastructure District Community Centre District A is expected to have a 2031 population 12,129 and therefore falls below the population threshold of 25,000 for a District Community Centre. However, a population of 12,129 is significant and this highlights the importance of a larger scale Local Community Centre (or House) to be provided in DCA 9 Wandi/Anketell North. The intent is that this Centre will be situated at the Anketell District Centre as shown on Figure 10. District Youth Centre While the population threshold that generates the need for a Youth Centre is 25,000, there is a requirement to provide a Youth Centre in District A. This reflects the fact that typically, there is a high population of young people in new residential areas and that young people have particular access difficulties, relying on walking, public transport and parents to get to community facilities and activities. A Youth Centre is also considered essential given the relative isolation of District A and the lack of any surrounding facilities, as well as the distance to the Kwinana City Centre. District Sporting Ground (serves Districts A & B) With a 2031 population of 12,129, a District Sporting Ground will not be required in District A and this highlights the importance of providing adequate local level sporting grounds and infrastructure. The combined population of Districts A and B of 36,588 does however justify the need for a multi District Sports Ground to be located in the northern portion of District B. This sports ground will be accessible for residents of District A and will cater for hard court based sports, with field sports being catered for through a combination of shared use agreements with the Education Department and other sporting grounds located throughout District A. This approach is detailed in Part 9.3 of this document, ‘District Community Infrastructure’. Branch Library (serves Districts A & B) The population threshold for a Branch Library is 35,000 and while the population of District A falls short of this, the combined population of District A and District B at 36,588 does generate the need for a Branch Library (serves Districts A & B) and this will be located in District A, DCA 9 Wandi/Anketell North. The intent is that this library will be situated at the Anketell District Centre as shown on Figure 10. Dry Recreation Centre (serves Districts A & B) The population threshold for a Dry Recreation Centre is also 35,000 and while the population of District A would not justify a Dry Recreation Centre, the combined population of District A and District B at 36,588 does generate the need for a Dry Recreation Centre. This will be provided in District A and the intent is that this Centre will be situated at the Anketell District Centre as shown on Figure 10.

Community Infrastructure Plan 2011 – 2031 (Revised 2015) – DRAFT FOR PUBLIC COMMENT
74
10.1.5 Sub-Regional Community Infrastructure While District A does not have a sufficient population to require the location of Sub-Regional community infrastructure within the area, the population of District A will account for approximately 18% of the demand for the following Sub-Regional community infrastructure.
o Community Knowledge and Resource Centre o Sub-Regional Sporting Ground (Thomas Oval / Kelly Park - extension/upgrade) o Destination Park - Calista o Wells Beach Foreshore Upgrade (Park and Boating Facility)
These items are included in the developer contribution scheme. 10.1.6 Other Community Infrastructure (not forming part of developer contributions) Separate to the above items,, the following items are also required at a City-wide or Sub-Regional level. These items do not form part of the developer contribution scheme.
o Arts and Cultural Centre (upgrade) o Works Depot o Animal Shelter o Civic Administration Building

Community Infrastructure Plan 2011 – 2031 (Revised 2015) – DRAFT FOR PUBLIC COMMENT
Commence design (For Local and District facilities this will occur once the population has reached 75% or more of the 2031 projected population) Estimated - Construction to be completed (3 years following commencing design)
Facilities that have been built as at June 2015
Table 11 District A - Community Infrastructure Plan 2011 - 2031
Local 2011 2012 2013 2014 2015 2016 2017 2018 2019 2020 2021 2022 2023 2024 2025 2026 2027 2028 2029 2030 2031
Local Community Centre - MandogalupLocal Sporting Ground with Community Sports Facility Building A (shared use) - MandogalupLocal Community Centre Large Scale - WandiLocal Sporting Ground with Community Sports Facility Building A - Anketell NorthLocal Sporting Ground with Pavilion - WandiLocal Sporting Ground with Community Sports Facility Building B (shared use) - WandiDistrict 2011 2012 2013 2014 2015 2016 2017 2018 2019 2020 2021 2022 2023 2024 2025 2026 2027 2028 2029 2030 2031
District A Youth CentreDry Recreation Centre (serves Districts A & B)Branch Library (serves Districts A & B)District Sporting Ground (serves Districts A & B)Sub Regional 2011 2012 2013 2014 2015 2016 2017 2018 2019 2020 2021 2022 2023 2024 2025 2026 2027 2028 2029 2030 2031
Destination Park - CalistaWells Beach Foreshore Upgrade (Park and Boating facility)
Stage 1
Stage 2
Stage 2
Stage 3
Stage 3
Stage 4
Stage 4
Sub-Regional Sporting Ground (Thomas Oval/ Kelly Park Extension/Upgrade)Community Knowledge & Resource Centre
Other Community Infrastructure 2011 2012 2013 2014 2015 2016 2017 2018 2019 2020 2021 2022 2023 2024 2025 2026 2027 2028 2029 2030 2031Arts and Cultural Centre UpgradeAnimal ShelterWorks Depot
Civic Administration BuildingStage
1Stage
1Stage
2Stage
2
Developer Contributions Infrastructure Items
Non-Developer Contributions Infrastructure Items
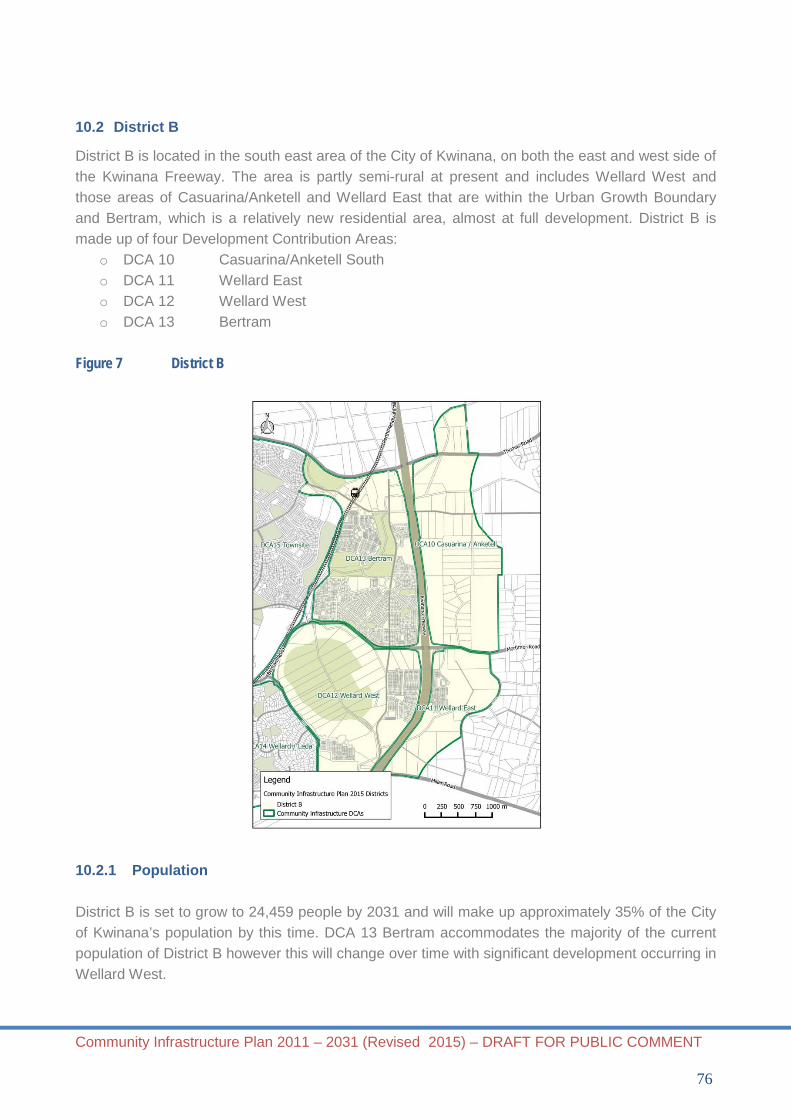
Community Infrastructure Plan 2011 – 2031 (Revised 2015) – DRAFT FOR PUBLIC COMMENT
76
10.2 District B
District B is located in the south east area of the City of Kwinana, on both the east and west side of the Kwinana Freeway. The area is partly semi-rural at present and includes Wellard West and those areas of Casuarina/Anketell and Wellard East that are within the Urban Growth Boundary and Bertram, which is a relatively new residential area, almost at full development. District B is made up of four Development Contribution Areas:
o DCA 10 Casuarina/Anketell South o DCA 11 Wellard East o DCA 12 Wellard West o DCA 13 Bertram
Figure 7 District B
10.2.1 Population District B is set to grow to 24,459 people by 2031 and will make up approximately 35% of the City of Kwinana’s population by this time. DCA 13 Bertram accommodates the majority of the current population of District B however this will change over time with significant development occurring in Wellard West.

Community Infrastructure Plan 2011 – 2031 (Revised 2015) – DRAFT FOR PUBLIC COMMENT
77
By 2031, DCA 12 Wellard West is expected to have the greatest population within the district of 8,043; DCA 10 Casuarina/Anketell South and DCA 13 Bertram are expected to each have populations in the vicinity of 6,500, with DCA 11 Wellard East having the smallest population at 3,318. The south eastern portion of DCA11 Wellard East is currently restricted from residential development due to the land being within an amenity buffer surrounding a livestock holding facility on Telephone Lane within the City of Rockingham. The effective quarantining of this land has reduced the projected population for DCA11 Wellard East from earlier projections of 3,964 in persons to 3,318 persons. With residential development in DCA 13 Bertram nearing completion, the next most significant area of development in District B will be in DCA 12 Wellard West. This will be followed by DCA 11 Wellard East and then DCA 10 Casuarina/Anketell South. Since the 2009 CIP, this district has experienced significant shifts in population with new growth areas emerging with MRS rezoning and other areas set for exclusion subject to constraints. Table 12 District B - Population Projections
10.2.2 Neighbourhood Community Infrastructure Neighbourhood Parks There are currently a total of fifteen Neighbourhood Parks located in District B with the majority in DCA 13 Bertram. This reflects the fact that Bertram is urban residential, with the remainder of District B largely semi-rural or in the process of being developed with emerging residential estates (such as Emerald Park, Providence and Sunrise).

Community Infrastructure Plan 2011 – 2031 (Revised 2015) – DRAFT FOR PUBLIC COMMENT
78
With the current number of Neighbourhood Parks in DCA 13 Bertram and with very little further growth expected in this area, DCA 13 will not require any additional Neighbourhood Parks. In DCA 10 Casuarina/Anketell South a minimum of three Neighbourhood Parks will be required. DCA 11 Wellard East and DCA 12 Wellard West will require a minimum of two and four Neighbourhood Parks respectively. However, further Neighbourhood Parks may well be required at the structure planning stage to achieve an easily accessible Neighbourhood Park within a 400 metre radius of most dwellings, without any significant barriers. 10.2.3 Local Community Infrastructure Local Community Centre There is one existing Local Community Centre in District B and this is located in DCA 13 Bertram. No further community centres will be required in this DCA. The population of DCA 10 Casuarina/Anketell South and DCA 11 Wellard East will both require one Local Community Centre each. DCA 12 Wellard West will also generate the need for a Local Community Centre and this is currently proposed to be provided as a combined community centre and sports pavilion, located on the south edge of DCA 12, which will also encompass a sports ground and is linked with the primary school at the site. While this is not considered ideal, particularly given the location, size and configuration of the site, there is no other adequate community purpose site within the Wellard West Local Structure Plan. The planning for the locality may change however with new urban land becoming available. At this stage, it is anticipated that these facilities would form part of a broader shared use arrangement with the Education Department and the City is currently in discussions with the department about such arrangements. Local Sporting Ground There is one existing Shared Use Local Sporting Ground in District B and this is located in DCA 13 Bertram. There is no Pavilion located on this Sporting Ground and there is a requirement to provide a Local Sporting Ground with Community Sports Facility Building A. No further Local Sport Grounds will be required in this DCA. DCA 10 Casuarina/Anketell South will generate the need for a Local Sporting Ground with a Pavilion and a Local Sporting Ground with Community Sports Facility Building B. Note that these facilities also provide for the need for multipurpose outdoor hard courts. However, given that a District Sports Ground (serving Districts A & B) will be located in DCA 10, this can also fulfil the function of a Local Sporting Ground with a Pavilion in terms of providing outdoor hard courts. , Hence, only the Local Sporting Ground with Community Sports Facility Building B will be required. This sporting ground should be located within the southern portion of DCA10 Casuarina/Anketell South (ideally co-located with the future high school) to also serve the population of DCA11 Wellard East. Whilst a Local Sporting Ground with Pavilion was originally planned for DCA11

Community Infrastructure Plan 2011 – 2031 (Revised 2015) – DRAFT FOR PUBLIC COMMENT
79
Wellard East, the reduced population and lack of a suitable site with sufficient land for a senior sized oval has resulted in this facility no longer being necessary, particularly with a Local Sporting Ground with Community Facility Building B being located in the adjoining area of DCA10 Casuarina/Anketell South. DCA 12 Wellard West will generate the need for a Local Sporting Ground with a Pavilion and this is to be provided with a combined sports pavilion and community centre located on the south edge of DCA 12 which will also encompass a sports ground and is linked with the primary school at the site. While this is not considered ideal, particularly given the location, size and configuration of the site, there is no other adequate community purpose site within the Wellard West Local Structure Plan. The planning for the locality may change however with new urban land becoming available. At this stage, it is anticipated that these facilities would form part of a broader shared use arrangement with the Education Department and the City is currently in discussions with the department about such arrangements. Local Park There is currently a total of six Local Parks located in District B. Of these four are in DCA 13 Bertram with one in Providence and one in Emerald Park in Wellard West. With the current number of Local Parks in DCA 13 Bertram and with very little further growth expected in this area, DCA 13 will not require any additional Local Parks. In DCA 10 Casuarina/Anketell South a minimum of one Local Park will be required. DCA 11 Wellard East and DCA 12 Wellard West will require a minimum of one and two Local Parks respectively. However, further Local Parks may well be required at the structure planning stage to achieve an easily accessible Local Park within an 800 metre radius of most dwellings, without any significant barriers. 10.2.4 District Community Infrastructure District Community Centre With a 2031 population of 24,459, District B will require a District Community Centre and this will be located in DCA 10 Casuarina/Anketell South. District Youth Centre The population of District B will generate the need for a District Youth Centre and this will also be located in DCA 10 Casuarina/Anketell South. District Sporting Ground (serves Districts A & B) A District Sporting Ground will be required to serve the populations of Districts A and B. This District Sporting Ground will be a multi district facility and should be located in the northern portion of DCA10 Casuarina/Anketell South. This sporting ground will cater for hard court based sports, with field sports being catered for through a combination of shared use agreements with the Education Department and other sporting grounds located throughout Districts A and B.

Community Infrastructure Plan 2011 – 2031 (Revised 2015) – DRAFT FOR PUBLIC COMMENT
80
This approach is detailed in Part 9.3 of this document, ‘District Community Infrastructure’. Branch Library (serves Districts A & B) The population threshold for a Branch Library is 35,000 and while the population of District B falls short of this, the combined population of District B and District A at 36,588 does generate the need for a Branch Library and this will be located in District A, DCA 9 Wandi/Anketell North at the Anketell District Centre as shown on Figure 10. Dry Recreation Centre (serves Districts A & B) The population threshold for a Dry Recreation Centre is also 35,000 and while the population of District B would not justify a Dry Recreation Centre, the combined population of District B and District A at 36,588 does generate the need for a Dry Recreation Centre. This will be provided in District A, DCA 9 Wandi/Anketell North at the Anketell District Centre as shown on Figure 10. 10.2.5 Sub-Regional Community Infrastructure While District B does not have a sufficient population to require the location of Sub-Regional community infrastructure within the area, the population of District B will account for approximately 36% of the demand for the following Sub-Regional community infrastructure.
o Community Knowledge and Resource Centre o Sub-Regional Sporting Ground (Thomas Oval / Kelly Park - extension/upgrade) o Destination Park - Calista o Wells Beach Foreshore Upgrade (Park and Boating Facility)
These items are included in the developer contribution scheme. 10.2.6 Other Community Infrastructure (not forming part of developer contributions) Separate to the above items, the following items are also required at a City-wide or Sub-Regional level. These items do not form part of the developer contribution scheme.
o Arts and Cultural Centre (Upgrade) o Works Depot o Animal Shelter o Civic Administration Building
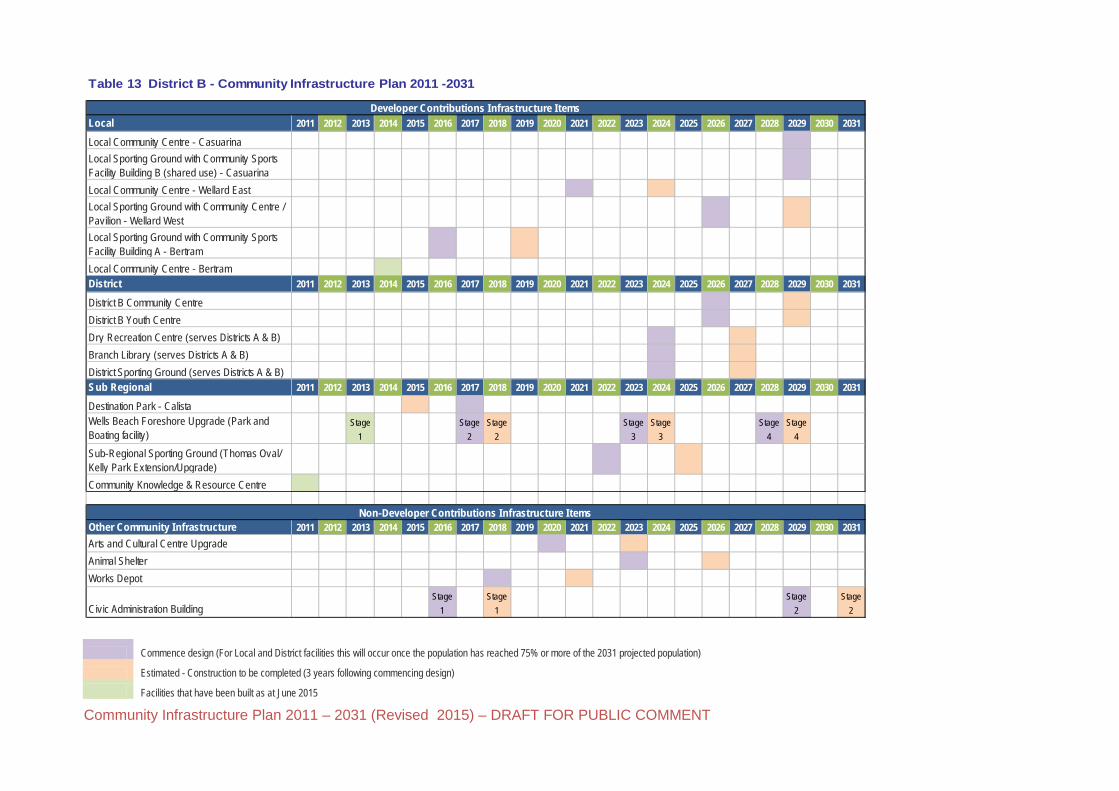
Community Infrastructure Plan 2011 – 2031 (Revised 2015) – DRAFT FOR PUBLIC COMMENT
Commence design (For Local and District facilities this will occur once the population has reached 75% or more of the 2031 projected population) Estimated - Construction to be completed (3 years following commencing design)
Facilities that have been built as at June 2015
Table 13 District B - Community Infrastructure Plan 2011 -2031
Local 2011 2012 2013 2014 2015 2016 2017 2018 2019 2020 2021 2022 2023 2024 2025 2026 2027 2028 2029 2030 2031
Local Community Centre - Casuarina Local Sporting Ground with Community Sports Facility Building B (shared use) - CasuarinaLocal Community Centre - Wellard EastLocal Sporting Ground with Community Centre / Pavilion - Wellard WestLocal Sporting Ground with Community Sports Facility Building A - BertramLocal Community Centre - BertramDistrict 2011 2012 2013 2014 2015 2016 2017 2018 2019 2020 2021 2022 2023 2024 2025 2026 2027 2028 2029 2030 2031
District B Community CentreDistrict B Youth CentreDry Recreation Centre (serves Districts A & B)Branch Library (serves Districts A & B)District Sporting Ground (serves Districts A & B)Sub Regional 2011 2012 2013 2014 2015 2016 2017 2018 2019 2020 2021 2022 2023 2024 2025 2026 2027 2028 2029 2030 2031
Destination Park - CalistaWells Beach Foreshore Upgrade (Park and Boating facility)
Stage 1
Stage 2
Stage 2
Stage 3
Stage 3
Stage 4
Stage 4
Sub-Regional Sporting Ground (Thomas Oval/ Kelly Park Extension/Upgrade)Community Knowledge & Resource Centre
Other Community Infrastructure 2011 2012 2013 2014 2015 2016 2017 2018 2019 2020 2021 2022 2023 2024 2025 2026 2027 2028 2029 2030 2031Arts and Cultural Centre UpgradeAnimal ShelterWorks Depot
Civic Administration BuildingStage
1Stage
1Stage
2Stage
2
Developer Contributions Infrastructure Items
Non-Developer Contributions Infrastructure Items

Community Infrastructure Plan 2011 – 2031 (Revised 2015) – DRAFT FOR PUBLIC COMMENT
82
10.3 District C
District C encompasses the City Centre and the established urban areas of Kwinana, namely, Leda, Medina, Orelia, Parmelia and Calista and also the new residential development of Wellard. District C is made up of two Development Contribution Areas: DCA 14 Wellard Leda DCA 15 Medina/Orelia/Parmelia/Calista/Town Centre Figure 8 District C
10.3.1 Population District C is set to grow to 32,000 people by 2031 and will make up approximately 46% of the City of Kwinana’s population at this time. The population growth of District C will occur as a result of both urban infill and new residential development. The population of DCA 15 Medina/Orelia/Parmelia/Calista/Town Centre is expected to increase from to 20,564 by 2031. For DCA 14 Wellard Leda, the population will almost reach an estimated 11,436 by 2031. .

Community Infrastructure Plan 2011 – 2031 (Revised 2015) – DRAFT FOR PUBLIC COMMENT
83
Table 14 District C - Population Projections
10.3.2 Neighbourhood Community Infrastructure Neighbourhood Parks There are currently a total of fifty-two Neighbourhood Parks located in District C with forty-one located in DCA 15 Medina/Orelia/Parmelia/Calista/Town Centre and eleven located in DCA 14 Wellard Leda. With fifty-two Neighbourhood Parks located in DCA 15 Medina/Orelia/Parmelia/Calista/Town Centre, this is considered sufficient to meet the needs of the additional infill population expected in this area. In DCA 14 Wellard Leda, with further new residential development, an additional minimum of three Neighbourhood Parks will be required. However, further Neighbourhood Parks may well be required at the structure planning stage to achieve an easily accessible Neighbourhood Park within a 400 metre radius of most dwellings, without any significant barriers. 10.3.3 Local Community Infrastructure Local Community Centre
There are three existing Local Community Centres in District C, with two centres located in DCA 15 Medina/Orelia/Parmelia/Calista/Town Centre, with the sub regional Community Knowledge and Resource Centre (the Darius Wells Building) also performing the function of a Local Community Centre for DCA 15. There is also a recently completed Local Community Centre - large scale in DCA 14 Wellard Leda.
John Wellard Local Community Centre

Community Infrastructure Plan 2011 – 2031 (Revised 2015) – DRAFT FOR PUBLIC COMMENT
84
With the existing community centres in DCA15 Medina/Orelia/Parmelia/Calista/Town Centre and given the community centre in DCA 14 Wellard Leda is a large scale Local Community Centre, no additional Local Community Centres will be required in District C. Local Sporting Ground There are three existing Local Sporting Grounds without a Pavilion in District C and these are all located in DCA 15 Medina/Orelia/Parmelia/Calista/Town Centre. With both the Sub-Regional and District Sports Grounds located in DCA 15, no further Local Sporting Grounds will be required in this area. DCA 14 Wellard Leda has one existing Local Sporting Ground with a Pavilion. An extension to the existing pavilion is necessary to provide additional storage space for sporting groups to cater for the volume of equipment required at this facility. In addition, a new Local Sporting Ground with Community Facility Building A will be required in this DCA. Both of these sites are indicated on Figure 10. Local Park There are currently a total of twenty-one Local Parks located in District C, with eleven located in DCA 14 Wellard Leda and eleven located in DCA 15 Medina/Orelia/Parmelia/Calista/City Centre. With eleven Local Parks and the Destination Park – Calista (a sub-regional park) located in DCA 15 Medina/Orelia/Parmelia/Calista/Town Centre, no further Local Parks are required to meet the additional infill population expected in this area. In DCA 14 Wellard Leda, with further new residential development, an additional Local Park will be required. However, further Local Parks may well be required at the structure planning stage to achieve an easily accessible Neighbourhood Park within a 800 metre radius of most dwellings, without any significant barriers. 10.3.4 District Community Infrastructure District Community Centre With a 2031 population of 32,000, District C does require a District Community Centre, however with the sub-regional Community Knowledge and Resource Centre (Darius Wells) located in District C, this centre can fulfil the function of a District Community Centre.
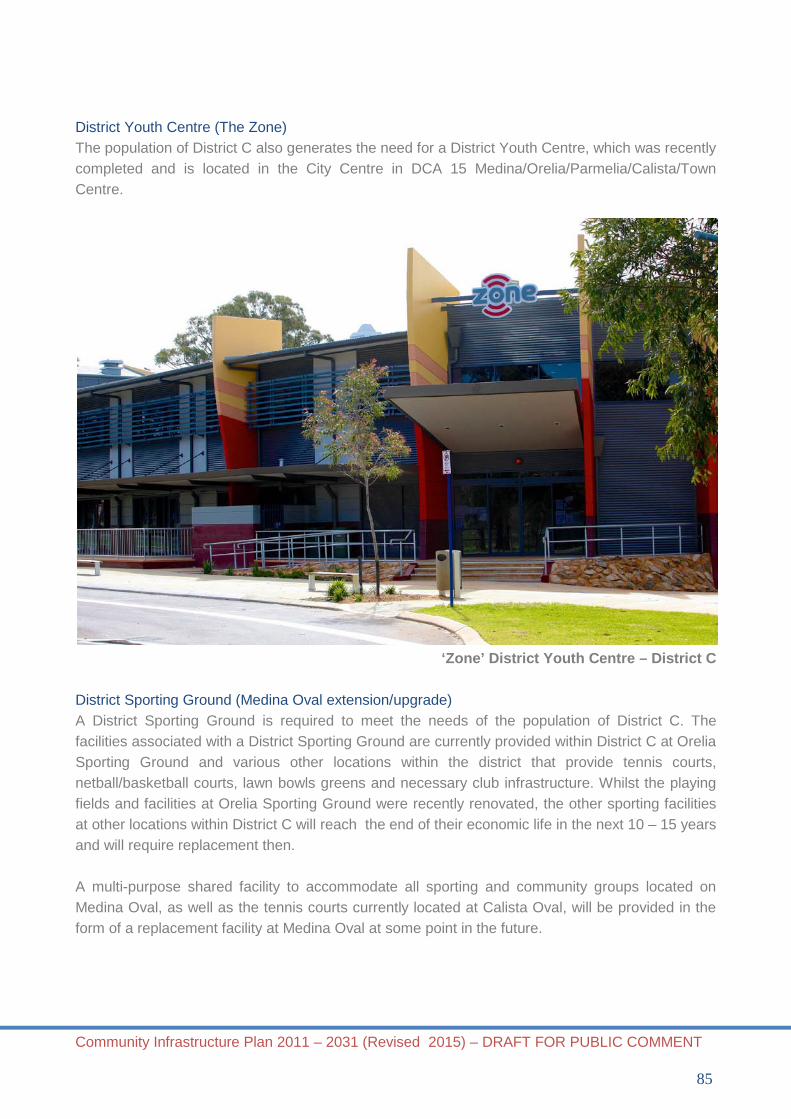
Community Infrastructure Plan 2011 – 2031 (Revised 2015) – DRAFT FOR PUBLIC COMMENT
85
District Youth Centre (The Zone) The population of District C also generates the need for a District Youth Centre, which was recently completed and is located in the City Centre in DCA 15 Medina/Orelia/Parmelia/Calista/Town Centre.
‘Zone’ District Youth Centre – District C
District Sporting Ground (Medina Oval extension/upgrade) A District Sporting Ground is required to meet the needs of the population of District C. The facilities associated with a District Sporting Ground are currently provided within District C at Orelia Sporting Ground and various other locations within the district that provide tennis courts, netball/basketball courts, lawn bowls greens and necessary club infrastructure. Whilst the playing fields and facilities at Orelia Sporting Ground were recently renovated, the other sporting facilities at other locations within District C will reach the end of their economic life in the next 10 – 15 years and will require replacement then. A multi-purpose shared facility to accommodate all sporting and community groups located on Medina Oval, as well as the tennis courts currently located at Calista Oval, will be provided in the form of a replacement facility at Medina Oval at some point in the future.

Community Infrastructure Plan 2011 – 2031 (Revised 2015) – DRAFT FOR PUBLIC COMMENT
86
Branch Library The population of District C generates the need for a Branch Library but the library within the Community Knowledge and Resource Centre (Darius Wells) fulfils the function of a district level library (Branch Library) for the surrounding district population. Dry Recreation Centre The population of District C also requires the provision of a Dry Recreation Centre and with the sub-regional Recreation Centre provided as part of the Recquatic Centre, this fulfils the function of a district level Dry Recreation Centre for the surrounding district population. 10.3.5 Sub-Regional Community Infrastructure While District C does not have a sufficient population to require the location of sub-regional community infrastructure within the area, the population of District C does account for approximately 46% of the demand for the following sub-regional community infrastructure. As the Kwinana City Centre is located in District C, all sub-regional community infrastructure is located in this area.
o Community Knowledge and Resource Centre o Sub-Regional Sporting Ground (Thomas Oval / Kelly Park - extension/upgrade) o Destination Park - Calista o Wells Beach Foreshore Upgrade (Park and Boating Facility)
These items are included in the developer contribution scheme. 10.3.6 Other Community Infrastructure (not forming part of developer contributions) Separate to the above items, the following items are also required at a City-wide or Sub-Regional level. These items do not form part of the developer contribution scheme.
o Arts and Cultural Centre (upgrade) o Works Depot o Animal Shelter o Civic Administration Building
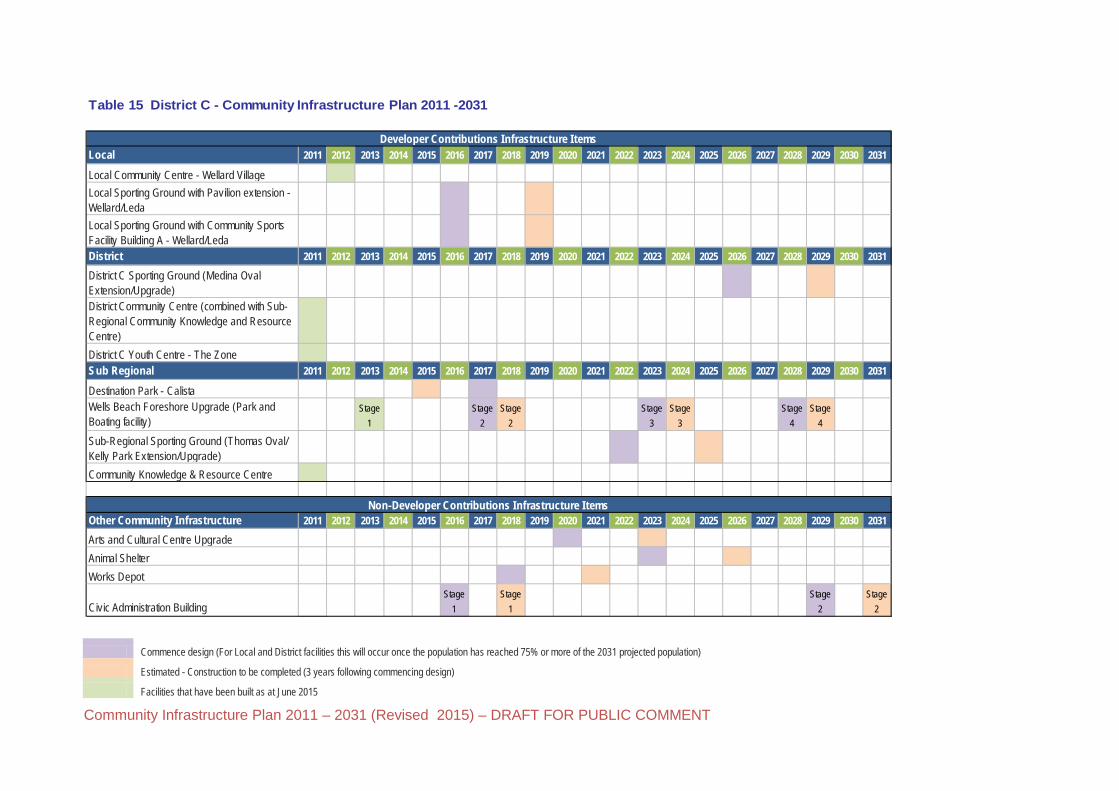
Community Infrastructure Plan 2011 – 2031 (Revised 2015) – DRAFT FOR PUBLIC COMMENT
Commence design (For Local and District facilities this will occur once the population has reached 75% or more of the 2031 projected population) Estimated - Construction to be completed (3 years following commencing design)
Facilities that have been built as at June 2015
Table 15 District C - Community Infrastructure Plan 2011 -2031
Local 2011 2012 2013 2014 2015 2016 2017 2018 2019 2020 2021 2022 2023 2024 2025 2026 2027 2028 2029 2030 2031
Local Community Centre - Wellard VillageLocal Sporting Ground with Pavilion extension - Wellard/LedaLocal Sporting Ground with Community Sports Facility Building A - Wellard/LedaDistrict 2011 2012 2013 2014 2015 2016 2017 2018 2019 2020 2021 2022 2023 2024 2025 2026 2027 2028 2029 2030 2031
District C Sporting Ground (Medina Oval Extension/Upgrade)District Community Centre (combined with Sub-Regional Community Knowledge and Resource Centre)District C Youth Centre - The ZoneSub Regional 2011 2012 2013 2014 2015 2016 2017 2018 2019 2020 2021 2022 2023 2024 2025 2026 2027 2028 2029 2030 2031
Destination Park - CalistaWells Beach Foreshore Upgrade (Park and Boating facility)
Stage 1
Stage 2
Stage 2
Stage 3
Stage 3
Stage 4
Stage 4
Sub-Regional Sporting Ground (Thomas Oval/ Kelly Park Extension/Upgrade)Community Knowledge & Resource Centre
Other Community Infrastructure 2011 2012 2013 2014 2015 2016 2017 2018 2019 2020 2021 2022 2023 2024 2025 2026 2027 2028 2029 2030 2031
Arts and Cultural Centre UpgradeAnimal ShelterWorks Depot
Civic Administration BuildingStage
1Stage
1Stage
2Stage
2
Developer Contributions Infrastructure Items
Non-Developer Contributions Infrastructure Items

Community Infrastructure Plan 2011 – 2031 (Revised 2015) – DRAFT FOR PUBLIC COMMENT
88
10.4 District D
District D encompasses the remaining balance of Kwinana zoned as rural. The rural area includes: o Wandi o Casuarina o Wellard
Figure 9 District D
10.4.1 Casuarina Wellard Currently, this centre has a Fire Station, Community Hall, small oval and outdoor courts. Upgrade of the hall is not required within the current 20 year Financial Plan. Further analysis of use of sporting facilities and need for upgrades to the sporting facilities is required. It is anticipated that population expansions within the Casuarina Cell will increase use of these and upgrades may be needed. 10.4.2 Wandi This Centre is a unique with a strong community presence. The Wandi Community Centre consists of the Wandi Hall, old school rooms from Hope Valley, tennis courts and clubrooms, woodworking and storage shed and oval, all managed by the Wandi Progress Association. Co-located with the

Community Infrastructure Plan 2011 – 2031 (Revised 2015) – DRAFT FOR PUBLIC COMMENT
89
Wandi Community Centre is the Magenup Equestrian Centre and Magenup Lakes Regional Walk Trail. Due to the activity hub nature of the facility, its central location and rural setting, the centre attracts a number of different user groups unique to this area as well as people from much further afield than the Wandi area. Recreation activities that take place at the centre include:
o Woodwork clubs o Medieval clubs o Landcare/Environmental groups o Dog and cat clubs o Caravan clubs o Playgroups o Dance groups
As a sub-regional facility the centre is readily accessed by state and peak bodies drawing in people from outside of the area:
o WA Carvers Guild o Scroll Saw Club of WA o Woodturners Association of WA o Marquetry Society of WA o Fine Woodwork Association of WA o Peel Cycling Club
The centre also is used for sporting purposes:
o Boxing o Equestrian o Tennis o Football o Cycling
10.4.3 Sub-Regional Community Infrastructure District D does not have a sufficient population to require the location of Sub-Regional community infrastructure within the area. 10.4.4 Other Community Infrastructure (not forming part of developer contributions) The following items are required at a City-wide or Sub-Regional level. These items do not form part of the developer contribution scheme.
o Arts and Cultural Centre (upgrade) o Works Depot o Animal Shelter o Civic Administration Building
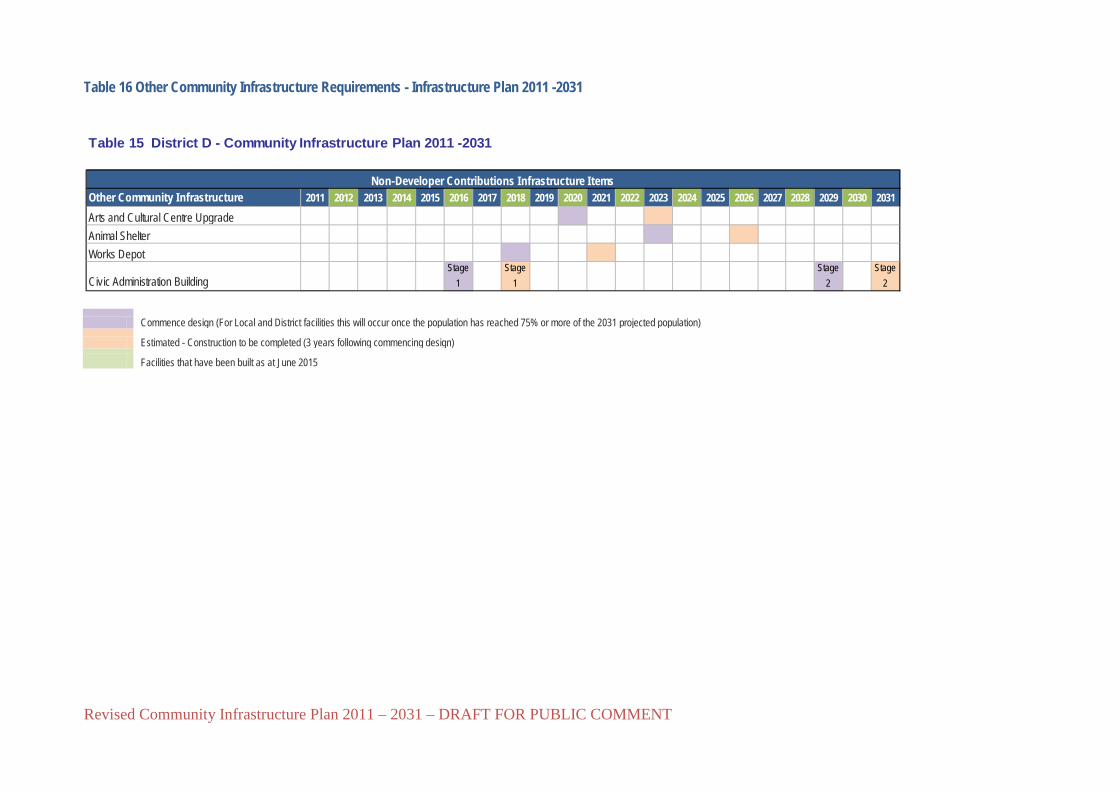
Revised Community Infrastructure Plan 2011 – 2031 – DRAFT FOR PUBLIC COMMENT
Table 16 Other Community Infrastructure Requirements - Infrastructure Plan 2011 -2031
Commence design (For Local and District facilities this will occur once the population has reached 75% or more of the 2031 projected population) Estimated - Construction to be completed (3 years following commencing design)
Facilities that have been built as at June 2015
Table 15 District D - Community Infrastructure Plan 2011 -2031
Other Community Infrastructure 2011 2012 2013 2014 2015 2016 2017 2018 2019 2020 2021 2022 2023 2024 2025 2026 2027 2028 2029 2030 2031
Arts and Cultural Centre UpgradeAnimal ShelterWorks Depot
Civic Administration BuildingStage
1Stage
1Stage
2Stage
2
Non-Developer Contributions Infrastructure Items

Revised Community Infrastructure Plan 2011 – 2031 – DRAFT FOR PUBLIC COMMENT 91
Figure 10 Community Infrastructure Plan