community health needs assessment - wellspan health€¦ · a community health needs assessment ......
TRANSCRIPT

Community Health Needs Assessment Lancaster County, Pennsylvania
April 2016
Secondary Data Analysis and Prioritized Health Needs Produced on behalf of:

2 PRODUCED BY HEALTHY COMM UNITIE S IN STITUTE, N OVEMBE R 2015 WWW.HEALTHYCOM MUN ITIES.COM
Table of Contents
Introduction 3
2016 Community Health Needs Data 3 About Healthy Communities Institute 3
Demographics 4
Population 4 Economy 7 Education 9
Identifying Significant Community Health Needs: Methodology 10
Secondary Data 10
Significant Community Health Needs Assessment Findings 13
Geographical Areas of Highest Need 13 Health Needs Findings 15
Engagement of Community Stakeholders 20
Community Health Stakeholder Forum 20 Community Health Stakeholder Survey 20
Prioritized Health Needs 21
Criteria for Selecting Community Health Priorities 21 Mental Health 22 Obesity 23 Substance Abuse 25
Potential Community Resources Available to Address these Priorities 27
Appendix A: Secondary Data Analysis 28
Scoring Method 28 Disparities 29 Population Impact 31 Scoring Results and Population Impact 32
Appendix B: Data Sources 42
Appendix C: Community Health Stakeholder Engagement 43
Community Health Stakeholder Forum: Participating Organizations 43 Expert Input 44 Community Health Stakeholder Survey 61

3 PRODUCED BY HEALTHY COMM UNITIE S IN STITUTE, N OVEMBE R 2015 WWW.HEALTHYCOM MUN ITIES.COM
Introduction A Community Health Needs Assessment (CHNA) was first conducted in the early 1990’s in partnership with the United Way of Lancaster County. This Needs Assessment was followed by a subsequent CHNA conducted in 1996, which served as the foundation for a Healthy Communities initiative and the establishment of a community collaborative known as the Lancaster Health Improvement Partnership (now known as the LiveWELL Lancaster County Coalition). LiveWELL is a public/private partnership of stakeholders representing diverse organizations, groups, and businesses. This collaborative assists LG Health/Penn Medicine and WellSpan Ephrata Community Hospital in the facilitation of the CHNA, as well as the establishment of a data driven process that is the foundation for decision making in setting health priorities. LiveWELL coordinated Lancaster County’s 2013 CHNA and participated in the development of the Community Health Improvement Plans (CHIP) for each hospital organization. The 2013 CHNA, as well as the Community Health Improvement Plans & Updates for each organization can be found on their respective websites. No written comments were received on the aforementioned CHNA and CHIP documents.
2016 Community Health Needs Data Lancaster General Health/Penn Medicine (including Lancaster General Hospital, Women & Babies Hospital, and the Lancaster Rehabilitation Hospital) and WellSpan Ephrata Community Hospital commissioned the Healthy Communities Institute to assist with their 2016 Community Health Needs Assessment by completing a secondary data analysis of the data for Lancaster County, PA. Lancaster County is the primary service area for the four hospitals representing both organizations.
About Healthy Communities Institute The Healthy Communities Institute (HCI) offers a web-based dashboard system that allows data to be easily visualized and comprehended by its users. This allows community stakeholders to understand the variety of data, and to be able to take concrete action and improve target areas of interest. HCI has over 100 implementations of its dashboard for clients in more than 35 states. The HCI mission is to improve the health, environmental sustainability, and economic vitality of cities, counties, and communities worldwide. The company is rooted in work started in 2002 in concert with the Healthy Cities Movement at the University of California at Berkeley. HCI staff are experts in managing and presenting data with extensive experience in data visualization and data mapping. To learn more about Healthy Communities Institute, please visit www.HealthyCommunitiesInstitute.com.
4 PRODUCED BY HEALTHY COMM UNITIE S IN STITUTE, N OVEMBE R 2015 WWW.HEALTHYCOM MUN ITIES.COM
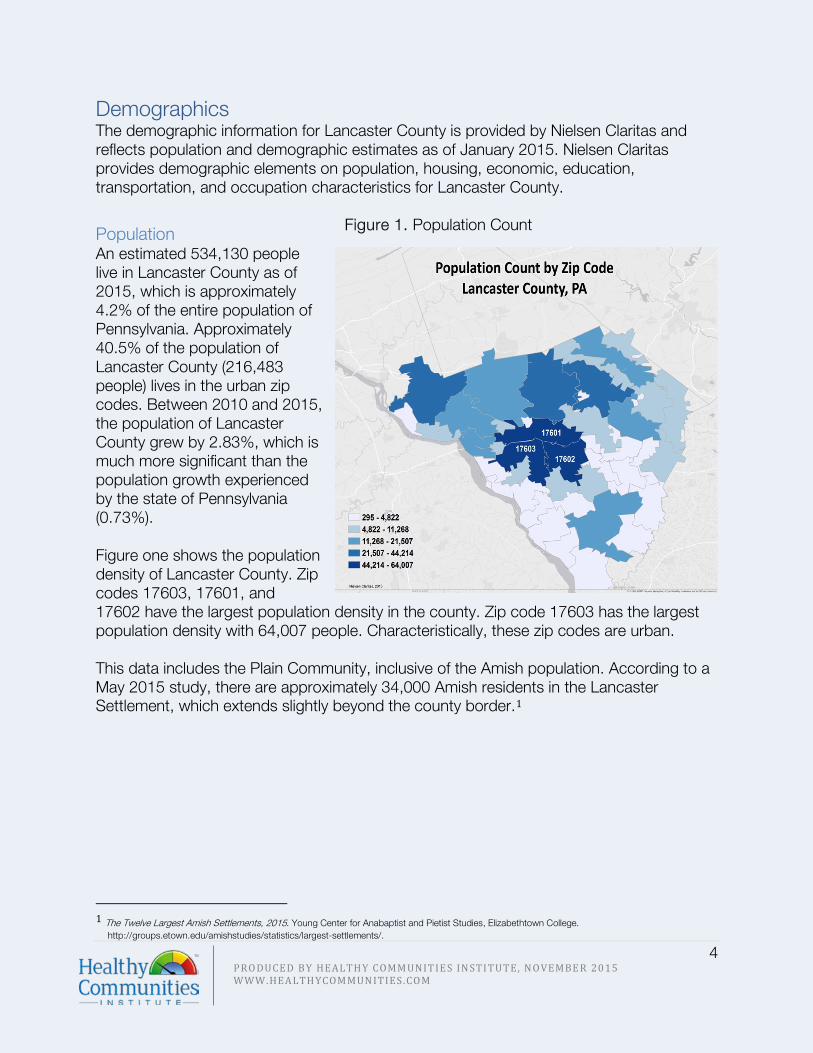
Demographics The demographic information for Lancaster County is provided by Nielsen Claritas and reflects population and demographic estimates as of January 2015. Nielsen Claritas provides demographic elements on population, housing, economic, education, transportation, and occupation characteristics for Lancaster County.
Population An estimated 534,130 people live in Lancaster County as of 2015, which is approximately 4.2% of the entire population of Pennsylvania. Approximately 40.5% of the population of Lancaster County (216,483 people) lives in the urban zip codes. Between 2010 and 2015, the population of Lancaster County grew by 2.83%, which is much more significant than the population growth experienced by the state of Pennsylvania (0.73%). Figure one shows the population density of Lancaster County. Zip codes 17603, 17601, and 17602 have the largest population density in the county. Zip code 17603 has the largest population density with 64,007 people. Characteristically, these zip codes are urban. This data includes the Plain Community, inclusive of the Amish population. According to a May 2015 study, there are approximately 34,000 Amish residents in the Lancaster Settlement, which extends slightly beyond the county border.1
1 The Twelve Largest Amish Settlements, 2015. Young Center for Anabaptist and Pietist Studies, Elizabethtown College.
http://groups.etown.edu/amishstudies/statistics/largest-settlements/.
Figure 1. Population Count
5 PRODUCED BY HEALTHY COMM UNITIE S IN STITUTE, N OVEMBE R 2015 WWW.HEALTHYCOM MUN ITIES.COM
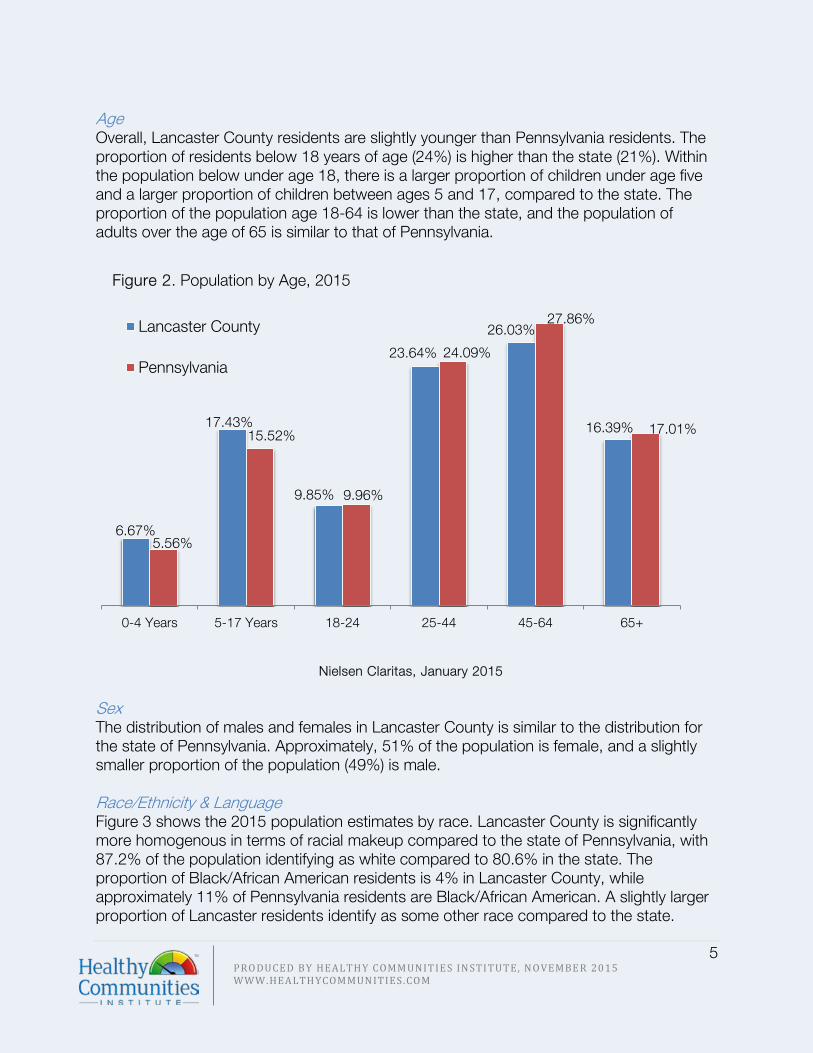
Age Overall, Lancaster County residents are slightly younger than Pennsylvania residents. The proportion of residents below 18 years of age (24%) is higher than the state (21%). Within the population below under age 18, there is a larger proportion of children under age five and a larger proportion of children between ages 5 and 17, compared to the state. The proportion of the population age 18-64 is lower than the state, and the population of adults over the age of 65 is similar to that of Pennsylvania.
Sex The distribution of males and females in Lancaster County is similar to the distribution for the state of Pennsylvania. Approximately, 51% of the population is female, and a slightly smaller proportion of the population (49%) is male. Race/Ethnicity & Language Figure 3 shows the 2015 population estimates by race. Lancaster County is significantly more homogenous in terms of racial makeup compared to the state of Pennsylvania, with 87.2% of the population identifying as white compared to 80.6% in the state. The proportion of Black/African American residents is 4% in Lancaster County, while approximately 11% of Pennsylvania residents are Black/African American. A slightly larger proportion of Lancaster residents identify as some other race compared to the state.
Figure 2. Population by Age, 2015
6.67%
17.43%
9.85%
23.64%
26.03%
16.39%
5.56%
15.52%
9.96%
24.09%
27.86%
17.01%
0-4 Years 5-17 Years 18-24 25-44 45-64 65+
Nielsen Claritas, January 2015
Lancaster County
Pennsylvania

6 PRODUCED BY HEALTHY COMM UNITIE S IN STITUTE, N OVEMBE R 2015 WWW.HEALTHYCOM MUN ITIES.COM
Lancaster County has a larger proportion of residents who identify as Hispanic, approximately 10% of the population, compared to the state (7%), as illustrated in Figure 4.
Figure 3. Population by Race, Lancaster County and Pennsylvania
Neilsen Claritas, 2015
Lancaster County
10%
90%
7%
93%
Hispanic/Latino Non-Hispanic/Latino
Figure 4. Population by Ethnicity, Lancaster County and Pennsylvania
Lancaster County Pennsylvania
Neilsen Claritas, 2015
87%
4%0% 2%
4% 3%
White
Black/African American
American Indian/AlaskaNativeAsian
Some Other Race
2+ Races
81%
11%0% 3% 3% 2%
Pennsylvania
7 PRODUCED BY HEALTHY COMM UNITIE S IN STITUTE, N OVEMBE R 2015 WWW.HEALTHYCOM MUN ITIES.COM
Economy
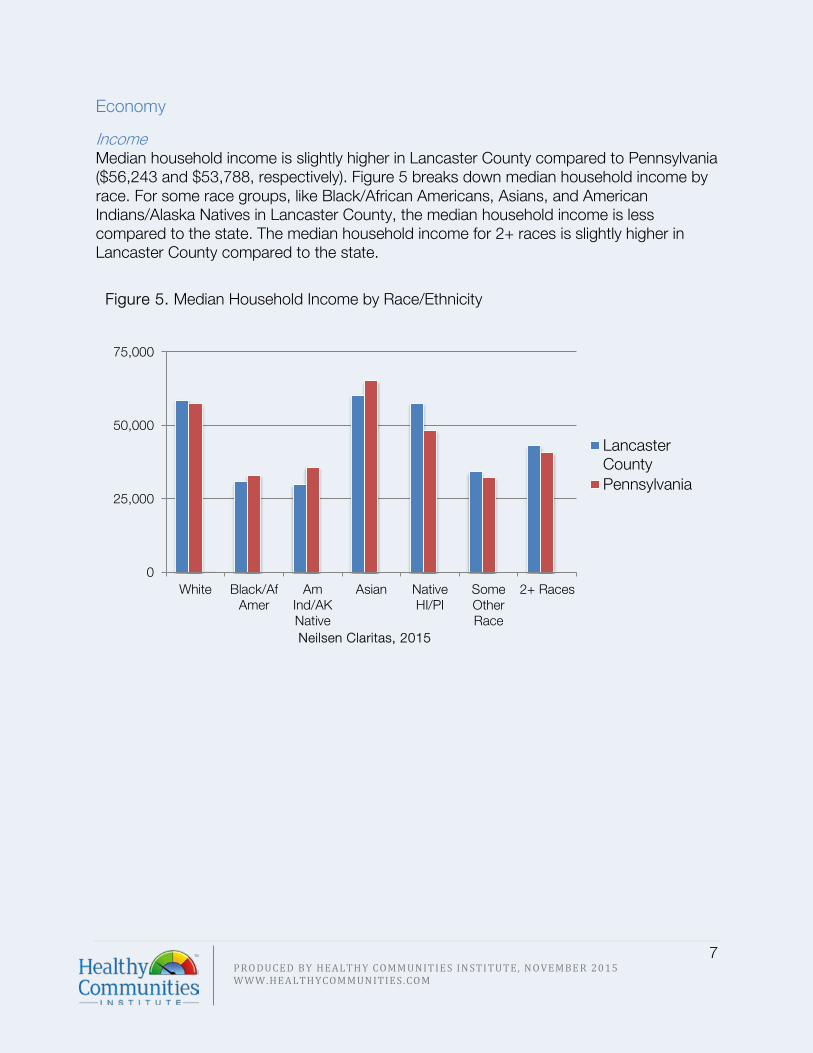
Income Median household income is slightly higher in Lancaster County compared to Pennsylvania ($56,243 and $53,788, respectively). Figure 5 breaks down median household income by race. For some race groups, like Black/African Americans, Asians, and American Indians/Alaska Natives in Lancaster County, the median household income is less compared to the state. The median household income for 2+ races is slightly higher in Lancaster County compared to the state.
0
25,000
50,000
75,000
White Black/AfAmer
AmInd/AKNative
Asian NativeHI/PI
SomeOtherRace
2+ Races
LancasterCountyPennsylvania
Figure 5. Median Household Income by Race/Ethnicity
Neilsen Claritas, 2015

8 PRODUCED BY HEALTHY COMM UNITIE S IN STITUTE, N OVEMBE R 2015 WWW.HEALTHYCOM MUN ITIES.COM
Poverty According to the 2009-2013 American Community Survey, 10.5% of Lancaster County residents live below the federal poverty level. As of January 2015, 7.96% of Lancaster County families are living below the federal poverty level. This is a slightly smaller proportion of families living in poverty compared to the state of Pennsylvania. Similarly, a smaller proportion of Lancaster County families with dependent children under age 18 are living in poverty, compared to the state. Table 1. Poverty Indicators, Nielsen Claritas, 2015 Lancaster Pennsylvania Families Below Poverty 11,116 (7.96%) 312,594 (9.48%) Families Below Poverty with Children 8,616 (6.17%) 237,602 (7.20%)
The map in Figure 6 shows the percent of families living below poverty level by zip code, with the darkest shaded zip codes having the highest proportion of families living below poverty level. Zip codes 17512, 17603, 17602, 17518, and 17563 have between 11.46% and 16.05% of families living below poverty level. Zip codes 17518 and 17563 are characteristically more rural.
Employment Table 2 shows the unemployment statistics for Lancaster County as they compare to Pennsylvania. Lancaster County has an unemployment rate of 7.22% of the civilian labor force over age 16. Compared to Lancaster County, Pennsylvania has a higher unemployment rate at 9.04% as of January 2015. Both females and males in Lancaster County have lower unemployment rates compared to the state, and within Lancaster County, females have lower rates than males. Similar to the state of Pennsylvania, the top three industries of employment are manufacturing, healthcare, and retail trade.
Table 2. Unemployment, Nielsen Claritas, 2015 Lancaster Pennsylvania % Unemployed 7.22% 9.04% % Unemployed (Male) 7.35% 9.67%
% Unemployed (Female) 7.06% 8.34%
Figure 6. Families Living Below Poverty Level

9 PRODUCED BY HEALTHY COMM UNITIE S IN STITUTE, N OVEMBE R 2015 WWW.HEALTHYCOM MUN ITIES.COM
Education Compared to the state, Lancaster County has a larger proportion of residents 25 and older without a high school degree, approximately 16% compared to 11%. Lancaster also has a smaller proportion of residents 25 and older with a bachelor’s degree or higher. Figure 7 shows the educational attainment breakdown for Lancaster and Pennsylvania. Figure 7. Population by Educational Attainment, Lancaster County and Pennsylvania
Figure 8 shows Lancaster County zip codes and education attainment. The darker shaded zip codes indicate a higher proportion of the population age 25 and older that attended some high school, but did not get their diploma. The zip codes with the darkest shading are areas geographically considered rural and generally have a high concentration of Plain residents, which likely influences the education attainment in these geographic areas.
15.94% 11.21%
53.60%53.47%
6.47%7.75%
23.99% 27.57%
0.00%
25.00%
50.00%
75.00%
100.00%
125.00%
Lancaster County Pennsylvania
Bachelor's or Higher
Associate's Degree
High SchoolDiploma/SomeCollegeLess than HighSchool
Figure 8. Education Attainment
Neilsen Claritas, 2015

10 PRODUCED BY HEALTHY COMM UNITIE S IN STITUTE, N OVEMBE R 2015 WWW.HEALTHYCOM MUN ITIES.COM
Identifying Significant Community Health Needs: Methodology Significant community health needs for Lancaster County have been identified using multiple methodologies for analyzing and presenting secondary data.
Secondary Data
Overview Secondary data used for this assessment was collected and analyzed with the Community Dashboard, a web-based community health data platform developed by Healthy Communities Institute and sponsored by Lancaster General Health/Penn Medicine and WellSpan Ephrata Community Hospital. The Community Dashboard brings non-biased data, local resources and a wealth of information to one accessible, user-friendly location. It includes a comprehensive dashboard of over 100 community indicators covering over 20 topics in the areas of health, determinants of health, and quality of life. The data is primarily derived from state and national public secondary data sources. The value for each of these indicators is compared to other communities, nationally or locally set targets, and to previous time periods. HCI’s Data Scoring Tool was used to systematically summarize multiple comparisons across the Community Dashboard in order to rank indicators based on highest need. For each indicator, the community value was compared to a distribution of Pennsylvania and US Counties, state and national values, and Healthy People 2020 targets. Indicators were also compared across four time periods to identify trends. Lancaster County was assigned a score for each comparison. These comparison scores range from 0-3, where 0 indicates the best outcome and 3 the worst. Availability of each type of comparison varies by indicator and is dependent upon the data source, comparability with data collected for other communities, and changes in methodology over time. These indicators were grouped into topic areas for a higher level ranking of community health needs. More detailed methodology used by the Data Scoring Tool is described in Appendix A: Secondary Data Analysis.

11 PRODUCED BY HEALTHY COMM UNITIE S IN STITUTE, N OVEMBE R 2015 WWW.HEALTHYCOM MUN ITIES.COM
Please note that the most recent period of measure was used for all secondary data presented in this report (as publicly available on October 15, 2015).
Table 3. Quality of Life and Health Topic Areas Quality of Life Health
Economy Education Environment Public Safety Social Environment Transportation
Access to Health services Cancer Children’s Health Diabetes Exercise, Nutrition & Weight Environmental & Occupational Family Planning Food Safety Heart Disease & Stroke Immunization & Infectious Diseases Maternal, Fetal & Infant Health Men’s Health
Mental Health & Mental Disorders Older Adults & Aging Oral Health Other Chronic Diseases Prevention & Safety Respiratory Diseases Substance Abuse Teen & Adolescent Health Women’s Health Wellness & Lifestyle
Indicators were categorized into 29 topic areas, which were further classified as a quality of life or health topic.
Figure 9. HCI Data Scoring Overview

12 PRODUCED BY HEALTHY COMM UNITIE S IN STITUTE, N OVEMBE R 2015 WWW.HEALTHYCOM MUN ITIES.COM
Analyzing Disparities Outside of the topic area scoring, a separate analysis was conducted to determine if disparities exist among sub-populations within Lancaster County. If age, gender, or race/ethnicity specific values were available, the indicator was evaluated for the presence of substantial disparities. For details on the methods used to analyze disparities, please see Appendix A: Secondary Data Analysis.
Identifying Geographic Areas of Highest Need The SocioNeeds Index – developed by Healthy Communities Institute and available on both the Lancaster General Health/Penn Medicine and WellSpan Ephrata Community Hospital data platform – is a tool used to help determine which communities of Lancaster County are in most need of services and interventions. The index summarizes multiple socioeconomic indicators, ranging from poverty to education, which may impact health or access to care. All zip codes in the United States are given an index value from 0 (low need) to 100 (high need). Within Lancaster County, zip codes are ranked based on their own index value. These ranks are used to identify relative level of need within the county.
Identifying Population Impacted Understanding the population impacted by a health topic or a particular health indicator can illustrate the true social and economic effect of a health problem in a community. A separate analysis was conducted to determine the estimated population impact. For each health indicator, the most recent period of measure on the Community Dashboard was used with the 2015 Nielsen Claritas population denominators to determine an estimate of the population impacted by the health problem.
13 PRODUCED BY HEALTHY COMM UNITIE S IN STITUTE, N OVEMBE R 2015 WWW.HEALTHYCOM MUN ITIES.COM
Significant Community Health Needs Assessment Findings
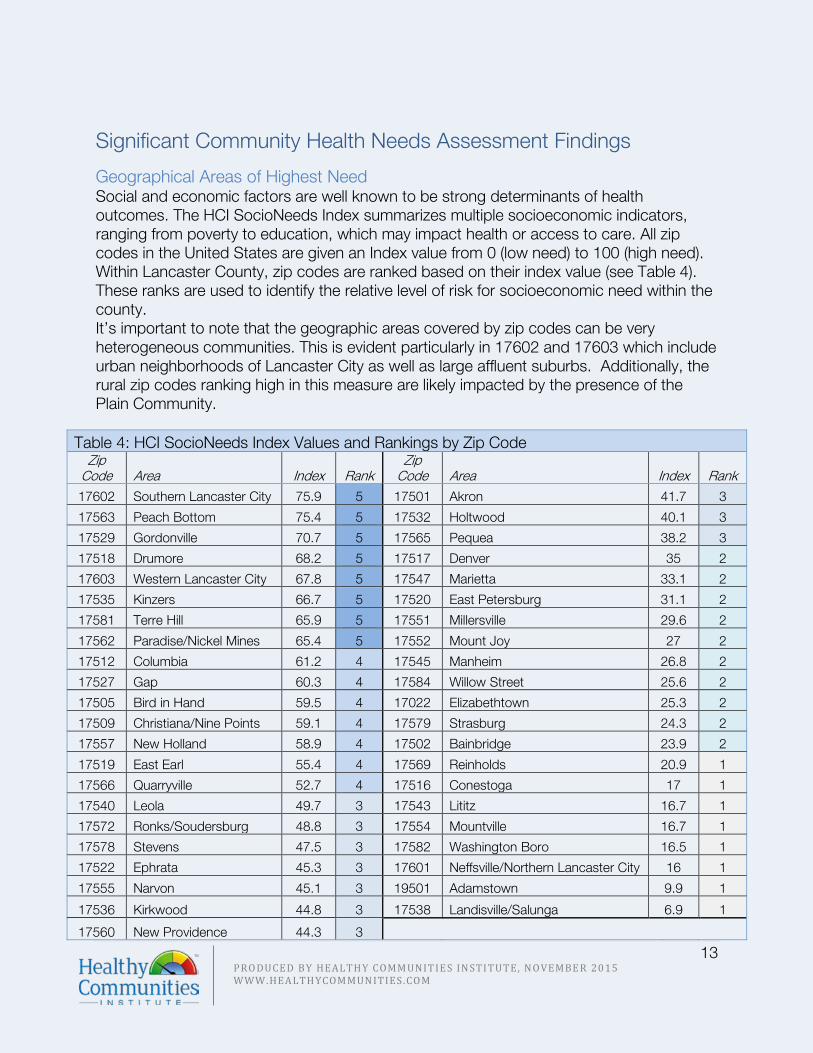
Geographical Areas of Highest Need Social and economic factors are well known to be strong determinants of health outcomes. The HCI SocioNeeds Index summarizes multiple socioeconomic indicators, ranging from poverty to education, which may impact health or access to care. All zip codes in the United States are given an Index value from 0 (low need) to 100 (high need). Within Lancaster County, zip codes are ranked based on their index value (see Table 4). These ranks are used to identify the relative level of risk for socioeconomic need within the county. It’s important to note that the geographic areas covered by zip codes can be very heterogeneous communities. This is evident particularly in 17602 and 17603 which include urban neighborhoods of Lancaster City as well as large affluent suburbs. Additionally, the rural zip codes ranking high in this measure are likely impacted by the presence of the Plain Community.
Table 4: HCI SocioNeeds Index Values and Rankings by Zip Code Zip
Code Area Index Rank Zip
Code Area Index Rank 17602 Southern Lancaster City 75.9 5 17501 Akron 41.7 3
17563 Peach Bottom 75.4 5 17532 Holtwood 40.1 3
17529 Gordonville 70.7 5 17565 Pequea 38.2 3
17518 Drumore 68.2 5 17517 Denver 35 2
17603 Western Lancaster City 67.8 5 17547 Marietta 33.1 2
17535 Kinzers 66.7 5 17520 East Petersburg 31.1 2
17581 Terre Hill 65.9 5 17551 Millersville 29.6 2
17562 Paradise/Nickel Mines 65.4 5 17552 Mount Joy 27 2
17512 Columbia 61.2 4 17545 Manheim 26.8 2
17527 Gap 60.3 4 17584 Willow Street 25.6 2
17505 Bird in Hand 59.5 4 17022 Elizabethtown 25.3 2
17509 Christiana/Nine Points 59.1 4 17579 Strasburg 24.3 2
17557 New Holland 58.9 4 17502 Bainbridge 23.9 2
17519 East Earl 55.4 4 17569 Reinholds 20.9 1
17566 Quarryville 52.7 4 17516 Conestoga 17 1
17540 Leola 49.7 3 17543 Lititz 16.7 1
17572 Ronks/Soudersburg 48.8 3 17554 Mountville 16.7 1
17578 Stevens 47.5 3 17582 Washington Boro 16.5 1
17522 Ephrata 45.3 3 17601 Neffsville/Northern Lancaster City 16 1
17555 Narvon 45.1 3 19501 Adamstown 9.9 1
17536 Kirkwood 44.8 3 17538 Landisville/Salunga 6.9 1
17560 New Providence 44.3 3

14 PRODUCED BY HEALTHY COMM UNITIE S IN STITUTE, N OVEMBE R 2015 WWW.HEALTHYCOM MUN ITIES.COM
Figure 10 displays Lancaster County zip codes based on socioeconomic need. Zip codes of the darkest shade (with zip codes listed) represent geographic areas at risk for greater socioeconomic need. As illustrated in Table 4, zip codes 17602, 17563, and 17529 are the top three areas within Lancaster County likely to be at risk for poor health outcomes based on the Index value.
Figure 10. Lancaster County HCI SocioNeeds Index

15 PRODUCED BY HEALTHY COMM UNITIE S IN STITUTE, N OVEMBE R 2015 WWW.HEALTHYCOM MUN ITIES.COM
Health Needs Findings Table five summarizes the findings of the secondary data analysis by topic area, where topics are sorted by secondary data summary score range. The table also identifies health topics with a high disparity score by category (race or gender). The table includes topic areas for both health and quality of life. All quality of life indicators have been marked by an asterisk. A detailed description of the topic areas and existing disparities can be found in Appendix A, Table 10. Table 5. Summary of Secondary Data Scores and Disparities
Score Topic Area High Disparity
> 1.5
Other Chronic Diseases Access to Health Services
Older Adults & Aging Race Mental Health & Mental Disorders Gender
Heart Disease & Stroke Gender Environment*
1.25-1.5
Transportation Race Education*
Environmental & Occupational Health Children’s Health
Exercise, Nutrition & Weight Women’s Health
<1.25
Public Safety* Gender Substance Abuse
Teen & Adolescent Health Prevention & Safety Gender
Economy* Race Maternal, Fetal & Infant Health
Cancer Gender Respiratory Diseases
Diabetes Social Environment* Race
Immunizations and Infectious Diseases Gender Men’s Health
No Score
Family Planning Food Safety Oral Health Gender
Wellness & Lifestyle

16 PRODUCED BY HEALTHY COMM UNITIE S IN STITUTE, N OVEMBE R 2015 WWW.HEALTHYCOM MUN ITIES.COM
Disparities Table 5 includes the results from the disparity analysis. Indicators were analyzed for a disparity if demographic breakout data was available. It should be noted that the analysis was only possible for indicators where demographic breakout data is available, and a disparity may exist where there are gaps in the data. Among the poorer performing health topics, a race disparity exists within the health topic of Older Adults and Aging. People over age 65 who identify as Black/African American, Asian, American Indian/Alaska Native, and two or more races are more likely to live below poverty level, compared to white older adults. Gender disparities exist within the health topics Mental Health & Mental Disorders and Heart Disease & Stroke. Males have a disproportionately high death rate due to suicide and death rate due to coronary heart disease, compared to women. It is important to note that disparities between gender and race are also present among well performing health and quality of life topics for Lancaster County.
Population Impact Appendix A includes a comprehensive listing of the population impacted estimates for all available indicators from the Community Dashboard. Both quality of life and health indicators were estimated for population impacted. From the data scoring analysis, Access to Health Services was one of Lancaster’s poorer performing health topics. Adults with health insurance and children with health insurance are two indicators within the health topic of Access to Health Services. From the population impacted analysis it is estimated that approximately 19,560 children do not have health insurance, and 47,679 adults do not have health insurance. Out of the 534,000 residents of Lancaster County, that is almost 70,000 residents without health insurance. Individuals without insurance are often times more likely to utilize emergency services, and can be a greater health risk to other community members. On the other hand, Teen and Adolescent Health was one of the better performing health topics in Lancaster County. Taking a closer look at the indicators that make up that health topic would show that the indicator, adolescents who have felt sad or depressed in the past year, impacts approximately 18,000 adolescents in Lancaster County each year. Population impacted can be useful for identifying the approximate number of individuals negatively impacted by health or quality of life issues. In some instances the data score does not reflect the estimated population negatively impacted, as they do not illustrate similar measures. For example, some indicators specific to the Medicare population, like Cancer: Medicare population, have very high data scores (2.44) but only impact approximately 8,000 Lancaster Residents. Whereas, the indicator, Child Insecurity Rate has a well performing data score of 0.67, but negatively impacts approximately 24,000

17 PRODUCED BY HEALTHY COMM UNITIE S IN STITUTE, N OVEMBE R 2015 WWW.HEALTHYCOM MUN ITIES.COM
Lancaster children. However the data scores and the estimated population impacted can be used in conjunction for a more comprehensive understanding of community health in Lancaster County. Figure 11 illustrates the indicators that impact an estimated ten percent or more of Lancaster County residents. The red bars represent poor performing indicators with a data score of greater than 1.5 and the green bars represent well performing indicators with a data score of less than 1.25. Gray bars represent indicators that could not be scored using the Data Scoring Tool, primarily due to a change in methodology for the CDC Behavioral Risk Factor Surveillance System, limiting available trend data.
Several of the indicators impacting greater than ten percent of the County population are directly related to poverty. According to the disparities analysis, poverty related
Figure 11. Population Impact

18 PRODUCED BY HEALTHY COMM UNITIE S IN STITUTE, N OVEMBE R 2015 WWW.HEALTHYCOM MUN ITIES.COM
racial/ethnic disparities exist for indicators that comprise the topic areas of Older Adults and Aging, Economy, and Social Environment (see Appendix A, Table 10 for more detail). Table 6 illustrates indicators that are estimated to impact less than ten percent of Lancaster County residents, but perform poorly on the Data Scoring Tool with a score greater than 1.5.
Of these poor performing indicators, Workers Commuting by Public Transportation was the only one to also exhibit a measurable disparity. White, Asian, and Native Hawaiian/Pacific Islander populations are less likely to commute by public transportation. As noted previously, disparity analysis was only possible for indicators where demographic breakout data is available, and a disparity may exist where there are gaps in the data.
Table 6. Poor Performing Indictors Impacting less than 10% of the Population

19 PRODUCED BY HEALTHY COMM UNITIE S IN STITUTE, N OVEMBE R 2015 WWW.HEALTHYCOM MUN ITIES.COM
United Way Community Conversations In addition to secondary data collected by state and national organizations, LiveWELL looked to community partner the United Way of Lancaster County as a source of information collected directly from community members. As part of the Community Conversations forum program, conducted July 2014 to February 2015, 206 business leaders, community leaders, and residents came together to discuss their localized community aspirations, the barriers perceived in achieving them, and the ways and means to achieve them. Three of the four questions from the Community Conversations forum were included in the CHNA (listed below). The top reoccurring themes from resident responses were as follows:
1. What kind of community do you want? • No sense of community, people not friendly • Knowing how to help the community • Education: quality schools, programs and activities for kids • Discrimination, prejudice • Crime, drugs, violence, lack of police • Economy, personal finances, cost of living, unemployment
2. What are the barriers that prevent you from having the community you want?
• Discrimination, prejudice • Economy, personal finances, cost of living, unemployment • Poverty, homelessness, lack of funding to help • No sense of community, people not friendly • Knowing how to help the community
3. What are kinds of things that can be done that would make a difference?
• Knowing how to help the community • No sense of community, people not friendly • Education: quality schools, programs and activities for kids • Healthcare, insurance • Lack of motivation, personal responsibility

20 PRODUCED BY HEALTHY COMM UNITIE S IN STITUTE, N OVEMBE R 2015 WWW.HEALTHYCOM MUN ITIES.COM
Engagement of Community Stakeholders
Community Health Stakeholder Forum On December 16, 2015, LiveWELL, Lancaster General Health/Penn Medicine, and WellSpan Ephrata Community Hospital hosted a Community Health Stakeholder Forum to engage community leaders representing vulnerable populations in Lancaster County. A total of 53 people attended the event; a listing of attendees can be found in Appendix C. The Forum consisted of a review of the secondary data analysis contained in this CHNA and a Rapid Gaps and Assets Analysis. Attendees worked in table groups to identify gaps and assets for the following health related needs:
• Obesity • Mental Health • Tobacco Use • Access to Care
• Substance Abuse • Asthma • Poverty • Other topics not listed
Three reoccurring themes emerged from the gaps analysis:
• Access: to primary care/behavioral health, insurance, substance abuse treatment, healthy foods, affordable housing
• Diversity: (lack of) among providers, disparities between groups, cultural and linguistic acknowledgement and acceptance
• Poverty: impact across all health needs A full listing of Gaps and Assets Analysis results is in Appendix C.
Community Health Stakeholder Survey A follow-up survey was sent to all Forum attendees as well as registered non-attendees. The survey was available for completion from December 16-31, 2015. A total of 26 responses were obtained. A copy of the survey can be found in Appendix C. Top Needs Identified by Participants:
1. 87% Mental Health 2. 65% Obesity 3. 57% Substance Abuse
Top Contributors to Poor Health Outcomes:
1. Having access to health services and the quality of those services
2. Discrimination and social support 3. Being able to get and keep a job 4. How much education a person
obtains 5. How much money a person earns
Top Contributors that the hospitals in Lancaster County could affect the most:
1. Having access to health services and the quality of those services
2. Discrimination and social support 3. Housing status 4. Early childhood development 5. Public safety

21 PRODUCED BY HEALTHY COMM UNITIE S IN STITUTE, N OVEMBE R 2015 WWW.HEALTHYCOM MUN ITIES.COM
Prioritized Health Needs
Criteria for Selecting Community Health Priorities Engaged stakeholders and Community Health leadership from both health systems used the following criteria for determining health priorities.
• Scope of the Problem o Large percentage of the population affected? o Is this number escalating? o Is the problem in Lancaster greater than in the region, PA, or nationally?
• Seriousness of the Problem o Are there significant consequences of not addressing the issue? o Is the problem getting worse? o Is the problem a cause of other problems?
• Ability to Impact Locally o How likely is it that we will be able to change this statistic? o Do we have the resources and focus locally to address this issue and make
an impact? o Is the issue out of our control?
The group of community health stakeholders prioritized the following three significant health needs for Lancaster County:
• Mental Health • Obesity • Substance Abuse
The following sections will discuss the highlights of the secondary data findings for these three prioritized areas. Each prioritized health need includes a table that shows the list of indicators considered. The table includes the Lancaster County value, the Pennsylvania state value, the estimated population impacted, and comparison scores for each indicator. The comparison colors and scores illustrate how Lancaster County is fairing compared to the following six comparisons: the Pennsylvania State Value, Pennsylvania Counties Value, US Value, US Counties Value, HP2020 if a target is available, and the time trend score. A comparison in the green received a score of 0 (great), yellow a score of 1 (good), orange a score of 2 (fair) and red a score of 3 (poor). Additionally, significant disparities are identified and described. Further details on the secondary data methods, findings, and available resources can be found in the appendices.

22 PRODUCED BY HEALTHY COMM UNITIE S IN STITUTE, N OVEMBE R 2015 WWW.HEALTHYCOM MUN ITIES.COM
Mental Health Mental Health’s Poorest Performing Indicator and Disparities:
• Depression amongst the Medicare population ranks in the worst quartile among US Counties – 14.8% of the Medicare population (approximately 12,960 Medicare beneficiaries over age 65) report having diagnosed depression. The trend indicates this proportion is increasing over time.
• Lancaster County males have a disproportionately higher age-adjusted death rate due to suicide compared to Lancaster County females.
Mental Health ranked as one of the poorest performing health topics for Lancaster County, with a health topic score of 1.69. Lancaster County has a higher rate of depression and Alzheimer’s disease or Dementia amongst the Medicare population when compared across Pennsylvania counties and the Pennsylvania state value. Additionally, mental health indicators specific to the Medicare population rank in the worst quartile when compared to US counties and the US value. It is estimated that almost 13,000 adults over age 65 in the Medicare population suffer from depression, and similarly just over 10,000 suffering from either Alzheimer’s or Dementia. Upon initial examination, Lancaster County mental health indicators for the general adult population perform similar to or better than the state of Pennsylvania. However, the estimated population impact offers a different perspective. It is estimated that 31.6% of Lancaster County adolescents felt depressed or sad during the prior year, which equates to approximately 18,000 adolescents. Additionally, it is estimated that nearly 140,000 adults report having one or more poor mental health days in the past month. Table 7. Mental Health Indicators
Indicator Lancaster Value
PA Value Estimated Population
Impact
PA Counties
PA State Value
US Counties
US Value
HP 2020
Trend
Depression: Medicare Population (2012)
14.8% 13.4% 12,960 2 2 3 3 3
Alzheimer's Disease or Dementia: Medicare Population (2012)
11.8% 12.2% 10,333 3 2 3 2 1
Adolescents who Felt Depressed or Sad: Past Year (2013)
31.6% 31.7% 18,246 1
Age-Adjusted Death Rate due to Suicide (2011)
11.6 deaths/ 100,000
pop.
12.1 deaths/ 100,000
pop.
62 0 0 0 1 2
Poor Mental Health Days: 1+ Days (2011-2013)
34% 36% 137,845
Poor Social and Emotional Support (2008-2010)
8% 8% 32,434

23 PRODUCED BY HEALTHY COMM UNITIE S IN STITUTE, N OVEMBE R 2015 WWW.HEALTHYCOM MUN ITIES.COM
Obesity The following section has been uniquely organized to show both health indicators specific to obesity, and those that fall under the health topic of Exercise, Nutrition & Weight. Obesity’s Poorest Performing Indicator
• Approximately 66% of Lancaster County adults report being overweight or obese, which equates to approximately 267,581 adults. Lancaster County has a higher proportion of adults who are overweight or obese compared to the entire state and compared to a distribution of Pennsylvania counties and county groups.
Lancaster County adults have lower rates of obesity compared to the state of Pennsylvania and to a distribution of all counties in Pennsylvania. Similarly, children and teens in Lancaster County are performing better on this measure. Lancaster County teens fall within the best quartile among Pennsylvania counties for proportion of teens who are obese. Similar trends exist for children grades K-6. Approximately 36.6% of Lancaster children grades K-6 are overweight or obese, which is lower compared to a distribution of Pennsylvania counties. While the data score may show a well preforming indicator of health, the population of Lancaster County teens and children estimated to be overweight or obese is approximately 13,492 and 14,783, respectively. The prevalence of obesity in a community can be impacted by many social and environmental factors. In the Table 8, all indicators that fall under the health topic of Exercise, Nutrition & Weight are displayed. Compared to a distribution of Pennsylvania counties and the state average, Lancaster County has a higher density of fast food restaurants, a lower density of fitness and recreation facilities, and a larger proportion of households without access to a grocery store. Additionally, it is estimated that 131,396 Lancaster County residents do not have access to exercise opportunities, meaning that they do not live reasonably close to a park or recreation facility.

24 PRODUCED BY HEALTHY COMM UNITIE S IN STITUTE, N OVEMBE R 2015 WWW.HEALTHYCOM MUN ITIES.COM
Table 8. Obesity Indicators
Indicator Lancaster Value
PA Value
Estimated Population
Impact
PA Counties
PA State Value
US Counties
US Value
HP 2020 Trend
Adults who are Obese (2011-2013) 28% 30% 11,519 1 1 1 Adults who are Overweight or Obese (2011-2013)
66% 65% 267,581 2 2
Teens who are Obese (2012-2013) 17.4% 5,855 1 1 Teens who are Overweight or Obese (2012-2013)
40.1% 13,492 1 2
Children who are Obese: Grades K-6 (2012-2013)
14.6% 5,938 1 1 1
Children who are Overweight or Obese: Grades K-6 (2012-2013)
36.3% 14,783 1
Farmers Market Density (2013)**
0.02 markets/
1,000 pop. 3 2 3
Households with No Car and Low Access to a Grocery Store (2009-2013)
4% housing
units
8,380 housing
units 3 3
SNAP Certified Stores (2012)
0.6 stores/ 1,000 pop. 3 3
Access to Exercise Opportunities (2015)
75.4% 85.2% 131,396* 2 3 1
Fast Food Restaurant Density (2012)
0.62 restaurant/ 1,000 pop.
2 2
Low-Income Persons who are SNAP Participants (2007)
28.6% 43,536 2 2
Low-Income and Low Access to a Grocery Store (2010)
5.2% 27,775 2 1
Recreation and Fitness Facilities (2012)
0.10 facilities/
1,000 pop. 2 1
Grocery Store Density (2012)
0.21 stores/
1,000 pop. 1 1
Food Environment Index (2015)
8.1 (index from 0
(worst) – 10 (best))
7.7 1 1 0
Workers who Walk to Work (2015)
3.4% 3.9% 8,702 1 2 1
Child Food Insecurity Rate (2013)
18.7% 20.4% 24,068 0 1 0 0
Food Insecurity Rate (2013) 11.3% 14.2% 60,357 0 0 0 0
* Indicator population estimate has been inversed to show the estimated population negatively impacted **This indicator does not include the more than 50 roadside farm stands throughout Lancaster County
(Source: http://buylocalpa.org/southeast/chapter/lancaster/)

25 PRODUCED BY HEALTHY COMM UNITIE S IN STITUTE, N OVEMBE R 2015 WWW.HEALTHYCOM MUN ITIES.COM
Substance Abuse Substance Abuse’s Poorest Performing Indicator
• Approximately 34.6% of Lancaster County driving deaths are alcohol impaired. Lancaster County has a higher rate compared to a distribution of Pennsylvania counties, the Pennsylvania state value, and all US counties.
The Substance Abuse health topic includes indicators regarding alcohol, drug, and tobacco use. It is estimated that among adults in Lancaster County, approximately 20% smoke and 15% binge drink. While Lancaster County is performing better compared to a distribution of Pennsylvania counties and the Pennsylvania state value, the estimated population impact illustrates a larger problem. The estimated adult population impacted by smoking and binge drinking is 81,085 and 60,814 adults, respectively. One population of particular concern is pregnant women. It is estimated that 89.1% of mothers reported not smoking during their pregnancy, which is a higher proportion compared to the state and a distribution of Pennsylvania counties. However, this proportion does not meet the Healthy People 2020 goal, and is lower than the US value. The population impacted by this indicator is approximately 754 Lancaster County mothers who report smoking during their pregnancy. Alcohol and tobacco use among adolescents are two indicators where Lancaster County is performing better than the state average. Approximately 15% of Lancaster County adolescents reported using alcohol in the past 30 days, which equates to 8,661 adolescents.

26 PRODUCED BY HEALTHY COMM UNITIE S IN STITUTE, N OVEMBE R 2015 WWW.HEALTHYCOM MUN ITIES.COM
Table 9. Substance Abuse Indicators
Indicator Lancaster Value
PA Value
Estimated Population
Impact
PA Counties
PA State Value
US Counties
US Value
HP 2020 Trend
Alcohol-Impaired Driving Deaths (2009-2013)
34.6% 33.9% 2 2 2
Adolescents who Smoke: Past 30 Days (2013)
6.4% 8% 3,695 0
Adolescents who Use Alcohol: Past 30 Days (2013)
15% 20.3% 8,661 0
Adolescents who Use Smokeless Tobacco: Past 30 Days (2013)
2.4% 4.7% 1,386 0
Age-Adjusted Death Rate due to Drug Use (2009-2011)
11.1 deaths/ 100,000
pop.
17.7 deaths/ 100,000
pop.
59 0 0 0
Mothers who did not Smoke During Pregnancy (2011)
89.1% 85.2% 754* 0 1 2 2 0
Death Rate due to Drug Poisoning (2006-2012)
9.3 deaths/ 100,000
pop.
15.5 deaths/ 100,000
pop.
50 0 0 1
Adults who Binge Drink (2011-2013)
15% 18% 60,814 0 0
Adults who Smoke (2011-2013)
20% 22% 81,085 1 1
* Indicator population estimate has been inversed to show the estimated population negatively impacted

27 PRODUCED BY HEALTHY COMM UNITIE S IN STITUTE, N OVEMBE R 2015 WWW.HEALTHYCOM MUN ITIES.COM
Potential Community Resources Available to Address these Priorities Lancaster County is a community rich with collaborative partnerships. In partnership with the following coalitions, Lancaster General Health/Penn Medicine and WellSpan Ephrata Community Hospital will be able to successfully address the three aforementioned priorities.
• LiveWELL Lancaster County Coalition • Lighten Up Lancaster County Coalition • Let’s Talk, Lancaster (Mental Well-being Collaborative) • Tobacco-Free Coalition of Lancaster County • Lancaster Recovery Alliance • Lancaster Anti-Heroin Task Force • Mayors Commission on Poverty

28 PRODUCED BY HEALTHY COMM UNITIE S IN STITUTE, N OVEMBE R 2015 WWW.HEALTHYCOM MUN ITIES.COM
Appendix A: Secondary Data Analysis
Scoring Method For each indicator, the county was assigned a score based on its comparison to other communities, whether health targets have been met, and the trend of the indicator value over time. These comparison scores range from 0-3, where 0 indicates the best outcome and 3 the worst. Availability of each type of comparison varies by indicator and is dependent upon the data source, comparability with data collected for other communities, and changes in methodology over time. Indicators were categorized into 29 topic areas and each topic area receives a score. Indicators may be categorized in more than one topic area. Topic scores are determined by the comparisons of all indicators within the topic.
Comparison to a Distribution of County Values: Within State and Nation For ease of interpretation and analysis, indicator data on the Community Dashboard is visually represented as a green-yellow-red gauge showing how the community is faring against a distribution of counties in Pennsylvania or the United States. A distribution is created by taking all county values within the state or nation, ordering them from low to high, and dividing them into three groups (green, yellow, red) based on their order. Indicators with the poorest comparisons (“in the red”) scored high, whereas indicators with good comparisons (“in the green”) scored low.
Comparison to Values: State, National, and Targets The county value is compared to the state value, the national value, and Healthy People 2020 (HP2020) target values. Healthy People 2020 goals are national objectives for improving the health of the nation set by the Department of Health and Human Services’ (DHHS) Healthy People Initiative. For all value comparisons, the scoring depends on whether the county value is better or worse than the comparison value, as well as how close the county value is to the target value.
Trend Over Time The Mann-Kendall statistical test for trend was used to assess whether the county value is increasing over time or decreasing over time, and whether the trend is statistically significant. The trend comparison uses the four most recent comparable values for the county, and statistical significance is determined at the 90% confidence level. For each indicator with values available for four time periods, scoring was determined by direction of the trend and statistical significance.
HCI Platform County Distribution Gauge

29 PRODUCED BY HEALTHY COMM UNITIE S IN STITUTE, N OVEMBE R 2015 WWW.HEALTHYCOM MUN ITIES.COM
Missing Values Indicator scores are calculated using the comparison scores, availability of which depends on the data source. All missing comparisons are substituted with a neutral score for the purposes of calculating the indicator’s weighted average. When information is unknown due to lack of comparable data, the neutral value assumes that the missing comparison score is neither good nor bad.
Indicator Scoring Indicator scores are averaged by topic area to calculate topic scores. Each indicator may be included in up to three topic areas if appropriate. Resulting scores range from 0-3, where a higher score indicates a greater level of need as evidenced by the data. A topic score is only calculated if it includes at least three indicators. These scores were used to categorize the topics as red (score ≥1.5), yellow (1.25≤ score <0.1.5), or green (score <1.25).
Disparities To identify indicators with the largest disparities by gender or race/ethnicity, the Index of Disparity2 measure was used to calculate the average of the absolute differences between rates for each subgroup within a sub-population category and the overall county rate, divided by the county rate. The index of disparity summarizes disparities across groups within a population that can be applied across indicators. The measure is expressed as a percentage. Across all indicators, an Index of Disparity score that ranked in the top 25% of all disparities scores–in either gender or race/ethnicity category–was identified as having a high disparity. The availability of sub-population data varies by source and indicator. In this example to the right, Age-Adjusted Death Rate due to Diabetes by Gender has county values for the female and male subgroups that are closer to each other and close to the overall county value when compared to the subgroup values by Race/Ethnicity. The absolute difference between the Black or African American value and the overall value is much larger than the difference between the White value and overall value, resulting in a higher Index of Disparity score than the score calculated for the gender subgroups.
2 Pearcy, J. & Keppel, K. (2002). A Summary Measure of Health Disparity. Public Health Reports, 117, 273-280.
±3.3 ±4.8
±11.4
±2.8
30 PRODUCED BY HEALTHY COMM UNITIE S IN STITUTE, N OVEMBE R 2015 WWW.HEALTHYCOM MUN ITIES.COM
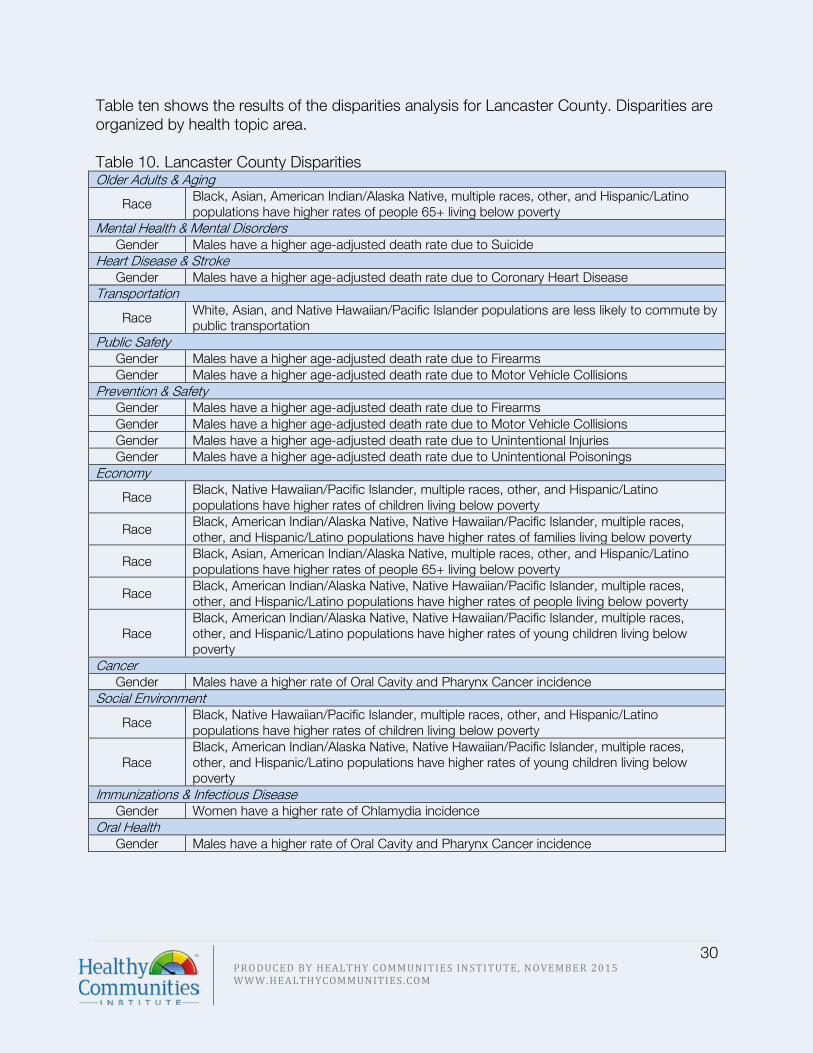
Table ten shows the results of the disparities analysis for Lancaster County. Disparities are organized by health topic area. Table 10. Lancaster County Disparities Older Adults & Aging
Race Black, Asian, American Indian/Alaska Native, multiple races, other, and Hispanic/Latino populations have higher rates of people 65+ living below poverty
Mental Health & Mental Disorders Gender Males have a higher age-adjusted death rate due to Suicide
Heart Disease & Stroke Gender Males have a higher age-adjusted death rate due to Coronary Heart Disease
Transportation
Race White, Asian, and Native Hawaiian/Pacific Islander populations are less likely to commute by public transportation
Public Safety Gender Males have a higher age-adjusted death rate due to Firearms Gender Males have a higher age-adjusted death rate due to Motor Vehicle Collisions
Prevention & Safety Gender Males have a higher age-adjusted death rate due to Firearms Gender Males have a higher age-adjusted death rate due to Motor Vehicle Collisions Gender Males have a higher age-adjusted death rate due to Unintentional Injuries Gender Males have a higher age-adjusted death rate due to Unintentional Poisonings
Economy
Race Black, Native Hawaiian/Pacific Islander, multiple races, other, and Hispanic/Latino populations have higher rates of children living below poverty
Race Black, American Indian/Alaska Native, Native Hawaiian/Pacific Islander, multiple races, other, and Hispanic/Latino populations have higher rates of families living below poverty
Race Black, Asian, American Indian/Alaska Native, multiple races, other, and Hispanic/Latino populations have higher rates of people 65+ living below poverty
Race Black, American Indian/Alaska Native, Native Hawaiian/Pacific Islander, multiple races, other, and Hispanic/Latino populations have higher rates of people living below poverty
Race Black, American Indian/Alaska Native, Native Hawaiian/Pacific Islander, multiple races, other, and Hispanic/Latino populations have higher rates of young children living below poverty
Cancer Gender Males have a higher rate of Oral Cavity and Pharynx Cancer incidence
Social Environment
Race Black, Native Hawaiian/Pacific Islander, multiple races, other, and Hispanic/Latino populations have higher rates of children living below poverty
Race Black, American Indian/Alaska Native, Native Hawaiian/Pacific Islander, multiple races, other, and Hispanic/Latino populations have higher rates of young children living below poverty
Immunizations & Infectious Disease Gender Women have a higher rate of Chlamydia incidence
Oral Health Gender Males have a higher rate of Oral Cavity and Pharynx Cancer incidence

31 PRODUCED BY HEALTHY COMM UNITIE S IN STITUTE, N OVEMBE R 2015 WWW.HEALTHYCOM MUN ITIES.COM
Population Impact In order to identify indicators with the greatest population impact, Nielsen Claritas 2015 estimates were used as the population denominators. Table eleven displays the most commonly used denominators used for this impact analysis. These denominators were used to estimate the population impacted by a particular health issue. Regardless of the period of measure, these denominators were chosen in order to estimate the present-day impact of health issues among the population of Lancaster County residents.
Table 11. 2015 Nielsen Claritas Population Denominators Total Population 534,130 Total Households 199,786 Total Housing Units 209,500 Total Families 139,604 Males 261,232 Females 272,898 Age <5 35,621 Age <18 128,704 Age 18-64 317,857 Age 65+ 87,569 Families below Poverty 11,116

32 PRODUCED BY HEALTHY COMM UNITIE S IN STITUTE, N OVEMBE R 2015 WWW.HEALTHYCOM MUN ITIES.COM
Scoring Results and Population Impact The following table lists all indicators by topic area, with the most recent value for Lancaster County and comparison scores (0-3 or good to bad). The table also includes the estimated population impacted. Source: Community Dashboard
3 Indicator population estimate has been inversed to show the estimated population negatively impacted (for example, this population impacted estimate reflects the number of children or adults without health insurance). 4 Indicator population estimate has been inversed to show the estimated population negatively impacted
Health Topic Indicator Lancaster County Score
Population Impact Estimate (Number of People)
Access to Health Services Topic Score 1.82
Children with Health Insurance 2014 84.8% 2.50 19,5603
Adults with Health Insurance 2014 85% 2.00 47,6792
Non-Physician Primary Care Provider Rate 2014
56 providers/100,000 population 1.75
Dentist Rate 2013
49 dentists/100,000 population 1.58
Primary Care Provider Rate 2012
75 providers/100,000 population 1.25
Adults with Usual Source of Health Care 2011-2013 87% N/A 52,7054
Cancer Topic Score 0.97
Cancer: Medicare Population** 2012 9.1% 2.44 8,844
Breast Cancer Incidence Rate 2008-2012
123.8 cases/100,000 females 1.78 338
Age-Adjusted Death Rate due to Breast Cancer 2008-2012
22.8 deaths/100,000 females 1.50 62
Cervical Cancer Incidence Rate 2008-2012 7.5 cases/100,000 females 1.28 20
Age-Adjusted Death Rate due to Colorectal Cancer 2008-2012
16.1 deaths/100,000 population 1.39 86
Prostate Cancer Incidence Rate 2008-2012
125.2 cases/100,000 males 1.00 327
Oral Cavity and Pharynx Cancer Incidence Rate 2008-2012
9.0 cases/100,000 population 0.61 48
Age-Adjusted Death Rate due to Cancer 2008-2012
163.6 deaths/100,000 population 0.72 874
All Cancer Incidence Rate 2008-2012
449.7 cases/100,000 population 0.67 2,402
Colorectal Cancer Incidence Rate 2008-2012
40.7 cases/100,000 population 0.56 217
Age-Adjusted Death Rate due to Prostate Cancer 2008-2012
18.9 deaths/100,000 males 0.33 49
Lung and Bronchus Cancer Incidence Rate 2008-2012
55.1 cases/100,000 population 0.17 294
Age-Adjusted Death Rate due to Lung Cancer 2008-2012
40.7 deaths/100,000 population 0.17 217
Colon Cancer Screening: Sigmoidoscopy or Colonoscopy Past 5 Years* 2006-2008
46% 86,0454

33 PRODUCED BY HEALTHY COMM UNITIE S IN STITUTE, N OVEMBE R 2015 WWW.HEALTHYCOM MUN ITIES.COM
Children's Health Topic Score 1.45
Children with Health Insurance 2014 84.8% 2.50 19,5604
Children with Asthma 2012-2013 13.6% 2.11 12,659
Adolescents who have been Bullied: Past Year 2013
20.9% 1.42 12,067
Adolescents who have been Electronically Bullied: Past Year 2013
12.7% 1.42 7,333
Children who are Overweight or Obese: Grades K-6 2012-2013
36.34% 1.42 14,783
Child Abuse Rate 2013 8.7 cases/1,000 children 1.28 1,119
Children with Type 2 Diabetes 2012-2013 0.05% 1.17 47
Children who are Obese: Grades K-6 2012-2013 14.6% 1.08 5,938
Child Food Insecurity Rate 2013 18.7% 0.67 24,068
Diabetes Topic Score 0.90
Children with Type 2 Diabetes 2012-2013 0.05% 1.17 47
Diabetes: Medicare Population** 2012 25.6% 0.89 22,680
Age-Adjusted Death Rate due to Diabetes 2011
15.3 deaths/100,000 population 0.64 82
Adults with Diabetes 2011-2013 9% 3,6488
Children with Type 1 Diabetes 0.29% 270

34 PRODUCED BY HEALTHY COMM UNITIE S IN STITUTE, N OVEMBE R 2015 WWW.HEALTHYCOM MUN ITIES.COM
4 Indicator population estimate has been inversed to show the estimated population negatively impacted
6 Indicator population estimate has been inversed to show the estimated population negatively impacted
Economy Topic Score 1.17
Households with Cash Public Assistance Income 2009-2013
3.2% of households 2.33 23,078
Renters Spending 30% or More of Household Income on Rent 2009-2012
51.8% 2.17
SNAP Certified Stores 2012 0.6 stores/1,000 population 2.00
Severe Housing Problems 2007-2011 14.5% of households 1.75 75,609
Low-Income Persons who are SNAP Participants 2007
28.6% 1.67 43,536
Low-Income and Low Access to a Grocery Store 2010
5.2% 1.50 27,775
Students Eligible for the Free Lunch Program 2013-2014* 33% 1.42 22,200
Homeownership 2009-2013 66.2% of housing units 1.17 70,8115
People Living 200% Above Poverty Level 2009-2013 71.5% 1.17 152,2274
Per Capita Income 2009-2013 $26,496 1.00
Families Living Below Poverty Level 2009-2013 7.3% of families 0.83 10,191 families
People Living Below Poverty Level 2009-2013 10.5% 0.83 56,084
Young Children Living Below Poverty Level 2009-2013 17.3% 0.83 6,162
Unemployed Workers in Civilian Labor Force 2015 4.4% 0.78
Child Food Insecurity Rate 2013 18.7% 0.67 24,068
Children Living Below Poverty Level 2009-2013 14.9% 0.61 19,177
People 65+ Living Below Poverty Level 2009-2013 6.8% 0.56 5,955
Food Insecurity Rate 2013 11.3% 0.50 60,357
Median Household Income 2009-2013 $56,483 0.50
Education Topic Score 1.46
Student-to-Teacher Ratio 2013-2014 14.9 students/teacher 1.58
People 25+ with a Bachelor's Degree or Higher 2015
23.9% 1.56 84,6296
Adolescents who have been Bullied: Past Year 2013
20.9% 1.42 12,067
Adolescents who have been Bullied: Past Year 2013
20.9% 1.42 12,067
School Drop Outs 2012-2013 1.1% 1.33 635

35 PRODUCED BY HEALTHY COMM UNITIE S IN STITUTE, N OVEMBE R 2015 WWW.HEALTHYCOM MUN ITIES.COM
Environment Topic Score 1.65
Farmers Market Density 2013
0.02 markets/1,000 population 2.08
Annual Ozone Air Quality 2011-2013 5 (index 1-5) 2.00
Households with No Car and Low Access to a Grocery Store 2009-2013
4% housing units 2.00 8,380 housing units
SNAP Certified Stores 2012 0.6 stores/1,000 population 2.00
Annual Particle Pollution 2011-2013 5 (index 1-5) 1.86
Access to Exercise Opportunities 2015 75.4% 1.75 131,3965
Severe Housing Problems 2007-2011 14.5% of households 1.75 75,609
Fast Food Restaurant Density 2012
0.62 restaurants/1,000 population 1.67
Low-Income and Low Access to a Grocery Store 2010
5.2% 1.50 27,775
Recreation and Fitness Facilities 2012
0.10 facilities/1,000 population 1.50
Drinking Water Violations FY 2013-2014 4.2% 1.42 22,433
PBT Released 2013 5,854 pounds 1.39
Recognized Carcinogens Released into Air 2013 86,783 pounds 1.39
Grocery Store Density 2012
0.21 stores/1,000 population 1.33
Food Environment Index 2015
8.1 (index from 0 (worst) -10 (best)) 1.08
Environment and Occupational Health Topic Score 1.46
Children with Asthma 2012-2013 13.6% 2.11 12,659
Asthma: Medicare Population** 2012 4.5% 1.61 3,503
Lyme Disease Incidence Rate 2011
2.5 cases/100,000 population 0.67 13

36 PRODUCED BY HEALTHY COMM UNITIE S IN STITUTE, N OVEMBE R 2015 WWW.HEALTHYCOM MUN ITIES.COM
7 Indicator population estimate has been inversed to show the estimated population negatively impacted
Exercise, Nutrition & Weight Topic Score 1.41
Farmers Market Density 2013
0.02 markets/1,000 population 2.08
Households with No Car and Low Access to a Grocery Store 2009-2013
4% housing units 2.00 8,380 housing units
SNAP Certified Stores 2012 0.6 stores/1,000 population 2.00
Access to Exercise Opportunities 2015 75.4% 1.75 131,3967
Fast Food Restaurant Density 2012
0.62 restaurants/1,000 population 1.67
Low-Income Persons who are SNAP Participants 2007
28.6% 1.67 43,536
Low-Income and Low Access to a Grocery Store 2010
5.2% 1.50 27,775
Recreation and Fitness Facilities 2012
0.10 facilities/1,000 population 1.50
Teens who are Overweight or Obese 2012-2013 40.1% 1.50 13,492
Children who are Overweight or Obese: Grades K-6 2012-2013
36.34% 1.42 14,783
Grocery Store Density 2012
0.21 stores/1,000 population 1.33
Teens who are Obese 2012-2013 17.4% 1.22 5,855
Children who are Obese: Grades K-6 2012-2013 14.6% 1.08 5,938
Food Environment Index 2015
8.1 (index from 0 (worst) -10 (best)) 1.08
Workers who Walk to Work 2015 3.4% 1.00 8,702
Child Food Insecurity Rate 2013 18.7% 0.67 24,068
Food Insecurity Rate 2013 11.3% 0.50 60,357
Adults who are Obese 2011-2013 28% 113,519
Adults who are Overweight or Obese 2011-2013 66% 267,581
Family Planning Topic Score N/A
Teen Birth Rate 2012
10.5 births/1,000 females age 15-17 0.58 114
Food Safety Topic Score N/A
Salmonella Infection Incidence Rate 2011
9.2 cases/100,000 population 0.89 49

37 PRODUCED BY HEALTHY COMM UNITIE S IN STITUTE, N OVEMBE R 2015 WWW.HEALTHYCOM MUN ITIES.COM
8 Indicator population estimate has been inversed to show the estimated population negatively impacted
Heart Disease & Stroke Topic Score 1.68
Atrial Fibrillation: Medicare Population** 2012 12.5% 2.83 10,946
Hyperlipidemia: Medicare Population** 2012 54% 2.28 47,287
Stroke: Medicare Population** 2012 4.4% 1.94 3,853
Age-Adjusted Death Rate due to Cerebrovascular Disease (Stroke) 2011
38.5 deaths/100,000 population 1.81 206
Hypertension: Medicare Population** 2012 62.3% 1.50 54,555
Ischemic Heart Disease: Medicare Population** 2012
30.9% 1.17 27,059
Age-Adjusted Death Rate due to Coronary Heart Disease 2011
92 deaths/100,000 population 1.06 491
Heart Failure: Medicare Population** 2012 15.3% 0.83 13,398
Adults who Experienced a Heart Attack, Coronary Heart Disease, or a Stroke 2011-2013
12% 34,547
Immunizations & Infectious Diseases Topic Score 0.64
Salmonella Infection Incidence Rate 2011
9.2 cases/100,000 population 0.89 49
Lyme Disease Incidence Rate 2011
2.5 cases/100,000 population 0.67 13
Age-Adjusted Death Rate due to Influenza and Pneumonia 2011
11.4 deaths/100,000 population 0.64 61
Chlamydia Incidence Rate 2012
224 cases/100,000 population 0.58 1,196
Gonorrhea Incidence Rate 2012
55.2 cases/100,000 population 0.58 295
Age-Adjusted Death Rate due to HIV 2009-2011
1.0 death/100,000 population 0.50 5
Adults 65+ with Influenza Vaccination 2007-2009 81% 16,6388
Adults 65+ with Pneumonia Vaccination 2011-2013 72% 24,5197
Maternal, Fetal & Infant Health Topic Score 1.11
Mothers who Received Early Prenatal Care* 2011 62% 2.53 2,5687
Mothers who Breastfeed* 2011 81.1% 1.56 1,3117
Mothers who Received No Prenatal Care* 2011 5% 1.36 338
Infant Mortality Rate* 2011 6.4 deaths/1,000 live births 1.00 45
Babies with Very Low Birth Weight: Singleton Births 2009
1.0% 0.97
Mothers who did not Smoke During Pregnancy* 2011
89.1% 0.97 7547
Preterm Singleton Births 2009 6.8% 0.58
Teen Birth Rate 2012
10.5 births/1,000 females age 15-17 0.58 114
Babies with Low Birth Weight* 2011 6.5% 0.47 452

38 PRODUCED BY HEALTHY COMM UNITIE S IN STITUTE, N OVEMBE R 2015 WWW.HEALTHYCOM MUN ITIES.COM
Men’s Health Topic Score 0.61
Prostate Cancer Incidence Rate 2008-2012
125.2 cases/100,000 males 1.00 327
Life Expectancy for Males 2010 77.7 years 0.50
Age-Adjusted Death Rate due to Prostate Cancer 2008-2012
18.9 deaths/100,000 males 0.33 49
Mental Health & Mental Disorders Topic Score 1.69
Depression: Medicare Population** 2012 14.8% 2.50 12,960
Alzheimer's Disease or Dementia: Medicare Population** 2012
11.8% 2.06 10,333
Adolescents who Felt Depressed or Sad: Past Year 2013
31.6% 1.42 18,246
Age-Adjusted Death Rate due to Suicide 2011
11.6 deaths/100,000 population 0.81 62
Poor Mental Health Days: 1+ Days 2011-2013 34% 137,845
Poor Social and Emotional Support 2008-2010 8% 32,434
Older Adults & Aging Topic Score 1.74
Atrial Fibrillation: Medicare Population** 2012 12.5% 2.83 10,946
Depression: Medicare Population** 2012 14.8% 2.50 12,960
Cancer: Medicare Population** 2012 9.1% 2.44 8,844
Osteoporosis: Medicare Population** 2012 9.4% 2.39 8,231
Chronic Kidney Disease: Medicare Population** 2012
17.3% 2.33 15,149
Hyperlipidemia: Medicare Population** 2012 54% 2.28 47,287
Alzheimer's Disease or Dementia: Medicare Population** 2012
11.8% 2.06 10,333
Stroke: Medicare Population** 2012 4.4% 1.94 3,853
Rheumatoid Arthritis or Osteoarthritis: Medicare Population** 2012
32.6 1.78 28,547
Asthma: Medicare Population** 2012 4% 1.61 3,503
Age-Adjusted Death Rate due to Falls 2009-2011
7.8 deaths/100,000 population 1.53 42
Hypertension: Medicare Population** 2012 62.3 1.50 54,555
Ischemic Heart Disease: Medicare Population** 2012
30.9% 1.17 27,059
COPD: Medicare Population** 2012 10.2% 0.94 8,932
Diabetes: Medicare Population** 2012 25.9% 0.89 22,680
Heart Failure: Medicare Population** 2012 15.3% 0.83 13,398
People 65+ Living Below Poverty Level 2009-2013 6.8% 0.56 5,955

39 PRODUCED BY HEALTHY COMM UNITIE S IN STITUTE, N OVEMBE R 2015 WWW.HEALTHYCOM MUN ITIES.COM
Oral Health Topic Score N/A
Dentist Rate 2013
49 dentists/100,000 population 1.58
Oral Cavity and Pharynx Cancer Incidence Rate 2008-2012
9.0 cases/100,000 population 0.61 48
Other Chronic Diseases Topic Score 2.17
Osteoporosis: Medicare Population** 2012 9.4% 2.39 8,231
Chronic Kidney Disease: Medicare Population** 2012
17.3% 2.33 15,149
Rheumatoid Arthritis or Osteoarthritis: Medicare Population** 2012
32.6 1.78 28,547
Prevention & Safety Topic Score 1.19
Severe Housing Problems 2007-2011 14.5% of households 1.75 75,609
Age-Adjusted Death Rate due to Falls 2009-2011
7.8 deaths/100,000 population 1.53 42
Age-Adjusted Death Rate due to Motor Vehicle Collisions 2011
12.2 deaths/100,000 population 1.39 65
Age-Adjusted Death Rate due to Unintentional Injuries 2011
37.6 deaths/100,000 population 1.14 201
Death Rate due to Drug Poisoning 2006-2012
9.3 deaths/100,000 population 0.92 50
Age-Adjusted Death Rate due to Unintentional Poisonings 2009-2011
9.2 deaths/100,000 population 0.86 49
Age-Adjusted Death Rate due to Firearms 2009-2011
5.6 deaths/100,000 population 0.72 30
Public Safety Topic Score 1.24
Alcohol-Impaired Driving Deaths 2009-2013 34.6% 1.75
Age-Adjusted Death Rate due to Motor Vehicle Collisions 2011
12.2 deaths/100,000 population 1.39 65
Child Abuse Rate 2013 8.7 cases/1,000 children 1.28 1,119
Violent Crime Rate 2013
171.1 crimes/100,000 population 1.06
Age-Adjusted Death Rate due to Firearms 2009-2011
5.6 deaths/100,000 population 0.72 30
Respiratory Diseases Topic Score 0.94
Children with Asthma 2012-2013 13.6% 2.11 12,659
Asthma: Medicare Population** 2012 4% 1.61 3,503
COPD: Medicare Population** 2012 10.2% 0.94 8,932
Age-Adjusted Death Rate due to Influenza and Pneumonia 2011
11.4 deaths/100,000 population 0.64 61
Lung and Bronchus Cancer Incidence Rate 2008-2012
55.1 cases/100,000 population 0.17 294
Age-Adjusted Death Rate due to Lung Cancer 2008-2012
40.7 deaths/100,000 population 0.17 217
Adults with Asthma 2011-2013 16% 64,868

40 PRODUCED BY HEALTHY COMM UNITIE S IN STITUTE, N OVEMBE R 2015 WWW.HEALTHYCOM MUN ITIES.COM
9 Indicator population estimate has been inversed to show the estimated population negatively impacted
Social Environment Topic Score 0.78
Child Abuse Rate 2013 8.7 cases/1,000 children 1.28 1,119
Young Children Living Below Poverty Level 2009-2013 17.3% 0.83 6,162
Children Living Below Poverty Level 2009-2013 14.9% 0.61 19,177
Single-Parent Households 2009-2013 22.1% 0.39 28,444
Substance Abuse Topic Score 1.22
Alcohol-Impaired Driving Deaths 2009-2013 34.6% 1.75
Adolescents who Smoke: Past 30 Days 2013 6.4% 1.25 3,695
Adolescents who Use Alcohol: Past 30 Days 2013 15% 1.25 8,661
Adolescents who Use Smokeless Tobacco: Past 30 Days 2013
2.4% 1.25 1,386
Age-Adjusted Death Rate due to Drug Use 2009-2011
11.1 deaths/100,000 population 1.14 59
Mothers who did not Smoke During Pregnancy* 2011
89.1% 0.97 7549
Death Rate due to Drug Poisoning 2006-2012
9.3 deaths/100,000 population 0.92 50
Adults who Binge Drink 2011-2013 15% 60,814
Adults who Smoke 2011-2013 20% 81,085
Teen & Adolescent Health Topic Score 1.21
Teens who are Overweight or Obese 2012-2013 40.1% 1.50 13,492
Adolescents who Felt Depressed or Sad: Past Year 2013
31.6% 1.42 18,246
Adolescents who Smoke: Past 30 Days 2013 6.4% 1.25 3,695
Adolescents who Use Alcohol: Past 30 Days 2013 15% 1.25 8,661
Adolescents who Use Smokeless Tobacco: Past 30 Days 2013
2.4% 1.25 1,386
Teens who are Obese 2012-2013 17.4% 1.22 5,855
Teen Birth Rate 2012
10.5 births/1,000 females age 15-17 0.58 114

41 PRODUCED BY HEALTHY COMM UNITIE S IN STITUTE, N OVEMBE R 2015 WWW.HEALTHYCOM MUN ITIES.COM
* Indicates that the population estimate was determined using source population denominator ** CMS Indicators have been restricted to adults 65+
Transportation Topic Score 1.49
Households with No Car and Low Access to a Grocery Store 2009-2013
4% housing units 2.00 8,380 housing units
Workers Commuting by Public Transportation 2015 1.05% 1.83 2,685
Households without a Vehicle 2009-2013 9.3% 1.72 18,580
Workers who Drive Alone to Work 2015 80.2% 1.61 205,412
Mean Travel Time to Work 2009-2013 22.5 minutes 1.17
Solo Drivers with a Long Commute 2009-2013 26.2% 1.08 53,818
Workers who Walk to Work 2015 3.4% 1.00 8,702
Wellness & Lifestyle Topic Score N/A
Life Expectancy for Females 2010 82.3 years 0.50
Life Expectancy for Males 2010 77.7 years 0.50
Poor Physical Health Days: 1+ Days 2011-2013 32% 129,736
Self-Reported General Health Assessment: Poor or Fair 2011-2013
17% 68,922
Women's Health Topic Score 1.26
Breast Cancer Incidence Rate 2008-2012
123.8 cases/100,000 females 1.78 338
Age-Adjusted Death Rate due to Breast Cancer 2008-2012
22.8 deaths/100,000 females 1.50 62
Cervical Cancer Incidence Rate 2008-2012 7.5 cases/100,000 females 1.28 20
Life Expectancy for Females 2010 82.3 years 0.50

Appendix B: Data Sources The Community Dashboard uses publicly available secondary data from the following sources.
• County Health Rankings • Pennsylvania Youth Survey • Pennsylvania Behavioral Risk Factor Surveillance System • American Community Survey • National Cancer Institute • Pennsylvania Department of Health, Bureau of Health Statistics and Research • Centers for Medicare & Medicaid Services • American Lung Association • Annie E. Casey Foundation • Feeding America • Pennsylvania Department of Health, Bureau of Community Health Systems, Division
of School Health • AIRNow • U.S. Department of Agriculture - Food Environment Atlas • Local Initiatives Support Corporation • Institute for Health Metrics and Evaluation • U.S. Environmental Protection Agency • Pennsylvania Department of Education • National Center for Education Statistics • U.S. Bureau of Labor Statistics • Pennsylvania Uniform Crime Reporting System
43 PRODUCED BY HEALTHY COMM UNITIE S IN STITUTE, N OVEMBE R 2015 WWW.HEALTHYCOM MUN ITIES.COM
Appendix C: Community Health Stakeholder Engagement
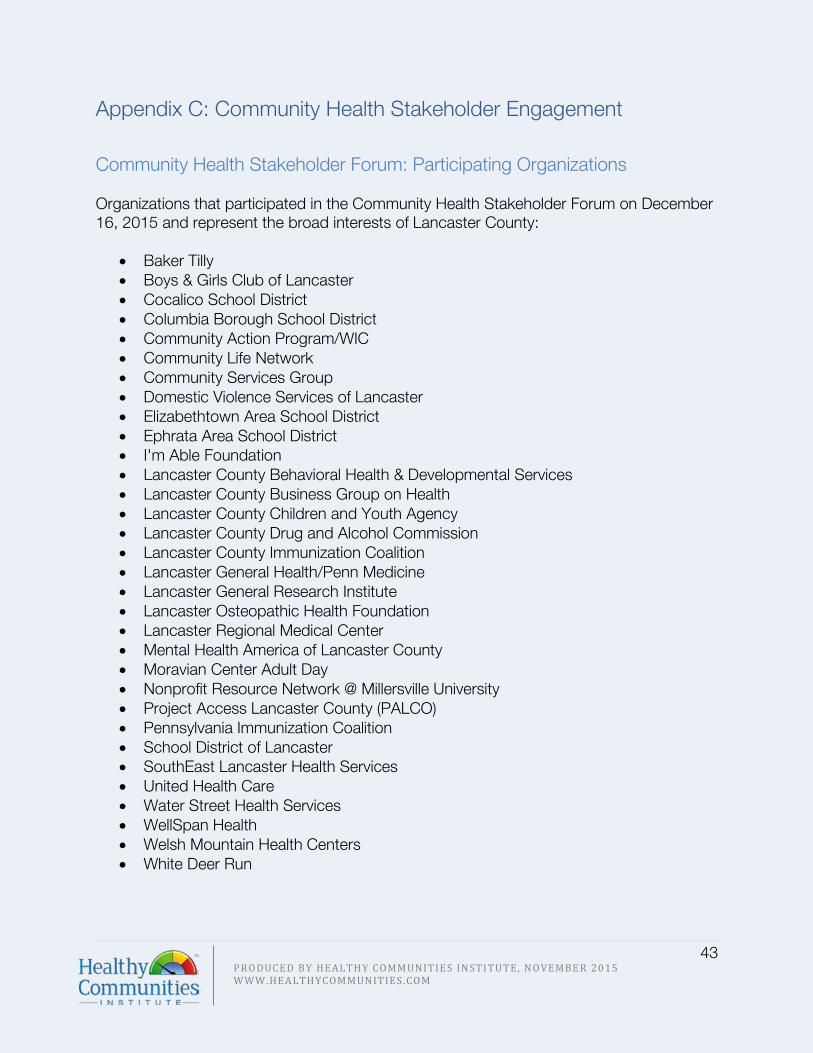
Community Health Stakeholder Forum: Participating Organizations
Organizations that participated in the Community Health Stakeholder Forum on December 16, 2015 and represent the broad interests of Lancaster County:
• Baker Tilly • Boys & Girls Club of Lancaster • Cocalico School District • Columbia Borough School District • Community Action Program/WIC • Community Life Network • Community Services Group • Domestic Violence Services of Lancaster • Elizabethtown Area School District • Ephrata Area School District • I'm Able Foundation • Lancaster County Behavioral Health & Developmental Services • Lancaster County Business Group on Health • Lancaster County Children and Youth Agency • Lancaster County Drug and Alcohol Commission • Lancaster County Immunization Coalition • Lancaster General Health/Penn Medicine • Lancaster General Research Institute • Lancaster Osteopathic Health Foundation • Lancaster Regional Medical Center • Mental Health America of Lancaster County • Moravian Center Adult Day • Nonprofit Resource Network @ Millersville University • Project Access Lancaster County (PALCO) • Pennsylvania Immunization Coalition • School District of Lancaster • SouthEast Lancaster Health Services • United Health Care • Water Street Health Services • WellSpan Health • Welsh Mountain Health Centers • White Deer Run

44 PRODUCED BY HEALTHY COMM UNITIE S IN STITUTE, N OVEMBE R 2015 WWW.HEALTHYCOM MUN ITIES.COM
Expert Input Janae Allgire Behavioral Health Administrator, Water Street Health Services
Water Street Health Services focuses on one segment of this population: the working poor or homeless. These individuals and families often make less than $150 per week and cannot afford the co-payments at other safety net providers. Water Street Health Services is the only free clinic in Lancaster City where residents living in poverty with an income too high to receive public health insurance and yet not enough to buy private health insurance find relief from pain for their medical or dental crisis. Water Street Health Services works with the despaired, low-income individuals in Lancaster County, especially those living in Lancaster City. https://wsm.org/what-we-do/health-services/ Kevin Alvarnaz, MBA Director, Community Health & Wellness, WellSpan Health
WellSpan Health is an integrated health system that serves the communities of central Pennsylvania and northern Maryland. The organization is comprised of a multispecialty medical group of more than 850 physicians and advanced practice clinicians, a home care organization, six respected hospitals, more than 15,000 employees, and more than 130 patient care locations. Wellspan partners with communities and residents to improve health by providing exceptional care that helps our neighbors not only get better but also stay healthy. https://www.wellspan.org/ Steve Batchelor, MS Director of Wellness Services, WellSpan Ephrata Community Hospital
WellSpan Health is an integrated health system that serves the communities of central Pennsylvania and northern Maryland. The organization is comprised of a multispecialty medical group of more than 850 physicians and advanced practice clinicians, a home care organization, six respected hospitals, more than 15,000 employees, and more than 130 patient care locations. Wellspan partners with communities and residents to improve health by providing exceptional care that helps our neighbors not only get better but also stay healthy. https://www.wellspan.org/ Catherine Birdsey, MPH, CHES Senior Manager, Baker Tilly
Since 1931, Baker Tilly has provided quality accounting and advisory services to businesses to achieve their full market potential. With experience in over 20 industries, Baker Tilly’s client-centered approach has built their status as one of the top 15 advisory and accounting firms in the county. http://www.bakertilly.com/about/

45 PRODUCED BY HEALTHY COMM UNITIE S IN STITUTE, N OVEMBE R 2015 WWW.HEALTHYCOM MUN ITIES.COM
Jenni Black COO, SouthEast Lancaster Health Services
The mission of SouthEast Lancaster Health Services is to provide medical and dental care to all members of our community–moms, dads, children, grandparents, adults, teens, and babies who have no insurance, who have little or no income and those who cannot find affordable healthcare elsewhere. When a fellow Lancastrian is vulnerable and sick, SouthEast Lancaster Health is honored to restore their wellness. SouthEast is a Federally Qualified Health Center (FQHC) focused on serving the underserved in Lancaster County. www.selhs.org/about-us Nicole Borreli, Licensed Agent Marketing Outreach Specialist, United Health Care
Offering Medicaid and Medicare plans to individuals, United Healthcare specializes in low cost or no cost health insurance plans. http://www.uhccommunityplan.com Robin Boyer, MSW Director of Intake Services, Lancaster County Children and Youth Agency
Lancaster Children and Youth Agency investigates all reported cases of child abuse and neglect, focusing on programs that ensure the safety, permanency, and wellbeing of at risk children and youth. http://web.co.lancaster.pa.us/129/Children-Youth-Agency Zoe Bracci Director, Moravian Center Adult Day
Moravian Center Adult Day Services provide a safe, welcoming place for adults who require additional care during the day and provides respite for caregivers. The Day Services strive to promote mental, cognitive, and spiritual wellbeing, independence, and fulfilling interactions with other seniors. http://moraviancenteradultday.org/ Beth Bulat Case Manager Supervisor, Lancaster County Drug and Alcohol Commission
The Lancaster County Drug and Alcohol Commission has been serving the community for more than 35 years, fulfilling our mission to provide access to high quality, community-based drug and alcohol prevention/education services for all citizens and treatment services to uninsured and under-insured, low-income citizens in an efficient and cost effective manner in the County of Lancaster, PA. Lancaster County Drug & Alcohol Commission works with individuals struggling with addiction. www.co.lancaster.pa.us/lanco/cwp/view.asp?q=379662&lanconav_GID=991 Lisa Cameron, MA, LPC Director of Counseling, YWCA Lancaster
The YWCA strives to empower all women in the community and eliminate racism with its multi-pronged approach to advocacy and public policy. Not only acting as an emergency

46 PRODUCED BY HEALTHY COMM UNITIE S IN STITUTE, N OVEMBE R 2015 WWW.HEALTHYCOM MUN ITIES.COM
and long term housing, the YWCA also focuses on teaching young girls about careers in technology, and providing sexual assault counseling. http://www.ywcalancaster.org/programs/hallmark-programs/ Jackie Concepcion Outreach Administrator, Welsh Mountain Health Centers
Welsh Mountain Health Centers was founded in 1972 and incorporated in 1973 to “provide quality, family-centered health services to all members of the community, especially those who encounter barriers to care”. Welsh Mountain Medical & Dental Center is a Federally Qualified Health Center (FQHC) receiving annual support from the United States Department of Health & Human Services. http://welshmountain.org/ Gail Dennis Grants Program Manager, Lancaster General Health/Penn Medicine
Lancaster General Health/Penn Medicine, a non-profit health system in Lancaster County, Pennsylvania, strives to improve the health and wellness of all Lancaster County residents. The wellness center works to serve low-income, despaired populations, to reduce chronic disease in Lancaster County. www.lghealth.org Betsy Finger Clinical Marketer, White Deer Run
White Deer Run offers many services for chemical dependency, rehabilitation, outpatient services, and more. With a multi-disciplinary approach to healthcare, White Deer Run focuses on creating the most comprehensive, well rounded health care possible for their patients. http://www.whitedeerrun.com CJ Freeman Health/Physical Education/Wellness Network Leader, School District of Lancaster
http://www.lancaster.k12.pa.us/ Teri Gamez, SNS Director of Food Services, Ephrata Area School District
http://easdpa.org/pages/Ephrata_School_District Lawrence George, MSW, LSW Executive Director, Lancaster County Behavioral Health & Developmental Services
Behavioral Health and Developmental Services cultivates comprehensive community services and administration fueled by the belief that all people have value and potential. https://www.humanservices.co.lancaster.pa.us/
47 PRODUCED BY HEALTHY COMM UNITIE S IN STITUTE, N OVEMBE R 2015 WWW.HEALTHYCOM MUN ITIES.COM
Danny Gilmore, Jr., MHS Behavioral Health Administrator, Welsh Mountain Health Centers
Welsh Mountain Health Centers was founded in 1972 and incorporated in 1973 to “provide quality, family-centered health services to all members of the community, especially those who encounter barriers to care”. Welsh Mountain Medical & Dental Center is a Federally Qualified Health Center (FQHC) receiving annual support from the United States Department of Health & Human Services. http://welshmountain.org/ Brittany Grear, MS Communications Director, Boys & Girls Club of Lancaster
The Boys & Girls Club of Lancaster has been a premier provider of youth services in Lancaster since 1939. The Mission of Boys & Girls Club of Lancaster is to enable all young people, especially those who need them most, to become productive, caring, responsible adults. They provide an environment where members can achieve: positive self-identity, a healthy lifestyle, a strong character, educational success, and social competency. www.bgclanc.org Diane Hess Interim Executive Director, Lancaster County Business Group on Health
Lancaster County Business Group on Health works to improve the health of businesses in Lancaster County. http://lcbgh.org/ Mary Ann Hoffman, RN, BSN Intern Community Health, Lancaster General Health
Lancaster General Health/Penn Medicine, a non-profit health system in Lancaster County, Pennsylvania, strives to improve the health and wellness of all Lancaster County residents. The wellness center works to serve low-income, despaired populations, to reduce chronic disease in Lancaster County. www.lghealth.org Julie Holtry, MSW, LSW MH Director, Lancaster County Behavioral Health & Developmental Services
Behavioral Health and Developmental Services cultivates comprehensive community services and administration fueled by the belief that all people have value and potential. https://www.humanservices.co.lancaster.pa.us/ Mike Horst, PhD, MPHS, MS Director, Biostatistics & Data, Lancaster General Research Institute
Lancaster General Health/Penn Medicine, a non-profit health system in Lancaster County, Pennsylvania, strives to improve the health and wellness of all Lancaster County residents. The wellness center works to serve low-income, despaired populations, to reduce chronic disease in Lancaster County. www.lghealth.org

48 PRODUCED BY HEALTHY COMM UNITIE S IN STITUTE, N OVEMBE R 2015 WWW.HEALTHYCOM MUN ITIES.COM
Gail Keller, RN, BSN, M.Ed Health Services Facilitator, School District of Lancaster
http://www.lancaster.k12.pa.us/ Anna Kennedy Executive Director, Lancaster Osteopathic Health Foundation
For Caregivers supporting children with mental or behavioral health issues, Lancaster Osteopathic Health Foundation wants to insure that you never feel alone. LOHF provides resources to caregivers for educational and financial assistance so they can provide the best possible care to the children, and create a healthier, happier community. http://www.lohf.org Greg Kessler Executive Director, Water Street Health Services
Water Street Health Services focuses on one segment of this population: the working poor or homeless. These individuals and families often make less than $150 per week and cannot afford the co-payments at other safety net providers. Water Street Health Services is the only free clinic in Lancaster City where residents living in poverty with an income too high to receive public health insurance and yet not enough to buy private health insurance find relief from pain for their medical or dental crisis. Water Street Health Services works with the despaired, low-income individuals in Lancaster County, especially those living in Lancaster City. https://wsm.org/what-we-do/health-services/ Jessica Klinkner, MPH, CHES Health Promotion Specialist, Lancaster General Health/Penn Medicine
Lancaster General Health/Penn Medicine, a non-profit health system in Lancaster County, Pennsylvania, strives to improve the health and wellness of all Lancaster County residents. The wellness center works to serve low-income, despaired populations, to reduce chronic disease in Lancaster County. www.lghealth.org Sue Lackmann, MEd School/Community Gardens Liasion, Lighten Up Lancaster County
Lighten Up Lancaster County is a group of concerned individuals whose members include stay-at-home parents, students, educators, wellness professionals, healthcare providers, local government officials, food service employees, recreation/fitness facilities, non-profits and businesses. Each member brings different experiences and perspectives to the table, but their unifying purpose is to develop, implement, and promote local policies and programs that make being healthy easy. Lighten Up Lancaster County works to improve the health of Lancaster County residents as it relates to being at a healthy weight. www.lightenuplancaster.org

49 PRODUCED BY HEALTHY COMM UNITIE S IN STITUTE, N OVEMBE R 2015 WWW.HEALTHYCOM MUN ITIES.COM
Christine Laney, J.D. Legal Clinic Coordinator, Domestic Violence Services of Lancaster
Encompassing an emergency shelter, transition housing, legal counsel, group counseling, and children’s therapy, Domestic Violence Services provides free assistance to all victims of domestic violence. https://www.caplanc.org/DVS Mary LeVasseur Chair Person, Tobacco Free Coalition of Lancaster County
Tobacco-Free Coalition of Lancaster County is a group of people united by common concern over tobacco use in Lancaster County, PA. Their mission is to prevent young people from using tobacco, to provide resources for people to quit their tobacco use, and eliminate of tobacco-smoke pollution. The Tobacco-Free Coalition of Lancaster County works with the individuals in Lancaster County impacted by tobacco use. https://www.facebook.com/WhyTobaccoFreelanc/info/?tab=page_info Donna Long Staffing and Recruiting Coordinator, Elizabethtown Area School District
http://www.etownschools.org/ Janeen Maxwell, MPH Director, Nonprofit Resource Network @ Millersville University
The Non-Profit Research Network provides non-profit groups with access to resources, advances in network opportunities, and lessons in professional development. http://www.nonprofitresourcenetwork.org/ Lori Michener, SPHR Director of Human Resources, YWCA Lancaster
The YWCA strives to empower all women in the community and eliminate racism with its multi-pronged approach to advocacy and public policy. Not only acting as an emergency and long term housing, the YWCA also focuses on teaching young girls about careers in technology, and providing sexual assault counseling. http://www.ywcalancaster.org/programs/hallmark-programs/ Colleen Milligan, MBA Senior Manager, Baker Tilly
Since 1931, Baker Tilly has provided quality accounting and advisory services to businesses to achieve their full market potential. With experience in over 20 industries, Baker Tilly’s client-centered approach has built their status as one of the top 15 advisory and accounting firms in the county. http://www.bakertilly.com/about/

50 PRODUCED BY HEALTHY COMM UNITIE S IN STITUTE, N OVEMBE R 2015 WWW.HEALTHYCOM MUN ITIES.COM
Sara Mohler Mental Health America of Lancaster County
Mental Health America of Lancaster County (MHALC) is part of a nation-wide voluntary organization dedicated to promoting mental health, preventing mental illness and contributing to the quality of life of persons suffering from mental and emotional problems2. This organization works with individuals of all ages, races, and socioeconomic statuses to address their mental health needs. http://www.mhalancaster.org/ Ella Musser Assistant to the Superintendent, Cocalico School District
www.cocalico.org Sara Musser Intern, Community Life Network
Community Life Network strives to create positive outcomes through the interaction of local organizations. Through a local approach to networking, the Community Life Network provides social services to improve outcomes for individuals and whole communities. http://www.360lancaster.com/Communities/CommunityLifeNetwork.html Andrew Newcomer Community Education Manager, Lancaster Regional Medical Center
Lancaster Regional Medical Center, a for-profit hospital in Lancaster County, Pennsylvania, strives to improve the health and wellness of all Lancaster County residents. http://www.lancastermedicalcenters.com/ Alan Peterson, MD Chairman, Lancaster County Immunization Coalition
The Lancaster County Immunization Coalition's mission is to increase the number of fully immunized children, adolescents, and adults in Lancaster County. http://www.immunizepa.org/lancaster-county-immunization-coalition/ Carol Powell Superintendent, Columbia Borough School District
http://www.columbia.k12.pa.us/ Jamie Quinn Executive Director, Community Life Network
Community Life Network strives to create positive outcomes through the interaction of local organizations. Through a local approach to networking, the Community Life Network provides social services to improve outcomes for individuals and whole communities. http://www.360lancaster.com/Communities/CommunityLifeNetwork.html

51 PRODUCED BY HEALTHY COMM UNITIE S IN STITUTE, N OVEMBE R 2015 WWW.HEALTHYCOM MUN ITIES.COM
Kristee Reichard Business Manager, Ephrata Area School District
http://easdpa.org/pages/Ephrata_School_District Mindy Reighard Communications Director, Lancaster Osteopathic Health Foundation
For Caregivers supporting children with mental or behavioral health issues, Lancaster Osteopathic Health Foundation wants to insure that you never feel alone. LOHF provides resources to caregivers for educational and financial assistance so they can provide the best possible care to the children, and create a healthier, happier community. http://www.lohf.org Lisa Riffanacht Executive Director, PALCO
Project Access Lancaster County (PALCO), a program of the Lancaster County Medical foundation, began in 2007 out of a concern of the local medical community for the uninsured in Lancaster County. PALCO’s mission is to provide a coordinated healthcare network of volunteer physicians, other health care providers, hospital services, diagnostic services and pharmaceutical assistance for the low income uninsured residents of Lancaster County. PALCO provides a health care bridge for people who cannot afford health insurance, but who do not qualify for Medical Assistance, Veterans Benefits, or Medicare. In the first four years of operation, PALCO has served over 3,400 participants. www.palcolancaster.org/home.html Sue Schaffer I'm Able Foundation IM ABLE foundation helps those with disabilities to push their limits and maintain an active lifestyle. IM ABLE teaches individuals with disabilities to push harder, go farther, and break perceived limitations. http://imablefoundation.org Debra Scheidt, Clinical Therapist Program Director, Lancaster Regional Medical Center
Lancaster Regional Medical Center, a for-profit hospital in Lancaster County, Pennsylvania, strives to improve the health and wellness of all Lancaster County residents. http://www.lancastermedicalcenters.com/ Bruce Sensenig Superintendent, Cocalico School District
www.cocalico.org

52 PRODUCED BY HEALTHY COMM UNITIE S IN STITUTE, N OVEMBE R 2015 WWW.HEALTHYCOM MUN ITIES.COM
Trisha Stover Community Volunteer
Kim Sullenberger WIC Director, Community Action Program/WIC
The WIC Program provides nutritious foods, nutrition education and health screenings to income eligible pregnant, postpartum and breastfeeding women, and to infants and children up to age five who are at nutritional risk. All program participants receive nutrition education regarding appropriate foods to eat during pregnancy, breastfeeding, infancy and childhood to promote optional growth and development. www.caplanc.org/Our-Programs/Women-Infants-Children-WIC/WIC-Program-Overview Joanne Sullivan, RN, BSN Executive Director, Pennsylvania Immunization Coalition
The Pennsylvania Immunization Coalition (PAIC) is an organization of volunteers consisting of individuals and organizations that have an interest in advancing the mission of timely and effective immunizations for all Pennsylvania residents. www.immunizepa.org/about/mission-vision-goals Julie Weaver, OTR/L Vice President, Community Services Group
Created in 1972, the Community Services Group provides support services for those with Intellectual and Developmental Disabilities, Child and Youth Autism, and a variety of mental health conditions. http://www.csgonline.org Alice Yoder, MSN, RN Director of Community Health, Lancaster General Health/Penn Medicine
Lancaster General Health/Penn Medicine, a non-profit health system in Lancaster County, Pennsylvania, strives to improve the health and wellness of all Lancaster County residents. The wellness center works to serve low-income, despaired populations, to reduce chronic disease in Lancaster County. www.lghealth.org

53 PRODUCED BY HEALTHY COMM UNITIE S IN STITUTE, N OVEMBE R 2015 WWW.HEALTHYCOM MUN ITIES.COM
Results of Gaps and Assets Analysis
Poverty Gaps:
• Adverse childhood experiences • Time/Program intensity needed to
address • Money Management • Increased unfounded mandates to
employers • Impact of geography- city or rural
poverty • Business involvement & awareness • Redefine quality of life • Family-sustaining jobs (transportation
consistency) / Living wages • Lack of resources /knowledge to
break the cycle • Education gap; budgeting / financial
literacy • Support networks; family cohesion-
kids • Disconnected from support system
• Ethnicity gaps because people in poverty are African Americans, Latino etc.
• Affordable housing • Need more meals at schools • Isolation of those in poverty- not great
models for change • Cost of education • Social entrepreneurs in financing • Stress / mental health for those in
poverty • Transportation • Poor mental health • Poor health • Motivation to improve lifestyle • Stable living situation (families are
transient) • Affordable schooling • Living wages
Assets: • Food banks • Caring community-lots of efforts to get resources to people; in schools increasing attention
& awareness – united way ,mayor’s commission, prosperity indicators & businesses • Growing research for addressing • Faith-based organizations; HUD initiatives • Poverty city commission • Meals at schools • Power Packs Project • Assets Lancaster • Collaboration • Tabor • Poverty Simulation • Atlas Now • Mentor / financial group • Bridges out of poverty • Community first fund / lending

54 PRODUCED BY HEALTHY COMM UNITIE S IN STITUTE, N OVEMBE R 2015 WWW.HEALTHYCOM MUN ITIES.COM
Access to Care Gaps:
• Public transportation • Need more locations (support groups,
doctors, testing facilities) • Culture/ gender • Stubborn nature- privacy concerns • Homelessness • Better job coverage • Insurance coverage / deductible • Do not want to change doctor • Language issues • PCP- Closed to new points • Lack of tracking for referrals • Not knowing what resources and
where resources are • Rural needs • Perception of CHIP- government
handouts do not want because of pride
• Lack of understanding of the having a PCP for prevention
• Education gaps • Motivation
• Stigma • Appointment times / hours of service • Out of pocket costs- deductibles • 211- lack of understanding • Limited phone access • Advocacy • Lack of PCP to meet new mandates /
initiatives (well visits) • MA / Medicare expansion • Basic knowledge of insurance • Do not qualify for plans • Navigation • DPW • Not in the right plan • ACA always changing • Lack of knowledge about
independent urgent care centers- do they take insurance and what about referrals?- NO- social workers/ case worker in every PCP office (FQHC model)
Assets:
• Med Express takes MA • Refugee clinics • Water street free health clinic & others • Urgent care facilities • Emergency rooms as an option to get folks connected to care/ care connections @ LGH • Children’s Health Insurance Program (CHIP) improvements (from insurance comm. To
DHS) • Effort to integrate MH into PCP • FQHCs • Medicaid expansion • Affordable care act • Faith-based (cover cost, transportation) • Civic (rotary, lions) • PALCO- in focus

55 PRODUCED BY HEALTHY COMM UNITIE S IN STITUTE, N OVEMBE R 2015 WWW.HEALTHYCOM MUN ITIES.COM
Substance Abuse Gaps:
• Need more data- huge topic- do we need focus
• Are community resources available? what are schools doing?
• Need more funding for programs, treatment centers, clinics
• People need information especially in all languages in lay person terms
• Need information about assets • Only some insurance coverage • More naloxone available • Changing climate legally • Narcan • Binge drinking in college • Parental acceptance • Transportation to services • Reduced funding for services/
reimbursement • Social acceptance • Tittle IV • Availability/ access to alcohol • BED availability • Heroin epidemic • Stigma (Cannot recover)
• Denial of issue • Prescription drugs • Early diagnosis of anxiety &
depression • Prison over prevention • Money, jobs • Perception and awareness • Shame • How enforcement is taking care of
issue • Employee support for those in/ needy
of rehab • Lack of health care provider training • Intergenerational • Hospitals tracking abusers from place
to place • Racism • Need education around narcan use • Public health vs. criminal justice issue • Schools need to improve drug
education • Stress • Parental/ acceptance of drugs/
alcohol (hosting parties)
Assets: • Harm reduction • Drug Court • Narcan • Police • Some schools • Early addressed in school • Social service organizations • Support services in schools • MA expansion- people able to get into TX • Easy access to D&A TX • Lancaster recovery (alliance to address stigma) • Support groups- information available (compass mark) • LifeSkills in school

56 PRODUCED BY HEALTHY COMM UNITIE S IN STITUTE, N OVEMBE R 2015 WWW.HEALTHYCOM MUN ITIES.COM
Tobacco Use Gaps:
• Funding for programs • No show at program • Lack of desire (myth) • Easy to get • Accessibility (under age) • Low tax on cigarettes- none on e-
cigarettes • Lack of knowledge of addiction • Lack of education on e-cigarettes • Loop holes on clean indoor air- bars • W.T.F (Why tax free) • Smoking bridges to drinking • Bilingual tobacco treatment • Coverage of medication • Health care providers understanding
addiction • Mental health/ addictions
• Facilities still promote (passive and active)
• Continue testing shows more for NRT • Employment improvement- Smoke
free policies without education about resources to quit
• No public housing ordinances • Limited education and access at
schools • Tobacco is a money maker • Low income population use money
for tobacco • History of growing tobacco • 2nd and 3rd hand smoking • Education • Smoking glamourized on TV/ movies
creating more desire
Assets:
• Distinctive- expense on purchasing- increase taxes • Tobacco cessation program • Smoke free work places and restaurants • Charges on health insurance (including e cigs) • Young lungs at play • Tobacco checks at convenience stores • Clean indoor air act • Cessation appointments • Ephrata hospital programs • Tobacco free coalition • More emphasis on work free wellness programs • H.R.A assessing • Foster parenting- no smoking rules • Hospital admission receive smoking cessation education

57 PRODUCED BY HEALTHY COMM UNITIE S IN STITUTE, N OVEMBE R 2015 WWW.HEALTHYCOM MUN ITIES.COM
Obesity Gaps:
• Physical education in schools • Food insecurity for low income • Built environment to support exercise • Cultural norms • Need more healthy vending • Neighborhood • Stores with unhealthy foods • Expensive to eat healthy • Lack of access to be physically active • Lack of group exercise options • Stress and sugar link • Workplace policy to provide time for
exercise • School policy / USDA requirements • Positive peer support around food is
“medicine” • Free community meals and healthy
food access
• Price and availability for large scale buying
• Education: how to eat healthy; preparation; storage, how to make it taste good
• Carbs • Location- dogs in rural areas are a
menace, walkers, and bikers • Portion distortion • Social norms to be heavier • Correlation to other health care costs • Educate parents • Conversation with PCP • Less focus on BMI • School lunches • Cultural norms around birthdays,
holidays, coffee breaks • Link between
• food and depression Assets:
• Hospital prevention programs (LULC) • School education (Nutrition, exercise) • Lancaster city streets more bikeable • SELHS support groups (Free) • 12 step program • Increase work place wellness
programs • Healthy vending fair in January 1/16 • WIC- Vouchers in farmers markets • Water street changed menu to make
it healthy • Apps. For counting steps- free
• Complete street policy • Lancaster County Conservancy,
existing open space, parks and trails • Lighten up Lancaster • Community gardens • Free apps. • Walking meetings • Standing desks • Employer by-ins to work and more • Incentives to go to gyms or other
healthy items to decrease insurance costs

58 PRODUCED BY HEALTHY COMM UNITIE S IN STITUTE, N OVEMBE R 2015 WWW.HEALTHYCOM MUN ITIES.COM
Mental Health Gaps:• Inpatient treatment • Wait time for appointment with
psychologist/psychiatry • Connect PCPs with MH providers • Funding • Utilization of EAP low due to lack of
awareness/stigma • New costs—facility fees & co-pays with
MH providers • Lack of providers • Veterans/VA system services • Getting to resources—how to, where—
disconnectedness
• Lack of forensic services-reintegration • Lack of family counseling • Frustration/anger • Navigation • Medicine management/monitoring • Lack of diversity in service providers • Cultural competency • Duel diagnosis clients—lack of
coordination • Training in schools—autism & other—not
enough • Police training • Medication, availability of ($$)
• Prison reform • Access • Drug and alcohol • How to respond—who? When? • Early identification & linkage to resources
• Affordability • Seniors/senior living communities • Lack of time with PCP • Adolescent BH Unit
Assets: • Philhaven on Prince St—Walk in services • Crisis Diversion Center • United Way/Lets Talk 2-1-1 guide • Aveidumschools • Suicide Lancaster hotline • Required suicide training in schools
(students and staff) • Mental Health First Aid • Clubhouse • 60% of employers have EAP • Mental Health America • LOHF $-->kids mental health • Mental Health Parity Act • Link Crew at High School
• Integration • Innovation in health centers—co-located
services • Screening through primary care • Growing housing support • Peer support services • School based counseling services • One-door concept • Arch Street Center • Prison suicide training—calls to 9-1-1 • Trauma informed care • BHDS • United Way Co-pay assistance

59 PRODUCED BY HEALTHY COMM UNITIE S IN STITUTE, N OVEMBE R 2015 WWW.HEALTHYCOM MUN ITIES.COM
Asthma Gaps: • Ignorance of the extent of issue and asthma triggers • Knowledge and denial of climate change • Air quality due to geography • No community advocacy organization in Lancaster (American Lung Association?) • Underused resources already available—access? Decreased $$? • Quality housing/affordability • Early identification and connection with a PCP • Specialists, transportation to • Contributors/awareness to air quality • Medication expense/copay/insurance • Cockroaches • Disease management • Connection to obesity? • Pesticides on fields and in homes • Trees, grass, pollen (increasing with climate change) • Lack of education • People not using asthma insurance program resources • Emergency department use, especially kids • Medication compliance • Health education doesn’t always connect smoking and asthma • Feel they have no control over condition • Poverty Assets: • No smoking in public places (less of a social norm) • Smoke free areas (YLAP, clean indoor air, public housing) • State lawstudents can self-administer asthma meds with a note from doctor • Insurance programs have resources • Health education programs in schools • with smoking prevention • Prescription support programs by manufacturer • Dr. Peterson’s expertise • Ephrata Hospital cessation programs • Cessation apps

60 PRODUCED BY HEALTHY COMM UNITIE S IN STITUTE, N OVEMBE R 2015 WWW.HEALTHYCOM MUN ITIES.COM
What Else? • Access to care/understanding LGBT • Cost of childcare and access to
assistance • Housing
o Affordable/poverty o Safe/healthy
• Accessible treatment for substance abuse
• Prenatal care—who gets it? Cultural issues?
• Food security (poverty), male vs female • Refugee
population/interpretation/cultural competency
• Immunizationslack of knowledge and exemptions
• Stress on schools o Lack of money to do
mandated programs, especially Special Ed
• Access to education o Knowledge of resources to
break a cycle across generations
• Air quality • Access to mental health services • Dental/oral health access • Budget • Disability awareness • Violence, domestic violence
o Access to services/counseling • Homelessness • Breastfeeding initiation
o (Asset: WIC in LanCo has highest in PA)
• Healthy sexuality education of children with understanding of tools to help prevent adverse experiences
• Flooding (climate change) • Support for reentry/jail • Antibiotic/superbugs • Employment at hiring wage • Epidemics—public health response
• Navigation of services • Financial resources • Disease transmission due to tourism • Transportation • Social isolation, especially among older
adults • Maternity/paternity leave • Health and physical literacy • Safe neighborhoods • Access to parks • Lack of safety to get places
o Roads o Sexual offenders
• Immunization rates • Anta-stigma to mental health • Support of family unit • Cultural sensitivity for new populations

61 PRODUCED BY HEALTHY COMM UNITIE S IN STITUTE, N OVEMBE R 2015 WWW.HEALTHYCOM MUN ITIES.COM
Community Health Stakeholder Survey

03/21/2016 3:46pm www.projectredcap.org
ConfidentialPage 1 of 10
We have designed this survey so that your responses to one question will prompt additional questions. The surveyshould take less than 15 minutes to complete. You have unique and valuable knowledge to contribute to this needsassessment and we appreciate your participation!
To navigate within the survey, please only use the buttons provided from within the survey. DO NOT click on yourbrowser's back arrow while completing the survey. This will disengage you from the survey. If this does happen,simply re-enter the survey through the link again.
Please click on the attachment below if you would like to view the information presented at the 2015 CommunityHealth Stakeholder Forum on December 16.
If you have technical problems accessing the survey, please email [email protected].
Thank you very much for your valuable time.
Please note, due to federal laws and regulations, Lancaster General Health/Penn Medicine and WellSpan EphrataCommunity Hospital will report the names and organizations of all public health experts and community leaders whoparticipated in the survey. However, the information collected from you in this survey will not be linked to youridentifying information, and thus will be anonymous.
[Attachment: "Community Health Data_Survey.pdf"]
First Name __________________________________
Last Name __________________________________
Credentials __________________________________
Organization Represented __________________________________
Title/Position at Organization __________________________________
What is your gender? MaleFemale
What is your age? 18-24 years old25-34 years old35-44 years old45-54 years old55-64 years old65+ years old
Do you live in Lancaster County? YesNo

03/21/2016 3:46pm www.projectredcap.org
ConfidentialPage 2 of 10
In what municipality do you reside? Adamstown BoroughAkron BoroughBart TownshipBrecknock TownshipCaernarvon TownshipChristiana BoroughClay TownshipEast Cocalico TownshipWest Cocalico TownshipColerain TownshipColumbia BoroughConestoga TownshipConoy TownshipDenver BoroughEast Donegal TownshipWest Donegal TownshipDrumore TownshipEast Drumore TownshipEarl TownshipEast Earl TownshipWest Earl TownshipEast Petersburg BoroughEden TownshipElizabeth TownshipElizabethtown BoroughEphrata BoroughEphrata TownshipFulton TownshipEast Hempfield TownshipWest Hempfield TownshipEast Lampeter TownshipWest Lampeter TownshipLancaster CityLancaster TownshipLeacock TownshipUpper Leacock TownshipLititz BoroughLittle Britain TownshipManheim TownshipManheim BoroughManor TownshipMarietta BoroughMartic TownshipMillersville BoroughMount Joy BoroughUpper Mount Joy TownshipLower Mount Joy TownshipMountville BoroughNew Holland BoroughParadise TownshipPenn TownshipPequea TownshipProvidence TownshipQuarryville BoroughRapho TownshipSadsbury TownshipSalisbury TownshipStrasburg BoroughStrasburg TownshipTerre Hill BoroughWarwick Township

03/21/2016 3:46pm www.projectredcap.org
ConfidentialPage 3 of 10
In the following sections, you will have the opportunity to select 3 health outcomes, for which you will be asked aseries of follow up questions. You will also have the opportunity to add a health outcome that is not listed as anoption.

03/21/2016 3:46pm www.projectredcap.org
ConfidentialPage 4 of 10
Health Outcome #1
Please select a health condition that you feel should Obesitybe a priority in Lancaster County. Mental Health
Tobacco UseSubstance AbuseAsthmaAccess to Care
Please select up to 5 health drivers that you feel How a person develops during the first few yearscontribute most directly to poor health outcomes of life (early childhood development)related to [condition_1]. How much education a persons obtains
Being able to get and keep a jobWhat kind of work a person doesHaving food or being able to get food (foodsecurity)Having access to health services and the qualityof those servicesHousing statusHow much money a person earnsDiscrimination and social supportPublic safety
Among the health drivers that you feel contribute How a person develops during the first few yearsmost directly to poor health outcomes related to of life (early childhood development)[condition_1], which driver(s) do you feel the How much education a persons obtainshospitals in Lancaster County could affect the most? Being able to get and keep a job
What kind of work a person doesHaving food or being able to get food (foodsecurity)Having access to health services and the qualityof those servicesHousing statusHow much money a person earnsDiscrimination and social supportPublic safety
Are you aware of any community resources that are Yescurrently being used in Lancaster County to address No[condition_1].
Please describe the community resources that you areaware of that are being used in Lancaster County toaddress [condition_1]. __________________________________
Can you recommend any strategies, policies, Yespractices, and/or partnerships that hospitals in NoLancaster County could implement to address[condition_1]?
Please describe the strategies, policies, practices,and/or partnerships that hospitals in LancasterCounty could implement to address [condition_1]. __________________________________

03/21/2016 3:46pm www.projectredcap.org
ConfidentialPage 5 of 10
Health Outcome #2
Please select another health condition that you feel Obesityshould be a priority in Lancaster County. Mental Health
Tobacco UseSubstance AbuseAsthmaAccess to Care
Please select up to 5 health drivers that you feel How a person develops during the first few yearscontribute most directly to poor health outcomes of life (early childhood development)related to [condition_2]. How much education a persons obtains
Being able to get and keep a jobWhat kind of work a person doesHaving food or being able to get food (foodsecurity)Having access to health services and the qualityof those servicesHousing statusHow much money a person earnsDiscrimination and social supportPublic safety
Among the health drivers that you feel contribute How a person develops during the first few yearsmost directly to poor health outcomes related to of life (early childhood development)[condition_2] which driver(s) do you feel the How much education a persons obtainshospitals in Lancaster County could affect the most? Being able to get and keep a job
What kind of work a person doesHaving food or being able to get food (foodsecurity)Having access to health services and the qualityof those servicesHousing statusHow much money a person earnsDiscrimination and social supportPublic safety
Are you aware of any community resources that are Yescurrently being used in Lancaster County to address No[condition_2]?
Please describe the community resources that you areaware of that are being used in Lancaster County toaddress [condition_2] __________________________________
Can you recommend any strategies, policies, Yespractices, and/or partnerships that hospitals in NoLancaster County could implement to address[condition_2]?
Please describe the strategies, policies, practices,and/or partnerships that hospitals in LancasterCounty could implement to address [condition_2]. __________________________________

03/21/2016 3:46pm www.projectredcap.org
ConfidentialPage 6 of 10
Health Outcome #3
Please select another health condition that you feel Obesityshould be a priority in Lancaster County. Mental Health
Tobacco UseSubstance AbuseAsthmaAccess to CareOther self-selected health condition
Please list the health condition here __________________________________
Please select up to 5 health drivers that you feel How a person develops during the first few yearscontribute most directly to poor health outcomes of life (early childhood development)related to [condition_3] How much education a persons obtains
Being able to get and keep a jobWhat kind of work a person doesHaving food or being able to get food (foodsecurity)Having access to health services and the qualityof those servicesHousing statusHow much money a person earnsDiscrimination and social supportPublic safety
Among the health drivers that you feel contribute How a person develops during the first few yearsmost directly to poor health outcomes related to of life (early childhood development)[condition_3] which driver(s) do you feel the How much education a persons obtainshospitals in Lancaster County could affect the most? Being able to get and keep a job
What kind of work a person doesHaving food or being able to get food (foodsecurity)Having access to health services and the qualityof those servicesHousing statusHow much money a person earnsDiscrimination and social supportPublic safety
Are you aware of any community resources that are Yescurrently being used in Lancaster County to address No[condition_3]?
Please describe the community resources that you areaware of that are being used in Lancaster County toaddress [condition_3]. __________________________________
Can you recommend any strategies, policies, Yespractices, and/or partnerships that hospitals in NoLancaster County could implement to address[condition_3]?
Please describe the strategies, policies, practices,and/or partnerships that hospitals in LancasterCounty could implement to address [condition_3]. __________________________________

03/21/2016 3:46pm www.projectredcap.org
ConfidentialPage 7 of 10
Please respond to the questions in the matrix table as they relate to [condition_other]
Strongly Agree Agree Somewhat Agree DisagreeThere are a large number ofpeople affected by[condition_other] in LancasterCounty[condition_other] contributessignificantly to poor healthconditions in Lancaster County.
[condition_other] contributessignificantly to mortality inLancaster County.
There are significantracial/ethnic and socioeconomichealth disparities of[condition_other] in LancasterCounty.[condition_other] is a problem inall regions of Lancaster County.
There are evidence-basedstrategies that could beimplemented by LancasterCounty hospitals to improve[condition_other]
Please select up to 5 health drivers that you feel How a person develops during the first few yearscontribute most directly to poor health outcomes of life (early childhood development)related to [condition_other] How much education a persons obtains
Being able to get and keep a jobWhat kind of work a person doesHaving food or being able to get food (foodsecurity)Having access to health services and the qualityof those servicesHousing statusHow much money a person earnsDiscrimination and social supportPublic safety
Among the health drivers that you feel contribute How a person develops during the first few yearsmost directly to poor health outcomes related to of life (early childhood development)[condition_other] which driver(s) do you feel the How much education a persons obtainshospitals in Lancaster County could affect the most? Being able to get and keep a job
What kind of work a person doesHaving food or being able to get food (foodsecurity)Having access to health services and the qualityof those servicesHousing statusHow much money a person earnsDiscrimination and social supportPublic safety
Are you aware of any community resources that are Yescurrently being used in Lancaster County to address No[condition_other]?
Please describe the community resources that you areaware of that are being used in Lancaster County toaddress [condition_other]. __________________________________

03/21/2016 3:46pm www.projectredcap.org
ConfidentialPage 8 of 10
Can you recommend any strategies, policies, Yespractices, and/or partnerships that hospitals in NoLancaster County could implement to address[condition_other]?
Please describe the strategies, policies, practices,and/or partnerships that hospitals in LancasterCounty could implement to address [condition_other]. __________________________________

03/21/2016 3:46pm www.projectredcap.org
ConfidentialPage 9 of 10
Health Priority Ranking
Please rank the health conditions identified above, taking the following into consideration:o Focus on root causeso Number of lives coveredo Quality of life years losto Cost avoidance
[condition_1] [condition_2] [condition_3]Top Priority2nd Priority3rd Priority

03/21/2016 3:46pm www.projectredcap.org
ConfidentialPage 10 of 10
Almost done! We have a few background questions to ask before the survey is concluded.
Please select any of the categories below that best Administrativedescribes your current position at [organization]. Executive
Manager/SupervisorProfessional StaffEducatorVolunteer/Intern
(Select all that apply)
Please select the categories that represent Maternal/Early Childhoodpopulations you have experience working with. School aged-youth
AdultsElderlyAfrican-AmericanHispanic/LatinoNon-English SpeakingRefugeeUninsuredHomelessImpoverishedRuralUrbanOther
(Select all that apply)
Please list the other population(s) here __________________________________
Is there anything else that you would like to add? __________________________________
Are you interested in learning more about the LiveWELL Lancaster Countycommunity coalitions mentioned at the Stakeholder Lighten Up Lancaster CountyForum? Select the coalition(s) of interest, and a Tobacco Free Coalition of Lancaster Countyrepresentative will contact you. Let's Talk, Lancaster
LiveWELL Lancaster County, Lancaster General YesHealth/Penn Medicine and Wellspan Ephrata Community NoHospital values your responses to this survey. Wewould like to ask your permission to quote your openended anonymous responses in its final CHNA report ifhelpful to illustrate a specific point.
Those are all the questions we have for you. Please note, due to federal laws and regulations Lancaster GeneralHealth/Penn Medicine and WellSpan Ephrata Community Hospital will report the names and organizations of all publichealth experts and community leaders who participated in the survey. However the information collected from you inthis survey will not be linked to your identifying information, and thus will be anonymous.
Thank you for your participation, [first_name]!
We appreciate your valuable input!