community development and justice standing committee are
TRANSCRIPT

Community Development and Justice Standing Committee
Are we there yet?How WA Police determines whether traffic law enforcement is effective
Report No. 8June 2015
Legislative Assembly Parliament of Western Australia

Legislative Assembly Tel: (08) 9222 7494Parliament House Fax: (08) 9222 7804Harvest Terrace Email: [email protected] WA 6000 Website: www.parliament.wa.gov.au/cdjsc
Published by the Parliament of Western Australia, Perth.June 2015.ISBN: 978-1-925116-45-8
(Series: Western Australia. Parliament. Legislative Assembly. Committees.Community Development and Justice Standing Committee. Report 8)
328.365
Committee MembersChair Ms M.M. Quirk, MLA
Member for Girrawheen
Deputy Chair Dr A.D. Buti, MLAMember for Armadale
Members Mr C.D Hatton, MLAMember for Balcatta
Ms E. Mettam, MLA Member for Vasse
Mr M.P. Murray, MLAMember for Collie-Preston
Committee StaffPrincipal Research Officer Dr Sarah Palmer, BA (Hons), PhD
Research Officer Ms Niamh Corbett, BAppSc, GradDipRecMgnt, MInfoMgnt, JP

Community Development and Justice
Standing Committee
Are we there yet?
How WA Police determines whether traffic law enforcement is effective
Report No. 8
Presented by
Ms M.M. Quirk, MLA
Laid on the Table of the Legislative Assembly on 25 June 2015


Chair’s Foreword
In business, the idea of measuring what you are doing,
picking the measurements that count like customer
satisfaction and performance ... you thrive on that.
– Bill Gates
VERY week we hear tragic news of another life lost on our roads or a family’s
future forever altered by involvement in a vehicle crash. Western Australia’s
road fatality toll last year was the worst in four years, and critical injuries rose
even more severely with 106 more than in 2013. The rate of deaths on WA roads – 7.2
per 100,000 people – is much higher than the national average of 4.9.
It was in the wake of these disastrous figures that the Committee decided to focus on
road policing as the first in a series of reports on the way WA Police evaluates its
performance.
At the end of such a year – or even at the end of what the media terms a “horror
weekend” on the roads – many are left scratching their heads, including the police.
What can be done to bring down the toll?
Making our roads safer involves input from a number of different agencies. It is an
extremely complex and sometimes perplexing problem influenced by factors such as
road engineering, vehicle design and education strategies.
Hence, WA Police is not the only agency responsible for the road toll. However, it is a
key player. Police are given responsibility for enforcing road user behaviour by
apprehending those breaking the law and deterring others from engaging in dangerous
behaviour.
Deterrence is an important outcome of enforcement. If police are able to create the
perception among drivers that they are at risk of being caught for speeding, drink
driving or using a mobile device, for example, anywhere and at any time, then they
have been successful in applying the theory of general deterrence.
But how do they measure success? WA Police needs to know whether what it is doing
is effective. This is not only important from an accountability perspective, but also in
the context of recently implemented reforms to the policing model.
Quite rightly, police services consume a significant portion of the State budget and the
public needs to be assured that its tax dollars are being well spent.
E

Throughout the course of this inquiry we have heard that accessing data which would
demonstrate police performance on road safety is difficult. Hence, it is not easy for
interested parties and the public to determine whether WA Police strategies are
working.
Do the police themselves know whether they are working? When faced with competing
arguments about the importance of police visibility and what time of the day to
conduct RBTs, for example, are they able to produce evidence that favours one
strategy over another?
These measurements are not just required from an accountability perspective but also
assist road trauma research and stimulate informed debate amongst members of the
community. The latter is vital in changing driving culture which is a notoriously difficult
outcome to achieve.
Moreover in the context of financial assessments made on the deployment of
personnel in a particular role (a cornerstone of the WA Police’s Frontline 2020), useful
performance and meaningful measurement of outcomes can lead to greater
efficiencies without sacrificing service levels.
Since the focus of the inquiry was an examination of performance measures,
consideration of appropriate levels of sworn officer staffing was not canvassed in
detail. However, implicit in WA Police’s deterrence approach is the need to maintain
existing levels of police staff. There was evidence before the Committee that traffic
police were not deployed one hundred per cent of the time on traffic duties, that RBT
teams had been stood down for periods of days to assist on general matters and the
number of infringements issued personally by officers on the road has inexplicably
dropped.
Reducing the road toll using strategies of general deterrence requires long term
strategic planning, application of scientific evidence and significant resources. It is not
easy. But I cannot imagine anyone opposing measures which would result in fewer lives
being lost on our roads.
Our impression is that traffic police use evidence and intelligence well in the day-to-day
operational activities – the type that apply to specific deterrence. Where WA Police
seems to be lacking is in the collection and use of evidence to construct the big picture
strategies that might in fact create the perception that drivers breaking the law could
be caught anywhere at any time.
It was somewhat surprising to realise in the course of the inquiry that the issues we
were investigating were novel or had not been widely canvassed elsewhere. It may
well be that this report might stimulate and inspire further research to be conducted

such as that recently commissioned by WA Police to be undertaken by the Curtin-
Monash Accident Research Centre.
Given this, I particularly appreciate the thoughtful contributions and vigorous analysis
of data by my fellow Committee members in the conduct of this inquiry: Deputy Chair
Dr Tony Buti MLA, Mr Mick Murray MLA, Mr Chris Hatton MLA and Ms Libby Mettam
MLA.
I also thank the Principal Research Officer, Dr Sarah Palmer, and Research Officer, Ms
Niamh Corbett, for their professional support of the Committee’s work.
MS M.M. QUIRK, MLA
CHAIR


Contents
Executive Summary i
Ministerial Response xi
Findings and Recommendations xiii
1 Introduction 1
1.1 Inquiry focus 1
1.2 Establishment of Inquiry 2
1.3 Guide to report 3
2 Road safety in WA 5
2.1 Road safety governance in Australia 5
2.1.1 National Road Safety Strategy 5
2.1.2 The Safe Systems approach 6
2.2 Road safety governance in Western Australia 7
2.2.1 Towards Zero 7
2.2.2 Ministerial responsibility 7
2.2.3 The Road Safety Council 8
2.2.4 The Office of Road Safety 8
2.2.5 The Road Trauma Trust Account 9
2.2.6 The Browne Review 9
2.3 Road trauma in WA 10
2.3.1 People killed and seriously injured 10
2.3.2 What do the statistics tell us? 11
2.3.3 Differences in metropolitan and country road trauma 12
2.3.4 Vulnerable road users 13
2.4 Police and responsibility for road safety 14
2.4.1 Frontline 2020 policing model 15
2.4.2 Road policing 16

2.4.3 Road policing in WA 18
3 Performance measurement 21
3.1 What is performance measurement and why is it necessary? 21
3.1.1 Problems with performance measurement 24
3.2 Measurement of police performance 25
3.2.2 Problems with police performance measurement 28
3.3 Traffic law enforcement performance measurement 30
3.3.1 Problems with traffic law enforcement performance measurement 31
3.4 How does WA Police measure its performance? 34
3.4.1 Other measures of police performance in relation to road safety 35
4 Adequacy of traffic law enforcement measurement by WA Police 39
4.1 Measurement of effectiveness 40
4.1.1 Internal performance measures 40
4.1.2 External performance measures 44
4.2 Reporting and publication of data 50
4.3 Issues affecting the judgement of performance 59
4.3.1 Lack of mandatory blood testing 59
4.3.2 Insufficient funding 61
4.3.3 Unallocated Road Trauma Trust Account funds 69
4.3.4 The role of local government 74
4.4 Discussion and conclusions 78
4.4.1 How does WA Police know if it is making progress? 79
4.4.2 How does WA Police use performance information to guide its practice? 81
4.4.3 Do the reported measures give parliament, road safety stakeholders and
the public an adequate indication of whether traffic enforcement is effective? 83
4.4.4 A final word on the issue of responsibility 84

Appendices 87
1 Inquiry Terms of Reference 87
2 Committee’s functions and powers 89
3 Submissions received 91
4 Hearings 93
5 Acronyms 97
6 Types of traffic enforcement data 99
6A: List of figures the RAC says should be available to the public 99
6B: Data provided on WA Police website 100
6C: Extracts from Tasmania Police Corporate Performance Report 102
6D: Extracts from community attitude survey, Oct-Dec 2010 106
7 Road Trauma Trust Account funding 2015-16 111


i
Executive Summary
N 2014, Western Australia recorded 22 more road fatalities and 106 more serious
injuries than in the previous year. While the road toll has in fact been on an overall
downward trend over the past decade, the State’s road fatality rate is currently the
third worst in Australia.
Western Australia Police plays a key role in keeping our roads safe. Given that the
Committee resolved in November 2014 to inquire into Methods Employed by WA
Police to Evaluate Performance, it was considered timely to focus initially on how WA
Police evaluates its performance in relation to road safety.
The inquiry was guided by three key questions:
How does the agency know if it is making progress in this area?
How does it use performance information to guide its practice?
Do the reported measures give parliament, road safety stakeholders and the
public an adequate indication of whether traffic enforcement is effective?
Police operations consume a large portion of the State budget and as such it is
important that robust effectiveness measures are in place – particularly in the context
of the largely untested Frontline 2020 police reforms being implemented.
This report does not set out to determine the best road policing strategies. Rather, it is
about how WA Police determines the best strategies. Performance measurement
should serve as a guide as to what strategies are working and what requires
modification.
Road safety in WA
Governance and management of road safety is complex, as outlined in Chapter Two.
WA is a signatory to a national plan for road safety (the National Road Safety Strategy
2011-2020) which is in turn aligned with the Global Plan for the Decade of Action for
Road Safety 2011-2020, an initiative of the United Nations.
The State’s Towards Zero Road Safety Strategy 2008-2020 is guided by the Safe Systems
approach adopted by all Australian jurisdictions. WA Police contributes to two of the
four cornerstones of the Safe Systems framework: “safe speeds” and “safe road use”.
A Ministerial Council with responsibility for road safety was established in 1995, but it
was not until 2008 that road safety became a portfolio in its own right. A recent review
of road safety governance (the Browne Review) recommended that a Commissioner for
I

ii
Road Safety be established and that the current Office of Road Safety (which
coordinates road safety and administers the Road Trauma Trust Account) become the
Office of the Commissioner for Road Safety. The Road Safety Council, operating since
1997, is set to become the Road Safety Advisory Council and include road safety
experts in its membership.
The Browne Review was prompted by the increase in funds from speed and red light
camera infringements flowing to the Road Trauma Trust Account. The Road Safety
Council has had responsibility for recommending to the Minister for Road Safety which
projects (submitted by various bodies) should be funded. Currently, $80 million of RTTA
funds has not been allocated.
Road trauma
Road trauma poses a significant cost to society both socially and financially. While the
focus is often on road fatalities, the Committee was told that for every death around 11
people are permanently injured and another 50 spend a long period in hospital. In 2014
there were 184 fatalities and 298 critical injuries on WA roads – an increase on the
preceding five-year average of 181 fatalities and 259 critical injuries.
Fatality rates in every regional police district were higher than in the metropolitan
districts, with the Wheatbelt recording the highest rate. Vulnerable road users, such as
motorcyclists and cyclists, featured prominently in the road toll, with motorcyclists
accounting for 24 per cent of the overall toll (up from 14 per cent in 2013).
Police and responsibility for road safety
Road policing is central to modifying driver behaviour and enhancing road safety. In
Australia it is shaped by a common theory applied in traffic psychology known as
deterrence theory, which focuses on the effect of enforcement activities and legal
sanctions on behaviour.
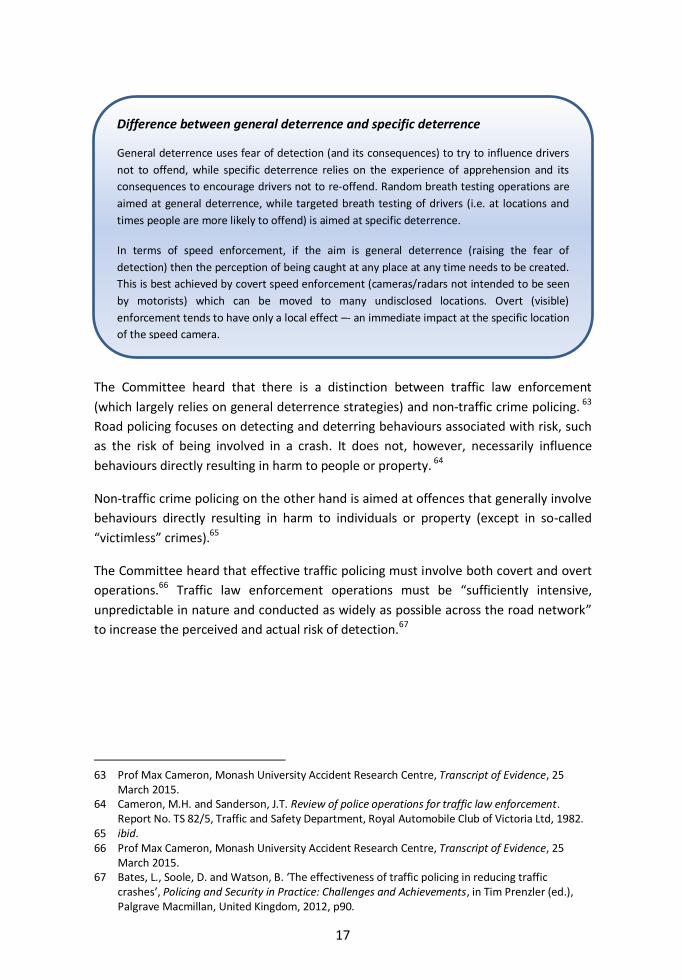
General deterrence uses fear of detection (and its consequences) to try to influence
drivers not to offend, while specific deterrence relies on the experience of
apprehension and its consequences to encourage drivers not to re-offend.
The WA Police traffic enforcement command has been guided by the Road Policing
Strategy 2011-2014, which sets out three objectives:
enforcement of traffic laws;
targeting unsafe road user behaviour; and
building road policing capability.
The strategy has expired and WA Police told the Committee a new draft strategy was
being contemplated.

iii
Police are involved in a number of strategies to reduce the road toll announced in the
past six months, including a review of motorcycle crashes and a review of regional
highway safety.
Performance measurement and KPIs
As detailed in Chapter Three, measuring and reporting on the performance of public
sector organisations is a well-established practice aimed at delivering accountability
and transparency (to both the parliament and taxpayers).
A common way to collect public sector performance information is to employ a set of
Key Performance Indicators (KPIs), which provide an overview of operations and
material expenses. Agencies are required to create indicators to measure effectiveness
for each outcome and efficiency for each output/service and to publish the results in an
annual report.
Australian policing has been influenced by the “new era” of policing in the UK and the
US, emerging from the New Public Management style of management which placed
more emphasis on police being accountable to the community and achieving
government outcomes.
Most Australian police organisations have implemented Operational Performance
Review (OPR) systems (based on data-driven performance review processes such as
Compstat in the US) which align closely with treasury performance reporting and the
requirements of the Productivity Commission. There is some criticism of Australian
police organisations for using performance management systems in a rigid and
mechanistic way.
Researchers have noted that measuring the reactive element of policing is considerably
easier than measuring the success of proactive policing (which works towards
disrupting or preventing future crimes). Hence, while Australian police agencies have,
in principle, adopted a philosophy of intelligence-led policing, intelligence products are
not routinely used for their intended purpose of assisting decision making.
In the UK in particular, an evidence-based approach – which continuously tests
hypotheses with empirical research findings – is increasingly used to determine “what
works”.
While there is agreement that performance measures can have a positive impact on
police work, there are also some drawbacks, such as: the difficulty of isolating the
contribution of police from the work of other agencies with whom they regularly
interact; the tendency to focus on KPIs which lend themselves most readily to auditing
of efficiency and effectiveness; the risk that resources may be diverted to meet “false

iv
targets”; and the potential for the publication of indicators to become a political
exercise, potentially leading to distortions in data recording.
Traffic law enforcement performance measurement
Whilst there is a considerable body of research on ways to increase the safety of roads
and ongoing debate about the most effective methods of traffic enforcement, very
little has been written about the way police measure traffic enforcement performance.
A key challenge is in being able to determine whether a reduction in recorded offences
is due to fewer people committing offences or to police failing to catch offenders.
Another challenge is that traffic law enforcement is essentially about deterring road
users from engaging in risky behaviour.
Road safety research suggests that general deterrence strategies are the most effective
for changing both drink-driving and speeding behaviour, because they have the
potential to influence all road users. Specific deterrence strategies should be used to a
lesser extent. Measurement of effectiveness should therefore contain some way to
determine whether behaviour change has taken place.
How WA Police measures its traffic law enforcement performance
In 2014-15, WA Police replaced two lawful road-use behaviour KPIs with a single KPI:
Percentage of traffic law enforcement contacts made by police officers that
target “Category A” offences (including drink driving, exceeding the lawful
speed limit, careless/dangerous/reckless driving, no authority to
drive/unlicensed vehicle, use of mobile phones whilst driving, and non-wearing
of seatbelts/restraints/helmets).
This is the only audited KPI. WA Police provided the Committee with one internal KPI.
WA Police also provide data for the Productivity Commission’s Report on Government
Services, which compares the performance of public sector agencies across Australia.
Five road safety measures are reported.
The Road Safety Council (of which WA Police is a member) reports on a set of Safety
Performance Indicators (using data provided by police) and on the progress towards
performance indicators for Road Trauma Trust Account projects.
Adequacy of traffic law enforcement measurement
In the past, there has tended to be a focus on measuring enforcement of speeding and
drink/drug driving offences. As discussed in in Chapter Four, the intention of the new
WA Police KPI is that it takes into account other safety risks such as not wearing a
seatbelt, mobile phone use and careless driving. Focussing on the number of contacts

v
police make for these offences is said to complement the “anywhere, anytime”
message that goes hand in hand with the strategy of general deterrence.
But can this one KPI really measure the effectiveness of this strategy, and how effective
are other measures used by WA Police to evaluate traffic policing performance? Just as
importantly, in the interests of transparency, how is its performance being reported?
Measurement of effectiveness
WA Police provided evidence of only one internal KPI and as such the Committee is
uncertain to what extent police sets goal for its traffic officers to work towards.
Traffic police seem to be effectively using intelligence products to direct operations on
a day-to-day, week by week and month by month basis. But while the use of tactical
intelligence was evident, the extent to which intelligence guides longer term strategies
is more difficult to determine.
There are only three lower level intelligence analysts in the traffic department and one
level five in a centralised intelligence analysis role, indicating perhaps that use of
intelligence at a more sophisticated level than guiding the deployment roster is not a
priority.
WA Police has a history of commissioning research and has long-standing relationships
with university-based centres (such as Curtin-Monash Accident Research Centre). But
researchers involved with those centres had not seen action consistent with the results
of their research. It seems that while there is an appreciation of the value of evidence-
based policing, there is simply not enough time and resources devoted to considering
evidence properly.
The audited KPI is designed to ensure that the majority of police contacts (i.e. police
officers dealing with individuals in person) are for the most serious traffic offences. The
Committee notes that, counter to expectations, there has been a decrease in the
number of on-the-spot infringements and questions whether there are too few
resources available to devote to traffic policing?
The audited KPI seems to fit the description of an efficiency indicator (a measurement
of outputs) more so than an effectiveness indicator (a measurement of outcomes). It
measures a service provided rather than the effect of the service. It does not tell us
whether offences have risen or fallen, or whether the police are being effective in
making the roads safer. If there are no KPIs which indicate whether public attitudes to
speeding, drink driving, mobile device use, etcetera are changing, how can police
monitor whether their road safety messages are having any effect?
The Report on Government Services contains some information on road safety that
does not appear in the WA Police annual report, such as hospitalisations and use of

vi
seatbelts. But public knowledge of the report is likely to be limited. Road safety
performance indicators reported by other agencies (e.g. the Road Safety Council’s
annual report and the Office of Road Safety’s Road Trauma Trust Account quarterly
reports) do not clearly delineate the effectiveness of police in delivering road safety
outcomes.
Reporting and publication of data
Given that a key purpose of KPIs is to demonstrate transparency, the question of what
data is made available to the public through the annual report and/or other means is
critical.
WA Police says that even with the paring back of the audited KPIs, it will continue to
collect the same data as it always has and will make this information available to the
public on its website. However, there is a difference between publishing figures on a
website and including the data in the annual report where some kind of analysis and
contextual narrative is generally included.
In addition, the omission of that data from the annual report may send the message to
the public that the police do not take these measures as seriously when implementing
strategies for traffic policing. The exclusion of intermediate indicators from the annual
report is also counter to the recommendations of the Office of the Auditor General.
Research papers viewed by the Committee also recommend publishing contextual
indicators alongside a relatively small set of core performance indicators to promote
transparency, comparison, accountability and communication. The Committee was
mindful that excessive reporting obligations may impact on finite resources.
The RAC, the WA Police Union, the Road Safety Council and the WA Local Government
Association have all raised concerns about access to police data. While WA Police says
it is collecting the same traffic policing data that it has always collected, it does not
appear that all of the data is accessible to other groups, and much less the public.
In terms of the prosecution data which some organisations have requested, police
point to the problem of determining what a rise or fall in prosecutions actually means
(which was why the previous KPIs were replaced). However, if WA Police only releases
the data it thinks is reasonable and/or does not share data, this may invite accusations
of having something to conceal.
A proposal for a comprehensive statistical database (the Enhanced Road Safety
Information System) which would collect and integrate road safety data was put to the
Road Safety Council but not supported because of concerns about cost and resources.
The availability of data through such a system would help end speculation about how
police spend their time. Making more information available – not less – could also give
police a basis for countering common claims by the public that speed cameras are only

vii
located in places where they can raise revenue and that placement of breath and drug
buses is only about meeting RBT targets.
Issues affecting the judgement of performance
There are a number of issues beyond the remit of policing which impact on the
performance of WA Police in regard to traffic policing and road safety.
For example, unlike most other States, it is not mandatory in WA for a blood sample to
be taken from people injured in motor vehicle crashes who are admitted to a hospital.
A measured level rather than a “yes” or “no” response from a patient with regard to
whether they had been drinking or taking drugs would enable trauma managers and
researchers to compile evidence of the success of a new initiative. This would also be
important data for police in assessing the success of drink and drug driving campaigns.
Another issue is that the number of roadside drug tests being performed by WA Police
is less than in other States and significantly less than the number recommended in a
report to the government by road safety expert Max Cameron. The Committee found
that, given the high incidence of illicit drug use, an increase in funding would assist in
the number of drug tests being performed.
WA Police applied to the Road Trauma Trust Account for almost $12 million to fund the
project Increase Breath and Drug Testing in 2014-15, and the Road Safety Council
recommended this amount be granted. However, only $4.6 million was approved. For
2015-16, the project has received $4.7 million.
A decrease in the amount of funding for advertising and education campaigns is also a
concern, considering that a substantial commitment to community education is
required to help reduce road trauma. According to a review of the Office of Road
Safety’s mass media campaign, WA spends only 84 cents per capita on road safety
advertising, compared to the national average of $1.29 per capita.
Community attitude surveys which measure drivers’ perceptions of enforcement on
our roads have not been conducted since 2011, when it was determined that the
money spent on the contract could be better spent on other initiatives. The Office of
Road Safety notes the value of the surveys, however, and says it is in the process of
organising a new contract so that they can resume. The surveys are important in
supporting what would otherwise be merely an assertion that drivers are deterred by
specific enforcement actions at specific times.
The Committee has some concern, along with sectors of the community, that there is
still $80 million in unallocated funds in the Road Trauma Trust Account. The Minister
for Police has said the money will be spent gradually. A deadline of June 2017 would be
consistent with the Browne Review recommendation that funds in the account be
spent within two years.

viii
There is also some concern over what the funds are used for. Funds are not supposed
to be used for an agency’s core activities, but there is some debate about what
constitutes a core activity. The Committee supports calls to establish safeguards to
ensure all RTTA funds are directed into road safety initiatives.
The Committee is also concerned that, given such a high proportion of road trauma
occurs in regional WA, RTTA funding has been reduced or withdrawn from projects that
have an impact on road safety in rural or remote areas – contrary to advice from the
Road Safety Council. The WA Local Government Association would also welcome
greater involvement from WA Police on the policing of local roads, given that almost
two-thirds of serious crashes occur on local roads. Communication with police on local
road policing issues was seen as lacking.
Conclusions
The Committee agrees that the road toll is not a reasonable KPI for police, given the
complexities of joint responsibility for road safety, but it should still be included and
referred to in annual reports.
The single traffic enforcement KPI WA Police is currently using as an audited reporting
measure is not sufficient to provide an indication of effectiveness, nor is it a good
outcome measure. It exposes police to the risk of emphasising quantified elements of
performance at the expense of other aspects, pursuing short-term success at the
expense of long-term success, and emphasising measures rather than underlying
objectives.
WA Police should be using its performance data to support the strategy of general
deterrence. But the rationale behind general deterrence is not readily understood,
both by the public and by many police officers. Both groups call for a higher police
presence on the roads, but the aim of general deterrence is to create the perception of
being caught “anywhere at any time” by random deployment of police traffic
resources.
Intelligence seems to be used effectively in everyday traffic policing (at the tactical
level) but it is not clear that it is analysed at the higher level and applied to strategic
decision-making. Road safety researchers say that WA Police often do not act on the
findings and recommendations of academic research. However, this may be because
research is not delivered in a way that is useful and practical for police. Research needs
to be delivered to police in a more digestible form and police need to take more
ownership of scientific research.
Reported measures do not give parliament, road safety stakeholders and the public an
adequate indication of whether traffic enforcement is effective. The WA Police
reported measures are few and the data provided to the public does not tell the whole
road safety story. Road safety measures reported by other agencies are patchy at best

ix
in their ability to enlighten the public as to the effectiveness of initiatives and the
impact that police may be having on our roads.
While police are not solely responsible for the road toll, they are key players in
instituting the behaviour change that is critical to improving safety on our roads. Road
policing is complex and police should be drawing on innovations in research and
technology as much as possible to refine their strategies.


xi
Ministerial Response
In accordance with Standing Order 277(1) of the Standing Orders of the Legislative
Assembly, the Community Development and Justice Standing Committee directs that
the Minister for Police and Road Safety reports to the Assembly as to the action, if any,
proposed to be taken by the Government with respect to the recommendations of the
Committee.


xiii
Findings and Recommendations
Finding 1 Page 18
WA Police does not have a current Road Policing Strategy in place.
Finding 2 Page 44
Intelligence-led policing is well understood and tactical intelligence is used to guide
traffic policing on a daily basis. However, opportunities to translate intelligence and
evidence into strategic and policy changes could be further developed.
Recommendation 1 Page 44
WA Police should ensure that it has sufficient staff in senior intelligence analyst roles in
order to make the best use of intelligence and evidence in guiding traffic-related
strategies. There should be a direct nexus between traffic enforcement tasking and
research findings.
Finding 3 Page 47
It is difficult to define an effective measure of police performance. Accordingly, the
traffic law enforcement KPI provides only a limited measure of the effectiveness of
road policing.
Finding 4 Page 47
There is some evidence to suggest that the perception of a police presence is an
effective tool in modifying road user behaviour, hence the focus of the new police KPI
on the number of contacts with road users. Page 47
Finding 5 Page 48
The Report on Government Services contains useful comparative data for government
planning purposes but has less value as a way for the West Australian community to
evaluate the performance of its police force.
Recommendation 2 Page 48
The Report on Government Services should not be considered a substitute for
thorough reporting in the WA Police annual report.
Finding 6 Page 50
Police-related performance indicators reported by the Road Safety Council and Office
of Road Safety (in relation to Road Trauma Trust Account projects) do not provide a
good indication of the effectiveness of the police in improving road safety. It is not
clear whether post-funding evaluation is undertaken for Road Trauma Trust Account
projects.

xiv
Finding 7 Page 53
The limited information presented in the WA Police annual report means that
parliament, stakeholders and members of the community are unable to make an
informed assessment of police performance in relation to traffic law enforcement and
road safety.
Recommendation 3 Page 53
WA Police should publish relevant and contextual road policing indicators in addition to
the Key Performance Indicator in its annual report, in order to provide a more
comprehensive account of its performance in relation to road safety. Relevant
information is that which would demonstrate outcomes in road safety.
Finding 8 Page 57
There is not enough information presented on the WA Police website and the websites
of road safety organisations to enable parliament, stakeholders and members of the
community to make an informed assessment of police performance in relation to traffic
law enforcement and road safety.
Finding 9 Page 59
There is insufficient sharing of data related to traffic enforcement and road safety.
Recommendation 4 Page 59
In the interests of public data sharing and transparency, the Enhanced Road Safety
Information System should be established, and potentially funded by unallocated funds
currently being held in the Road Trauma Trust Account.
Finding 10 Page 60
The inability to lawfully collect blood samples from road trauma patients limits the
ability of researchers to accurately assess the impact of alcohol and drugs on driving
impairment and road trauma. This is also an important measure for police in assessing
whether drink and drug driving campaigns are effective.
Recommendation 5 Page 60
That the Minister for Police introduces an amendment to the Road Traffic Act (1974) to
enable the lawful collection of blood samples from road trauma patients as a matter of
priority.
Finding 11 Page 64
The number of drug-driving tests currently being performed by WA Police is lower than
in other States and significantly less than recommended in drug-driving studies.

xv
Recommendation 6 Page 65
That WA Police performs at least 90,000 roadside drug tests per year, as per the expert
advice provided in 2012.
Recommendation 7 Page 65
That more drivers who test positive for alcohol are also tested for drugs.
Recommendation 8 Page 65
That the Minister for Police introduces amendments to the Road Traffic Act (1974) to:
establish an offence for the combined use of alcohol and illicit drugs; and
provide for drug driving to attract the same penalty as drink driving.
Finding 12 Page 66
WA spends less on road safety advertising campaigns than most other states, leaving
law enforcement to carry the burden of deterring risky driving behaviour.
Recommendation 9 Page 66
The Minister for Road Safety must ensure that sufficient funds are allocated from the
Road Trauma Trust Account to ensure well-designed and effective road safety
education and media campaigns are able to be consistently implemented.
Recommendation 10 Page 68
The Western Australian driver attitude surveys should be reinstated as a matter of
priority.
Recommendation 11 Page 69
That the unallocated money in the Road Trauma Trust Account be fully allocated to
projects by the end of the 2017 financial year.
Recommendation 12 Page 71
That safeguards be put in place to ensure that Road Trauma Trust Account funding is
not substituted for regular core government agency funding.
Finding 13 Page 77
Police deployment and performance measures should take into account that almost
two-thirds of crashes occur on local roads.
Finding 14 Page 77
The WA Local Government Association (WALGA) saw communication with police as
lacking even though WA Police maintained that it had regular contact with WALGA,
including an intelligence officer who consulted individual local government authorities.

xvi
Finding 15 Page 78
That the findings of the Regional Highway Safety Review being undertaken jointly by
the Office of Road Safety, WA Police and Main Roads be used to inform deployment of
police in the regions.
Finding 16 Page 78
WA Police are key stakeholders in road safety. However, in the absence of clear and
unambiguous performance indicators, police are likely to be held solely responsible for
matters that are the responsibility of others.

1
Chapter 1
Introduction
A brief background to the focus of the inquiry, its establishment and the report
contents.
It is a disgrace that Western Australia incurs such a road toll as we do.
– Professor Murray Lampard, Chair, Road Safety Council
1.1 Inquiry focus
IN 2014 184 people lost their lives on Western Australian roads and another 298 were
critically injured. This was 22 more deaths and 106 more serious injuries than in 2013,
prompting alarm from the community about the safety of the State’s roads. While
there are encouraging signs of improvement in the metropolitan area, there are
ongoing concerns about the disproportionate increase in the road toll in regional areas.
The 2014 toll was in fact more in line with 2012 (183) and 2011 (179), with the 2013
road death toll inexplicably lower than usual. Serious injuries, however, have been in
steady decline for the previous five years, making the 2014 figure the highest since
2009.
While the number of people killed on WA roads is consistent with other States and
Territories in showing an overall downward trend over the past decade, WA is the third
worst performing State in terms of the road fatality rate (per head of population). The
road toll in WA is not decreasing at the same rate as in other States.
Western Australia Police, whilst not the only agency responsible for road safety, plays a
key role in keeping our roads safe. Given that the Committee resolved in November
2014 to inquire into Methods Employed by WA Police to Evaluate Performance, it was
considered appropriate and timely to focus initially on how WA Police evaluates its
performance in relation to road safety.
The Committee examined the performance measures WA Police uses to determine the
effectiveness of traffic law enforcement and road safety initiatives. The inquiry
revolved around three key questions:
How does the agency know if it is making progress in this area?
How does it use performance information to guide its practice?

2
Do the reported measures give parliament, road safety stakeholders and the
public an adequate indication of whether traffic enforcement is effective?
WA Police, as with all government entities, is accountable for the public funds it is
allocated. As such, it is required to report annually on its performance to the
Parliament. A set of key performance indicators (KPIs) forms the backbone of the
report. The success of the WA Police service is assessed on how well it has met the
KPIs.
The Committee’s concern is that activities that do not form part of the audited KPIs
(perhaps because they are not easily measureable) will not be given the attention and
scrutiny they deserve. This concern is raised in the knowledge that the Frontline 2020
police reforms demand that police work more efficiently. Essentially, they are being
asked to do more with fewer financial resources, and this could have an impact on
performance evaluation. Furthermore there is a strong desire from the community and
within police ranks to see a stronger police presence on our roads.
Given that police operations consume the third largest portion of the State budget
after health and education (around five per cent), it is appropriate that at the same
time as new (and in some cases untested) reforms are rolled out, robust measures
are in place to gauge their effectiveness.
Considering the seriousness of the road toll, WA taxpayers need to be assured that WA
Police has strategies in place to measure its effectiveness in road policing.
This report is not necessarily about determining the best road policing strategies, but
about how WA Police go about determining the best strategies. Measuring
performance should be a guide as to what strategies are working and what needs more
attention.
1.2 Establishment of Inquiry
In accordance with its functions and powers (see Appendix 2), the Committee notified
the Speaker of its intention to undertake an Inquiry into the Methods Employed by WA
Police to Evaluate Performance on 26 November 2014.
The Committee resolved to produce a series of reports focussing on different aspects of
police performance. Given across-the-board concern about the road toll in WA at the
start of 2015, the Committee resolved to make the performance of WA Police in regard
to traffic law enforcement and road safety initiatives the focus of its first report.
The Committee advertised for submissions in The West Australian newspaper on 31
January 2015. The advertisement specified that submissions were to pertain only to

3
matters relating to objective measurement of traffic law enforcement and road safety
initiatives (and not to the broader Inquiry).
Letters inviting submissions were also sent to specific relevant organisations or
agencies. The Committee received seven submissions (see list at Appendix 3). The
Committee conducted 11 public hearings with 19 witnesses (see Appendix 4) and was
briefed by WA Police during a visit to the Police Operations Facility in Midland.
1.3 Guide to report
Chapter Two begins with an overview of national road safety governance and strategies
which WA is party to and then outlines the strategies guiding the state, the governance
of road safety in WA, and the various road safety stakeholders in WA. It also provides
an overview of road trauma in WA, and outlines the police responsibility for road
safety.
Chapter Three explores performance measurement – in general, specific to policing,
and then as applied to traffic law enforcement. The final section of the chapter outlines
how WA Police measures its performance, and looks at other measures of WA’s police
performance in relation to road policing.
Chapter Four examines the adequacy of traffic enforcement-related performance
measurement used by police (internal and external) as well as the adequacy of the
reporting of its performance. The third section of this chapter explores some of the
issues that are beyond the control of police, such as insufficient funding and the
withdrawal of road safety programs that would otherwise make the job of road policing
easier. A final section provides a summary discussion of the issues raised in the report
and offers some conclusions.


5
Chapter 2
Road safety in WA
This chapter provides an overview of the national strategy and approach to road
safety, the State’s Towards Zero road safety strategy and the governance of road
safety in WA. A summary of recent road trauma statistics is presented, and the role
of WA Police in road safety and road policing is also outlined.
We have to change what we are doing. We have gone from being, as
we would describe, the best in the class to the worst in the class.
– Will Golsby, RAC Corporate Affairs
2.1 Road safety governance in Australia
THIS year is the midpoint in the Decade of Action for Road Safety 2011-2020, an
initiative of the United Nations’ General Assembly to reduce road trauma.1
The initiative, outlined in the Global Plan for the Decade of Action for Road Safety 2011-
2020, calls on each signatory to implement road safety activities, particularly in the
areas of road safety management, road infrastructure, vehicle safety, road user
behaviour, road safety education and post-crash response.2
2.1.1 National Road Safety Strategy
Australia's National Road Safety Strategy 2011-2020 (NRSS) is closely aligned with the
Global Plan, and it forms an important part of Australia’s response to the Decade of
Action. An agreed national framework, the NRSS presents a 10-year plan to reduce
trauma on Australian roads by at least 30 per cent. In 2013-14 the Office of Road Safety
assumed responsibility for management of the Austroads Safety program. The
Austroads Safety Taskforce facilitated a review of the NRSS. 3
1 United Nations. General Assembly. Resolution 68/269 Improving global road safety. Resolution
adopted by the General Assembly on 10 April 2014. Available at http://www.who.int/roadsafety/decade_of_action/en/ Accessed on 8 May 2015.
2 Global Plan for the Decade of Action for Road Safety 2011-2020. Available at http://bit.ly/1QDFOeN Accessed on 8 May 2015.
3 Road Safety Council, Report on Activities 2013-14, Government of Western Australia, Perth, 2014, p15.
6
In November 2014 a new action plan covering the period 2015 to 2017 was developed
to support the implementation of the NRSS.4
Nineteen actions were identified for priority in the next three years, including the
strengthening of national police enforcement operations to improve road safety
compliance. This was to be achieved by states and territories working with the
Australian and New Zealand Policing Advisory Agency (ANZPAA) to identify and
implement improvements to national enforcement operations. 5
2.1.2 The Safe Systems approach
The Safe Systems approach to road safety underpins road safety strategies in all
Australian jurisdictions. Created specifically for Australia and New Zealand, the Safe
Systems approach to road safety combines the best elements of the Swedish Vision
Zero and the Dutch Sustainable Safety road safety philosophies.
A Safe Systems framework recognises human fallibility and vulnerability. It accepts that
people take risks that can lead to deaths and serious injury, and also acknowledges that
there are physical limits to the amount of force the body can take before injury occurs.6
The cornerstones of the Safe Systems approach are:
Safe Road Use – influencing road user behaviour;
Safe Roads and Roadsides – improving road infrastructure;
Safe Speeds – enhancing speed enforcement and reviewing speed limits; and
Safe Vehicles – promoting the uptake of safer vehicles and key safety features.7
These are reflected in the whole-of-government Towards Zero Road Safety Strategy
2008-2020, endorsed by the WA Government in 2009.
Main Roads has the lead responsibility for the Safe Roads and Roadsides cornerstone
and the setting of safe speed limits component of the Safe Speeds cornerstone.8 WA
Police contributes to the Safe Speeds and Safe Road Use cornerstones.9
4 Transport and Infrastructure Council, National Road Safety Action Plan 2015-2017. Available at:
http://bit.ly/1F3AmLC Accessed on 19 February 2015. 5 ibid. 6 Road Safety Council, Report on Activities 2013-14. Government of Western Australia: Perth, WA,
2014, p4. 7 ibid. 8 Mr Des Snook, Executive Director, Road Network Services, Main Roads, Transcript of Evidence, 25
February 2015. 9 WA Police, Annual Report 2013-14, Government of Western Australia: Perth, WA, 2014, p105.

7
2.2 Road safety governance in Western Australia
2.2.1 Towards Zero
In 2009 the WA government released a new plan for road safety in Western Australia,
with the ambitious aim of reducing road trauma by 40 per cent. The Towards Zero Road
Safety Strategy 2008-2020 was described as a “living strategy”, in that it would
continue to take advantage of new developments in technology and research in road
safety in its bid to prevent 11,000 people from being killed or seriously injured in the
12-year period to 2020.10
During the development of the strategy, the Road Safety Council estimated that full
implementation of the strategy would require an additional investment of $200 million
per year for 12 years.11
2.2.2 Ministerial responsibility
It is now nearly 20 years since the Select Committee on Road Safety recommended
establishing ministerial responsibility for road safety, a ministerial council, a road safety
board, and an organisation identifiable by the community as having primary
responsibility for road safety in Western Australia.12
It was not until 2008 that road safety became a portfolio in its own right, with the then
Minister for Police also taking on the role of Minister for Road Safety. Prior to 2008,
ministerial responsibility for road safety had been assumed by the Minister for
Transport, the Minister for Planning and Infrastructure within the portfolio of
Community Safety (in 2001), and the Minister for Police (when responsibility for the
Community Safety portfolio was transferred).13
A Ministerial Council was established in 1995 comprising the Ministers for Health,
Education and Local Government and chaired by the Minister for Transport. Its role was
to liaise and co-ordinate the activities of agencies to ensure that the recommendations
of the Road Safety Council were implemented.14
10 Hon Rob Johnson, Minister for Road Safety, WA, Legislative Assembly, Parliamentary Debates
(Hansard), 19 March 2009, p2179. 11 Road Safety Council, Report on Activities 2013-14, Government of Western Australia: Perth, WA,
2014, p4. 12 Select Committee on Road Safety, Administration and coordination of road safety in Western
Australia (Chair: Ainsworth), Legislative Assembly, Perth, WA, 1995.. 13 Peter Browne Consulting, Review of Road Safety Governance, Government of Western Australia,
Perth, WA, March 2014. 14 Wiese, Bob and Charlton, Eric, Minister given responsibility for road safety, Media Statement,
Available at: http://bit.ly/1HgWsjN Accessed on 18 May 2015.

8
Since then, membership of the ministerial council has expanded to include police, road
safety, regional development and planning.15
2.2.3 The Road Safety Council
The Road Safety Council (RSC) was established in 1997 as a statutory body to
coordinate the development and implementation of policy and strategies to improve
road safety in Western Australia. It replaced the Road Traffic Board.
The role of the RSC is to identify and recommend measures to reduce road trauma in
WA and to make recommendations to the Minister for Road Safety on how funds in the
Road Trauma Trust Account (RTTA) should be expended.16
The members of the RSC, appointed by the Minister, include a Chairman and
representatives from the departments of education, health, planning and transport,
the Insurance Commission of Western Australia, the Office of Road Safety, WA Police, a
representative of road users (the Royal Automobile Club of Western Australia), and a
representative of local government (Western Australian Local Government
Association).
2.2.4 The Office of Road Safety
Since its establishment in 1997, the Office of Road Safety (ORS) has had many host
agencies including the Department of Transport, the Department for Planning and
Infrastructure and the Department of the Premier and Cabinet (2002-09). Main Roads
(which is part of the Department of Transport) took on administrative responsibility for
ORS in July 2009.17
The ORS supports and coordinates the road safety effort in WA. The ORS acts as the
lead road safety agency responsible within government for leading, developing,
coordinating, promoting and monitoring the Towards Zero strategy.
The ORS is responsible for providing road safety advice based on research, evidence
and community engagement. It manages road safety education campaigns, partnership
programs and community consultation. It manages and provides administrative
support to the RSC. The ORS is also responsible for administering monies allocated to
the RTTA.18
15 Road Safety Council, Report on Activities 2013-14, Government of Western Australia: Perth, WA,
2014. 16 ibid. 17 Peter Browne Consulting, Review of Road Safety Governance, Government of Western Australia,
Perth, WA, March 2014. 18 Office of Road Safety, About Us. Available at: http://www.ors.wa.gov.au/Office-of-Road-Safety.
Accessed on 18 May 2015.
9
2.2.5 The Road Trauma Trust Account
The Road Trauma Trust Account (RTTA) holds the revenue generated by photographic-
based speed and red light camera infringements. Funds are used for road safety
initiatives, as allocated by the RSC.
An amendment to the Road Safety Council Act 2002 in August 2011 increased the
hypothecation of speed camera infringements into the RTTA to 100 per cent,
effectively tripling the amount that previously flowed into the account.
According to the RSC:
This increased investment has enhanced the State’s ability to deliver
quality road safety measures that will lead to significant and lasting
improvement in road trauma.19
The RSC recommended that the majority of RTTA funds be directed into six key priority
areas consistent with the Towards Zero strategy. 20
Of the $111 million allocated in 2015-16, $18 million was allocated to WA Police
projects. (See Appendix 7 for full list of RTTA funding for 2015-16.)
Concerns have been raised about the amount of funds in reserve which remain
unallocated each year. The RAC has lamented that:
The current $80 million in unspent funds is not contributing to better
road safety outcomes; despite WA having the worst fatality rate of any
mainland state.21
There are also differing views as to whether RTTA funds should be used only for road
safety measures or if they should allowed to be used for administration costs
associated with road safety, such as the administration of fines by WA Police. 22
2.2.6 The Browne Review
In 2013 the State Government commissioned a review of the road safety governance
framework, in recognition of the fact that the structure had been in place since 1996
and had not been modified to manage the increase in funding resulting from the 100
per cent hypothecation of speed and red light camera infringements.
19 Road Safety Council, Report on Activities 2012-13. Government of Western Australia: Perth, WA,
2013, p4. 20 ibid. 21 RAC, RAC response to the review of Road Safety Governance in Western Australia, October 2014
p2. Available at: http://bit.ly/1HgWb0b Accessed on 20 May 2015. 22 Mr Will Golsby, General Manager, Corporate Affairs, RAC, Transcript of Evidence, 23 February
2015.

10
The review, conducted by consultant Peter Browne (and hence commonly referred to
as the Browne Review), was tabled in September 2014 and made 56 recommendations.
The Government released its response to the review in March 2015, broadly accepting
all recommendations. A key recommendation was to establish the position of
Commissioner for Road Safety, reporting directly to the Minister for Road Safety.
Under the new model to be adopted, the Office of Road Safety will become the Office
of the Commissioner for Road Safety and the Road Safety Council will become the Road
Safety Advisory Council and include road safety experts in its membership.
The appointment of an interim Commissioner for Road Safety, who will oversee the
restructuring of the ORS, was announced on 3 June 2015.
The restructure does not materially alter the imperative for police to have
unambiguous performance indicators – and in fact this may be demanded by the new
commissioner.
2.3 Road trauma in WA
WA has an expansive road network: 13,490km of state roads, 130,820km of local roads,
5111km of national land transport routes and 127,000km of unsealed roads.23
Once lauded as the second best Australian jurisdiction in terms of road fatality rate per
head of population, WA now stands as the third worst performing jurisdiction ahead of
only the Northern Territory and Tasmania. 24
2.3.1 People killed and seriously injured
The road toll is often discussed in terms of fatalities but also of concern is the high
number of serious injuries arising from road trauma. Dr Sudhakar Rao, director of the
State Trauma Unit at Royal Perth Hospital, told the Committee:
We focus a lot on trauma deaths but for every death, about 11 people
are permanently injured and never go back to normal life. For every
death there are about another 50 who are admitted to hospital for the
long term. There is a big health cost. There is a big societal cost as
well.25
23 Office of Road Safety, Preliminary Fatal and Critical Injuries on Western Australian Roads: 2014
Summary. Available at: http://bit.ly/1KjEE8C Accessed on 22 May 2015. 24 Road Safety Council, Report on Activities 2013-14, Government of Western Australia: Perth, WA,
2014, p4. 25 Dr Sudhakar Rao, Director of State Trauma, Royal Perth Hospital, Transcript of Evidence, 11
March 2015.

11
WA has the highest rate of spinal cord injuries in Australia.26 Residual disability arising
from head and spinal cord injuries has a profound impact on the WA community. Dr
Rao told the Committee that despite 20 years of research into head injuries, there is
still no single treatment that changes the outcome.
They are young, productive members of society who pay taxes but as
soon as they have an injury, they go from being a productive person to
actually being someone who depends on the state to keep them alive
and well, and they become a huge cost to the state.27
Road trauma poses a significant cost to society both socially and financially.28 This
“ripple effect” impacts not only the crash victim, but also their friends, family, carers,
employers, sporting clubs and the community in general.29
Road trauma is estimated to cost Western Australia approximately $2.5 billion per
annum.30 Figures from the Australian Institute of Health and Welfare reveal that
treatment associated with road trauma cost $38.8 million in 2006-7, rising to $50.6
million in 2012-13. The average cost per patient is estimated to be $9800.31
2.3.2 What do the statistics tell us?
Despite recording the fewest fatalities since 1961 in 2013, WA’s road toll is reducing at
a substantially slower pace than that of most other jurisdictions.32 While WA’s fatality
rate has reduced significantly since 2001, it is still higher than the trend required to
meet the goal identified in the Towards Zero strategy.33
26 Royal Perth Hospital, 2013 Trauma Registry Report, Department of Health: Perth, WA, 2014. 27 Dr Sudhakar Rao, Director of State Trauma, Royal Perth Hospital, Transcript of Evidence, 11
March 2015. 28 Ferris, J., Mazerolle, L., King, M., Bates, L., Bennett, S., & Devaney, M. ‘Random breath testing in
Queensland and Western Australia: examination of how the random breath testing rate influences alcohol related traffic crash rates’. Accident Analysis and Prevention, 2013, no.60, pp181-188.
29 McIntosh, J.L. & Howe, C.L., ‘Road Safety Management in Australia: Building capacity through coordinated action’, Proceedings of the 2014 Australasian Road Safety Research, Policing & Education Conference 12–14 November, Grand Hyatt Melbourne.
30 This value is based on five-year data for the period 2008-2013. It is based on the ‘willingness to pay’ model which WA adopted in 2010. This WTP valuation was obtained using the New South Wales Road Traffic Authority’s ‘Economic valuation of Safety Benefits: Serious Injuries – Final report’. The figures were adjusted to account for Perth-specific CPI for the end of the June quarter 2013. Cited in: Road Safety Council, Report on Activities 2013-14, Government of Western Australia: Perth, WA, 2014, p31.
31 Hon Alyssa Hayden, Parliamentary Secretary representing the Minister for Health, WA, Legislative Council, Parliamentary Debates (Hansard), 21 April 2015, p2430.
32 Peter Browne Consulting, A Review of Road Safety Governance in Western Australia, March 2014, p2.
33 Office of Road Safety, Preliminary Fatal and Critical Injuries on Western Australian Roads: 2014 Summary, p5. Available at: http://bit.ly/1KjEE8C Accessed on 18 May 2015.

12
Regretfully WA has more fatalities per 100,000 persons than the national fatality rate:
7.2 compared to 4.9. 34
In 2014 there were 184 fatalities and 298 critical injuries on WA roads.35 This
represents an increase on the preceding five-year average (2009-2013) of 181 fatalities
and 259 critical injuries.36
Table 1: Fatalities and critical injuries, WA, 2009-2014.
2009 2010 2011 2012 2013 2014
Fatalities 191 193 179 182 161 184
Critical injuries 366 290 244 201 192 298 TOTAL 557 483 423 383 353 482
Data sourced from: Office of Road Safety, Preliminary Fatal and Critical Injuries on Western Australian Roads: 2014
Summary.
2.3.3 Differences in metropolitan and country road trauma
The geographic characteristics of road trauma in Western Australia are worthy of note.
While there have been decreases in the number of fatalities and critical injuries in
recent years, this is not distributed
equally across the metropolitan
and regional areas.37
In 2014, for example, 56 per cent
of fatalities occurred outside the
Greater Perth area, despite only
22 per cent of the population
living there. The fatality rate in
Greater Perth is approximately 4.4 whilst the fatality rate for the population outside
Greater Perth is approximately 20.38
The fatality rate in the Wheatbelt is particularly alarming. In 2014 the Wheatbelt police
district had the highest fatality rate per 100,000 persons at 49.8. This is in stark
contrast to the North West Metropolitan District which had the lowest rate at 3.2
fatalities per 100,000 persons.39
34 Office of Road Safety, Preliminary Fatal and Critical Injuries on Western Australian Roads: 2014
Summary, p5. Available at: http://bit.ly/1KjEE8C Accessed on 18 May 2015. 35 ibid. 36 The ORS report notes that this increase occurred at a time when Western Australia experienced
population growth and an increase in the number of vehicle kilometres travelled, registered vehicles and licensed motor vehicle drivers.
37 Submission No.3 from RAC, 20 February 2015. 38 ibid. 39 Office of Road Safety, Preliminary Fatal and Critical Injuries on Western Australian Roads: 2014
Summary, p6. Available at: http://bit.ly/1KjEE8C Accessed on 18 May 2015.
… in smaller communities … it is really
personal – every person who is injured or
killed in a crash is known by everyone in
that community.
– Terri-Anne Pettet,
WALGA RoadWise Program Manager

13
While location influences factors that will likely impact on the trauma outcome (such as
distance from a hospital and medical assistance), Dr Rao notes also that “speeds seem
to be higher, the rate of non-seatbelt use is higher… and the rate of alcohol use is high”
in regional WA.40
Table 2: Indicative fatality rates per 100.000 persons and fatality counts by WA Police District,
2014
Police District Fatality
per 100, 000 Fatalities (count)
Regional WA
Wheatbelt 49.8 26
Goldfields-Esperance 28.6 17
Great Southern 27.6 22 Kimberley 16.7 6
South West 14.1 23
Mid West-Gascoyne 10.9 7
Pilbara 6.3 4
Metropolitan WA
Central Metropolitan 5.9 22
South Metropolitan 4.8 22 South East Metropolitan 4.1 16
North West Metropolitan 3.2 19
Note: Rate denominators were prepared for the WA Police by the Australian Bureau of Statistics and are population counts for 2011 by WA Police district. Data sourced from: Office of Road Safety, Preliminary Fatal and Critical Injuries on Western Australian Roads: 2014 Summary.
2.3.4 Vulnerable road users
In 2014, vulnerable road users, such as motorcyclists, pedestrians and cyclists featured
prominently in the road toll.41 While the proportion of motor vehicle occupant fatalities
has decreased from 71 per cent (or 135 people) in 2009 to 63 per cent (or 114 people)
in 2014, the trend has not been replicated in the overall number of road fatalities in
2014, due to the higher number of other types of fatalities. 42
Motorcyclists
The proportion of motorcyclist fatalities comprising the road toll has increased from 16
per cent in 2009 to 24 per cent in 2014.43 In 2014, 44 motorcyclists were killed and 61
were critically injured as a result of crashes in WA. Almost 60 per cent of the fatalities
and 70 per cent of the critical injuries were due to crashes in the metropolitan area.
40 Dr Sudhakar Rao, Director of State Trauma, Royal Perth Hospital, Transcript of Evidence, 11
March 2015. 41 Submission No.3 from RAC, 20 February 2015. 42 Office of Road Safety, Preliminary Fatal and Critical Injuries on Western Australian Roads: 2014
Summary, p6. Available at: http://bit.ly/1KjEE8C Accessed on 18 May 2015. 43 ibid.

14
Almost all of the motorcyclist fatalities and critical injuries were male, with the majority
aged 25 years or older.44
Table 3: Fatalities by road user type, WA 2009-2014.
Road user type 2009 2010 2011 2012 2013 2014
Motor vehicle occupant 135 138 122 122 96 114
Motorcyclist (inc. pillion) 31 35 28 34 25 43
Cyclist (inc. pillion) 0 4 3 3 6 9
Pedestrian 25 15 26 24 31 18
Other 0 1 0 0 4 0
TOTAL 191 193 179 183 162 184
Data sourced from: Office of Road Safety, Preliminary Fatal and Critical Injuries on Western Australian Roads: 2014
Summary.
Cyclists
Also increasing over time were the number of cyclist fatalities: from zero in 2009 to
eight in 2014.45 Eighteen cyclists were critically injured as a result of crashes on WA
roads in 2014. This equates to an increase of 19 per cent on the five-year average.
All of the fatalities and 15 of the 18 critical injuries occurred in the metropolitan area.
Three-quarters of the cyclist fatalities and 14 of those critically injured were male, and
most were aged 20 years or older. 46
Pedestrians
While heartening to know that there was a reduction in the number of pedestrians who
lost their lives over the past five years, it is concerning that in 2014, 17 people died on
WA roads.47
2.4 Police and responsibility for road safety
No one organisation or person is tasked with sole responsibility for road safety in WA.
It is now widely acknowledged that this shared responsibility poses a challenge for the
effectiveness of the road safety sector.
A government commissioned review (the Browne Review) tasked with assessing the
“appropriateness and effectiveness” of the road safety structures in WA found that:
…the governance structure was in significant need of change in order
to bring about a challenge to current thinking towards road safety,
44 Office of Road Safety, Preliminary Fatal and Critical Injuries on Western Australian Roads: 2014
Summary, p6. Available at: http://bit.ly/1KjEE8C Accessed on 18 May 2015. 45 ibid. 46 ibid., p15. 47 ibid., p6.

15
and to revitalise the current environment into one in which all road
safety related agencies work collaboratively with an increased sense of
commitment and accountability.48
As a representative of Main Roads pointed out, road safety in WA relies on “everyone
doing their bit”49 – a sentiment echoed by the chair of the RSC –
One of my concerns … is that so few do so much in the road safety
space. The time is long overdue for more government agencies to put
their shoulders to the wheel and show an interest in road safety. 50
– and also the WA Police:
Firstly, can I say the road toll is a whole-of-government response,
whole-of- community response; law enforcement is but one aspect of
it.51
2.4.1 Frontline 2020 policing model
In 2011 the Department of Treasury and Finance commissioned Price Waterhouse
Coopers to complete a value for money review of the WA Police. Arising from the
review was a suggestion that WA Police redesign its operating model.52
A new policing model, Frontline 2020, was introduced to the Perth metropolitan region
in December 2014 “…to address the increase in demand for policing services, improve
frontline policing and build stronger links with local communities by addressing crime
at its cause”.53 A roll-out of Frontline 2020 into regional areas is also underway.54
WA Police is also looking into its Service Definition and Resource Model (SDRM). Part of
this process includes identifying cases where fully sworn officers are in positions that
do not require sworn powers. WA Police executive director Anthony Kannis said the
SDRM would deliver an evidence-based framework to assist with future resource
allocations and deployment.55
48 Peter Browne Consulting, A Review of Road Safety Governance in Western Australia, March 2014,
pp1-2. 49 Mr Des Snook, Executive Director, Road Network Services, Main Roads, Transcript of Evidence, 25
February 2015, p5. 50 Professor Murray Lampard, Chair, Road Safety Council, Transcript of Evidence, 23 February 2015. 51 Mr Nick Anticich, Assistant Commissioner Traffic and Emergency Response, WA Police, Transcript
of Evidence, 3 March 2015, p3. 52 WA Police, Briefing, 14 November 2014. 53 Hon Liza Harvey, Minister for Police, WA, Legislative Assembly, Parliamentary Debates (Hansard),
18 February 2015, p289. 54 Hon Liza Harvey, Minister for Police, WA, Legislative Assembly, Parliamentary Debates (Hansard),
13 May 2015, p3616. 55 Mr Anthony Kannis, Executive Director, WA Police, Transcript of Evidence, 3 March 2015.

16
The Perth metropolitan region now comprises four policing divisions, each with a
minimum of 500 officers and forecast to reach 550 officers by 2017. Officers in each
district are organised into two large response teams, local policing teams and two
detective teams.56
Each district has a control centre that operates 24 hours a day, seven days a week. The
district control centre oversees the operation of a district, develops and prioritises local
strategies and directs police response. The response teams run on demand-based
rosters and their activity is coordinated by the district control centre. The local policing
teams focus on local problem solving in dedicated suburbs of responsibility.57
Each of the policing districts is supported by the regional operations group and the
traffic enforcement group, both of which have operational responsibilities for the
entire metropolitan area.58
2.4.2 Road policing
Road policing is central to modifying driver behaviour and enhancing road safety. The
establishment of traffic laws, the policing of those laws and the application of penalties
and sanctions to offenders serve to achieve the two functions of road policing:
apprehension and deterrence.59
Road policing is mainly concerned with a common theory applied in traffic psychology
known as deterrence theory which focuses on the effect of enforcement activities and
legal sanctions on behaviour.60
Deterrence can be achieved in two ways: general and specific.61 There are many
examples of the positive relationship between the principles of deterrence theory and
risky driving behaviours, including drink-driving, drug-driving, driving an unlicensed
vehicle and speeding.62
56 Hon Liza Harvey, Minister for Police, WA, Legislative Assembly, Parliamentary Debates (Hansard),
18 February 2015, p289. 57 ibid. 58 ibid. 59 Bates, L.., Soole, D. and Watson, B., ‘The Effectiveness of Traffic Policing in Reducing Traffic
Crashes’, in Tim Prenzler (ed.), Policing and Security in Practice, Palgrave Macmillan, UK, 2012. 60 ibid. 61 Prof Max Cameron, Monash University Accident Research Centre, Transcript of Evidence, 25
March 2015. 62 Bates, L., Soole, D. and Watson, B. ‘The effectiveness of traffic policing in reducing traffic
crashes’, Policing and Security in Practice: Challenges and Achievements, in Tim Prenzler (ed.), Palgrave Macmillan, United Kingdom, 2012.
17
The Committee heard that there is a distinction between traffic law enforcement
(which largely relies on general deterrence strategies) and non-traffic crime policing. 63
Road policing focuses on detecting and deterring behaviours associated with risk, such
as the risk of being involved in a crash. It does not, however, necessarily influence
behaviours directly resulting in harm to people or property. 64
Non-traffic crime policing on the other hand is aimed at offences that generally involve
behaviours directly resulting in harm to individuals or property (except in so-called
“victimless” crimes).65
The Committee heard that effective traffic policing must involve both covert and overt
operations.66 Traffic law enforcement operations must be “sufficiently intensive,
unpredictable in nature and conducted as widely as possible across the road network”
to increase the perceived and actual risk of detection.67
63 Prof Max Cameron, Monash University Accident Research Centre, Transcript of Evidence, 25
March 2015. 64 Cameron, M.H. and Sanderson, J.T. Review of police operations for traffic law enforcement.
Report No. TS 82/5, Traffic and Safety Department, Royal Automobile Club of Victoria Ltd, 1982. 65 ibid. 66 Prof Max Cameron, Monash University Accident Research Centre, Transcript of Evidence, 25
March 2015. 67 Bates, L., Soole, D. and Watson, B. ‘The effectiveness of traffic policing in reducing traffic
crashes’, Policing and Security in Practice: Challenges and Achievements, in Tim Prenzler (ed.), Palgrave Macmillan, United Kingdom, 2012, p90.
Difference between general deterrence and specific deterrence
General deterrence uses fear of detection (and its consequences) to try to influence drivers
not to offend, while specific deterrence relies on the experience of apprehension and its
consequences to encourage drivers not to re-offend. Random breath testing operations are
aimed at general deterrence, while targeted breath testing of drivers (i.e. at locations and
times people are more likely to offend) is aimed at specific deterrence.
In terms of speed enforcement, if the aim is general deterrence (raising the fear of
detection) then the perception of being caught at any place at any time needs to be created.
This is best achieved by covert speed enforcement (cameras/radars not intended to be seen
by motorists) which can be moved to many undisclosed locations. Overt (visible)
enforcement tends to have only a local effect –- an immediate impact at the specific location
of the speed camera.

18
2.4.3 Road policing in WA
According to WA Police “…most traffic enforcement is undertaken by specialist traffic
police attached to the local district traffic office or from units within State Traffic
Operations, such as the Traffic Enforcement Group (TEG)”.68
Road policing in WA has been guided by the Road Policing Strategy 2011-2014, which
superseded the Traffic Policing Strategy 2008-2010. The Strategy (now expired) states
that:
…through WA Police efforts, road users will be made accountable for
any unlawful road-user behaviour, anywhere and at any time.69
The Road Policing Strategy identifies three objectives which WA Police are guided by:
enforcement of traffic laws;
targeting unsafe road user behaviour; and
building road policing capability.
A new draft strategy is currently being contemplated by the board within WA Police as
a matter of priority, according to Assistant Commissioner (Traffic and Emergency
Response) Nick Anticich.70
Finding 1
WA Police does not have a current Road Policing Strategy in place.
The Committee was advised that within State Traffic there are 540 personnel71
(constituting around 10 per cent of the WA Police workforce) who work across the
various dimensions of traffic enforcement. Of this number, 230 sworn officers are
employed in the Traffic Enforcement Group (TEG) and a small number are employed in
other units. Unsworn officers are employed in areas such as camera operations and the
Infringement Management Office.72
Conducting RBTs to detect alcohol and illicit drugs is a major activity for the traffic
command. WA Police has a target of one million RBTs per year, according to Deputy
68 WA Police, Traffic enforcement. Available at: http://bit.ly/1Mh7yoq Accessed on 30 April 2015. 69 WA Police, Road Policing Strategy 2011-2014, Government of Western Australia: Perth, WA,
2011. 70 Mr Nick Anticich, Assistant Commissioner Traffic and Emergency Response, WA Police, Transcript
of Evidence, 3 March 2015. 71 As at February 2015. 72 G.E. Dreibergs, Deputy Commissioner, Specialist Services, WA Police, Letter – Answers to
Questions on Notice, 18 March 2015.

19
Commissioner Stephen Brown.73 In 2013 police conducted 1,130,519 random and
preliminary tests, with 1,089,757 tests conducted in 2014.74
According to the Office of Road Safety, this equates to roughly 0.66 tests per driver (or
around two for every three licensed drivers). The Victorian rate is almost one for every
licensed driver.75
A study led by Monash University Accident Research Centre researcher Professor Max
Cameron has found that “general deterrence through the perceived risk of detection is
maximised by operations that appear to cover broad areas and both minor and major
roads … are highly visible and test a substantial proportion of passing motorists”. The
cost-benefit study found that breath testing rates could increase to 1.5 per licensed
driver per year and remain cost-effective.76
However, Mr Anticich told the Committee that what police were doing currently was
“more than sufficient”.77
WA Police said placement of bus-based RBTs (“booze buses”) supported the strategy of
general deterrence while more targeted car-based testing supported the strategy of
specific deterrence. Determining where to conduct RBTs was based on a number of
factors, including complaints from the public, the sites of fatal crashes (which might be
linked to a specific drinking location), events likely to attract drinkers, and the practical
considerations of where a bus could be placed safely and without causing congestion.
Since December 2014, the Minister for Police has announced a number of strategies
aimed at reducing the road toll:
a motorcycle safety review working group to assess motorcycle crashes from
2009-2013;
the Regional Highway Safety Review (being trialed in the Wheatbelt), whereby
representatives of road safety agencies travel notorious sections of highway
and identify measures to improve safety;
the purchase of four more speed cameras for the five fixed camera sites on the
freeway and Roe Highway, which had shared one camera on a rotational basis.
73 WA Police, Briefing, Operations Support Facility, Midland, 13 May 2014. 74 G.E. Dreibergs, Deputy Commissioner, Specialist Services, WA Police, Letter – Answers to
Questions on Notice, 18 March 2015. 75 Mr Iain Cameron, Executive Director, Office of Road Safety, Letter, 6 March 2015. 76 Cameron, M., ‘Best practice in random breath testing and cost-effective intensity levels’, Monash
University Accident Research Centre, submitted for presentation at International Conference on Alcohol, Drugs and Traffic Safety, Brisbane, 2013.
77 Mr Nick Anticich, Assistant Commissioner Traffic and Emergency Response, WA Police, Transcript of Evidence, 3 March 2015, p20.

20

21
Chapter 3
Performance measurement
This chapter gives an overview of performance measurement, the role of evidence in
evaluating police performance, and how it is applied in the context of traffic law
enforcement. Performance indicators used by WA Police are outlined, as well as
other measures used in assessing road safety effectiveness.
… well-designed systems of performance indicators are an essential
part of holding the police accountable to government, civil society, and
the public at large.
– Robert C. Davis, RAND Center on Quality Policing
3.1 What is performance measurement and why is it necessary?
MEASURING and reporting on the performance of public sector organisations is a well-
established practice. Its importance increased during the 1980s and 1990s with a new
style of public service (often referred to as New Public Management or NPM) which
emphasised efficiency (doing more with less), better performance at the managerial
level and increased accountability.78
The most commonly cited reasons for public sector performance measurement are:
Accountability – being able to demonstrate to both the Parliament and the
public (taxpayers) that funds provided by the government have been acquitted
effectively and efficiently. Government agencies must be both financially
accountable and accountable for program objectives.
Transparency – ensuring the public availability of data that clearly shows the
link between revenue and expenditure, and enables a comparison of planned
and actual performance.
Performance measurement can also:
Assist agencies to monitor their performance;
Encourage improvements in service delivery and effectiveness;
78 Collier, P., 'In Search of Purpose and Priorities: Police Performance Indicators in England and
Wales', Public Money and Management, vol. 26, no. 3, 2006, p165; Fleming, J. and A. Scott, 'Performance Measurement in Australian Police Organizations', Policing, vol. 2, no. 3, 2008, p322.

22
Help to clarify objectives and responsibilities;
Help governments to coordinate policy within and across agencies79
As noted in the National Commission of Audit’s Towards Responsible Government
report published in 2014, while the private sector exists to maximise shareholder value
(by satisfying the customer), the public sector aims to create public value – an outcome
that is much more difficult to measure than shareholder value. 80
While “bottom line” financial accountability data can provide an indication of how well
the government has managed public funds, it is not a measure of public value or public
sector performance.81
Key Performance Indicators
A common way to collect public sector performance information is by employing a set
of Key Performance Indicators (KPIs). KPIs should provide a substantial overview of the
operations and material expenses of the agency and its subsidiaries or related bodies.82
In WA, public sector KPI reporting is based on a legislative and regulatory framework.83
KPIs must be submitted to and audited by the Auditor General, and be clearly identified
in the annual report as the audited KPIs.84 Agencies are required to submit changes in
outcomes, services and KPIs to the Under Treasurer for approval. This occurs during the
budget process.85
Compliance requirements on the creation and reporting of KPIs for State Government
agencies are contained in Department of Treasury’s Financial Administration Bookcase
79 SCRGSP (Steering Committee for the Review of Government Service Provision) 2015, Report on
Government Services 2015, vol. A, Approach to performance reporting, Productivity Commission, Canberra, January 2015, p1.4.
80 National Commission of Audit, Towards Responsible Government – The Report of the National Commission of Audit Phase Two, Commonwealth of Australia, Canberra, March 2014, p64.
81 ibid. 82 Department of Treasury, Financial Administration Bookcase, update no.73, Government of
Western Australia, 5 December 2014. Available at: www.treasury.wa.gov.au/cms/content.aspx?id=551. Accessed on 1 April 2015.
83 Auditor General WA, Beyond Compliance: Reporting and managing KPIs in the public sector, Government of Western Australia, Perth, April 2012, p12.
84 Department of Treasury, Financial Administration Bookcase, update no.73, Government of Western Australia, 5 December 2014. Available at: www.treasury.wa.gov.au/cms/content.aspx?id=551. Accessed on 1 April 2015.
85 Auditor General WA, Beyond Compliance: Reporting and managing KPIs in the public sector, Government of Western Australia, Perth, April 2012, p13.

23
(FAB), under Treasurer’s Instructions.86 According to Treasurer’s Instruction 904 (Key
Performance Indicators), KPIs should:
(i) be relevant - that is, logically related to the needs of stakeholders, and related to
clearly defined agency-level outcomes and services that communicate what is to be
measured and assist with resource allocation decisions;
(ii) be appropriate – that is, enable users to assess an agency’s performance; they
should reveal whether an agency has achieved predetermined targets, trends in
performance, and performance relative to similar service providers. Appropriate
indicators “reduce the risk of distorting the incentives of agencies”, such as
focusing on “a large number of less severe cases (e.g. health or criminal) where
better results could be achieved by focusing on a smaller number of more severe
cases”; and
(iii) fairly represent indicated performance – that is, be free from bias and be
measurable so that they can be verified by independent experts.
The NPM focus on accountability has led to the development of performance
measurement frameworks based around outputs (or goods and services provided) and
outcomes (the effect of the goods and services provided).87
Agencies are required to create indicators to measure effectiveness for each outcome
and efficiency for each output/service.
Key effectiveness indicators “provide information on the extent of achievement of an
agency level government desired outcome through the delivery of a service or services;
… An outcome may be influenced by the services of a number of agencies, other levels
of government and external influences such as cost pressures and demographic
changes. Consequently, effectiveness needs to be reported with narrative and not
simply in numerical form.”88
Key efficiency indicators “relate a service to the level of resource input required to
deliver it …. While the most common efficiency indicator focuses on financial resources,
86 Department of Treasury, Financial Administration Bookcase, update no.73, Government of
Western Australia, 5 December 2014. Available at: www.treasury.wa.gov.au/cms/content.aspx?id=551. Accessed on 1 April 2015.
87 Australian Institute of Criminology, A tough nut to crack: Performance measurement in specialist policing, Technical and Background Paper 53, prepared by Zhivan Alach and Charl Crous, Australian Institute of Criminology, Canberra, 2012, p.3.
88 Department of Treasury, Financial Administration Bookcase, update no.73, Government of Western Australia, 5 December 2014. Available at: www.treasury.wa.gov.au/cms/content.aspx?id=551. Accessed on 1 April 2015.

24
e.g. per unit cost and per capita cost, other examples could be improved service quality
or timeliness.”89
Treasurer’s Instruction 903 (Agency Annual Reports) indicates that KPIs are to be
reported on in an agency’s annual report. This section of the report should include (at
least) a summary of actual performance relative to target performance. It should also
contain an explanation of the results and describe the agency’s performance, including
any material variations and the impact of any external factors.
Agencies are also at liberty to include other performance information, such as longer
term trends and supporting footnotes, if considered useful in explaining the agency’s
performance and financial results.90 In fact, this is something that has been actively
encouraged, according to the Office of the Auditor General.91
The Auditor General expects that annual reports will provide sufficient and clear
information on KPIs to be useful to Parliament and the general reader.
They should clearly define the relationship between the KPIs, agency
level outcomes and services, and government goals. Each KPI should
be described and it should be clear how it measures performance
against outcomes or services. The report should explain how the KPI
was calculated, why a particular target was set and any material
variance between expected performance and actual performance.92
3.1.1 Problems with performance measurement
It has long been recognised that performance measurement may result in “a
concentration both on what is easily measured and what is susceptible to narrowly
defined efficiency changes”.93
It has also been suggested that performance measurement may be as much about
appearances as about real improvement of performance, with organisations simply
89 Department of Treasury, Financial Administration Bookcase, update no.73, Government of
Western Australia, 5 December 2014. Available at: www.treasury.wa.gov.au/cms/content.aspx?id=551. Accessed on 1 April 2015.
90 ibid. 91 Mr Vincent Turco, Senior Director, Financial Audit, Office of the Auditor General, Transcript of
Evidence, 6 May 2015, p16. 92 Auditor General WA, Beyond Compliance: Reporting and managing KPIs in the public sector,
Government of Western Australia, Perth, April 2012, p15. 93 Australian Institute of Criminology, A tough nut to crack: Performance measurement in specialist
policing, Technical and Background Paper 53, prepared by Zhivan Alach and Charl Crous, Australian Institute of Criminology, Canberra, 2012, p4.

25
“dressing up” existing statistics as performance indicators, rather than developing
specific frameworks.94
WA public sector KPI reporting was reviewed by the Auditor General in 2011-12 to
determine whether agencies were making the best use of KPI information. According to
the review, agencies often struggled to set well-based targets to measure against, and
to make sure KPIs covered all areas of agency activity.95
Among the other findings:
the one-size-fits-all approach of the outcomes-based and compulsory KPI
framework might not be the most effective way for agencies to report on their
performance. “In trying to meet the framework and report on outcomes, some
agencies have ended up with KPIs that on the surface seem irrelevant or
unhelpful. Such cases run the risk of reducing confidence in the overall KPI
system.”96
agencies struggled to provide information that could be easily understood by
non-specialist readers, reducing the usefulness of annual reports for
Parliament and the public.97
3.2 Measurement of police performance
While performance metrics provide some measure of the public value provided by
police, efficiency is not the only criterion that the public uses to judge police
performance. Citizens judge the success of policing strategies by their experience of
crime,98 while politicians or the media may focus on cost or timeliness and the judiciary
on reasonableness or process.99 Hence, there are a number of areas that performance
measures could address and the selection could depend on who the police agency feels
most accountable to.
Australian policing has been influenced by the “new era” of policing in the UK and the
US, emerging from the NPM style of management which placed more emphasis on
police being accountable to the community and achieving government outcomes.
94 Australian Institute of Criminology, A tough nut to crack: Performance measurement in specialist
policing, Technical and Background Paper 53, prepared by Zhivan Alach and Charl Crous, Australian Institute of Criminology, Canberra, 2012, p4.
95 Auditor General WA, Beyond Compliance: Reporting and managing KPIs in the public sector, Government of Western Australia, Perth, April 2012, p5
96 ibid., p7 97 ibid. 98 Legrand, T. and S. Bronitt, 'Policing to a Different Beat: Measuring Police Performance', in Tim
Prenzler (ed.), Policing and Security in Practice, Palgrave Macmillan, UK, 2012. 99 den Heyer, G., ‘Shape or Adapt: The Future of Policing’, Salus, Issue 1. No. 1, 2013, p50.

26
The performance framework of the NPM approach required law enforcement agencies
to set key objectives and to use relevant performance indicators as a basis for their
organisational structures and for allocating resources.100
The Operational Performance Review (OPR) system that developed from this – and has
been implemented by most Australian police organisations – uses a method of
measurement derived from New York’s renowned Compstat meetings.101 The high
pressure Compstat meetings between executive police officers and
commanders/regional superintendents monitor progress and performance in relation
to the latest crime statistics. Strategies are discussed and targets are set for the next
meeting. It is commonly described as a data-driven performance review process.102
According to Fleming and Scott (2008), most Australian jurisdictions have aligned their
OPRs closely with treasury performance reporting and the requirements of the
Productivity Commission. The statistics collected for performance reporting – such as
response times, reported crimes, arrest rates, clearance rates, traffic tickets issued and
breath tests conducted – were used both for determining police operations and as a
reporting mechanism.103
Whilst Fleming and Scott’s (2008) review of police performance measurement across
Australia is generally positive, they do caution that an OPR that looks at crime statistics
alone may not be able to capture the activities that a police officer performs in the
interests of creating a safe community:
The purely quantitative data have to be supplemented with qualitative
data. Qualitative data can reveal much of the process that is involved
in effective policing. A closer link between output (for example number
of arrests) and outcome (safe streets) is clearly important.104
But police organisations were still grappling with how to provide accurate
measurements of their activities and achievements. While some Australian police
services had tried to take into account more than simple statistical data and to “tease
out the less tangible aspects of police work” in their application of performance
management systems, in many cases it was used in a rigid and mechanistic way.105
100 den Heyer, G., ‘Shape or Adapt: The Future of Policing’, Salus, Issue 1. No. 1, 2013, p45. 101 Fleming, J. and A. Scott, 'Performance measurement in Australian Police Organizations', Policing,
vol. 2, no. 3, 2008, p326. 102 Tiwana, N., G. Bass and G. Farrell, 'Police performance measurement: an annotated
bibliography', Crime Science, vol. 4, no. 1, 2015, p18. 103 Fleming, J. and A. Scott, 'Performance measurement in Australian Police Organizations', Policing,
vol. 2, no. 3, 2008, p327. 104 ibid, p329. 105 ibid.

27
A study of performance management in the WA Police in 2004-06 found that the
existing approach did not adequately support agency outcomes identified in the
strategic plan and related documentation and policies.106 If that was the case then, it
may be even more now. At that time, WA Police reported on three outcome measures.
Now there is only one, as documented in section 3.4.
3.2.1 Evidence-based policing and use of intelligence
While the terms evidence-based policing and intelligence-led policing are sometimes
used interchangeably, one is a philosophy and the other a method. As Queensland-
based police intelligence expert Janet Evans explained, evidence-based policing is a
method which can be used (along with other methods) to carry out intelligence
practice and assist in making decisions.
As Sherman (2013) writes: “In contrast to basing decisions on theory, assumptions,
tradition, or convention, an evidence-based approach continuously tests hypotheses
with empirical research findings.”107
On the other hand intelligence-led policing is a philosophy which, if operating correctly,
is integrated into every aspect of the policing culture.108 Intelligence-led policing
involves the collection of raw information, which is then processed and used to
inform decision making.
Australian police agencies have largely based their intelligence model – the
Australasian Criminal Intelligence Model (ACIM) – on the UK’s National Intelligence
Model (NIM), which provides a framework for assigning and managing policing
priorities through Tasking and Coordination Group meetings. This is considered the
most important aspect of the NIM as it articulates how intelligence-led policing can be
implemented.109
However, Evans and Kebbell (2012) have found that Australian agencies have adopted
models such as the NIM in principle but less so in practice.
While it is apparent in the Australian context that there is high
compliance to the generation of intelligence product, the product
appears to not be routinely used for its designed purpose of assisting
decision making. It has been argued that some of the reasons for this
106 Gillespie, J., Policing performance management systems: Identifying key design elements within a
‘new’ public management context, Masters by Research Thesis, School of Business Management, Edith Cowan University, Perth, Australia, 2006.
107 Sherman, L., 'The Rise of Evidence-Based Policing: Targeting, Testing and Tracking', Crime and Justice 42:377-451, 2013, p377.
108 Ms Janet Evans, Intelligence Analyst, Transcript of Evidence, 6 May 2015. 109 Evans, J. and Kebbell, M., 'Integrating Intelligence into Policing Practice', in Tim Prenzler (ed.),
Policing and Security in Practice, Palgrave Macmillan, UK, 2012, p78.
28
stem from a lack of organizational acceptance and philosophy of
intelligence and the pervasive 'reactive' culture of police work.110
Intelligence was by its nature proactive, working towards disrupting or preventing
future crimes. But measuring the reactive element of policing was considerably easier
than measuring the success of proactive policing endeavours. In addition, the authors
note that little time is made for evaluation “and police agencies frequently lack the
skills for effective evaluation and fear that what they have done may not withstand
scrutiny”.111
Intelligence and evidence-based policing overlap, in that data collected as part of
intelligence gathering can be used in assembling evidence.
Evidence-based policing grew out of three strategic principles:
1. Police should conduct and apply good research to target scarce resources on
predictable concentrations of harm from crime and disorder.
2. Once police choose their high-priority targets, they should review or conduct
tests of police methods to help choose what works best to reduce harm.
3. Once police agencies use research to target their tested practices, they should
generate and use internal evidence to track the daily delivery and effects of those
practices, including public perceptions of police legitimacy.
These can be summarised as the “triple T” of targeting, testing, and tracking.112
Police methods have also become far more subject to testing, with evaluation and
debate over “what works” the core idea of evidence-based policing, according to
Sherman. Increasingly, police have targeted their resources based on evidence of
“large, predictable, and harmful statistical patterns” rather than on isolated cases.113
3.2.2 Problems with police performance measurement
There is a substantial literature on the measurement of police performance, the
breadth of which is reflected in Tiwana et al.’s (2015) annotated bibliography of more
than 200 studies. Tiwana et al. note that while there is no consensus on what should be
measured and how it should be measured, there is agreement that performance
110 Evans, J. and Kebbell, M., 'Integrating Intelligence into Policing Practice', in Tim Prenzler (ed.),
Policing and Security in Practice, Palgrave Macmillan, UK, 2012, p88. 111 ibid., p84. 112 Sherman, L., 'The Rise of Evidence-Based Policing: Targeting, Testing and Tracking', Crime and
Justice 42:377-451, 2013. 113 ibid., p379.
29
measures are a “potentially powerful policy instrument, with potentially tremendous
impact on police work”.114
Whilst powerful, there is acknowledgement that the use of performance measures is
problematic. Issues identified in recent studies collect around a number of themes:
Police do not work in isolation: It is difficult to isolate the contribution of police from
the work of other agencies with whom they regularly interact. If performance
outcomes are only linked to one organisation, frustration with the process may
result.115 This issue is pertinent to road safety policing.
Quantification: As is often the case in other public sector organisations, police
organisations have become focussed on tangible objectives which are easier to
quantify and report on. KPIs which lend themselves most readily to auditing of
efficiency and effectiveness are favoured. These measures are usually to hand and
hence cheaper to produce (for example routinely-collected operational and
administrative data).116 Police agencies were partly to blame, having readily embraced
simple measures instead of “devoting the necessary resources to develop more
rigorous, analytical and evidentially based frameworks”.117
Negative side-effects: One of the side-effects of basing performance on things that can
be readily counted rather than things that really concern the public is that resources
may be diverted to meet “false targets”. A number of authors have documented
evidence of manipulation of statistics and resources and even “perversion of practice”
by police officers in an effort to meet performance targets or expectations.118
114 Tiwana, N., G. Bass and G. Farrell, 'Police performance measurement: an annotated
bibliography', Crime Science, vol. 4, no. 1, 2015, p1. 115 Fleming, J. and A. Scott, 'Performance measurement in Australian Police Organizations', Policing,
vol. 2, no. 3, 2008, pp323-325; Australian Institute of Criminology, A tough nut to crack: Performance measurement in specialist policing, Technical and Background Paper 53, prepared by Zhivan Alach and Charl Crous, Australian Institute of Criminology, Canberra, 2012, p5.
116 Fleming, J. and A. Scott, 'Performance measurement in Australian Police Organizations', Policing, vol. 2, no. 3, 2008, p322; Legrand, T. and S. Bronitt, 'Policing to a Different Beat: Measuring Police Performance', in Tim Prenzler (ed.), Policing and Security in Practice, Palgrave Macmillan, UK, 2012, p6; Collier, P., 'In Search of Purpose and Priorities: Police Performance Indicators in England and Wales', Public Money and Management, vol. 26, no. 3, 2006, p165.
Tiwana, N., G. Bass and G. Farrell, 'Police performance measurement: an annotated bibliography', Crime Science, vol. 4, no. 1, 2015, p24.
117 Australian Institute of Criminology, A tough nut to crack: Performance measurement in specialist policing, Technical and Background Paper 53, prepared by Zhivan Alach and Charl Crous, Australian Institute of Criminology, Canberra, 2012, p5.
118 Legrand, T. and S. Bronitt, 'Policing to a Different Beat: Measuring Police Performance', in Tim Prenzler (ed.), Policing and Security in Practice, Palgrave Macmillan, UK, 2012, p14; Tiwana, N., G. Bass and G. Farrell, 'Police performance measurement: an annotated bibliography', Crime Science, vol. 4, no. 1, 2015, p24.

30
Susceptibility to political influence: Fleming and Scott (2008) note that continued
government funding for police is “at least in theory, dependent on results”. This affects
the way measurement is conducted. According to Skogan and Frydl (2004), in the
interests of image management, “governments are more inclined to accept what police
do (outputs) as a measure of effectiveness than what they achieve (outcomes). Police
are, after all, part of government, and therefore they share an interest in shaping
appearances.”119 A national review of performance measurement in traffic policing
noted how the publication of indicators provides transparency and helps raise
standards, but at the same time can become a political exercise, potentially leading to
distortions in data recording.120 It is easy to see how this might arise if police feel
compelled to produce results which support a particular government policy or
program.
3.3 Traffic law enforcement performance measurement
Whilst there is a considerable body of research on ways to increase the safety of roads
and ongoing debate about the most effective methods of traffic enforcement, very
little has been written about the way police measure traffic enforcement performance.
Similarly, the substantial literature on police performance measurement is largely
focussed on crime policing and rarely mentions traffic policing, mainly because the rate
of recorded and resolved crime has become the primary performance indicator for
police around the world.121
Nevertheless, many of the pros and cons of police performance measurement
generally are applicable to traffic policing. Examining the way traffic enforcement
performance is measured in other jurisdictions is also instructive.
In 2006 the Australasian Traffic Policing Forum published a study which reviewed and
compared performance measurement models being used in Australasia and elsewhere
in regard to traffic policing. It found that traffic policing performance indicators are
used both strategically, as measures of the effectiveness of traffic policing, and
administratively, as indicators of its activities and efficiency.122 Performance indicators
119 Cited in: Legrand, T. and S. Bronitt, 'Policing to a Different Beat: Measuring Police Performance',
in Tim Prenzler (ed.), Policing and Security in Practice, Palgrave Macmillan, UK, 2012, p6. 120 Southgate, P., Performance Measurement in Traffic Policing, prepared for Tasmania Police on
behalf of Australasian Traffic Policing Forum, Tasmanian Institute of Law Enforcement Studies, University of Tasmania, 2006, p45.
121 Australian Institute of Criminology, A tough nut to crack: Performance measurement in specialist policing, Technical and Background Paper 53, prepared by Zhivan Alach and Charl Crous, Australian Institute of Criminology, Canberra, 2012, p5.
122 Southgate, P., Performance Measurement in Traffic Policing, prepared for Tasmania Police on behalf of Australasian Traffic Policing Forum, Tasmanian Institute of Law Enforcement Studies, University of Tasmania, 2006, p38.

31
used in traffic policing were seen as accountable, verifiable and easy to collect. They
provided:
intelligence for planning resource deployment;
evidence of road user compliance levels;
evidence of officers’ competence; and
the enthusiasm and focus by supervisors and district officers.123
Measures reported in police service annual reports for each State vary considerably.
While NSW reports on only one measure – road fatalities per 100,000 people – Victoria,
the Northern Territory and Western Australia do not include the road fatality rate as a
KPI at all.
The number of measures reported range from one in New South Wales and WA to 19
in South Australia. KPIs typically include rate of injuries/people hospitalised following a
road crash, the number of drivers detected exceeding the speed limit or alcohol/drug
limit, the number driving without a licence, and in some cases self-reported measures
(e.g. people who indicate they have been speeding, have been over the alcohol limit,
have not been wearing a seatbelt).
3.3.1 Problems with traffic law enforcement performance measurement
Researchers note that a key challenge for measuring police effectiveness in enforcing
lawful road use is that road safety is not completely within the control of police.
Because road and vehicle engineering also play a critical role in road safety, it is not
considered reasonable to fully attribute changes in the road toll only to the police.
As Southgate (2006) says, we cannot assume that policing outputs do in fact lead to
road safety outcomes when other factors may come into play.124 This raises questions
about who should be responsible for the road toll, and whether there is any value in
using police traffic enforcement data as an indication of improvements in road safety.
However, if we accept the projection presented by the RAC that around half of those
saved from fatal or serious injury over the life of the Towards Zero strategy (from 2008
to 2020) will be due to the two cornerstones of Safe Road Use and Safe Speeds125 – in
which police enforcement has a primary role – then it seems reasonable to expect that
police take some responsibility for the road toll.
123 Southgate, P., Performance Measurement in Traffic Policing, prepared for Tasmania Police on
behalf of Australasian Traffic Policing Forum, Tasmanian Institute of Law Enforcement Studies, University of Tasmania, 2006, p29.
124 ibid., p46. 125 Submission No.3 from RAC, 20
February 2015, p1.

32
Apart from this, there is long-standing evidence that seatbelt use, random breath
testing (RBT) and speed cameras are factors in the decline in fatality rates nationally126
– factors managed or enforced by the police.
There are known challenges associated with trying to measure the effect of RBT on
drink driving and speed cameras on speeding. Firstly, using the percentage of drink
driving charges as a measure is problematic, since a reduction in charges could mean
either that fewer people are driving while over the legal limit or that police have failed
to catch people driving while over the limit. An increase could mean simply that
targeting has been successful, and not necessarily that more people are driving while
drunk. The same logic applies to measuring drivers exceeding the speed limit, not
wearing seatbelts or any other such traffic offences.
WA Police acknowledged this conundrum in its 2013-14 annual report, commenting on
the meaning of an increase in the percentage of drivers who were found to exceed the
lawful alcohol or speed limits:
While such an increase is considered to be a positive indication of more
effective road policing, it may also reflect an overall increase in
unlawful behaviour due to population growth and/or cultural changes.
Similarly, a decrease in the percentage of offending drivers may
indicate that enforcement is having a positive impact on driver
behaviour.127
Harrison (2003) notes that a different measure of drink driving will result depending on
whether it is based on the numbers of alcohol-affected drivers on the roads (measured
by RBT or by self-report driver surveys) or on the numbers of crashes involving drivers
who have been drinking.128 Again, the same could apply to speeding, non-use of
seatbelts and other offences.
Another challenge is that traffic law enforcement is essentially about deterring road
users from engaging in risky behaviour, as outlined in Chapter Two. Road safety
researcher Professor Max Cameron says that while crime policing is concerned with
offences which directly result in harm to people or property, traffic policing is
126 Submission No.3 from RAC, 20 February 2015, p1. 127 Western Australia Police, Annual Report 2013-14. Government of Western Australia: Perth, WA,
2014, p100. 128 Cited in: Southgate, P., Performance Measurement in Traffic Policing, prepared for Tasmania
Police on behalf of Australasian Traffic Policing Forum, Tasmanian Institute of Law Enforcement Studies, University of Tasmania, 2006, p38.

33
concerned with deterring behaviours that are risky (with the potential to cause harm) –
which means convincing people that what they are doing is risky.129
Hence, “it is important that all potential drink-drivers perceive that they individually
run a risk of being breath tested at random on each journey, no matter whether or not
they drive in a manner, place or time that is stereotyped as likely to involve drink-
driving.”130
Road safety research suggests that general deterrence strategies are the most effective
for changing both drink-driving and speeding behaviour, because they have the
potential to influence all road users. Specific deterrence strategies should be used to a
lesser extent.131
Measurement of effectiveness should therefore contain some way to determine
whether behaviour change has taken place.
As Southgate (2006) notes:
First, the immediate cause of accidents is the attitudes and behaviour
of road users; what policing can do is to help influence these, so that
the link between policing and road trauma is a two stage
relationship.132
But Southgate (2006) concedes that no one performance measure can capture all
aspects of traffic policing, “and the things which clearly are important cannot
necessarily be easily quantified – or even measured qualitatively”.133 For example, it
was impossible to quantify the numbers of accidents which did not happen because
they were prevented.
Performance indicators could lead to a focus on speed, drink driving and seatbelts to
the neglect of other offences which were harder to measure – but even measuring
these accurately can prove difficult, as discussed.
In their examination of the effectiveness of traffic policing in reducing traffic crashes,
Bates, Soole and Watson (2012) conclude that police have been effective in reducing
129 Cameron, M., The role of traffic policing in road safety, unpublished paper prepared for WA
Police, April 2013. 130 ibid. 131 Cameron, M.H. and Delaney, A., Development of strategies for best practice in speed
enforcement in Western Australia: Final Report. Report to Department of Premier and Cabinet, Office of Road Safety, Western Australia. Report No. 270, Monash University Accident Research Centre, 2006.
132 Southgate, P., Performance Measurement in Traffic Policing, prepared for Tasmania Police on behalf of Australasian Traffic Policing Forum, Tasmanian Institute of Law Enforcement Studies, University of Tasmania, 2006, p41.
133 ibid., p42.

34
offence rates and traffic crashes. However, more scientifically rigorous research was
needed to fully understand the impact of various enforcement operations.134
3.4 How does WA Police measure its performance?
As a State Government agency, WA Police is required to report its activity in an annual
report, which is based on its KPIs .
At a meeting with WA Police personnel in May 2011, the Office of the Auditor General
suggested that WA Police review its traffic law enforcement KPIs because of concerns
that other factors also impacted the agency desired outcome.135 Following further
consultation with the OAG, WA Police introduced a new suite of KPIs, taking effect
from the 2014-15 reporting period.
Previous traffic law enforcement KPIs
Prior to 2014-15, “Lawful Road-User Behaviour” was listed as one of three outcomes.
Two effectiveness KPIs were used to measure whether the outcome was being
achieved:
Percentage of drivers tested for drink-driving who were found to exceed the lawful
alcohol limit.
Percentage of vehicles monitored for speeding by speed cameras that were found
to exceed the lawful speed limit.
The efficiency KPI was linked to “Service 7: Traffic Law Enforcement and Management”
(one of seven services provided by the police service, as identified in the previous
outcome-based management framework). The KPI was:
Average cost per hour of traffic law enforcement and management
New traffic law enforcement KPI
The new KPI relevant to traffic law enforcement is:
Percentage of traffic law enforcement contacts made by police officers that target
“Category A” offences (including drink driving, exceeding the lawful speed limit,
careless/dangerous/reckless driving, no authority to drive/unlicensed vehicle, use
of mobile phones whilst driving, and non-wearing of seatbelts/restraints/helmets).
134 Bates, L.., Soole, D. and Watson, B., ‘The Effectiveness of Traffic Policing in Reducing Traffic
Crashes’, in Tim Prenzler (ed.), Policing and Security in Practice, Palgrave Macmillan, UK, 2012,
p104. 135 Mr Colin Murphy, Auditor General, Letter, 22 May 2015.

35
Category A offences are ones which, according to evidence, have the biggest impact on
road trauma and road deaths. Ninety per cent of the work of traffic officers focuses on
Category A offences, according to the
Police Commissioner.136
According to WA Police, there are no
further categories (i.e. category B or C).137
A contact is a situation in which a police
officer deals with an individual driver in
person. This is apparently a “customer
perspective” effectiveness measure,
which (along with 10 others) feeds into
the single outcome “Contribute to
community safety and security”.
There are no efficiency KPIs specifically
related to traffic enforcement in 2014-15.
Efficiency will be broadly measured by:
1. Average cost of metropolitan policing services per person in the Perth
metropolitan area.
2. Average cost of regional and remote policing services per person in regional
WA.
3. Average cost of specialist policing services per person in WA.
Traffic enforcement is included in number three.
Internal KPIs
WA Police has an internal KPI and target associated with mobile speed camera
operations. Operational mobile speed camera hours per month have been set at 3200.
The Committee asked for a list of all internal KPIs and this was the only one provided.
3.4.1 Other measures of police performance in relation to road safety
Report on Government Services
The Report on Government Services (ROGS), produced by the Productivity Commission,
reports on the performance of public sector services across Australia, including police
136 Dr Karl O’Callaghan, Commissioner of Police, Western Australia Police, Transcript of Evidence –
Standing Committee on Estimates and Financial Operations, 16 June 2014. 137 Mr Anthony Kannis, Executive Director, WA Police, Letter – Answers to Questions on Notice, 5
June 2015.
Category A offences
Speeding Excess of posted speed limits
Impaired driving Drugs and alcohol affected driving
Anti-social road user behaviour Careless, reckless and dangerous driving
Driver inattention Illegal use of technology and distracting practices
Non-use of restraints Seatbelts, helmets and other restraints
No authority to drive Driving without or an inappropriate licence
Vulnerable road users High risk behaviours of pedestrians, motorcyclists and cyclists

36
services. The stated primary purpose of the report is to provide comparative
information about the equity, effectiveness and efficiency of government services, with
public accountability a secondary (but important) purpose.138 It is released at the
beginning of each year and published on the Productivity Commission website.
Police service performance is reported against four activity areas: community safety;
crime; road safety; and judicial services. There is also a general section for performance
across all police activity areas.
The ROGS compares data on road safety measures using data from the National Survey
of Community Satisfaction with Policing (NSCSP) as follows:
use of seatbelts, defined as the proportion of people who had driven in the
previous 6 months and who indicated that, in that time, they had driven
without wearing a seatbelt;139
driving under the influence, defined as the proportion of people who had
driven in the previous 6 months and who indicated that, in that time, they had
driven when possibly over the alcohol limit;140
degree of speeding, defined as the proportion of people who had driven in the
previous 6 months and who indicated that, in that time, they had driven 10
kilometres per hour or more above the speed limit.141
For each state and territory, it also compares:
the number of road deaths per 100,000 registered vehicles.
the number of hospitalisations from traffic accidents per 100,000 registered
vehicles.
Road Safety Council reports
One of the functions of the Road Safety Council (RSC) is to identify and recommend
measures to reduce road trauma and to monitor and evaluate the effectiveness of
these measures. In August 2012, the RSC endorsed a more comprehensive set of Safety
Performance Indicators which would report not only crash totals and behavioural
causes of crashes but “seek to link interventions with results”. The indicators cover:
Final crash outcomes in terms of reductions in killed and seriously injured (KSI);
138 SCRGSP (Steering Committee for the Review of Government Service Provision) 2015, Report on
Government Services 2015, vol. A, Approach to performance reporting, Productivity Commission, Canberra, 2015, p1.1.
139 The 2013-14 figure was 4.9% in WA compared to the national average of 5.2%. 140 The 2013-14 figure was 8.1% in WA compared to the national average of 7.7%. 141 The 2013-14 figure was 59.9% in WA compared to the national average of 54.5%.
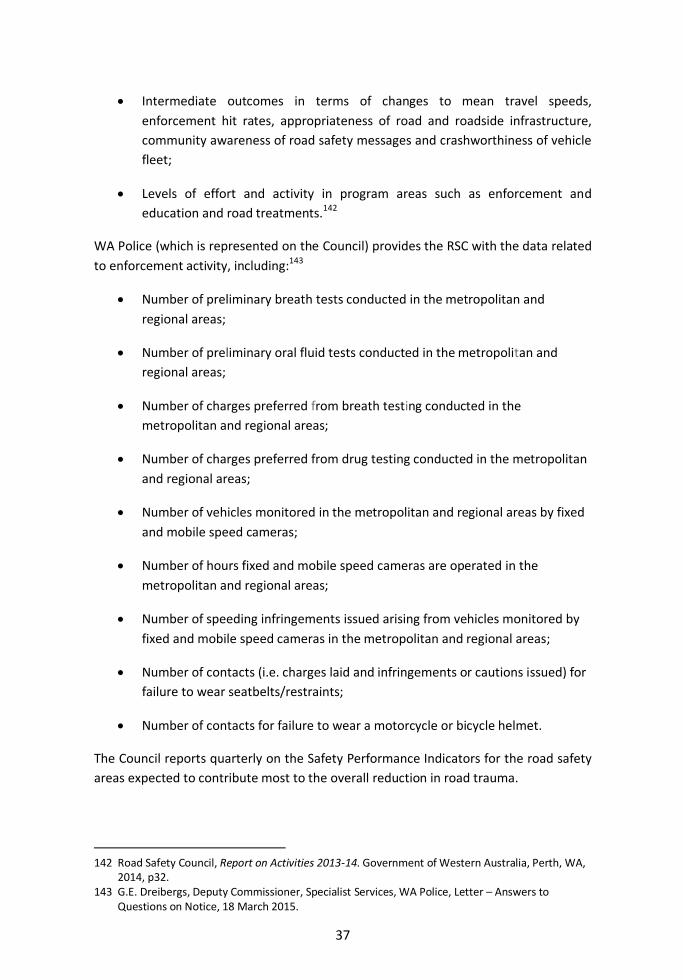
37
Intermediate outcomes in terms of changes to mean travel speeds,
enforcement hit rates, appropriateness of road and roadside infrastructure,
community awareness of road safety messages and crashworthiness of vehicle
fleet;
Levels of effort and activity in program areas such as enforcement and
education and road treatments.142
WA Police (which is represented on the Council) provides the RSC with the data related
to enforcement activity, including:143
Number of preliminary breath tests conducted in the metropolitan and
regional areas;
Number of preliminary oral fluid tests conducted in the metropolitan and
regional areas;
Number of charges preferred from breath testing conducted in the
metropolitan and regional areas;
Number of charges preferred from drug testing conducted in the metropolitan
and regional areas;
Number of vehicles monitored in the metropolitan and regional areas by fixed
and mobile speed cameras;
Number of hours fixed and mobile speed cameras are operated in the
metropolitan and regional areas;
Number of speeding infringements issued arising from vehicles monitored by
fixed and mobile speed cameras in the metropolitan and regional areas;
Number of contacts (i.e. charges laid and infringements or cautions issued) for
failure to wear seatbelts/restraints;
Number of contacts for failure to wear a motorcycle or bicycle helmet.
The Council reports quarterly on the Safety Performance Indicators for the road safety
areas expected to contribute most to the overall reduction in road trauma.
142 Road Safety Council, Report on Activities 2013-14. Government of Western Australia, Perth, WA,
2014, p32. 143 G.E. Dreibergs, Deputy Commissioner, Specialist Services, WA Police, Letter – Answers to
Questions on Notice, 18 March 2015.

38
Each year, as required by the Road Safety Council Act 2002 and recommended by the
National Road safety Strategy 2011-2020, the RSC reports to the Minister for Road
Safety and the Minister tables the report in Parliament. The most recent report to be
tabled is the 2013-14 Annual Report on Activities.
Road Trauma Trust Account project performance summaries
Each year WA Police receives funds from the Road Trauma Trust Account (RTTA) for
non-core activities. The agency is required to submit a quarterly project performance
summary to the RSC which reports on progress towards performance indicators set out
in the project application. This is another way in which WA Police can be held
accountable for performance, although this information is not publicly available.
39
Chapter 4
Adequacy of traffic law enforcement
measurement by WA Police
This chapter examines whether WA Police’s road policing and road safety
performance measures are adequate, in terms of both measurement and reporting.
Other agencies which report police performance are also covered. Issues which
impact on the ability of police to carry out traffic enforcement effectively are also
considered.
Now they have moved to a KPI that I am sorry, I do not understand, or
see its relevance to road trauma.
– Professor Max Cameron, Monash University Accident Research Centre
DISCUSSIONS of appropriate measures for assessing police traffic law enforcement
generally revolve around the ways police detect and deter excessive speed and driving
under the influence of alcohol or drugs. This is because these are the traffic policing
activities which consume the most resources and also because speeding and drink/drug
driving are the behaviours which cause the most trauma on our roads.144
Hence, in the past there has tended to be a focus on measuring enforcement of these
offences. But the intention of the new WA Police KPI is that it takes into account other
safety risks such as not wearing a seatbelt, mobile phone use and careless driving.
Focussing on the number of contacts police make for these offences is said to
complement the “anywhere, anytime” message that goes hand in hand with the
strategy of general deterrence.
But can this one KPI really measure the effectiveness of this strategy, and how effective
are other measures used by WA Police to evaluate traffic policing performance? Just as
importantly, in the interests of transparency, how is its performance being reported?
The effective performance of police in regard to road safety is also influenced by a
range of other factors outside of its control, and these are also considered in this
chapter.
144 Dr Sudhakar Rao, Director, State Trauma, Royal Perth Hospital, Transcript of Evidence, 11 March
2015; Cameron, M., The role of traffic policing in road safety, unpublished paper prepared for WA Police, April 2013.

40
4.1 Measurement of effectiveness
4.1.1 Internal performance measures
WA Police provided evidence of only one internal KPI (operational mobile speed
camera hours per month) and as such the Committee is uncertain whether police sets
its traffic officers goals to work towards, outside of the single corporate traffic policing
measure. It may be that WA Police use traffic policing data to monitor performance,
but it does not appear that this is formalised into any kind of measure.
Tasmania Police, for example, publishes a monthly performance report on its website,
produced for internal purposes to measure the performance of its people, resources
and systems. The report is made available to external stakeholders “as the figures
contained may be of public interest”. The primary purpose of the report is “to measure
internal performance, not provide official Departmental figures”.145
Fourteen pages in the Tasmania Police report are devoted to road policing tables and
charts, including speed camera roadside hours, speed camera set-ups (number by
speed zone, number of vehicles checked and percentage receiving notices), and
random drug/alcohol tests by district. (See Appendix 6 for extracts from the report.)
Use of intelligence
The WA Police Road Policing Strategy 2011-2014 makes several mentions of
intelligence and research. It says that the WA Intelligence Model (which is aligned
closely with the Australasian Criminal Intelligence Model and is currently under
revision) will be integrated into road policing –
…. through Traffic involvement with Tasking and Coordination Groups
in all police districts, resulting in optimal use and application of
resources (vehicles etc.), effective rostering and improved cooperation
between the various parties involved in enforcement.
Having visited the Police Operations Facility and been briefed by intelligence and traffic
enforcement personnel, the Committee was assured that this is being implemented.
Traffic police seem to be effectively using intelligence products to direct operations on
a day-to-day, week by week and month by month basis.
Information from various sources – such as Crimestoppers, the Police Administration
Centre (which collects information about hoons, recidivist drivers, drink drivers and
other offenders on the road), traffic counters, Main Roads crash data and the Incident
Management System – are fed into a database which can filter and analyse the
145 Tasmania Police, Corporate Performance Report March 2015, Department of Police and
Emergency Management, 29 April 2015, p(i).

41
information in various ways. The data is geocoded to produce “heat maps” which can
graphically illustrate geographical hotspots for various offences.
This form of intelligence is regarded as tactical intelligence. Tactical intelligence
involves collating and processing data from various sources to identify patterns and
trends. This type of intelligence gathering originates with three level three146 analysts
(unsworn) who work in the State Traffic Intelligence Planning and Coordination Unit
(STIPCU).
The analysts can develop profiles of particular problem areas or people. These profiles
are delivered to field intelligence officers (FIOs) who might set up a covert camera, for
example, and build on the profile before passing it on to the Taskforce Nimrod staff
who will conduct the prosecution.
A trend which cannot be managed by FIOs or Nimrod staff will be passed to other areas
such as the local policing teams, gang crime or licensing enforcement, or to the State
Intelligence Division (SID) office.
The tactical products from
various areas inform operational
decisions across the agency, and
are eventually considered at the
strategic level by the Operations
Committee (chaired by Deputy
Commissioner Brown) which
sets traffic and crime priorities.
Decisions about where the
agency needs to target its efforts
are communicated back to the
Operational Commanders Group
(of which the State Traffic
Commander is a member) and
that directs the activity of the
various portfolios.147
While it is easy to see how traffic
police use intelligence to guide
where and when they should target their traffic resources, the extent to which it guides
longer term strategies is more difficult to determine.
146 Public service level. 147 WA Police, Briefing, 13 May 2014.
Taskforce Nimrod
Taskforce Nimrod was created to tackle the rise in serious and fatal crashes. It focuses on recidivist offenders - those that drive without a valid licence, hoons, and people who repeatedly flout traffic laws and attempt to evade capture by trading demerit points or obscuring their number plates.
Police analysis showed that about a quarter of those at fault in fatal crashes from January to October did not have a valid licence and a third of them had at least one previous conviction for having no authority to drive.
Almost 70 per cent of those at fault in fatal crashes last year had two or more previous traffic infringements and in 85 per cent of those cases the penalties were for speeding.
In the first three months of its operation, the Taskforce has seized almost 300 vehicles from reckless or suspended drivers.

42
The Committee’s impression is in line with the research of Evans and Kebbell (2012),
who interviewed intelligence agency directors across Australia and found that
“intelligence products are not routinely used to guide decision making or further
intelligence requirements”.148
Intelligence analysts were often used in a support capacity rather than in a leading
capacity, and directed to find the answer to one particular question, according to Ms
Evans.149
The fact that there are only three lower level intelligence analysts in the traffic
department and one level five in a centralised intelligence analysis role is an indication
that use of intelligence at a more sophisticated level than guiding the deployment
roster is not considered a priority. The Committee was unable to verify how many
intelligence analysts are employed in higher level roles across the agency, since WA
Police was unwilling to disclose this information, describing it as operationally
sensitive.150
At the briefing, the Committee was told that intelligence analysts led the process of
intelligence and perhaps even the thinking around it, but did not lead the operational
decision-making itself. They were dealing with day to day prospects and could not wait
a week or a month for the results of a study. The “analytical grunt” needed to be at the
local level: what are we going to do today?
Ms Evans said that police officers in Australia had a very good understanding of
intelligence-led policing, but getting the principles integrated into police work was very
difficult unless it was supported at the highest level.151
Intelligence units were often underrated. People who worked in intelligence were
labelled the “broken biscuits” and there was a belief that you were moved to
intelligence if you were “sick, lame or lazy”.152 However, there is no indication that
personnel deployed in this role in WA meet this profile.
State Traffic Command Inspector Ian Clarke said that traffic enforcement was one of
the most intelligence-driven areas of the force and analysts were highly valued by
traffic officers. However, he said more education would ensure there was a better
understanding of its value in other parts of the agency.153
148 Evans, J. and Kebbell, M., 'Integrating Intelligence into Policing Practice', in Tim Prenzler (ed.),
Policing and Security in Practice, Palgrave Macmillan, UK, 2012, p88. 149 Ms Janet Evans, Intelligence Analyst, Transcript of Evidence, 6 May 2015, p8. 150 G.E. Dreibergs, Deputy Commissioner, Specialist Services, WA Police, Letter, 9 June 2015. 151 Ms Janet Evans, Intelligence Analyst, Transcript of Evidence, 6 May 2015, p5. 152 ibid., p4. 153 WA Police, Briefing, Operations Support Facility, Midland, 13 May 2014.

43
Police from the intelligence portfolio said that a post-operational assessment of specific
operations (such as Nimrod) was part of the intelligence cycle, but were vague when
asked for examples of how such assessments had modified the way they do things.154
WA Police has a history of commissioning research, with a long-standing relationship
with C-MARC, MUARC and other university centres such as Edith Cowan University’s
Sellenger Centre.155 But long-time MUARC researcher Professor Cameron said it
seemed to make little difference to how traffic policing was conducted.
… in 2006 I was invited by the Office of Road Safety, in conjunction
with the police, to develop a speed enforcement strategy. That is often
referred to by the police, but when I look at what is actually being
done, I have to say that I am disappointed. A key area was the
escalation of mobile speed cameras with various forms of operation,
depending on whether you were talking about Perth or rural WA, but
that has hardly happened at all.
I hear acknowledgement of the research, but I am sorry, I do not see
action that is consistent with that research.156
This was not the case in Victoria, where a new drink and drug-driving enforcement
strategy was “entirely consistent” with the research evidence put to Victoria Police. “I
became more and more convinced that they really had been listening to us and really
appreciated the research that we have done.”157
Assistant Commissioner Anticich said WA Police had recently been in discussion with C-
MARC to roll out a project to determine, firstly, whether WA Police are doing what they
say they are doing, and secondly, to validate whether they are taking the right
approach.158
He said they had embarked on a significant campaign around research, recognising the
need for scientific evidence to support what they were doing. Traffic was “quite
intuitive” and everyone had a view about how to fix the problem (including police
officers), but without proper verification this was nothing more than an opinion.159
The Committee is left with the impression that while there is an appreciation of the
value of evidence-based policing, there is simply not enough time and resources
devoted to considering evidence properly. Management seems too consumed with
154 WA Police, Briefing, Operations Support Facility, Midland, 13 May 2014. 155 ibid. 156 Professor Max Cameron, Monash University Accident Research Centre, Transcript of Evidence, 25
March 2015, p7. 157 ibid., p9. 158 WA Police, Briefing, Operations Support Facility, Midland, 13 May 2014. 159 ibid.

44
everyday policing demands to look at the bigger picture. More people employed in the
research and intelligence areas might alleviate this problem.
Finding 2
Intelligence-led policing is well understood and tactical intelligence is used to guide
traffic policing on a daily basis. However, opportunities to translate intelligence and
evidence into strategic and policy changes could be further developed.
Recommendation 1
WA Police should ensure that it has sufficient staff in senior intelligence analyst roles in
order to make the best use of intelligence and evidence in guiding traffic-related
strategies. There should be a direct nexus between traffic enforcement tasking and
research findings.
4.1.2 External performance measures
The audited KPI
The KPI that WA Police currently use to measure effectiveness of traffic law
enforcement is:
Percentage of traffic law enforcement contacts made by police officers
that target ‘Category A’ offences (including drink driving, exceeding
the lawful speed limit, careless/dangerous/reckless driving, no
authority to drive/unlicensed vehicle, use of mobile phones whilst
driving, and non-wearing of seatbelts/restraints/helmets).
Category A offences are those which are regarded as having the biggest impact on road
trauma and road deaths. Police will aim to ensure that 90 per cent of the contacts
made by police officers are for these types of offences.
Contacts are situations in which a police officer deals with an individual in person, for
example: stopping someone and administering a random breath test, pulling someone
over for speeding, stopping an unlicensed vehicle, issuing an on-the-spot fine for using
a mobile device while driving etcetera. The KPI does not include speed camera
infringements issued by post, since these are not personal contacts.160
The KPI is essentially a way of ensuring that the time traffic officers spend on patrol
delivers the maximum benefit to road safety (without actually specifying how many
hours this should be).
WA Police says it uses its KPIs for ongoing monitoring of performance to enable
adjustments to be made throughout the year to meet outcomes. Data provided by the
160 Mr Mark Stringer, Strategic Planning and Performance Analyst, WA Police, Transcript of Evidence,
6 May 2015, p10.

45
business intelligence area is discussed at monthly meetings of the corporate executive,
according to the executive director. KPIs also had a role in resource allocation.161
In reference to the above KPI, then, one would assume that if data produced at a
monthly meeting showed that less than 90 per cent of the contacts made by police
were for Category A offences, traffic police would be directed to spend more time
pursuing those offences than the less serious ones. In this way the KPI does seem to be
linked to resource allocation – if not necessarily increasing resources, then perhaps
redirecting them.
The Committee notes that the number of on-the-spot fines issued by WA Police has
decreased since 2012. By extrapolation (using the figure for the first quarter of 2015 as
shown in Table 4) police could expect to issue around 110,000 infringements this year,
compared to around 210,000 in 2012. The figures in Table 4 represent police contacts,
and do not include speed camera or red light camera infringements.
Table 4: Number of on=the-spot infringements issued by WA Police for traffic offences
Calendar year Infringements
2011 193,125 2012 210,875
2013 182,403
2014 159,379
2015 (as 6 April) 27,476
WA Police says that the decrease in on-the-spot infringements should be considered in
conjunction with the increase in speed camera monitoring hours, and suggested that
the reduction in fines may be a result of increased public awareness of vehicle
impoundments, instant disqualification notices and increased penalties for traffic
infringement notices.162
The Committee suggests that another reason may be a lack of resources available to
devote to traffic policing. If Category A offences are in fact being targeted (and police
have indicated there are no other categories) then it seems there should be an increase
in on-the-spot fines. If direct and personal contact with drivers is considered an
important measure in traffic enforcement, then this decrease, not readily explicable to
the Committee, is a matter of some concern. Could it perhaps be inferred that a fall in
the number of on-the-spot infringements translates into a drop in road traffic hours by
police? Or does it reflect a policy decision to move from general deterrence to specific
deterrence?
161 Mr Anthony Kannis, Executive Director, WA Police, Transcript of Evidence, 6 May 2015, p15. 162 Mr Anthony Kannis, Executive Director, WA Police, Letter – Answers to Questions on Notice, 5
June 2015.

46
WA Police executive director Anthony Kannis notes that the selection of the KPIs is a reflection of being “in a period where you cannot just continue to increase the patrol hours”, hence it was important to ensure “you are getting greater bang for your buck out of the patrol hours and the contacts”.163
In this way, the KPI seems to fit the description of an efficiency indicator (a measurement of outputs) more so than an effectiveness indicator (a measurement of outcomes).
The Committee acknowledges the ambiguity of the previous traffic law enforcement KPIs, and as such it is understandable that WA Police chose something they felt they could more easily measure.
There is not a meaningful target or KPI that we can provide that
demonstrates how we can affect (the road toll)... The best way that we
can directly impact on the road toll is by targeting those offences, not
just alcohol and speed, that create the greatest trauma.164
WA Police also did not want to include “something that we were not totally responsible
for and could not totally influence”165 – a reference to the fact that the road toll is also
influenced by factors outside police control such as the condition of roads and vehicle
safety.
Unfortunately, while the KPI appears to be something that is measureable and has
been endorsed as relevant and appropriate, it is not particularly meaningful. It is a KPI
that seems to be more about business management.
In the words of the executive director, effective KPIs need to be “ones that we can
manage to”.166 But the KPI does not really indicate whether the road policing strategies
are effective. It does not tell us whether offences have risen or fallen, or whether the
police are being effective in making the roads safer. It simply aims to ensure traffic
police resources are directed to the most critical traffic offences.
As the literature discussed in Chapter Three tells us is often the case with police KPIs,
this KPI is more of an output than an outcome measurement i.e. it measures a service
provided rather than the effect of the service.
Unless this KPI is compared against killed and seriously injured figures, how can WA
Police measure its effectiveness? If there are no KPIs which indicate whether public
attitudes to speeding, drink driving, mobile device use, etcetera are changing, how can
police monitor whether their road safety messages are having any effect?
163 Mr Anthony Kannis, Executive Director, WA Police, Transcript of Evidence, 6 May 2015, p6. 164 ibid., p9. 165 Mr Mark Stringer, Strategic Planning and Performance Analyst, WA Police, Transcript of Evidence,
6 May 2015, p12. 166 Mr Anthony Kannis, Executive Director, WA Police, Transcript of Evidence, 6 May 2015, p15.

47
Finding 3
It is difficult to define an effective measure of police performance. Accordingly, the
traffic law enforcement KPI provides only a limited measure of the effectiveness of
road policing.
Finding 4
There is some evidence to suggest that the perception of a police presence is an
effective tool in modifying road user behaviour, hence the focus of the new police KPI
on the number of contacts with road users.
WA Police has indicated that the new road policing KPI is what it wants to be judged by,
but asserts that the removal of the previous audited KPIs does not change the day-to-
day focus of police officers. “This is more us communicating to our stakeholders the
things that we suggest they measure us by.”167
Unfortunately this does not meet the expectations of advocacy groups, who have
commented on the lack of road policing data available.168 This may be partly a
consequence of the way performance measures are reported.
Other reported performance measures
The Report on Government Services (ROGS) was commissioned 20 years ago by COAG
as a planning and evaluation tool for government, although it is now recognised that it
also has a public accountability function.169
The ROGS provides a comparison across the states and territories, promoting an
understanding of strength and weaknesses of different approaches and (ideally)
providing incentives for jurisdictions to improve performance. However WA Police is
not held to account for its performance by the ROGS (or the Productivity Commission,
which publishes it) in the same way as it is by its annual report.
The report contains some information on road safety that does not appear in the WA
Police annual report, such as hospitalisations and use of seatbelts. Three of the
measures reported in ROGS have appeared in previous WA Police annual reports (the
proportion of people who indicated they had driven when possibly over the alcohol
limit; the proportion of people who indicated they had driven 10 kilometres per hour or
167 Mr Anthony Kannis, Executive Director, WA Police, Transcript of Evidence, 6 May 2015, p11. 168 Submission No.3 from RAC, 20 February 2015; Submission No.4 from WA Police Union, 27
February 2015. 169 SCRGSP (Steering Committee for the Review of Government Service Provision) 2015, Report on
Government Services 2015, vol. A, Approach to performance reporting, Productivity Commission, Canberra, January 2015, pp1.1–1.2.

48
more above the speed limit; the rate of road fatalities per 100,000 people). Whether
they will continue to appear is uncertain.
WA Police executives pointed out to the Committee a number of times that various
road safety measures (particularly survey measures) appear in the ROGS, as if absolving
themselves of the responsibility of reporting them. But public knowledge of the ROGS
is likely to be small.
The ROGS asserts that it has a role in public accountability and transparency and makes
a point of reporting its data in a way that is accessible to a broad audience, but it is
difficult to believe that it would be accessed by anyone other than bureaucrats,
politicians and researchers. Of course, it could be argued that the mere act of making it
public (regardless of who views it) is sufficient to make government agencies feel
somewhat accountable.
Finding 5
The Report on Government Services contains useful comparative data for government
planning purposes but has less value as a way for the West Australian community to
evaluate the performance of its police force.
Recommendation 2
The Report on Government Services should not be considered a substitute for
thorough reporting in the WA Police annual report.
The Road Safety Council reports quarterly on a set of Safety Performance Indicators for
the road safety areas expected to contribute most to the overall reduction in road
trauma. WA Police provides data for this purpose. The indicators cover:
Final crash outcomes in terms of reductions in killed and seriously injured (KSI);
Intermediate outcomes in terms of changes to mean travel speeds,
enforcement hit rates, appropriateness of road and roadside infrastructure,
community awareness of road safety messages and crashworthiness of vehicle
fleet;
Levels of effort and activity in program areas such as enforcement and
education and road treatments.170
The Committee believes these are important indicators, but unfortunately it is not clear
exactly where or how they are reported. The quarterly reports are presumably
170 Road Safety Council, Report on Activities 2013-14, Government of Western Australia, Perth,
2014, p32.

49
presented at meetings of the RSC but whether they are shared with anyone else is
unclear. They do not appear on the RSC website.
The RSC annual Report on Activities does not report them either, except in the form of
a dot-point summary (which barely changed between the 2012-13 and the 2013-14
reports). The only dot-point item related to police traffic enforcement (both years) was
that enforcement efforts were having a positive effect on drink driving charge rates,
with the number of breath tests rising and the number of charges laid falling.171
The RSC says that it monitors police enforcement and crash statistics at its meetings
(held almost monthly)172, but WA Police is not accountable to the RSC for its
performance. It is only expected to account for the successful acquittal of projects
funded by the Road Trauma Trust Account (RTTA).
WA Police submits quarterly reports to the Office of Road Safety (ORS), which outline
performance against project KPIs created by the police when submitting RTTA project
plan and fund applications. The indicators must meet the SMART criteria – that is, they
must be Specific, Measurable, Achievable, Relevant, Time-bound.
The Committee viewed the most recent quarterly reports for two RTTA-funded police
projects: Enhanced Speed Enforcement Administration Costs and Increase Breath and
Drug Testing.
Interestingly, some of the KPI targets for the Enhanced Speed Enforcement
Administration Costs were different in the quarterly report (second quarter) to what
had been proposed in the Project Plan and Fund Application. For example,
performance indicator 4, “Percentage of detected red light incidents converted to
infringements”, had a target of 80 per cent in the project plan and a target of 70
per cent in the quarterly report. Conveniently, this meant that the actual
performance of 76.7 per cent now met the KPI.
The only explanation offered by WA Police was that “the targets were reviewed
during negotiations between WA Police and the Office of Road Safety on available
funding levels”.173
The Committee has formed the view that some of the RTTA reporting KPIs may be
arbitrary since they seem to be so easily adjusted. While they provide a measurable
performance indicator for management purposes for the ORS, they do not necessarily
measure effectiveness. Police have a target of a certain number of breath and drug
171 This assertion is problematical as the increase in volume of testing is not necessarily targeted and
attitudinal surveys which would assist in interpreting the figures are no longer conducted. 172 Road Safety Council, Report on Activities 2013-14, Government of Western Australia, Perth,
2014, p25. 173 Mr Craig Ward APM, Acting Deputy Commissioner (Specialist Services), Letter, 5 May 2015.

50
tests that need to be conducted each quarter for the Increase Breath and Drug Testing
project. But how do police and the ORS know whether the RTTA funding for 20 breath
and drug operations staff and additional hours for testing has actually achieved the
project outcome of reducing the number of people killed and seriously injured in
crashes resulting from impaired driving? Is the deterrence strategy (increased
likelihood of being tested) paying off?
The project outcome for the Enhanced Speed Enforcement Administration Costs
project is simply that infringement processing will be timely and accurate. WA Police is
currently achieving beyond the target, with most infringements issued within 10 days
and most speeding incidents converted to infringements. The contribution of this to
road safety is less clear, and in fact has been questioned by bodies such as the RAC,
which does not believe RTTA funds should be used for administrative purposes such as
this.
The projects are then reported on in narrative form in the RSC Report on Activities. For
projects which involve an intervention (for example increased breath and drug testing)
there is no assessment of the impact on road safety, and this is probably not known.
The summary of progress for the (discontinued) STEP program states that performance
targets were exceeded but does not explain what these were.
Finding 6
Police-related performance indicators reported by the Road Safety Council and Office
of Road Safety (in relation to Road Trauma Trust Account projects) do not provide a
good indication of the effectiveness of the police in improving road safety. It is not
clear whether post-funding evaluation is undertaken for Road Trauma Trust Account
projects.
4.2 Reporting and publication of data
The only performance measures that agencies are required to report on in their annual
reports are the audited KPIs. However, this does not mean that other intermediate
performance indicators cannot be reported – and in fact, the OAG encourages agencies
to do this.
WA Police says that even with the paring back of the audited KPIs, it will continue to
collect the same data as it always has and will make this information available to the
public on its website.174
However, there is a difference between publishing figures on a website and including
the data in the annual report where some kind of analysis and contextual narrative is
generally included.
174 Mr Anthony Kannis, Executive Director, WA Police, Transcript of Evidence, 6 May 2015, p9.

51
The question that might be asked is whether the omission of that data from the annual
report renders it less important in the minds of the public. If the data is not presented
as a key performance indicator, does this send a message that the police do not take
these factors as seriously when implementing strategies for traffic policing? Perhaps
more importantly, does it give the impression that police are hiding something?
Given that a key purpose of KPIs is to demonstrate transparency, the question of what
data is made available to the public through the annual report and/or other means is
critical.
WA Police acknowledges that a role of the KPIs is to inform the agency’s stakeholders
about “how we are achieving or aiming to achieve the outcomes of government”,175
with stakeholders identified as the community, the media, parliament and the Minister
for Police.
But in terms of road policing, WA Police has only one audited measure through which
to convey its achievements. Unless it commits to providing additional unaudited
information in its annual report, the ability to assess WA Police on its road traffic
performance will be limited.
However, the judgement of the WA Police corporate executive, according to Mr Kannis,
is that the annual report should refer to the formal KPIs, and that other information
would not be included “to bulk up the annual report”.176
This is counter to the recommendations of the Office of the Auditor General, which is
that:
… this kind of information can go in the annual report of this or any
agency as an unaudited KPI and still get the same level of exposure … if
something does not totally stack up for an externally audited KPI, we
certainly do not encourage agencies to not report that information. So
there is that next step down elsewhere in the annual report, which is
open to scrutiny.177
The Auditor General has expressed his concern regarding the narrow focus of the new
KPI.
We are yet to audit the new 2014-15 Police KPI … however I am aware
of the concern that the amendment to the KPIs has resulted in useful
175 Mr Anthony Kannis, Executive Director, WA Police, Transcript of Evidence, 6 May 2015, p15. 176 ibid., p4. 177 Mr Don Cunninghame, Assistant Auditor General, Financial Audit, Office of the Auditor General,
Transcript of Evidence, 6 May 2015, p11.
52
information no longer being separately reported. This issue will be
considered during this year’s audit.178
In its submission, the RAC points out that the traffic enforcement performance
information in the annual report has declined in recent years and notes the loss of the
statistical appendix.
It says that while the annual report continues to be a statement of WA Police’s financial
position, it “is no longer delivering information that would allow a reader to gain a
comprehensive understanding of traffic enforcement in WA”.179 The RAC produced a
list of information it believes should be published, including information about
enforcement hours (traffic, RBT, drug testing, mobile, fixed and red-light camera
operation hours) and more detailed information showing types of infringements and
the role of speed, alcohol and other high risk behaviours in fatal crashes. (See Appendix
6 for full list).
WA Police advised the Committee that the following information from the RAC list is
recorded but not regularly published:180
Traffic hours
Random Breath Testing hours and deployments
Random Drug Testing hours and deployments
Mobile camera operation hours
Fixed camera hours
Fixed speed-red light camera hours
Random Drug Tests
Vehicle stops
Speed, alcohol and other high risk behaviours in fatal crashes
Mr Kannis said that the road policing information relating to operations and outputs
was released according to demonstrated need on a case-by-case basis.
The Auditor General advised that while most of the information suggested by the RAC
did not meet the definition of a KPI under Treasurer’s Instruction 904, this did not
prevent reporting in other parts of the annual report as “unaudited” information.181
178 Mr Colin Murphy, Auditor General, Letter, 22 May 2015. 179 Submission No.3 from RAC, 20 February 2015, p5. 180 Mr Anthony Kannis, Executive Director, WA Police, Letter, 5 June 2015.

53
This is consistent with the advice of Tiwana et al. (2015), who advocate “making many
contextual indicators widely available to promote transparency, comparison,
accountability and communication, alongside a relatively small set of core performance
indicators”.182
Finding 7
The limited information presented in the WA Police annual report means that
parliament, stakeholders and members of the community are unable to make an
informed assessment of police performance in relation to traffic law enforcement and
road safety.
Recommendation 3
WA Police should publish relevant and contextual road policing indicators in addition to
the Key Performance Indicator in its annual report, in order to provide a more
comprehensive account of its performance in relation to road safety. Relevant
information is that which would demonstrate outcomes in road safety.
Another option, according to the Auditor General, is to report the other measures on
the WA Police website “with appropriate contextual information including, for
example, prior period comparative information”.183
The WA Police website displays a fairly limited selection of traffic-related statistics. One
page184 shows the fatalities and critical injuries (year to date) for the current and the
previous three calendar years, as well as total deaths. There are also links to fatal crash
statistics going back to 1999.
On a separate web page,185 road policing statistics for the previous five financial years
are presented. These include the data previously reported for the audited KPIs (% of
drivers tested who were found to exceed the lawful alcohol limit and % of vehicles
monitored for speeding by speed cameras that were found to exceed the speed limit).
Other data includes seatbelt contacts (briefs, infringement and cautions) and
impounded vehicles. (See Appendix 6 for the full list).
This represents some of the data which the RAC suggests should be available to the
community, but it still does not tell the whole road safety story. As the WA Police
Union notes, the website information reflects the number of vehicles or drivers
181 Mr Colin Murphy, Auditor General, Letter, 22 May 2015. 182 Tiwana, N., G. Bass and G. Farrell, 'Police performance measurement: an annotated
bibliography', Crime Science, vol. 4, no. 1, 2015, p1. 183 Mr Colin Murphy, Auditor General, Letter, 22 May 2015. 184 See http://www.police.wa.gov.au/Aboutus/Statistics/Crashstatistics/tabid/1073/Default.aspx 185 See http://www.police.wa.gov.au/LinkClick.aspx?fileticket=qSqxEg3aoKs=&tabid=936

54
monitored or tested for drink-driving, speeding, seatbelts and restraints and other
traffic enforcement, but does not include specific infringement and conviction data.186
WA Police pointed out repeatedly to the Committee that despite the changes to the
KPIs there has been no change in the data that is collected, and the Committee accepts
this. The issue is with the accessibility of the data to the public and whether all of the
data is made available to relevant stakeholders (such as the RAC).
WA Police maintains that it shares its data with Main Roads, the Office of Road Safety
(ORS) and the Department of Health. Main Roads in turn shares that data with other
groups (such as local government bodies) as part of an ongoing arrangement with the
police.187 While the police used to provide monthly data to the RAC, it now provides
quarterly data to the ORS which the RAC can access.
In recent times both the Road Safety Council (RSC) and the RAC have been dissatisfied
with the provision of data by WA Police. In the case of the former, this was related to
police providing data to the RSC which the RSC then used to question police
performance in areas that are not funded through the RTTA (which the RSC oversees).
According to WA Police, it was not the RSC’s business to question police on statistics
that were core policing activities (and hence the responsibility of the Minister for
Police, not the RSC).188 The two parties had since come to an understanding that the
police would provide data that is relevant to the decision-making functions of the RSC
and that is useful in assessing the future directions of any road safety initiatives.189
Mr Anticich said that police no longer provided data directly to the RAC because data
production and reporting was a big draw on police resources and was becoming an
onerous task, to which the RAC did not contribute.190 WA Police produced a plethora of
reports which it had been rationalising over time.191
The data available through the ORS website is contained in reports such as the
Preliminary Fatal and Critical Injuries on Western Australian Roads 2014 Summary
(published earlier this year), but this does not contain any road policing data. Web
pages contain crash statistics showing demographic data, types of crashes and
contributing factors to crashes (behaviours) within the various regions of the State, and
186 Submission No.4 from WA Police Union, 27 February 2015, p12. 187 Mr Des Snook, Executive Director, Road Network Services, Main Roads Services Directorate,
Transcript of Evidence, 25 February 2015. 188 Mr Nick Anticich, Assistant Commissioner Traffic and Emergency Response, WA Police, Transcript
of Evidence, 3 March 2015, p14. 189 G.E. Dreibergs, Deputy Commissioner, Specialist Services, WA Police, Letter – Answers to
Questions on Notice, 18 March 2015. 190 WA Police, Briefing, Operations Support Facility, Midland, 13 May 2014. 191 Mr Nick Anticich, Assistant Commissioner Traffic and Emergency Response, WA Police, Transcript
of Evidence, 3 March 2015, p13.

55
there are various statistics scattered throughout other pages on the website. But again,
no road policing or traffic enforcement data are visible. Either it doesn’t exist or it is
very difficult to find.
The information is not on the RSC web page either. The most recent RSC Communiqué
(August 2014), which is essentially a record of the council’s most recent meeting,
provides a summary of the quarterly progress report submitted by the ORS, but again
this just documents the killed and seriously injured statistics.
The RSC annual report presents a table of KPIs which reports fatalities and serious
injuries, people killed and seriously injured in crashes involving illegal behaviour (high
speed, alcohol etcetera) and a number of other factors such as run off road crashes and
crashes at intersections. This is in table form and there is no further analysis presented.
The RSC annual report also includes a section called “Evaluating and Monitoring the
Effectiveness of Measures”, which sounds promising as a source of information on
whether road safety measures (including policing) have been effective. But it only
contains tables summarising the (on-time, on-budget) performance of RTTA projects
and a summary of network travel speeds (derived from surveys of on-road compliance
with speed limits conducted by Main Roads). In the 2012-13 report, this section also
included the evaluation results of community education campaigns (mainly TV
advertising campaigns).
If WA Police is providing the full set of data to the ORS on a quarterly basis, it appears
that it is not automatically being shared. It is not clear to the Committee what data
stakeholders are in fact receiving. While WA Police says it is collecting the same data it
has always collected, it does not appear that all of the data is accessible to other
groups (even via the ORS), and much less the public.
Even researchers at C-MARC are dependent on police for the data they need in order to
conduct their research. Mr Anticich, who sits on the C-MARC board, said that so long as
C-MARC projects were of benefit to
them (the police), they were happy
to commit resources to provide the
data.192 Whilst “benefit” in this case
was taken to mean “relevance to
law enforcement and policing”, it is
nevertheless worrying that researchers are at the mercy of police when it comes to
accessing data for (independent?) projects.
RAC policy and research senior manager Anne Still does not feel that the RAC has
access to enough information related to how enforcement translates into actual
192 WA Police, Briefing, Operations Support Facility, Midland, 13 May 2014.
In general terms, we can state that data quality
and data completeness of road crashes is of
extreme importance for road safety policies and
research – RAC submission
56
infringements or prosecutions. Data was critical to the monitoring strategy which
underpins the Towards Zero safety strategy.
If you do not have the data, how can you be expected to make
decisions about where to invest going forward? So, it is absolutely
critical to have that information to know what is happening now, and
then how any additional investment has impacted on road safety in
the State.
WALGA also referred to a decrease in the availability of speed data and data showing
hotspots. Local governments provide police with data from speed and volume
classifiers (rubber strips across the road) that record the speed of all vehicles, but
according to WALGA police said “they would not provide information back the other
way”.193
Concern about access to data by stakeholders and interested parties is justified insofar
as data assists in transparency of police operations and provides useful information for
policy and operational decisions. Dutch road safety expert Fred Wegman cannot
emphasise the importance of data enough in his 2012 report for the South Australian
government, and suggests that “road safety data be made available to everyone
(through the internet for example), paying appropriate attention to privacy issues”.194
The Committee has some sympathy with the reluctance of WA Police to commit to
making data available which is difficult to collect or interpret. For example, traffic
enforcement hours are difficult to measure because the meaning of a traffic patrol
hour is subject to interpretation.
The capacity for us to actually accurately get data on where officers
spend their time is very difficult…. Unless you have got an officer
walking around each day with a button that says traffic or general
duties or other things, you are not going to get to that point without
imposing a significant administration requirement upon the officers.195
The OAG agreed that it could be challenging to report KPIs that rely heavily on an
estimate by an officer of how much time they are spending on a particular type of
service.196 Nevertheless, comparative data or trends (i.e. from year to year) might be
useful in showing whether patrol hours were increasing or decreasing.
193 Ms Terri-Anne Pettet, WALGA RoadWise Program Manager, WALGA, Transcript of Evidence, 25
February 2015, p8. 194 Government of South Australia. Department of the Premier and Cabinet, Driving down the road
toll by building a Safe System, report prepared by Fred Wegman, Adelaide, 2012, p48. 195 Mr Anthony Kannis, Executive Director, WA Police, Transcript of Evidence, 3 March 2015, p14. 196 Mr Don Cunninghame, Assistant Auditor General, Financial Audit, Office of the Auditor General,
Transcript of Evidence, 6 May 2015, pp2-3.

57
However, police management can track how traffic officers have spent their time to
some degree. Traffic patrol hours are electronically recorded by WA Police in the
metropolitan area (but not regional districts) using the Computer-Aided Dispatch (CAD)
system, which logs tasks and jobs attended by all police vehicles. We also know that
breath and drug (BAD) bus officers were deployed to Sandstone to assist in a search for
missing prospectors in April and to Northcliffe for a week in February to assist with the
bushfire response. WA Police maintained that BAD bus personnel were only used for
other duties on special occasions,197 but if sufficient resources existed it would be
unnecessary to take one of only four of these special buses out of circulation.
The Committee was also told that of the 1000 CAD system tasks given to traffic officers
per month, around half related to non-traffic jobs.198 While this represents only 1.75
per cent of non-traffic jobs,199 it does mean that traffic officers are not available for
traffic duties.
Almost two-thirds of WA Police Union members believed they should be spending
more time on the road performing traffic duties, but many said they were unable to do
so because they were attending to administrative issues, did not have enough time in
their work day, or did not have enough staff or resources.200
In terms of the prosecution data which some organisations have requested, police
point to the problem of determining what a rise or fall in prosecutions actually means
(which was why the previous KPIs were replaced).
However, if WA Police only releases the data it thinks is reasonable and/or does not
share data, this surely risks accusations of having something to conceal.
Finding 8
There is not enough information presented on the WA Police website and the websites
of road safety organisations to enable parliament, stakeholders and members of the
community to make an informed assessment of police performance in relation to traffic
law enforcement and road safety.
An RTTA-funded project conducted by C-MARC in 2011 laid the groundwork for
establishing a comprehensive statistical database which would collect and integrate
road safety data from a range of bodies (WA Police, Main Roads, Department of
Transport, Department of Health etcetera).
197 Taylor, G., 'Cops shifted from booze buses ', The West Australian, 12 May 2015, p3. 198 G.E. Dreibergs, Deputy Commissioner, Specialist Services, WA Police, Letter – Answers to
Questions on Notice, 18 March 2015. 199 ibid. 200 Submission No.4 from WA Police Union, 27 February 2015, pp3-4.

58
The Enhanced Road Safety Information System (ERSIS) would be accessed by key
government road safety agencies and partners (including the RAC and WALGA) who
would be able to provide a consistent response to public requests for information and
requests by other Government agencies. The ORS had suggested that the online system
also include a query tool designed for access by members of the public.201
Following on from this, in October 2013 a business case for the ERSIS was presented to
the RSC which concluded that, despite in principle support, concerns about the cost
and the “capacity of supporting agencies to prioritise resources” meant it was unable
to support the project.202 Nevertheless ERSIS was listed on the RTTA 2014-15 budget as
a new project, with an RSC recommended budget of $821,250. This was not approved.
Mr Anticich has expressed his disappointment that the database has been put on the
backburner, since it would obviously ease the burden of data requests which WA Police
currently has to manage.203
It would also “facilitate all stages of road safety management including problem
identification, monitoring of relevant trends and outcomes, selection, formulation and
implementation of appropriate countermeasures and countermeasure evaluation”,
assisting in the translation of Safe System principles into practice.204
Such a system would include enforcement hours for specific traffic policing duties, as
well as hours of general road safety enforcement delivered.205 The availability of such
data through a system such as ERSIS would help end speculation about how police
spend their time.
Making more information available – not less – would also give police a basis for
countering common claims by the public that speed cameras are only located in places
where they can raise revenue and that placement of breath and drug buses is only
about meeting RBT targets.
Selling the message of general deterrence to the public is partly about education, and
statistics which show, for example, that random placement of mobile speed cameras
has an impact on the number of speeding drivers is a convincing way to do this.
201 D’Elia, A. and Newstead, S., An Enhanced Road Safety Information System for Western Australia,
Curtin-Monash Accident Research Centre, School of Public Health, Curtin University, September 2011, p13.
202 Road Safety Council, Report on Activities 2013-14, Government of Western Australia, Perth, 2014, p11.
203 WA Police, Briefing, 13 May 2014. 204 D’Elia, A. and Newstead, S., An Enhanced Road Safety Information System for Western Australia,
Curtin-Monash Accident Research Centre, School of Public Health, Curtin University, September 2011, p39.
205 ibid., pp12-16.

59
Finding 9
There is insufficient sharing of data related to traffic enforcement and road safety.
Recommendation 4
In the interests of public data sharing and transparency, the Enhanced Road Safety
Information System should be established, and potentially funded by unallocated funds
currently being held in the Road Trauma Trust Account.
4.3 Issues affecting the judgement of performance
There are a number of issues beyond the remit of policing which impact on the
performance of WA Police in regard to traffic policing and road safety. Some of those
issues are discussed here.
4.3.1 Lack of mandatory blood testing
In WA, whilst not mandatory, it is lawful for police to request that a driver or the
person in charge of a motor vehicle gives a blood sample within four hours of having
driven, or attempting to drive.206
Mandatory blood alcohol content sampling has been in place in jurisdictions other than
WA, Queensland and Tasmania for many years.207, 208 According to Dr Sudhakar Rao,
director of State Trauma at Royal Perth Hospital, WA is “completely out of step with
most of the country”.209 South Australian legislation, for example, stipulates that blood
samples must be taken from all persons (including passengers) who are 14 years or
older and, as a result of a motor vehicle accident, have suffered an injury and attend at
(or are admitted to) hospital for the purpose of receiving treatment for that injury.210
The Committee heard that proposed legislative amendments are being considered
which would oblige doctors (and their delegates) to take a blood sample in road trauma
patients in WA hospitals.211 The WA Police would take custody of the samples and
would be responsible for liaising with the patient.
206 Road Traffic Act 1974, section 66 - Breath, blood or urine sample, police powers to require etc
(WA). 207 Dr Sudhakar Rao, Director of State Trauma, Royal Perth Hospital, Transcript of Evidence, 11
March 2015. 208 Note that the resistance in WA was from the medical fraternity and this has been largely
overcome. 209 Dr Sudhakar Rao, Director of State Trauma, Royal Perth Hospital, Transcript of Evidence, 11
March 2015, p2. 210 Road Traffic Act 1961, section 471, South Australia. 211 Dr Sudhakar Rao, Director of State Trauma, Royal Perth Hospital, Transcript of Evidence, 11
March 2015.

60
Dr Rao predicts that mandatory testing in WA would result in approximately 2000 more
samples being taken per year.212 At present, the RPH trauma database records only
voluntary admission by the patient, meaning that there is likely to be a “significant
underestimation” of the prevalence of drugs and alcohol in road trauma in WA.213
“We would like to see better systems that allow us to measure, quantify and record the
type of drug, whether it is alcohol or any other type of substance,” Dr Rao said. “We do
not have the ability at the moment
to test every victim that comes
through.”
Dr Rao said that having the extra
level of data would enable trauma
managers and researchers to
compile evidence of whether a
new initiative or piece of legislation
was working “rather than have armchair experts who get up and say it does not work
or it does work”.
A measured level rather than a “yes” or “no” response from a patient with regard to
whether they had been drinking/taking drugs may show that even at lower levels there
is still an effect on reaction time. This in turn could influence road traffic laws.
Any assertion by WA Police that they are making in-roads into drink/drug driving must
be qualified in the absence of this data.
Finding 10
The inability to lawfully collect blood samples from road trauma patients limits the
ability of researchers to accurately assess the impact of alcohol and drugs on driving
impairment and road trauma. This is also an important measure for police in assessing
whether drink and drug driving campaigns are effective.
Recommendation 5
That the Minister for Police introduces an amendment to the Road Traffic Act (1974) to
enable the lawful collection of blood samples from road trauma patients as a matter of
priority.
212 Dr Sudhakar Rao, Director of State Trauma, Royal Perth Hospital, Transcript of Evidence, 11
March 2015. 213 ibid.,p2.
Without that data we are just using the same old programs over and over and we
are not seeing any changes and I can write the next 10 years’ reports today.
– Dr Sudhakar Rao, Director, State Trauma,
Royal Perth Hospital
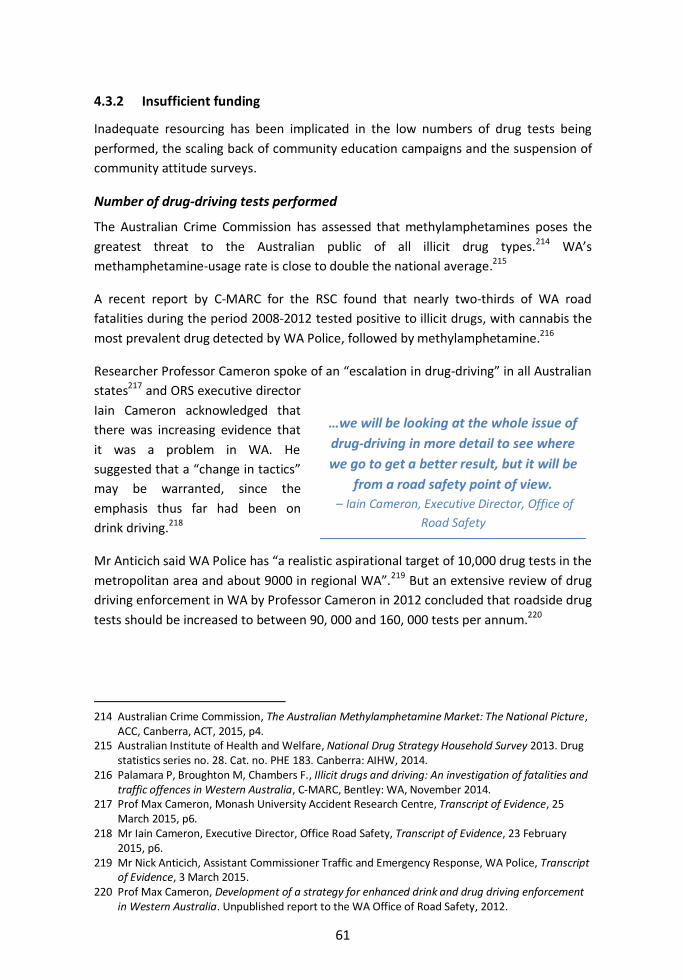
61
4.3.2 Insufficient funding
Inadequate resourcing has been implicated in the low numbers of drug tests being
performed, the scaling back of community education campaigns and the suspension of
community attitude surveys.
Number of drug-driving tests performed
The Australian Crime Commission has assessed that methylamphetamines poses the
greatest threat to the Australian public of all illicit drug types.214 WA’s
methamphetamine-usage rate is close to double the national average.215
A recent report by C-MARC for the RSC found that nearly two-thirds of WA road
fatalities during the period 2008-2012 tested positive to illicit drugs, with cannabis the
most prevalent drug detected by WA Police, followed by methylamphetamine.216
Researcher Professor Cameron spoke of an “escalation in drug-driving” in all Australian
states217 and ORS executive director
Iain Cameron acknowledged that
there was increasing evidence that
it was a problem in WA. He
suggested that a “change in tactics”
may be warranted, since the
emphasis thus far had been on
drink driving.218
Mr Anticich said WA Police has “a realistic aspirational target of 10,000 drug tests in the
metropolitan area and about 9000 in regional WA”.219 But an extensive review of drug
driving enforcement in WA by Professor Cameron in 2012 concluded that roadside drug
tests should be increased to between 90, 000 and 160, 000 tests per annum.220
214 Australian Crime Commission, The Australian Methylamphetamine Market: The National Picture,
ACC, Canberra, ACT, 2015, p4. 215 Australian Institute of Health and Welfare, National Drug Strategy Household Survey 2013. Drug
statistics series no. 28. Cat. no. PHE 183. Canberra: AIHW, 2014. 216 Palamara P, Broughton M, Chambers F., Illicit drugs and driving: An investigation of fatalities and
traffic offences in Western Australia, C-MARC, Bentley: WA, November 2014. 217 Prof Max Cameron, Monash University Accident Research Centre, Transcript of Evidence, 25
March 2015, p6. 218 Mr Iain Cameron, Executive Director, Office Road Safety, Transcript of Evidence, 23 February
2015, p6. 219 Mr Nick Anticich, Assistant Commissioner Traffic and Emergency Response, WA Police, Transcript
of Evidence, 3 March 2015. 220 Prof Max Cameron, Development of a strategy for enhanced drink and drug driving enforcement
in Western Australia. Unpublished report to the WA Office of Road Safety, 2012.
…we will be looking at the whole issue of
drug-driving in more detail to see where
we go to get a better result, but it will be
from a road safety point of view.
– Iain Cameron, Executive Director, Office of
Road Safety

62
The evidence presented in the recently released C-MARC investigation also supports
increasing the number of roadside drug tests among WA drivers/riders.221 C-MARC
analysed WA Police records of drivers/riders charged with Section 64AC offences of the
Western Australian Road Traffic Act (driving with prescribed illicit drugs in oral fluids)222
for the period 2008-2012.223
The study found that the number of roadside tests remained relatively stable over the
period 2008-2012 while the number of motor vehicle driver licences issued
increased.224
The Committee was told by police of some technical difficulties associated with
performing drug tests,225 but is also concerned that a lack of funding for drug testing
may be responsible for what it considers to be a low number of tests being performed.
WA Police applied to the RTTA for almost $12 million to fund the project Increase
Breath and Drug Testing in 2014-15, and the Road Safety Council recommended this
amount be granted. However, only $4.6 million was approved. (A similar amount – $4.7
million – was approved for 2015-16. See Appendix 7.)
They also applied for $842,832 for the Expansion of Drug Testing Capabilities but
received only $576,832 (a lesser amount than in 2013-14). Funds allocated for this
project in 2013-14 enabled the procurement of 20 Dräger Drug Test 5000 Analysers. It
also provided for the training of police officers in the use of the new equipment, paid
for related consumables, and covered the costs associated with analysis of positive
drug tests by the ChemCentre.226 The amount approved for 2015-16 is $866,139, in line
with the RSC recommendation. (See Appendix 7)
Despite being in their possession, WA Police was apparently frustrated by legalities and
the new drug testing equipment could not be utilised until after the gazettal of the
221 Palamara P, Broughton M, Chambers F., Illicit drugs and driving: An investigation of fatalities and
traffic offences in Western Australia, C-MARC: Bentley, WA, November 2014. 222 Section 64AC offences specifically relate to the detection of three prescribed substances: THC
(related to the use of cannabis), methylamphetamine (ice, crystal meth, crank) and MDMA (ecstasy).
223 Palamara P, Broughton M, Chambers F., Illicit drugs and driving: An investigation of fatalities and traffic offences in Western Australia, C-MARC, Bentley: WA, November 2014.
224 ibid. 225 Note that a 2009 review of WA drug driving laws (conducted following the 2007 amendment to
the Road Traffic Act 1974 to provide for two new offences related to drug driving) found that the drug testing team was well-equipped and the drug testing bus was working as well as intended. Source: Woolley, J.E. and Baldock, M., Review of Western Australian Drug Driving Laws, CASR Report, April 2009.
226 Palamara P, Broughton M, Chambers F., Illicit drugs and driving: An investigation of fatalities and traffic offences in Western Australia, C-MARC, Bentley: WA, November 2014, pp16-17.

63
Road Traffic (Drug Driving) Amendment Regulations 2014 which occurred in July
2014.227, 228
WA Police was also allocated RTTA funds in 2013-14 for the continued employment of
additional full-time police, recruited specifically for breath and drug testing operations
and to manage the additional workload associated with this.229 This resulted in an extra
256,072 alcohol and drug tests being conducted by metropolitan and regional police
districts and the Traffic Enforcement Group. A further 147,931 tests were undertaken
by the breath and drug bus.230 Figures provided to the Committee by WA Police reveal
that overall, 1,130,519 random and preliminary breath tests were conducted in 2013
and 1,089,757 in 2014.231, 232
However, the proportion of these tests that are for detecting drugs is very small. During
the period 2008 to 2012, WA Police conducted 43,176 drug-driving tests233 (see Table
5). There have been suggestions that this is linked to the much higher cost of
conducting drug tests,234 but the fact that the penalty for an alcohol driving offence is
higher than for a drug offence has also been identified as a contributing factor.
Table 5: Roadside Oral Fluid Sample Screening Tests for Prescribed Illicit Drugs 2008-12
Roadside Screenings
Section 64AC Offences
Offence Rate
Year n % n % Screenings* MVDL^
2008 9325 21.6 307 3.3 32.92 17.89
2009 7496 17.4 235 3.1 31.35 13.12
2010 9711 22.5 331 3.4 34.09 19.73
2011 7598 17.5 355 4.6 46.72 20.41 2012 9046 21.0 496 5.4 54.83 27.64
2008-2012 43, 176 100 1, 724 4.0 177.53 102.77 * per 1000 oral fluid screenings undertaken; ^ per 100,000 Motor Vehicle Driver Licences issued in WA.
Source: C-MARC report.235
227 Road Safety Council, Report on Activities 2013-14, Government of Western Australia: Perth, WA,
2014, p17. 228 These issues were also canvassed in a recent Estimates hearing. (Transcript of Evidence,
Assembly Estimates Committee B, p42b-68a, 9 June 2015, p21.) 229 Road Safety Council, Report on Activities 2013-14, Government of Western Australia: Perth, WA,
2014, p17. 230 ibid., pp16-17. 231 Note that this data is preliminary and is subject to revision. Data sourced from TEACEIS on 12
March 2015. 232 G.E. Dreibergs, Deputy Commissioner, Specialist Services, WA Police, Letter – Answers to
Questions on Notice, 18 March 2015. 233 Palamara P, Broughton M, Chambers F., Illicit drugs and driving: An investigation of fatalities and
traffic offences in Western Australia, C-MARC, Bentley: WA, November 2014. 234 Professor Max Cameron, Monash University Accident Research Centre, Transcript of Evidence, 25
March 2015, p4. 235 Palamara P, Broughton M, Chambers F., Illicit drugs and driving: An investigation of fatalities and
traffic offences in Western Australia, C-MARC, Bentley: WA, November 2014.

64
Table 6: Number of roadside drug tests conducted per year (by State, 2013-14)
State Number of drug tests
South Australia 47,680
Victoria^ 42,780
New South Wales 32,000
Queensland 23,740
Tasmania 1819 Source: 2013-14 annual reports for the police services of each State.
^Note, Victoria announced in January 2015 that it would increase the number of drug tests to 100,000
per year by the end of October 2015.236
Once a driver is found to have exceeded the legal blood alcohol concentration (BAC)
limit for their licence class, WA Police automatically exclude them from drug testing.237
As the C-MARC report explains:
This is because the penalty for an alcohol offence is greater than that
for an illicit drug offence and secondly, because of the additional cost
involved in drug testing the driver who is already subject to a
penalty.238
If indeed this is the practice of WA Police then it is likely that a high proportion of
drivers who test positive for alcohol in a random breath test will have used an illicit
substance, but will not be detected or charged by WA Police. This is concerning given
that C-MARC’s evidence points to a “very strong association” between illegal BAC levels
and illicit drug use in its latest study of fatally injured drivers.239
According to C-MARC, Victoria Police has recognised this issue and plans to impose
stronger sanctions for alcohol and drug-driving related offences, including a new
offence for the combined use of alcohol and illicit drugs. Victoria Police also plans to
drug-test the majority of drivers who test positive for alcohol – a practice which C-
MARC recommends WA Police adopt, along with the “combined impairment”
offence.240
Finding 11
The number of drug-driving tests currently being performed by WA Police is lower than
in other States and significantly less than recommended in drug-driving studies.
236 ABC News, ‘Police to double roadside drug testing in Victoria as state road toll increases’.
Available from: http://www.abc.net.au/news/2015-01-01/police-to-double-roadside-drug-testing-in-victoria/5995776 Accessed on 15 June 2015.
237 Palamara P, Broughton M, Chambers F., Illicit drugs and driving: An investigation of fatalities and traffic offences in Western Australia, C-MARC, Bentley: WA, November 2014.
238 ibid., pp68-69. 239 ibid., p69. 240 ibid.

65
Recommendation 6
That WA Police performs at least 90,000 roadside drug tests per year, as per the expert
advice provided in 2012.
Recommendation 7
That more drivers who test positive for alcohol are also tested for drugs.
Recommendation 8
That the Minister for Police introduces amendments to the Road Traffic Act (1974) to:
establish an offence for the combined use of alcohol and illicit drugs; and
provide for drug driving to attract the same penalty as drink driving.
Advertising campaigns and community education
It has been established that advertising in conjunction with police enforcement builds
on the perception of detection and the risks associated with drink and drug driving
much earlier than would be achieved by enforcement alone.241
According to the RSC, media expenditure was reduced pending the outcome of an
independent review of the effectiveness of mass media campaigns.242
In 2013-14 WA invested $1.7 million in road safety media campaigns funded by the
RTTA (down significantly from the previous year) and in 2014-15 the budget for road
safety community education was only $2 million. The executive director of ORS, which
manages the community education campaigns, said there had been both a reduction in
the budget and a requirement to cover more issues.243 The approved budget for 2015-
16 has doubled to $4 million, but is still well below the amount spent by New South
Wales and Victoria on road safety messages.
WA’s investment per capita is in stark contrast to the Victorian Transport Accident
Commission (TAC) which invests more than double the WA amount244 (see Table 7).
The TAC has applied significant resources to understanding what works in road safety
advertising and why it works. It has identified that there is a commercially viable return
on investment in reduced claims from road safety promotion.245
241 Australian Drug Foundation, ‘Drugs and driving’, Prevention Research Quarterly, Issues paper, no.
12, March 2010. 242 Road Safety Council, Report on Activities 2013-14. Government of Western Australia: Perth, WA,
2014, p9. 243 Mr Iain Cameron, Executive Director, Office Road Safety, Transcript of Evidence, 23 February
2015, p17. 244 Enth Degree, ‘Review of Office of Road Safety Mass Media Campaigns’, June 2014, p56. Available
at: http://www.ors.wa.gov.au/Documents/ORS/mass-media-review.aspx. Accessed 26 May 2015. 245 ibid.

66
Table 7: Road safety spend per capita 2009-2012
State Population Road Safety Spend $ Spend per Capita $
New South Wales 7, 218, 500 8, 931, 000 $1.24
Victoria 5, 537, 900 11, 361, 000 $2.05
Queensland 4, 476, 700 2, 931, 000 $0.65
South Australia 1, 639, 600 2, 203, 000 $1.34
Western Australia 2, 353, 400 1, 975, 000 $0.84
TOTAL 21, 226, 100 27, 401, 000 $1.29
Source: AC Nielsen Adex/ABS, cited in Enth Degree report.
The Committee is concerned that the reduction in spending on road safety community
education makes the job of WA Police more difficult, given that safe driving messages
are not being broadcast to the same degree.
Mr Anticich said that WA Police was not affected by the RTTA program cuts inasmuch
as it runs its own road safety media campaigns with no money.
We run a high-profile media campaign, albeit it is not funded and it is
not paid for, but essentially it is trying to get messages out there…
tragically it is often off the back of some disaster on the road.246
However, TV advertising campaigns such as “You Deserve It” and “Enjoy the Ride” have
been shown to be effective in terms of awareness and message interpretation,247 and
post-campaign evaluations provide an important insight into the public’s attitudes and
behavioural intentions. 248
Finding 12
WA spends less on road safety advertising campaigns than most other states, leaving
law enforcement to carry the burden of deterring risky driving behaviour.
Recommendation 9
The Minister for Road Safety must ensure that sufficient funds are allocated from the
Road Trauma Trust Account to ensure well-designed and effective road safety
education and media campaigns are able to be consistently implemented.
246 Mr Nick Anticich, Assistant Commissioner Traffic and Emergency Response, WA Police, Transcript
of Evidence, 3 March 2015, p16. 247 Road Safety Council, Report on Activities 2012-13, Government of Western Australia: Perth, WA,
2013, p39. 248 Mr Iain Cameron, Executive Director, Office Road Safety, Transcript of Evidence, 23 February
2015, p3.
In Victoria, there is a genuine desire to drive responsibly, and for two reasons. Firstly because the message is so broadly and frequently broadcasted in the public eye it becomes second
nature, there is no avoiding the message. Enforcement comes a close second. – Tom Davies, Enough is Enough WA

67
Community attitude surveys
While the advertising evaluations provide an indication of behavioural intention (e.g.
after seeing “Enjoy the Ride” almost half said they were less likely to drive over the
speed limit249), they are not linked to actual behaviour and perceptions of road safety
and police enforcement.
Community attitude surveys used to measure this, as well as other things such as the
likelihood of being breath-tested and or having your speed checked at various times of
the week.
But the ORS has not administered community attitude surveys since November 2011,
when the contract expired and was not renewed. It was determined that the cost of
the contract (up to $840,000 per year) would be better spent on other road safety
249 Road Safety Council, Report on Activities 2012-13, Government of Western Australia: Perth, WA,
2013, p39.
Review of mass media campaign
In early 2014 Sydney-based firm Enth Degree was engaged to undertake a review of the Office of Road Safety’s mass media campaign, focussing on:
The value of new production compared to using existing advertising from other agencies throughout Australia;
The level of resources allocated to campaigns;
The performance indicators used for campaigns;
The economic/social cost for and against advertising; and
Whether the future campaign spending should include explicit education campaigns on emerging and ongoing road use issues, such as keep left, how to merge, etc.
The final report was presented to the State Government on 5 June 2014 and has recently been made publicly available on the Office of Road Safety website.
The report confirmed that substantial commitment to community education is required to
help reduce road trauma. Influencing road user behaviour through safe road use education
and enforcement initiatives, as outlined in Towards Zero, had the potential to save 2200
people from being killed or seriously injured over the life of the strategy.
The report was critical of the Office of Road Safety’s road safety advertising campaigns,
stating:
It appears that the agency plans on what is affordable, with little to no
rationale provided or documented for the recommended weight (and)
shape of the plan.

68
initiatives.250 While there is no legislative requirement for the community attitudinal
surveys to be conducted, they had been carried out since March 1994.251
ORS executive director Mr Cameron agreed that the qualitative information captured
by monitoring the attitudes and behaviours of motorists was useful for the ORS and it
informed and guided road safety campaigns.
…it is also important for us monitoring quarterly performance to know
what the public is thinking. It is not the strongest measure. The
strongest measures are things like alcohol-related crashes and things
but it is another input to how we are going. 252
Mr Cameron confirmed that the ORS was in the process of organising a new contract
and he hoped that the surveys would be reinstated “in the near future”.253
The Committee supports the reintroduction of the surveys as a valuable evaluation and
strategic planning tool. If, for example, the surveys showed that 80 per cent of people
thought it was unlikely that they would be stopped for an RBT on a Tuesday night, it
would be an indication that the “anytime, anywhere” message (and strategy) was not
as effective as it should be. These surveys support what would otherwise be merely an
assertion that drivers are deterred by specific enforcement actions at specific times.
In the absence of the WA driver attitude survey, the Community Attitudes to Road
Safety (CAS) informs the ORS.254 CAS is an Australia-wide longitudinal study, now in its
twenty-third iteration (WAVE 23, 2013), that monitors perceived and actual attitudes
to a variety of road safety issues, evaluates specific road safety countermeasures,
suggests new areas for intervention and identifies significant differences between
jurisdictions.255 Given its broader scope, it does not provide as much data specific to
WA.
Recommendation 10
The Western Australian driver attitude surveys should be reinstated as a matter of
priority.
250 Hon Michael Mischin, Attorney General, WA, Legislative Council, Parliamentary Debates
(Hansard), 3 Apr 2014, p2068. 251 Hon Kim Chance, Leader of the House representing the Premier, WA, Legislative Council,
Parliamentary Debates (Hansard), 7 May 2008, p2570. 252 Mr Iain Cameron, Executive Director, Office Road Safety, Transcript of Evidence, 23 February
2015, p3. 253 ibid., p16. 254 Mr Iain Cameron, Executive Director, Office Road Safety, Transcript of Evidence, 23 February
2015, p3. 255 Department of Infrastructure and Regional Development, Community Attitudes to Road Safety:
2013 Survey Report, April 2014. Available at: http://www.infrastructure.gov.au/roads/safety/publications/2013/pdf/community_att_13.pdf. Accessed on 2 June 2015.
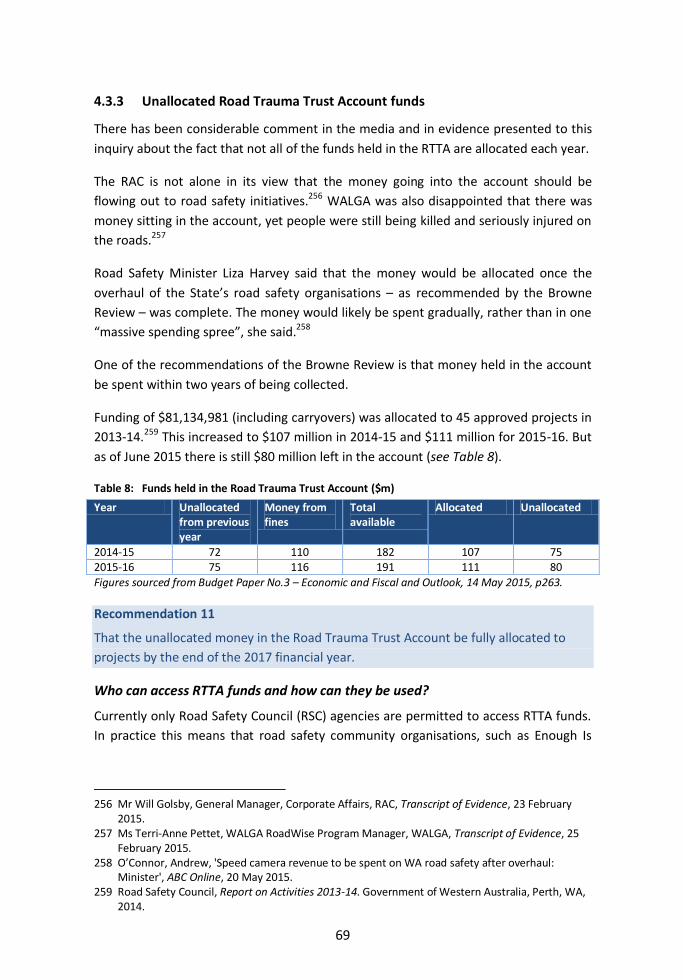
69
4.3.3 Unallocated Road Trauma Trust Account funds
There has been considerable comment in the media and in evidence presented to this
inquiry about the fact that not all of the funds held in the RTTA are allocated each year.
The RAC is not alone in its view that the money going into the account should be
flowing out to road safety initiatives.256 WALGA was also disappointed that there was
money sitting in the account, yet people were still being killed and seriously injured on
the roads.257
Road Safety Minister Liza Harvey said that the money would be allocated once the
overhaul of the State’s road safety organisations – as recommended by the Browne
Review – was complete. The money would likely be spent gradually, rather than in one
“massive spending spree”, she said.258
One of the recommendations of the Browne Review is that money held in the account
be spent within two years of being collected.
Funding of $81,134,981 (including carryovers) was allocated to 45 approved projects in
2013-14.259 This increased to $107 million in 2014-15 and $111 million for 2015-16. But
as of June 2015 there is still $80 million left in the account (see Table 8).
Table 8: Funds held in the Road Trauma Trust Account ($m)
Year Unallocated from previous year
Money from fines
Total available
Allocated Unallocated
2014-15 72 110 182 107 75 2015-16 75 116 191 111 80
Figures sourced from Budget Paper No.3 – Economic and Fiscal and Outlook, 14 May 2015, p263.
Recommendation 11
That the unallocated money in the Road Trauma Trust Account be fully allocated to
projects by the end of the 2017 financial year.
Who can access RTTA funds and how can they be used?
Currently only Road Safety Council (RSC) agencies are permitted to access RTTA funds.
In practice this means that road safety community organisations, such as Enough Is
256 Mr Will Golsby, General Manager, Corporate Affairs, RAC, Transcript of Evidence, 23 February
2015. 257 Ms Terri-Anne Pettet, WALGA RoadWise Program Manager, WALGA, Transcript of Evidence, 25
February 2015. 258 O’Connor, Andrew, 'Speed camera revenue to be spent on WA road safety after overhaul:
Minister', ABC Online, 20 May 2015. 259 Road Safety Council, Report on Activities 2013-14. Government of Western Australia, Perth, WA,
2014.
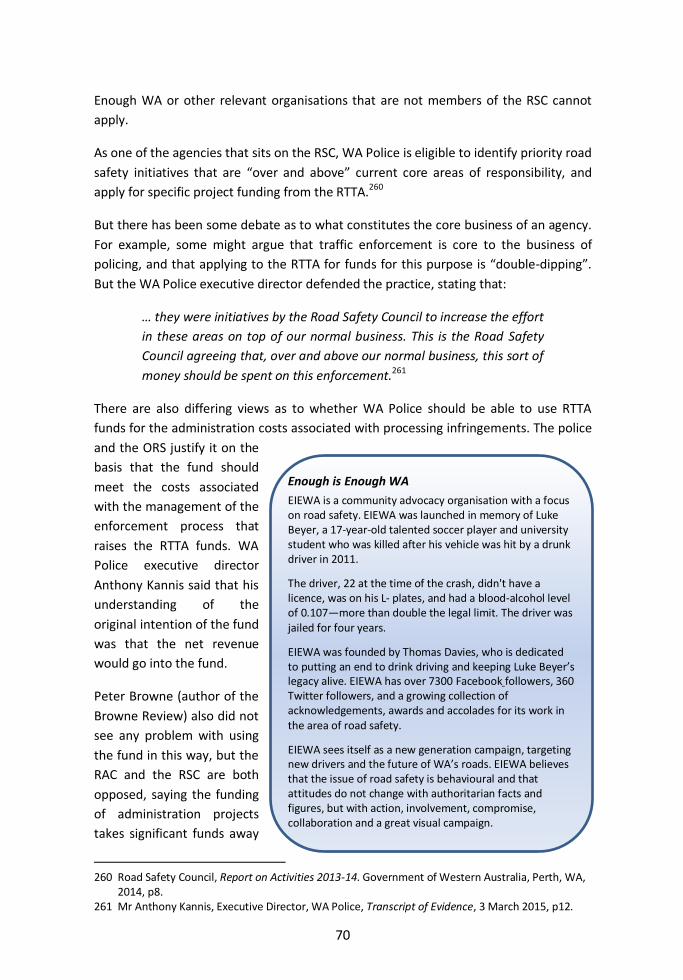
70
Enough WA or other relevant organisations that are not members of the RSC cannot
apply.
As one of the agencies that sits on the RSC, WA Police is eligible to identify priority road
safety initiatives that are “over and above” current core areas of responsibility, and
apply for specific project funding from the RTTA.260
But there has been some debate as to what constitutes the core business of an agency.
For example, some might argue that traffic enforcement is core to the business of
policing, and that applying to the RTTA for funds for this purpose is “double-dipping”.
But the WA Police executive director defended the practice, stating that:
… they were initiatives by the Road Safety Council to increase the effort
in these areas on top of our normal business. This is the Road Safety
Council agreeing that, over and above our normal business, this sort of
money should be spent on this enforcement.261
There are also differing views as to whether WA Police should be able to use RTTA
funds for the administration costs associated with processing infringements. The police
and the ORS justify it on the
basis that the fund should
meet the costs associated
with the management of the
enforcement process that
raises the RTTA funds. WA
Police executive director
Anthony Kannis said that his
understanding of the
original intention of the fund
was that the net revenue
would go into the fund.
Peter Browne (author of the
Browne Review) also did not
see any problem with using
the fund in this way, but the
RAC and the RSC are both
opposed, saying the funding
of administration projects
takes significant funds away
260 Road Safety Council, Report on Activities 2013-14. Government of Western Australia, Perth, WA,
2014, p8. 261 Mr Anthony Kannis, Executive Director, WA Police, Transcript of Evidence, 3 March 2015, p12.
Enough is Enough WA
EIEWA is a community advocacy organisation with a focus on road safety. EIEWA was launched in memory of Luke Beyer, a 17-year-old talented soccer player and university student who was killed after his vehicle was hit by a drunk driver in 2011.
The driver, 22 at the time of the crash, didn't have a licence, was on his L- plates, and had a blood-alcohol level of 0.107—more than double the legal limit. The driver was jailed for four years.
EIEWA was founded by Thomas Davies, who is dedicated to putting an end to drink driving and keeping Luke Beyer’s legacy alive. EIEWA has over 7300 Facebook followers, 360 Twitter followers, and a growing collection of acknowledgements, awards and accolades for its work in the area of road safety.
EIEWA sees itself as a new generation campaign, targeting new drivers and the future of WA’s roads. EIEWA believes that the issue of road safety is behavioural and that attitudes do not change with authoritarian facts and figures, but with action, involvement, compromise, collaboration and a great visual campaign.

71
from road safety initiatives. Note, while the official RSC stance is to oppose this use of
funds, the RSC chair was more equivocal:
I hear the argument, I hear the fact that people say that it is cost
shifting—and the RAC have talked about that a lot—but, to my mind,
the $9 million or $10 million that we spend on the back end is
worthwhile for the return of over $100 million to spend on road safety
initiatives.262
The RAC has called for safeguards and standards to be embedded into RTTA
funding agreements so that the money spent is on road safety initiatives that are
“over and above” what currently happens.263 This would ensure that RTTA funding
is not substituted for standard annual agency budgets derived from consolidated
funds.264
Recommendation 12
That safeguards be put in place to ensure that Road Trauma Trust Account funding is
not substituted for regular core government agency funding.
The Committee was also apprised of the RTTA-funded Strategic Traffic Enforcement
Project (STEP) that provided for WA Police to undertake traffic enforcement “above
baseline levels”.265
Subsequent to the project being approved and RTTA funds allocated, the Commissioner
of Police ceased paying overtime to police officers who were engaged in STEP effective
30 June 2014.266 The RTTA STEP funds were returned to the ORS.
Mr Kannis explained the rationale behind the decision:
The position taken was that paying the officers overtime was not the
best way of spending the Road Trauma Trust Account moneys, and we
agreed that the money could go back to the fund so that the Office of
Road Safety could determine a better way of achieving its objectives,
through the sorts of examples you referred to earlier, such as
262 Professor Murray Lampard, Chair, Road Safety Council, Transcript of Evidence, 23 February 2015,
p4. 263 Ms Anne Still, Senior Manager of Policy and Research, RAC, Transcript of Evidence, 23 February
2015, p9. 264 RAC, RAC response to the review of Road Safety Governance in Western Australia, October 2014
p2. Available at: http://bit.ly/1HgWb0b Accessed on 20 May 2015. 265 Road Safety Council, Report on Activities 2013-14. Government of Western Australia, Perth, WA,
2014, p17. 266 Submission No.4 from WA Police Union, 27 February 2015, p7.

72
advertising and other things. It would be better spent on advertising
than on officers being paid overtime to do more patrols.267
The Committee was told that police should aim for at least 1.5 tests per driver per year
to act as an effective deterrent. Such a target should not be subject to the vagaries of
budget negotiations whilst dipping into the RTTA for “core police business”. It is
important the target be routinely met.
Prevent Alcohol and Risk-related Trauma in Youth (PARTY)
While it seems there was flexibility in the definition of “core business” with regard to
police projects, this was not the case with Royal Perth Hospital’s award-winning PARTY
program, which was ruled ineligible for RTTA funds.
RPH State Trauma program manager Maxine Burrell told the Committee that the
program, which makes teenagers aware of the consequences of road trauma, could not
be funded by the RTTA because it was seen as a core business of the hospital.268
A 2012 study found that the PARTY program was a cost-effective way of modifying the
behaviour of juveniles who had committed traffic-related offences and had been
referred by juvenile justice court magistrates:
…attendance of the PARTY youth injury awareness program was
associated with a change in the attitudes of the juvenile justice
offenders about risk-taking behaviour and significantly reduced their
subsequent risk of injuries and committing traffic or violence-related
offences.269
State Trauma director Dr Sudhakar Rao told the Committee that many of the
participants of the PARTY program had provided positive feedback and valued the
program.270
Ms Burrell told the Committee that the program was so popular that sessions routinely
booked up in advance and there was now a waiting list.271
Royal Perth Hospital has been able to fund the PARTY program until June 2015, but
funding arrangements for the hospital have been transferred to a Commonwealth
267 Mr Anthony Kannis, Executive Director, WA Police, Transcript of Evidence, 3 March 2015, p13. 268 Ms Maxine Burrell, State Trauma, Royal Perth Hospital, Transcript of Evidence, 11 March 2015. 269 Ho, Kwok, Geelhoed, Elizabeth, Gope, Monica, Burrell, Maxine and Sudhakar Rao, ‘An injury
awareness education program on outcomes of juvenile justice offenders in Western Australia: an economic analysis’. BMC Health Serv Res, 2012, 12, 279.
270 Dr Sudhakar Rao, Director, State Trauma, Royal Perth Hospital, Transcript of Evidence, 11 March 2015.
271 Ms Maxine Burrell, State Trauma, Royal Perth Hospital, Transcript of Evidence, 11 March 2015.
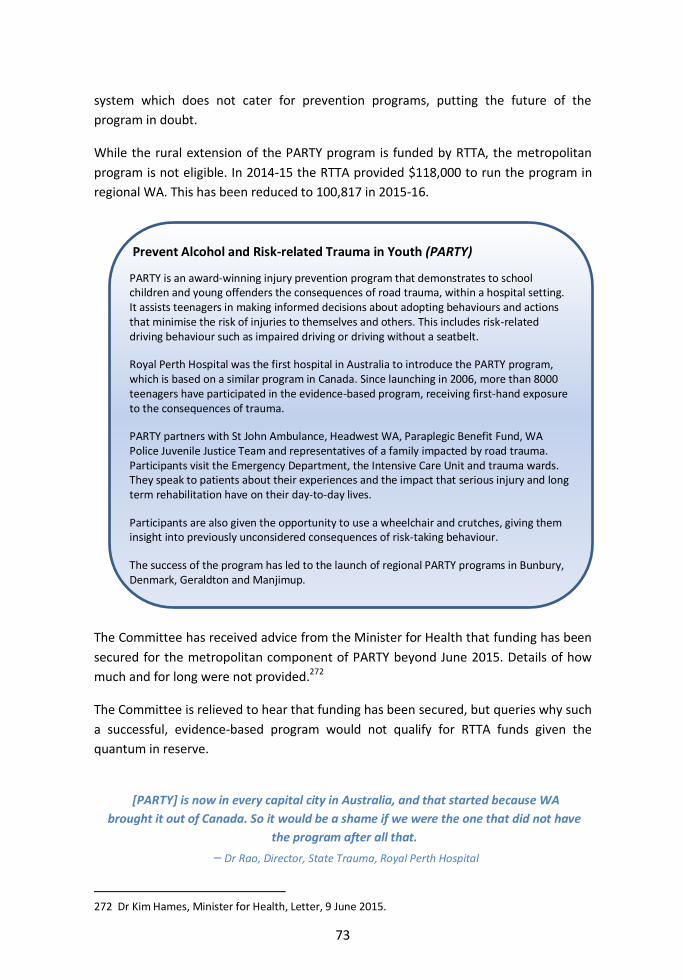
73
system which does not cater for prevention programs, putting the future of the
program in doubt.
While the rural extension of the PARTY program is funded by RTTA, the metropolitan
program is not eligible. In 2014-15 the RTTA provided $118,000 to run the program in
regional WA. This has been reduced to 100,817 in 2015-16.
The Committee has received advice from the Minister for Health that funding has been
secured for the metropolitan component of PARTY beyond June 2015. Details of how
much and for long were not provided.272
The Committee is relieved to hear that funding has been secured, but queries why such
a successful, evidence-based program would not qualify for RTTA funds given the
quantum in reserve.
272 Dr Kim Hames, Minister for Health, Letter, 9 June 2015.
Prevent Alcohol and Risk-related Trauma in Youth (PARTY)
PARTY is an award-winning injury prevention program that demonstrates to school children and young offenders the consequences of road trauma, within a hospital setting. It assists teenagers in making informed decisions about adopting behaviours and actions that minimise the risk of injuries to themselves and others. This includes risk-related driving behaviour such as impaired driving or driving without a seatbelt.
Royal Perth Hospital was the first hospital in Australia to introduce the PARTY program, which is based on a similar program in Canada. Since launching in 2006, more than 8000 teenagers have participated in the evidence-based program, receiving first-hand exposure to the consequences of trauma.
PARTY partners with St John Ambulance, Headwest WA, Paraplegic Benefit Fund, WA Police Juvenile Justice Team and representatives of a family impacted by road trauma. Participants visit the Emergency Department, the Intensive Care Unit and trauma wards. They speak to patients about their experiences and the impact that serious injury and long term rehabilitation have on their day-to-day lives.
Participants are also given the opportunity to use a wheelchair and crutches, giving them insight into previously unconsidered consequences of risk-taking behaviour.
The success of the program has led to the launch of regional PARTY programs in Bunbury, Denmark, Geraldton and Manjimup.
[PARTY] is now in every capital city in Australia, and that started because WA
brought it out of Canada. So it would be a shame if we were the one that did not have
the program after all that.
– Dr Rao, Director, State Trauma, Royal Perth Hospital

74
Application process
Applications are assessed by the RSC on their ability to support the Towards Zero
strategy, the total funding available and past performance.273 The RSC then
recommends a budget to the Minister for Road Safety.
The current road safety governance structure gives rise to allegations of actual and
perceived conflicts of interest. This is supported by the findings of the Browne
Review.274
There appears to be a lack transparency in determining which submissions are granted,
not granted, or granted in part. No explanations are given as to why an application is
unsuccessful. This lack of feedback makes it difficult for an applicant to improve its
submission for future bids.275
The Committee was also told that each year the RTTA application process was onerous
and labour intensive.276
The Committee is cognisant that some of these issues may be addressed in the changes
to the administration of road safety in Western Australia announced recently by the
Minister for Road Safety.
4.3.4 The role of local government
According to the WA Local Government Association (WALGA), local governments have
an important role to play in road safety as owners and managers of an extensive road
network, representing 88 per cent of WA roads. 277 Almost two-thirds of serious crashes
occur on local roads,278 therefore local governments have a significant responsibility for
ensuring their roads are safe.
WALGA has expressed concern at the lack of traffic enforcement on local roads.
Residential streets are now the scene of nuisance hoon activity – including speeding,
excessive revving of car engines and loud tyre screeches and burnouts.
273 Road Safety Council, Report on Activities 2013-14. Government of Western Australia, Perth, WA,
2014, p36. 274 Peter Browne Consulting, A Review of Road Safety Governance in Western Australia, March 2014. 275 Professor Murray Lampard, Chair, Road Safety Council, Transcript of Evidence, 23 February 2015,
p4. 276 WA Police, Briefing, Operations Support Facility, Midland, 13 May 2014. 277 Cr Geoff Amphlett, WALGA State Council, Road Safety Council Member, WALGA, Transcript of
Evidence, 25 February 2015; Western Australian Local Government Association, A Review Of Road Safety Governance In Western Australia: Interim Submission, Perth, WA, WALGA, October 2014, p8.
278 Ms Terri-Anne Pettet, WALGA RoadWise Program Manager, WALGA, Transcript of Evidence, 25 February 2015.

75
Congestion on main thoroughfares has meant that “rat runs” have sprung up in the
metropolitan area. These local roads have not been built to handle large volumes of
traffic. This is likely to continue given that Perth’s traffic congestion is forecast to
become the worst in the nation by 2031, according to Infrastructure Australia.279
However, as noted in an editorial in The West Australian, “the official focus is usually
on highways and other major roads … the state of local roads — where most of us live
and work — is often far from the minds of authorities dealing with how to spend
money on road safety initiatives”.280
While the State Government allocated local governments $2 million in 2009 for the
installation of speed humps and various road treatments in bid to combat hoon drivers
and “rat runs”281 (with varying success), WALGA says that local authorities would like to
see WA Police take more interest in local roads.
A C-MARC report commissioned by WALGA in 2011 recommended a model for the
participation of local government in the management of speed enforcement in WA in
partnership with WA Police, which involved local governments supplying information
on local area vehicle travel speeds for use by police in the strategic enforcement of
speeding. Local government would report to WA Police only those roads where at least
15 per cent of monitored vehicles exceeded the posted speed limit.282
The partnership was seen as “offering a more formalised approach to the sharing and
use of local area speed data to replace the ad-hoc arrangement that presently exists
between some local governments and WA Police”.283
WALGA’s representative on the RSC, Cr Geoff Amphlett, said it was a successful
initiative. Local governments reported roads which recorded a high number of
speeding vehicles to police, who targeted the area. Cr Amphlett said feedback
regarding troubles spots was then provided to the relevant council.
That was great. That worked… Unfortunately, since about 2013 we
have not been getting that feedback from the police, and that was the
relevance of it, I thought.284
279 Australian Government. Australian Infrastructure Audit - Our Infrastructure Challenges,
Infrastructure Australia, Sydney, April 2015. 280 Editorial, 'Priority needed to fix dangers on local roads', The West Australian, 1 September 2014,
p18. 281 Hon Dean Nalder, Minister for Transport, WA, Legislative Assembly, Parliamentary Debates
(Hansard), 19 May 2015, p3961. 282 Palamara, P., Hendrie, D., Fraser, M., Hughes, B., Langford, J., Local Government Enhanced Speed
Enforcement Management Project – Final Report, C-MARC, August 2011. 283 ibid., p(xiv). 284 Cr Geoff Amphlett, WALGA State Council, Road Safety Council Member, WALGA, Transcript of
Evidence, 25 February 2015, p4.

76
The C-MARC report noted that WA Police did not consider that it had the physical and
financial resources required to process and review the speed data supplied by local
government and to deliver the required additional hours of speed enforcement on
identified local area roads, but suggested the RTTA as a potential source of funding.285
But WALGA has been largely unsuccessful in acquiring funds from the RTTA and
receiving more funding for road safety would be local government’s number one wish,
according to WALGA’s deputy member on the RSC, Terri-Anne Pettet.286
WALGA saw communication with police as lacking, even though WA Police maintained
that it had regular contact with WALGA, including an intelligence officer who consulted
individual local government authorities. 287
If this is the case it is not something Cr Amphlett was aware of. He said WALGA
executives did not meet with senior police to discuss road rule enforcement but he
would welcome a police presence at City of Joondalup meetings, where he is a
councillor.
We have strategy sessions, and if the police could come and just tell us
what they were doing in the local area. We did have a talk from the
local policeman about the new community policing model that they
were doing, and that struck me as being an ideal forum—if they could
come in and tell the council where they were and what they were
doing, because, I will say it again, one of the most common complaints
we get is traffic issues.288
WALGA also partners with police and the community to improve road safety on rural
and regional roads. Through the grassroots RoadWise program, WALGA encourages
communities to focus on priority areas and strategies that will be effective in reducing
road trauma. It does this through its Local Government and Community Road Safety
Network, which extends throughout WA.
Officers coordinate 65 local road safety committees across the State, which bring
together all the players in road safety at a local level to consider local issues and come
up with actions that will address those issues (for example, the Driver Reviver campaign
to combat driver fatigue).
285 Palamara, P., Hendrie, D., Fraser, M., Hughes, B., Langford, J., Local Government Enhanced Speed
Enforcement Management Project – Final Report, C-MARC, August 2011, p(xv). 286 Ms Terri-Anne Pettet, WALGA RoadWise Program Manager, WALGA, Transcript of Evidence, 25
February 2015, p11. 287 G.E. Dreibergs, Deputy Commissioner, Specialist Services, WA Police, Letter – Answers to
Questions on Notice, 18 March 2015. 288 Cr Geoff Amphlett, WALGA State Council, Road Safety Council Member, WALGA, Transcript of
Evidence, 25 February 2015, p4.

77
However, RTTA funding allocated to the RoadWise program was halved in 2013-14,
which means that instead of having a road safety officer to serve each region of the
State, one officer now services three regions. Ms Pettet said that the level of service
that local governments and communities get from the RoadWise program has
diminished.
Ms Pettet said RoadWise officers valued the local police input at road safety committee
meetings, as did the local governments and the communities that they worked in. But
the Committee notes that fewer meetings means less opportunity for police to be
involved.
In 2013, WALGA commissioned an independent report to assess the RoadWise
program and to measure the health of the RoadWise Local Government and
Community Road Safety Network. The evaluation found that RoadWise was effective in
engaging road safety stakeholders in the community and that it provided opportunities
to facilitate community involvement in the implementation of the Towards Zero
strategy.289
It is concerning that given such a high proportion of road trauma occurs in regional WA
that, RTTA funding has been reduced or withdrawn from projects that have an impact
on road safety in rural or remote areas – contrary to advice from the RSC.
In addition to RoadWise, WALGA cites the lack of funding for the Regional Run-off Road
Crash Program for local roads and the School Drug Education and Road Aware (SDERA)
programs as examples. All of these programs delivered road safety messages
regionally.290
Finding 13
Police deployment and performance measures should take into account that almost
two-thirds of crashes occur on local roads.
Finding 14
The WA Local Government Association (WALGA) saw communication with police as
lacking even though WA Police maintained that it had regular contact with WALGA,
including an intelligence officer who consulted individual local government authorities.
289 Road Safety Council, Report on Activities 2013-14. Government of Western Australia, Perth, WA,
2014, p21. 290 Western Australian Local Government Association, A Review Of Road Safety Governance In
Western Australia: Interim Submission, Perth, WA, WALGA, October 2014, p3.

78
Finding 15
That the findings of the Regional Highway Safety Review being undertaken jointly by
the Office of Road Safety, WA Police and Main Roads be used to inform deployment of
police in the regions.
Finding 16
WA Police are key stakeholders in road safety. However, in the absence of clear and
unambiguous performance indicators, police are likely to be held solely responsible for
matters that are the responsibility of others.
4.4 Discussion and conclusions
In a briefing with the Committee, senior members of WA Police indicated that they had
been contemplating the question: What does success look like?
It is a critical question. Until WA Police defines what success should look like, it will
struggle to find valid ways of measuring it. The Committee has formed the view that
WA Police is still grappling with how it wants to define success in relation to traffic
enforcement and road safety. It is a significant challenge.
The ultimate indicator of success is surely a fall in the number of people killed and
seriously injured on our roads. But the police rightly point out that they are not the
only government agency with responsibility for the road toll.
Perhaps figures that show whether there has been a change in road safety behaviour
are a good indication of effectiveness. If so, effectiveness has been negligible.
According to the RPH State Trauma director, there has been no change in some of the
poor road user behaviour for the past 20 years.
I often joke that I can write the next 10 years’ reports. They are about
the same, so about 10 per cent of drivers do not wear seatbelts; about
20 per cent of front-seat passengers do not wear seatbelts; up to 30
per cent of back-seat passengers do not wear seatbelts; about nine per
cent of motorcycle riders do not wear a helmet; and anywhere from 20
to 30 per cent of cyclists do not wear helmets…291
But he is aware of the challenges police face in trying to influence road user behaviour.
Is it fair to judge them on this record?
The Committee’s views are outlined with reference to the three main questions
outlined in the Chapter One.
291 Dr Sudhakar Rao, Director of State Trauma, Royal Perth Hospital, Transcript of Evidence, 11
March 2015, p12.

79
4.4.1 How does WA Police know if it is making progress?
While some other jurisdictions (and the ROGS) include road toll figures as KPIs, the
OAG suggests that this would be a more appropriate measure for a coordinating
agency such as the Office of Road Safety (or the new Commissioner for Road Safety).
The Committee agrees that the road toll is not a reasonable KPI for police, given the
complexities of joint responsibility, but it should still be included in and commented on
in annual reports.
Interestingly, WA Police included a chart showing road fatalities per 100,000 people in
its 2013-14 annual report, with an acknowledgement that “Ultimately, the outcome of
lawful road-user behaviour should contribute to a reduction in road fatalities and
serious injuries”.292 But throughout the Inquiry WA Police seemed to distance itself
from effectiveness measures linked to the road toll.
The Committee does not believe that the single traffic enforcement KPI WA Police is
currently using as an audited reporting measure is enough to provide an indication of
effectiveness, nor is it a good outcome measure.
As Fleming and Scott (2008) noted, a closer link between outputs and outcomes was
important when measuring police performance.293 However, as discussed in Chapter
Three, governments were more inclined “to accept what police do (outputs) as a
measure of effectiveness than what they achieve (outcomes)”.294
This is partly because outputs are simpler to measure than outcomes, as suggested by
Southgate (2006). While it is nine years since the publication of Southgate’s review of
traffic policing performance measurement models in Australia, some of the statements
made in the report still appear relevant. For example:
Unfortunately, the relationship between enforcement activities
(outputs) and accident reduction (outcomes) is not as direct as is often
claimed or implied. First, the immediate cause of accidents is the
attitudes and behaviour of road users; what policing can do is to help
influence these, so that the link between policing and road trauma is a
two stage relationship.295
292 Western Australia Police, Annual Report 2013-14. Government of Western Australia: Perth, WA,
2014, p105. 293 Fleming, J. and A. Scott, 'Performance measurement in Australian Police Organizations', Policing,
vol. 2, no. 3, 2008, p329. 294 Cited in: Legrand, T. and S. Bronitt, 'Policing to a Different Beat: Measuring Police Performance',
in Tim Prenzler (ed.), Policing and Security in Practice, Palgrave Macmillan, UK, 2012, p6. 295 Southgate, P., Performance Measurement in Traffic Policing, prepared for Tasmania Police on
behalf of Australasian Traffic Policing Forum, Tasmanian Institute of Law Enforcement Studies, University of Tasmania, 2006, p41.

80
The RAC concurs:
… to evaluate the impact on driver attitudes of community education
campaigns on drink driving, the deterrence effect of enforcement and
other attitudinal influences must be isolated and examined. In essence
robust outcome monitoring, that identifies a causal link between
activities and behaviour change, is critical to facilitating informed
choices between alternate strategies and to enabling the more
effective use of scarce road safety financial resources.296
WA Police appears to have fallen victim to the well-documented tendency to measure
the thing that is most easily measured.297 The WA Police executive director
acknowledged that the new KPIs dealt with “things we can influence”.298 It covered
“the wider scope of things that can affect trauma” and that was the basis for its
inclusion. For internal management purposes, other data would be kept, but this was
not something they believed they should be measured by.299
By extension, this could imply that the police do not believe the attitudes and
behaviour of road users is something they can influence. It may also give the
impression that they do not want their performance on a range of traffic enforcement
measures scrutinised.
A limited set of KPIs (one in this case) may also result in police officers being
encouraged to focus only on achieving the KPI, a risk often raised in police performance
literature and summed up by Fleming and Scott:
… as with the classic ‘teachers will teach to the test’, so police officers
will tend to perform to an indicator that may distort the overall
balance of their policing activities.300
Even if other internal measures are in place, do police place less importance on these
than on the audited measure? If there is no KPI linked to a particular strategy (e.g.
education campaigns) is there a risk it will receive less attention?
As outlined by Smith (1995), some of the negative effects of publishing KPIs are that
agencies will: place an emphasis on the quantified elements of performance at the
expense of other aspects; pursue narrow objectives at the expense of greater success;
296 Submission No.3 from RAC, 20
February 2015, p6.
297 Australian Institute of Criminology, A tough nut to crack: Performance measurement in specialist policing, Technical and Background Paper 53, prepared by Zhivan Alach and Charl Crous, Australian Institute of Criminology, Canberra, 2012, p4.
298 Mr Anthony Kannis, Executive Director, WA Police, Transcript of Evidence, 6 May 2015, p3. 299 ibid., p8. 300 Fleming, J. and A. Scott, 'Performance measurement in Australian Police Organizations', Policing,
vol. 2, no. 3, 2008, p329.

81
pursue short-term success at the expense of long-term success; and emphasise
measures rather than underlying objectives. 301 In the Committee’s opinion, the current
traffic enforcement KPI is at risk of realising all of these effects.
Police have participated in research projects designed to evaluate practices and
interventions, and they indicated that they would be undertaking further evaluations.
Studies such as those undertaken by C-MARC can provide valuable insights into police
performance – but how police use it is another matter.
4.4.2 How does WA Police use performance information to guide its practice?
WA Police should be using its performance data to support the strategy of general
deterrence. But the rationale behind general deterrence is not readily understood,
both by the public and by many police officers. Both groups call for a higher police
presence on the roads, but the aim of general deterrence is to create the perception of
being caught “anywhere at any time” by random deployment of police traffic
resources.
The goal of general deterrence is not necessarily to catch offenders, which introduces a
potential conflict for police officers who may derive considerable job satisfaction from
making an arrest. Professor Max Cameron noted that police officers who had been
accustomed to crime policing may have difficulty adapting to the different way of
measuring success in traffic policing.302
Nevertheless, if general deterrence is well understood by officers at the strategic level,
it should be possible to determine from the performance data whether the strategy is
working.
The Committee is not convinced that this is occurring. Intelligence seems to be used
effectively in everyday traffic policing (at the tactical level) but it is not clear that it is
analysed at the higher level and applied to strategic decision-making. The Committee
believes that WA Police does not yet know whether its traffic enforcement strategies
are effective, in light of Mr Anticich’s comment that they were commissioning research
to find out if WA Police were doing what they said they were doing and whether it was
the right way to go.
More evaluation may also help WA Police determine the impact of the Frontline 2020
reforms on traffic policing. For example, is it better to quarantine traffic police or to
allow local policing teams to conduct more traffic enforcement? The WA Police Union
301 Cited in: Australian Institute of Criminology, A tough nut to crack: Performance measurement in
specialist policing, Technical and Background Paper 53, prepared by Zhivan Alach and Charl Crous, Australian Institute of Criminology, Canberra, 2012, p4.
302 Professor Max Cameron, Monash University Accident Research Centre, Transcript of Evidence, 25 March 2015, p3.

82
indicated that since the metropolitan policing districts had been combined (from seven
districts into four) members considered them to be too large for traffic officers to
effectively monitor.303 The majority of members also did not believe local policing
knowledge was taken into consideration when determining traffic enforcement and
road safety initiatives.
303 Submission No.4 from WA Police Union, 27 February 2015.
Visible presence of police on our roads
Opinion is divided on the value of a visible police presence on the roads. The community generally sees it as highly desirable, while police point out the difficulty of maintaining an effective presence. Some comments representing both points of view are presented.
In favour: Our Members indicated that spending more hours on the road meant that police had a far more visible presence, which acted not only as a deterrent to those who were repeat traffic offenders or those considering committing an offence, but demonstrated to members of the public the important presence of police in the community. – WA Police Union submission
Whilst the use of cameras is an important enforcement measure, a shift away from traditional methods may reduce the deterrence effect associated with highly visible policing. – RAC submission
We need more Police and physical enforcement on the roads to encourage WA road users to do the right thing, and to catch those who simply aren’t. – Tom Davies, Enough is Enough WA
… nothing, I believe, has greater effect on the minds of people than when they see high-visibility road policing out there. – Professor Murray Lampard, Road Safety Council chair
Against:
While more police having a visible presence on our roads is certain to cause an immediate reduction in fatal and serious crashes, the reduction will only be temporary, lasting only as long as the increase physical presence of police on our roads is maintained. Simply putting more police on the roads is an old fashioned attitude that is not the only or even best solution in our times. – Bernie Masters, former MP, submission
… the realities are when you look at the size of our state … in order to have a true high visibility, we would need hundreds if not thousands of police on the roads…. I think whilst the person sees the police vehicle and perhaps the behaviours are modified, there is every possibility that once they are outside of that range, perhaps their behaviour is not as good as it should be. What we do want to do and what we want to try to create, for example with our unmarked motorcycles, is the belief that any vehicle on the road could be a police vehicle. – Nick Anticich, Assistant Commissioner (Traffic and Emergency Response), WA Police
It is clearly a cost-effectiveness argument. We can do things much more cost effectively through automatic surveillance, especially in the case of speeding, than the cost of putting a policeman at the roadside. – Professor Max Cameron, road safety researcher

83
According to road safety researchers, WA Police often do not act on the findings and
recommendations of academic research. However, this may be because research is not
delivered in a way that is useful and practical for police. Several researchers have
acknowledged that research needs to be delivered to police in a more digestible
form304 and that police should take more ownership of scientific research.305
4.4.3 Do the reported measures give parliament, road safety stakeholders and
the public an adequate indication of whether traffic enforcement is effective?
The short answer to this question is “no”. The accessibility of data is limited, and the
reporting (by way of the annual report) has decreased in recent years.
The WA Police reported measures are few and the data provided to the public does not
tell the whole road safety story. Road safety measures reported by other agencies are
patchy at best in their ability to enlighten the public as to the effectiveness of initiatives
and the impact that police may be having on our roads.
304 Ms Janet Evans, Intelligence Analyst, Transcript of Evidence, 6 May 2015, p6. 305 Weisburd, D and Neyroud, P., 'Police Science: Toward a New Paradigm', Executive Session on
Policing and Public Safety, Australasian Policing, Vol. 5, No. 2, 2013, pp13-21.
RBT placement
There is considerable public speculation regarding when and where “booze buses” are placed. There is a common community perception that RBTs are conducted at times of the day when there are unlikely to be many alcohol affected drivers on the road, leaving road users vulnerable to drunk drivers who are not being detected at other more critical times of the day.
A WA Police Union survey revealed that its members believed that:
“Many alcohol and drug testing activities are being conducted during the daytime in order to increase the statistics relating to numbers of drivers tested. Members indicated that testing was occurring in the middle of the week or in the middle of the day, when more vehicles are present on the road but fewer drug and alcohol affected drivers are likely to be using the road.”
There was also a perception that RBTs were avoidable by taking back roads, and Royal Perth Hospital State Trauma director Dr Rao highlighted evidence from South Australia which revealed that back road crash numbers went up 40 per cent after the introduction of RBTs.
However, WA Police policy, in line with the theory of general deterrence, is that in order to be truly random, RBTs should be conducted at any time of the day or week. Assistant Commissioner Nick Anticich said:
“It is not our intention not to catch people drink-driving, but rather our primary focus, and what it is that those buses are set up to do, is to get the message out to the general public that there is a likelihood that they will be caught for driving if they drink.”

84
Websites and reports either present much of the same limited data as police, or
provide narrative without the support of evidence in the way of statistics and
evaluations.
Given that there is no central repository for information and the data that is published
is difficult to find, it is likely, as EIEWA representative Tom Davies notes, that “only
those truly interested will ever go looking and find the various reports, statistics and
information packs”.306
Police performance researchers and the public sector auditing bodies seem agreed on
the merits of reporting intermediate performance indicators alongside the KPIs, and of
including narrative and not simply reporting in numerical form.
Others (e.g. Davis (2012)) also recommend including survey measures, since they are
often easier to interpret than police data, which tends to focus on policing outputs.307
Wegman (2012) and others emphasise the importance of making police performance
transparent through the publication of data. The Committee notes that WA Police was
reluctant to supply data to the RSC because the council might ask questions about
police operations, and not just about the RTTA funded projects. But in the interests of
transparency and accountability, shouldn’t the council, and for that matter the public,
be questioning police operations?
4.4.4 A final word on the issue of responsibility
Road safety is without doubt the responsibility of multiple agencies. The Towards Zero
strategy recognises this and the membership of the RSC reflects this. If the agencies
themselves will not include the road toll as a performance indicator, should it be a
performance measure for the CEOs of the relevant agencies?
Recommendation 42 of the Browne Review was that consideration be given to
following the Victorian road safety model, in which CEO commitment to road safety is
secured by requiring relevant CEOs to collaborate and to present to the Minister for
Road Safety six-monthly reports on progress towards reducing road fatalities.
In the Western Australian context, the relevant CEOs were identified as the
Commissioner of Police, the director general of Transport, the director general of
Planning and the executive director of the Office of Road Safety (or the newly
appointed Commissioner of Road Safety), and could potentially include the heads of
Education and Health.
306 Submission No. 6 from Mr Thomas Davies, 13 April 2015, p1. 307 RAND Center on Quality Policing, Selected International Best Practice in Police Performance
Measurement, technical report prepared by Robert C. Davis, RAND Corporation, Santa Monica, California, 2012, p5. Electronic publication, available at www.rand.org

85
The ORS executive director and the Chair of the RSC agreed that CEOs should be held
accountable for road safety, and the RAC outlined in its submission the need for KPIs to
be held by the Minister for Road Safety and senior WA Police. However, when asked
whether road safety was part of the Police Commissioner’s personal KPIs, the
Committee was told that the Commissioner does not have a performance
agreement.308
The other group responsible for road safety is of course drivers, as we are constantly
reminded of by senior police and the Minister for Police and Road Safety.
Drivers are urged constantly to take more responsibility for their actions. After a
particularly bad weekend on the roads in March 2015, the Police Commissioner was
quoted in the media as saying he was “running out of ideas”.
This comment was probably made in exasperation, but if it is true it is truly alarming.
Police should not be running out of ideas. Whilst road policing is a complex business
and police work in a very challenging environment, it is not acceptable to keep blaming
the public. This is a dynamic environment in which new research and technological
innovations regularly offer opportunities for innovation and strategic refinement. There
is a wealth of research on the psychology of road users, and instituting behaviour
change is key. This is, as Professor Cameron notes, a police responsibility.
… in terms of short-term behaviour change, the police have a key role
to play. I know that the government is looking at improving the road
system and accelerating the availability of safer cars, but if you want
short-term change, there are very few other known effective things
you can do apart from appropriately managed traffic enforcement
supported by powerful mass media publicity.309
MS M.M. QUIRK, MLA
CHAIR
308 Mr Anthony Kannis, Executive Director, WA Police, Transcript of Evidence, 6 May 2015, p13. 309 Professor Max Cameron, Monash University Accident Research Centre, Transcript of Evidence, 25
March 2015, p6.

86

87
Appendix One
Inquiry Terms of Reference
The initial focus of the Inquiry into Methods of Evaluating WA Police Performance was
to investigate:
Performance measures used by WA Police to determine the effectiveness of traffic law
enforcement and road safety initiatives.


89
Appendix Two
Committee’s functions and powers
The functions of the Committee are to review and report to the Assembly on: -
a) the outcomes and administration of the departments within the Committee’s
portfolio responsibilities;
b) annual reports of government departments laid on the Table of the House;
c) the adequacy of legislation and regulations within its jurisdiction; and
d) any matters referred to it by the Assembly including a bill, motion, petition,
vote or expenditure, other financial matter, report or paper.
At the commencement of each Parliament and as often thereafter as the Speaker
considers necessary, the Speaker will determine and table a schedule showing the
portfolio responsibilities for each committee. Annual reports of government
departments and authorities tabled in the Assembly will stand referred to the relevant
committee for any inquiry the committee may make.
Whenever a committee receives or determines for itself fresh or amended terms of
reference, the committee will forward them to each standing and select committee of
the Assembly and Joint Committee of the Assembly and Council. The Speaker will
announce them to the Assembly at the next opportunity and arrange for them to be
placed on the notice boards of the Assembly.


91
Appendix Three
Submissions received
Name Position Organisation
Mr Colin Scott Citizen
Mr Reece Waldock Director General Department of Transport
Ms Liz Carey Senior Manager, Media and Government Relations
RAC
Mr George Tilbury President WA Police Union
Mr Bernie Masters Citizen
Professor Max Cameron Researcher Monash University Accident Research Centre
Mr Thomas Davies Founder Enough is Enough WA


93
Appendix Four
Hearings
Date Name Position Organisation
23 February 2015
Mr Iain Cameron Executive Director Office of Road Safety
Professor Murray Lampard
Chair Road Safety Council
Mr Will Golsby General Manager, Corporate Affairs
RAC
Ms Anne Still Senior Manager of Policy and Research
25 February 2015
Mr Des Snook Executive Director, Road Network Services, Main Roads Services Directorate
Main Roads
Cr Geoff Amphlett WALGA State Council, Road Safety Council Member
WALGA
Ms Terri-Anne Pettet
WALGA RoadWise Program Manager
3 March 2015 Mr Stephen Brown Deputy Commissioner - Operations
WA Police
Mr Anthony Kannis Executive Director
Mr Nick Anticich Assistant Commissioner Traffic and Emergency Response
Mr Ian Clarke Inspector, State Traffic Operations
11 March 2015 Dr Sudhakar Rao Director, State Trauma
Royal Perth Hospital
Ms Maxine Burrell State Trauma Program Manager
25 March 2015 Professor Max Cameron
Researcher Monash University Accident Research Centre [via videoconference]

94
6 May 2015 Ms Janet Evans Intelligence analyst and researcher
[via videoconference]
Mr Anthony Kannis Executive Director WA Police Mr Les Bechelli Acting Director,
Business Planning and Finance
Mr Mark Stringer Strategic Planning and Performance Analyst
Mr Vincent Turco Senior Director Financial Audit
Office of the Auditor General
Mr Don Cunninghame
Assistant Auditor General Financial Audit
Briefings
Date Name Position Organisation
24 November 2014
Mr Stephen Brown Deputy Commissioner
WA Police
Mr Jon Tuttle Commander
Ms Tara Doyle Acting Superintendent
Mr Brad Royce Superintendent
13 May 2015 Mr Stephen Brown Deputy Commissioner, Specialist Services and Reform
WA Police
Mr Chris Hannan OIC, State Traffic Intelligence Planning and Coordination Unit
Mr Brian Hunter OIC, Major Crash
Mr Ian Clarke Insp, State Traffic Command
Mr Michael Peters Supt, State Traffic Command
Ms Narelle Woods OIC, Breath and Drug Operations
Mr Nigel White Supt, Intelligence Operations - covert
Dr Charl Crous Commander, State Intelligence

95
Mr Paul Steel Acting Assistant Commissioner for Intelligence Portfolio
Mr Craig Donaldson Commander, State Traffic
Mr Nick Anticich Assistant Commissioner, Specialist Services and Support
Mr Mark Gilbert Supt, State Intelligence Services
Mr Mick Emmanuel Supt, Metropolitan Traffic Operations
Mr Rick Corkill Supt, Metropolitan Traffic Operations
Mr Stephen Temby Traffic Policy Unit
Mr Tony O’Donoghue Infringement and Camera Operations


97
Appendix Five
Acronyms
ANZPAA Australian and New Zealand Policing Advisory Agency
BAC Blood Alcohol Concentration
CAS Community Attitude Surveys
C-MARC Curtin - Monash Accident Research Centre
COAG Council of Australian Governments
EIEWA Enough is Enough WA
ERSIS Enhanced Road Safety Information System
FAB Financial Administration Bookcase
FIO Field Intelligence Officers
KPI Key Performance Indicators
KSI Killed and Seriously Injured
MDVL Motor Vehicle Driver Licences
MUARC Monash University Accident Research Centre
NIM National Intelligence Model
NPM New Public Management NRSS National Road Safety Strategy
NSCSP National Survey of Community Satisfaction with Policing
OAG Office of the Auditor General
OECD Organisation for Economic Co-operation and Development
OPR Operational Performance Review
ORS Office of Road Safety PARTY Prevent Alcohol and Risk-related Trauma in Youth
PI Performance Indicators
RAC Royal Automobile Association
RBT Random Breath Test ROGS Report on Government Services
RTTA Road Trauma Trust Account
RTTF Road Trauma Trust Fund
SCRGSP Steering Committee for the Review of Government Service Provision
SDERA School Drug Education and Road Aware
SDRM Service Definition Resource Model STEP Strategic Traffic Enforcement Project
STIPCU State Traffic Intelligence Planning and Coordination Unit
TAC Transport Accident Commission (Victoria)
TEACEIS Traffic Enforcement and Crash Executive Information System
TEG Traffic Enforcement Group
THC Tetrahydrocannabinol
TI Treasurer’s Instructions
WALGA Western Australian Local Government Association
WTP Willingness to Pay

98

99
Appendix Six
Types of traffic enforcement data
6A: List of figures the RAC says should be available to the public
From RAC submission, page 5:
Publishing the following range of information in a consolidated and consistent form would be a
significant step forward in the community understanding the nature and delivery of traffic
enforcement. The information could include:
Primary enforcement inputs and activities
o Traffic hours,
o Random Breath Testing hours, deployments,
o Random Drug Testing hours, deployments,
o Mobile camera operation hours,
o Fixed camera hours, and
o Fixed speed-red light camera hours.
Secondary enforcement output measures
o Speed- briefs, infringements, cautions,
o Seatbelts- briefs, infringements, cautions,
o Other traffic- briefs, infringements, cautions,
o Mobile camera- vehicles monitored, exceeding limit, infringed,
o Fixed speed camera- vehicles monitored, exceeding limit, infringed,
o Fixed speed-red light camera- vehicles monitored, exceeding limit, infringed,
o Non camera speed infringements,
o Random Breath Tests,
o Random Drug Tests,
o Other preliminary breath tests conducted,
o Vehicle stops,
o Work orders issued, and
o Impoundments.
Outcome measures
o Fatality counts and rate,
o Serious injury count and rate,
o Speed, alcohol and other high risk behaviours in fatal crashes, and
o Driver attitudes as measured by National Survey of Community Satisfaction with
Police Services (NSCSP) survey questions relating to speed, alcohol, restraints, and
other behavioural variables.

100
6B: Data provided on WA Police website
Available at: http://www.police.wa.gov.au/Aboutus/Statistics/Crashstatistics/tabid/1073/Default.aspx

101
Available at: http://www.police.wa.gov.au/LinkClick.aspx?fileticket=qSqxEg3aoKs=&tabid=936

102
6C: Extracts from Tasmania Police Corporate Performance Report, March 2015
Available from: http://www.police.tas.gov.au/about-us/our-performance/

103

104

105

106
6D: Extracts from community attitude survey, Oct-Dec 2010
Available from the Office of Road Safety website:
http://www.ors.wa.gov.au/Research/Community-Attitudes-Awareness
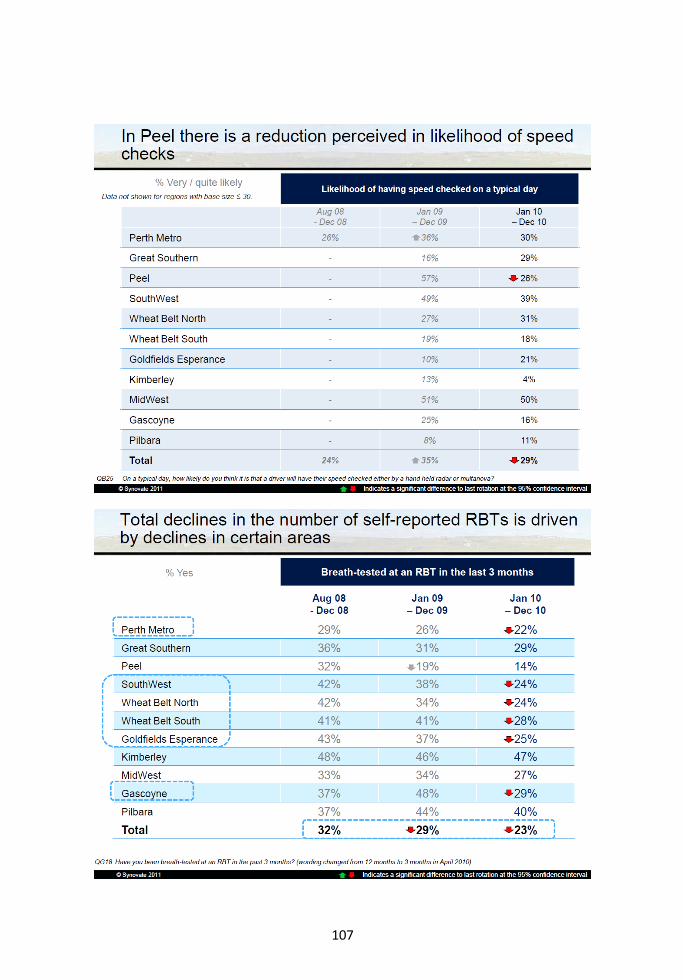
107

108
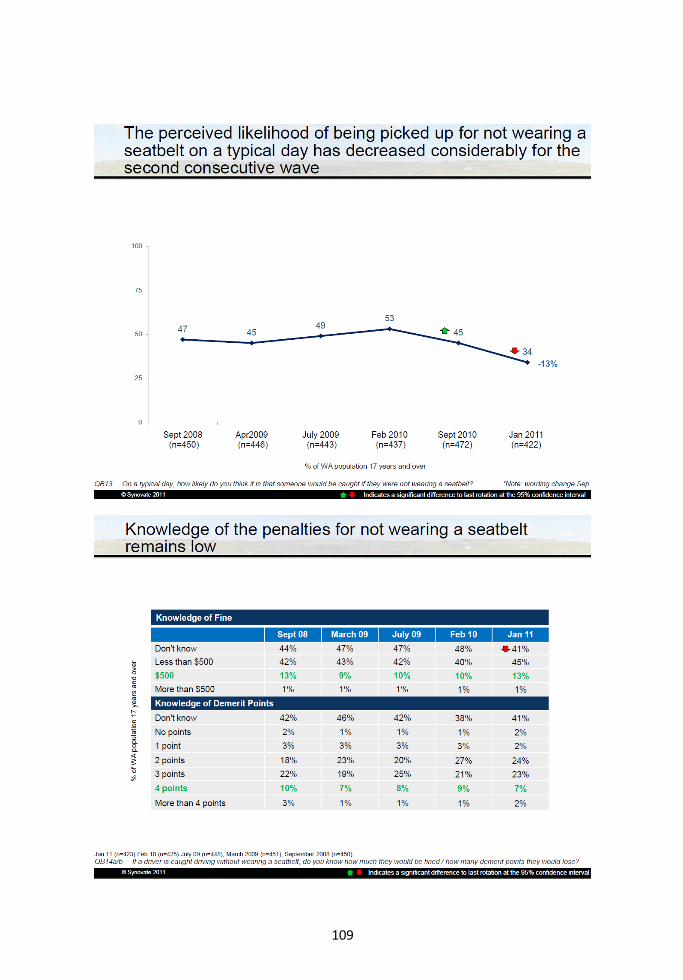
109

110

111
Appendix Seven
Road Trauma Trust Account project funding 2015-16
Project title Submitting
agency RSC
recommendation Approved
Metropolitan Intersection Crashes - State & Local Roads
MRWA 12,000,000 12,000,000
Cyclist Safety & Urban Design Study
MRWA 100,000 100,000
Urban Intersection Crash Project WALGA 0 0
Regional & Remote Road Improvements -State & Local Roads
MRWA 45,930,000 45,930,000
Safety Performance Report & Mapping
MRWA 120,000 120,000
Regional Run-off Road Crash Project for Local Roads
WALGA 0 0
Increase Breath & Drug Testing WA Police 4,736,813 4,736,813
Expansion of Drug Testing Capabilities
WA Police 866,139 866,139
Repeat Drink Driving Strategy Implementation
DoT 1,563,296 1,563,296
Heavy Vehicle Enforcement Program
MRWA 0 0
Drug Driving Education Campaign DAO 0 0
Alcohol Interlocks -Assessment & Treatment Services
DAO 773,066 773,066
Electronic School Zone Sign Project
MRWA 12,000,000 12,000,000
Speed Monitoring Project MRWA 150,000 150,000
Enhanced Speed Enforcement Administration Costs- WAPOL
WA Police 7,834,231 7,834,231
Enhanced Speed Enforcement Administration Costs- DOT
DoT 3,173,197 3,173,197
Speed Camera Replacement Program
WA Police 2,251,825 2,251,825
Enhanced Speed Enforcement Program - Phase II
WA Police - 2,228,000
Enhanced Speed Enforcement Program - Phase II
DoT - 877,028
Safer Vehicles- Policy Data & Crash Testing
ORS 315,000 315,000
State Wide Road Crash Rescue Lithium lon Expansion Tool
DFES 234,600 234,600
Heavy Rescue Air Cache Expansion Program
DFES 392,000 392,000
Volunteer Responder Road Crash Rescue Manage Injuries Training
DFES 0 0

112
Project title Submitting
agency RSC
recommendation Approved
Informing & Mobilising Road Safety Action
ORS 5,504,590 5,504,590
Road Safety Community Education & Engagement
ORS 4,050,000 4,050,000
Road Safety Community Grants ORS 360,000 360,000
Road Safety Research Development & Evaluation
ORS 970,000 970,000
Data Linkage & Road Safety Analysis Project
DOH 334,750 334,750
PARTY Program DOH 100,817 100,817
RoadWise WALGA 2,074,992 1,541,057
Road Aware DOE 1,582,000 1,582,000
Legal Services WAPOL 131,000 131,000
Road Trauma Support Service DOH 768,750 768,750
WA Injury Prevention aided by State Trauma Registries
DOH 0 0
Neurotrauma Research Program of Western Australia
DOH 0 0
TOTAL Road Safety Programs Expenditure
108,317,066 110,888,159