community colleges and economic mobility - economic research - st
TRANSCRIPT

FEDERAL RESERVE BANK OF ST. LOUIS REVIEW JANUARY/FEBRUARY 2010 27
Community Colleges and Economic Mobility
Natalia A. Kolesnikova
This paper examines the role of community colleges in the U.S. higher education system and theiradvantages and shortcomings. In particular, it discusses the population of community collegestudents and economic returns to community college education for various demographic groups.It offers new evidence on the returns to an associate’s degree. Furthermore, the paper uses datafrom the National Survey of College Graduates to compare educational objectives, progress, andlabor market outcomes of individuals who start their postsecondary education at communitycolleges with those who start at four-year colleges. Particular attention is paid to the FederalReserve’s Eighth District, the geographic area served by the Federal Reserve Bank of St. Louis.(JEL I20, I21, J30)
Federal Reserve Bank of St. Louis Review, January/February 2010, 92(1), 27-53.
Association of Junior Colleges did change its nameto the American Association of CommunityColleges.
The original goal of two-year colleges was toprepare students, through an associate’s degree(AD) program, to transfer to a four-year college.Over time, the purpose evolved to includeworkforce training programs, schooling towardcertification in areas such as nursing and otherprofes sions, and adult continuing educationclasses. A more recent development is that somecommunity colleges now offer bachelor’s degreesin a number of fields.
However, there are big differences acrossstates in how the community college system isused. Rouse (1998) found evidence suggestingthat states tend to focus their resources on eithera community college or a four-year college system.California has the largest network of the former;66 percent of the state’s current undergraduatesattend community colleges. In contrast, only 16
J oliet Junior College (Joliet, Illinois), theoldest community college in the nation,was founded in 1901. Since then, commu-nity colleges have become increasingly important for the U.S. education and train-
ing system. Today, 11.5 million students (6.5 mil-lion of whom are studying for college credits) areenrolled in almost 1,200 community colleges,according to the American Association ofCommunity Colleges. Community college stu-dents constitute a remarkable 46 percent of allU.S. undergraduates.
The term “junior college” originally referredto any two-year, postsecondary school. Over thelast few decades, the term “community college”became more popular to describe public two-yearinstitutions as it better conveys the mission ofthese colleges to serve their local communities.This distinction was not prevalent before the1980s and the two terms are still often used inter-changeably. However, in 1992 the American
Natalia A. Kolesnikova is an economist at the Federal Reserve Bank in St. Louis. Luke Shimek and Yang Liu provided research assistance.Portions of this paper previously appeared in The Regional Economist (Kolesnikova and Shimek, 2008, and Kolesnikova, 2009a) and as aFederal Reserve Bank of St. Louis Community Development Research Report (Kolesnikova, 2009b).
© 2010, The Federal Reserve Bank of St. Louis. The views expressed in this article are those of the author(s) and do not necessarily reflect theviews of the Federal Reserve System, the Board of Governors, or the regional Federal Reserve Banks. Articles may be reprinted, reproduced,published, distributed, displayed, and transmitted in their entirety if copyright notice, author name(s), and full citation are included. Abstracts,synopses, and other derivative works may be made only with prior written permission of the Federal Reserve Bank of St. Louis.
percent of undergraduates in Nevada andVermont are enrolled in community colleges.1
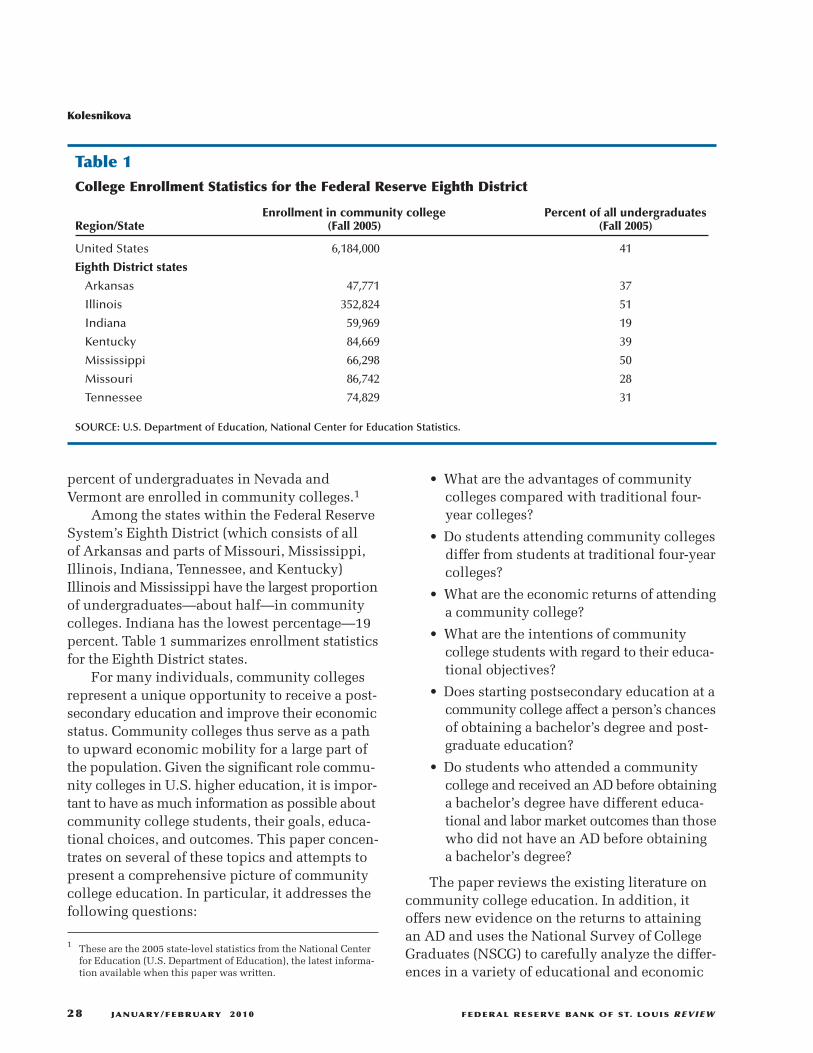
Among the states within the Federal ReserveSystem’s Eighth District (which consists of all of Arkansas and parts of Missouri, Mississippi,Illinois, Indiana, Tennessee, and Kentucky)Illinois and Mississippi have the largest proportionof undergraduates—about half—in communitycolleges. Indiana has the lowest percentage—19percent. Table 1 summarizes enrollment statisticsfor the Eighth District states.
For many individuals, community collegesrepresent a unique opportunity to receive a post-secondary education and improve their economicstatus. Community colleges thus serve as a pathto upward economic mobility for a large part ofthe population. Given the significant role commu-nity colleges in U.S. higher education, it is impor-tant to have as much information as possible aboutcommunity college students, their goals, educa-tional choices, and outcomes. This paper concen-trates on several of these topics and attempts topresent a comprehensive picture of communitycollege education. In particular, it addresses thefollowing questions:
• What are the advantages of communitycolleges compared with traditional four-year colleges?
• Do students attending community collegesdiffer from students at traditional four-yearcolleges?
• What are the economic returns of attendinga community college?
• What are the intentions of community college students with regard to their educa-tional objectives?
• Does starting postsecondary education at acommunity college affect a person’s chancesof obtaining a bachelor’s degree and post-graduate education?
• Do students who attended a communitycollege and received an AD before obtaininga bachelor’s degree have different educa-tional and labor market outcomes than thosewho did not have an AD before obtaininga bachelor’s degree?
The paper reviews the existing literature oncommunity college education. In addition, itoffers new evidence on the returns to attainingan AD and uses the National Survey of CollegeGraduates (NSCG) to carefully analyze the differ-ences in a variety of educational and economic
Kolesnikova
28 JANUARY/FEBRUARY 2010 FEDERAL RESERVE BANK OF ST. LOUIS REVIEW
Table 1College Enrollment Statistics for the Federal Reserve Eighth District
Enrollment in community college Percent of all undergraduates Region/State (Fall 2005) (Fall 2005)
United States 6,184,000 41
Eighth District states
Arkansas 47,771 37
Illinois 352,824 51
Indiana 59,969 19
Kentucky 84,669 39
Mississippi 66,298 50
Missouri 86,742 28
Tennessee 74,829 31
SOURCE: U.S. Department of Education, National Center for Education Statistics.
1 These are the 2005 state-level statistics from the National Centerfor Education (U.S. Department of Education), the latest informa-tion available when this paper was written.
outcomes between individuals who started theirpostsecondary education at community collegesand those who started at four-year institutions.2
ADVANTAGES OF COMMUNITYCOLLEGES
Compared with a traditional four-year college,a community college has several important advan-tages for students. To begin, the open admissionpolicy makes it easier for students to enroll regard-less of their prior academic record.
Attending community colleges costs lessbecause of lower tuition and other fees than thoseat four-year colleges. Community college studentson average paid $2,017 in tuition and fees for the2006-07 academic year, which is less than halfthe amount for students in public four-year uni-versities ($5,685) and only about one-tenth ofthe tuition and fees for students in private four-year universities ($20,492), according to the U.S.Department of Education.
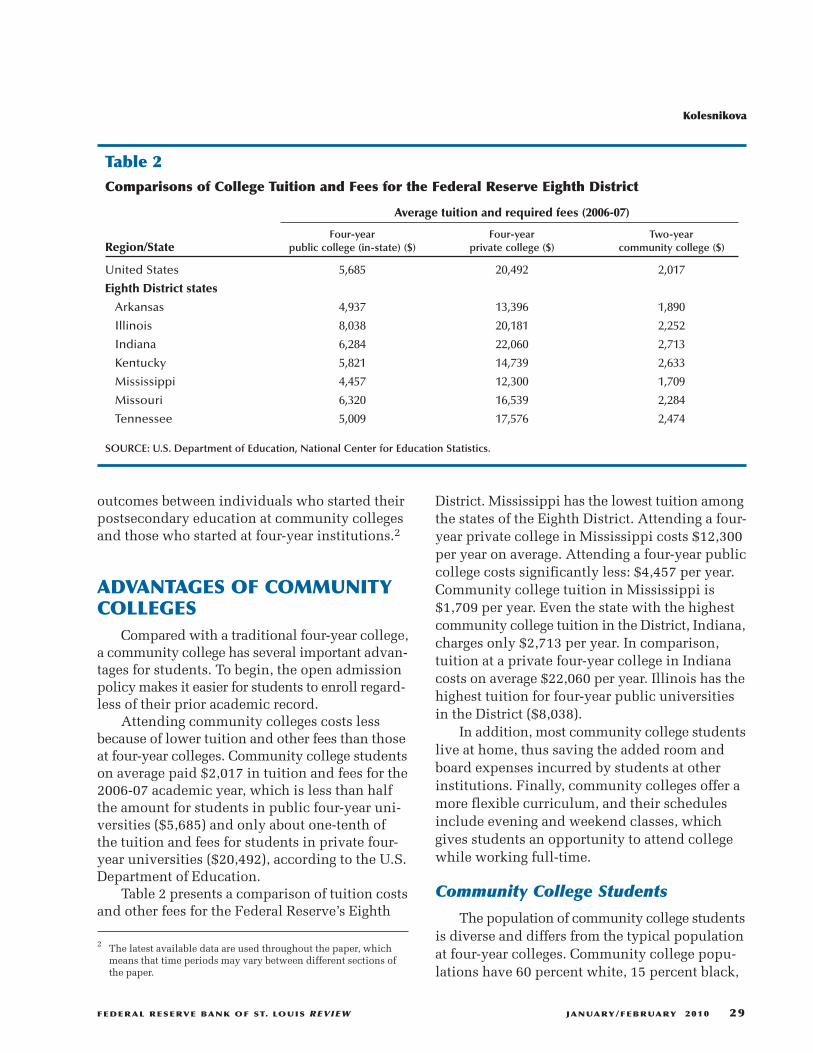
Table 2 presents a comparison of tuition costsand other fees for the Federal Reserve’s Eighth
District. Mississippi has the lowest tuition amongthe states of the Eighth District. Attending a four-year private college in Mississippi costs $12,300per year on average. Attending a four-year publiccollege costs significantly less: $4,457 per year.Community college tuition in Mississippi is$1,709 per year. Even the state with the highestcommunity college tuition in the District, Indiana,charges only $2,713 per year. In comparison,tuition at a private four-year college in Indianacosts on average $22,060 per year. Illinois has thehighest tuition for four-year public universitiesin the District ($8,038).
In addition, most community college studentslive at home, thus saving the added room andboard expenses incurred by students at otherinstitutions. Finally, community colleges offer amore flexible curriculum, and their schedulesinclude evening and weekend classes, whichgives students an opportunity to attend collegewhile working full-time.
Community College Students
The population of community college studentsis diverse and differs from the typical populationat four-year colleges. Community college popu-lations have 60 percent white, 15 percent black,
Kolesnikova
FEDERAL RESERVE BANK OF ST. LOUIS REVIEW JANUARY/FEBRUARY 2010 29
2 The latest available data are used throughout the paper, whichmeans that time periods may vary between different sections ofthe paper.
Table 2Comparisons of College Tuition and Fees for the Federal Reserve Eighth District
Average tuition and required fees (2006-07)
Four-year Four-year Two-year Region/State public college (in-state) ($) private college ($) community college ($)
United States 5,685 20,492 2,017
Eighth District states
Arkansas 4,937 13,396 1,890
Illinois 8,038 20,181 2,252
Indiana 6,284 22,060 2,713
Kentucky 5,821 14,739 2,633
Mississippi 4,457 12,300 1,709
Missouri 6,320 16,539 2,284
Tennessee 5,009 17,576 2,474
SOURCE: U.S. Department of Education, National Center for Education Statistics.

and 14 percent Hispanic students.3 Forty-onepercent of community college students are males.In comparison, students attending four-year col-leges are more likely to be white (70 percent) andmale (45 percent).
Because of the flexibility they offer and therelatively low monetary and time costs of attend-ing, community colleges have more so-callednontraditional students than four-year colleges.Community college students are more likely tobe older: 35 percent are 30 years old or older com-pared with 16 percent in four-year colleges. Theaverage community college student is 28 yearsold, with a median age of 24. The correspondingages for students in four-year colleges are 24 and21 years.
Only 31 percent of community college stu-dents are enrolled full-time, in part because stu-dents attending community colleges are morelikely to also be working. In contrast, 63 percentof students at four-year colleges are enrolled full-time. Only 21.4 percent of all community collegestudents do not work, compared with 30.5 percentat four-year colleges. Furthermore, 40.8 percentof community college students work full-time,compared with 22.8 percent of their four-yearcollege counterparts.
More students in community colleges are first-generation college students than are studentsattending four-year colleges. More than 40 percentof the former have parents with only a high schooleducation or less. In contrast, only 27 percent offour-year college students have parents with ahigh school education or less.
Not surprisingly, most community collegestudents attend an institution close to their home.They live on average 40 miles away from the col-lege they attend. In comparison, students at four-year institutions attend colleges on average 230miles away from their home. More than 95 percentof community college students attend colleges intheir home states compared with 83 percent ofstudents at four-year colleges.
LABOR MARKET RETURNSWhat is the economic payoff to attending
community college? The answer to this questionis rather complicated, partly because of the lackof available data. Until 1990, the U.S. CensusBureau recorded only the number of years of edu-cation, making it impossible to identify individ-uals attending community college specifically.In the 1990 and 2000 U.S. censuses, the highesteducational attainment was recorded instead ofyears of education. This makes it possible to focuson individuals with a completed AD. Still, thisinformation does not make it possible to identifyan institution students attended if they did notcomplete a degree.
Several available studies use different longi-tudinal survey data instead. Most of the surveysrecord data on various characteristics of respon-dents, starting with their teenage years and fol-lowing them through the years.4 One limitationof these studies is that, given the timeline of sur-veys, they include only students who enrolled incommunity college soon after graduating fromhigh school.
Most studies found that students whoattended community college, but did not completea degree, earn 9 to 13 percent more than thosewith only a high school diploma. The estimationtechnique usually attempts to control for differ-ences in academic preparation between the twogroups as measured by test scores and class rank.Furthermore, researchers found an increase inannual earnings of 5 percent to 8 percent associ-ated with each year of education at a communitycollege. This finding is particularly interestingbecause it is similar to the return to a year ofschooling in a four-year college.
Jacobson, LaLonde, and Sullivan (2005)looked at a very different group—older, high-tenure, displaced workers. Most retraining effortsfor this group take place at community colleges.These researchers found that one year of commu-nity college schooling increases the long-termearnings of displaced workers by about 9 percentfor men and about 13 percent for women com-
Kolesnikova
30 JANUARY/FEBRUARY 2010 FEDERAL RESERVE BANK OF ST. LOUIS REVIEW
3 Unless noted otherwise, the data in this section are from the Centerfor Education Statistics, U.S. Department of Education, 2003-04as presented in Horn and Nevill (2006).
4 See Kane and Rouse (1999) for a survey of these studies and amore detailed description of data.

pared with earnings for similar workers who didnot attend community college. Another importantfact reported by these authors is that technicallyoriented and math and science courses lead to ahigher earnings payoff—about 14 percent for menand 29 percent for women—but less technicallyoriented courses yield very low and possibly zeroreturns.
RETURNS TO AN ASSOCIATE’SDEGREE
Another way to assess the value of a commu-nity college education is to determine how muchmore a person with an AD earns compared witha similar person with only a high school diploma.Separate studies by Kane and Rouse (1995) andLeigh and Gill (1997) estimated the labor marketreturn to an AD is about 16 to 27 percent.
The much-larger dataset from the U.S. 2000Census5 affords answers to more detailed ques-tions. For instance, are there differences in labormarket returns to an AD between different demo-graphic groups? Are the returns the same acrossdifferent cities? Data also allow looking at thedifferentials in hourly wages rather than annualearnings.
The sample consists of men and women 25to 55 years of age with an AD or a high schooldiploma who live either in the 20 largest metro-politan areas of the United States (including St. Louis) or in large metropolitan areas of theEighth District (Memphis, Little Rock, andLouisville).
A simple matching estimator was used tocalculate, for each metropolitan area j, the rate ofreturn to an AD. Intuitively, people who have anAD were matched with those who do not but whohave otherwise similar demographic characteris-tics. We can ask, then, how their wages differ. Itis assumed that productivity, which translates intowages, is a function of education and age, sinceolder workers tend to have more work experience.
More precisely, for an individual with age x = X in metropolitan area j, we would like toestimate the causal effect of an AD (AD = 1),
the difference between the wage of an individualwith an AD and his or her potential wage if formaleducation stopped at the high school level. Here,y1 is the logarithm of the worker’s wage if theindividual has an AD, and y0 is the logarithm ofthe worker’s wage if the individual stops his orher education at high school. Of course, we cannotdirectly observe the second term in the aboveequation; we never observe what a person withan AD would have earned with only a high schooleducation.
If, however, we are willing to eliminate selec-tion problems by assumption (including the issueof ability bias that has received close attention inthe literature), we have
This equation simply means that the wages of aperson with an AD, if he or she did not receiveit, would have been the same as the wages of asimilar person with a high school diploma. Thus,the mean return to an AD in a particular metro-politan area j, denoted as Δ�j �, is
where dF �x | j � is the distribution of x in the metropolitan area.
In principle, Δ�j � might vary across citiessimply because of differences in the age distribu-tions in these cities. Such differences would beof little interest, so to “standardize” the estimates,I use the national cumulative distribution func-tion of x and calculate
where dFn�x � is derived from the national data.6
Δ X j E y x X AD j
E y x X AD j
, , ,
, , ,
( ) = = =( )− = =( )
1
0
1
1
E y x X AD j E y x X AD j0 01 0= =( ) = = =( ), , , , ,
Δ Δj x j dF x j( ) = ( )∫ ( ),
Δ Δn nj x j dF x( ) = ( )∫ ( ),
Kolesnikova
FEDERAL RESERVE BANK OF ST. LOUIS REVIEW JANUARY/FEBRUARY 2010 31
5 Data are from 2000 Public Use Micro Sample of the U.S. Census(see Ruggles et al., 2004).
6 For more on this approach to a nonparametric estimation ofreturns to schooling, see Black, Kolesnikova, and Taylor (2009).
This estimation is performed separately for menand women and for different racial groups.
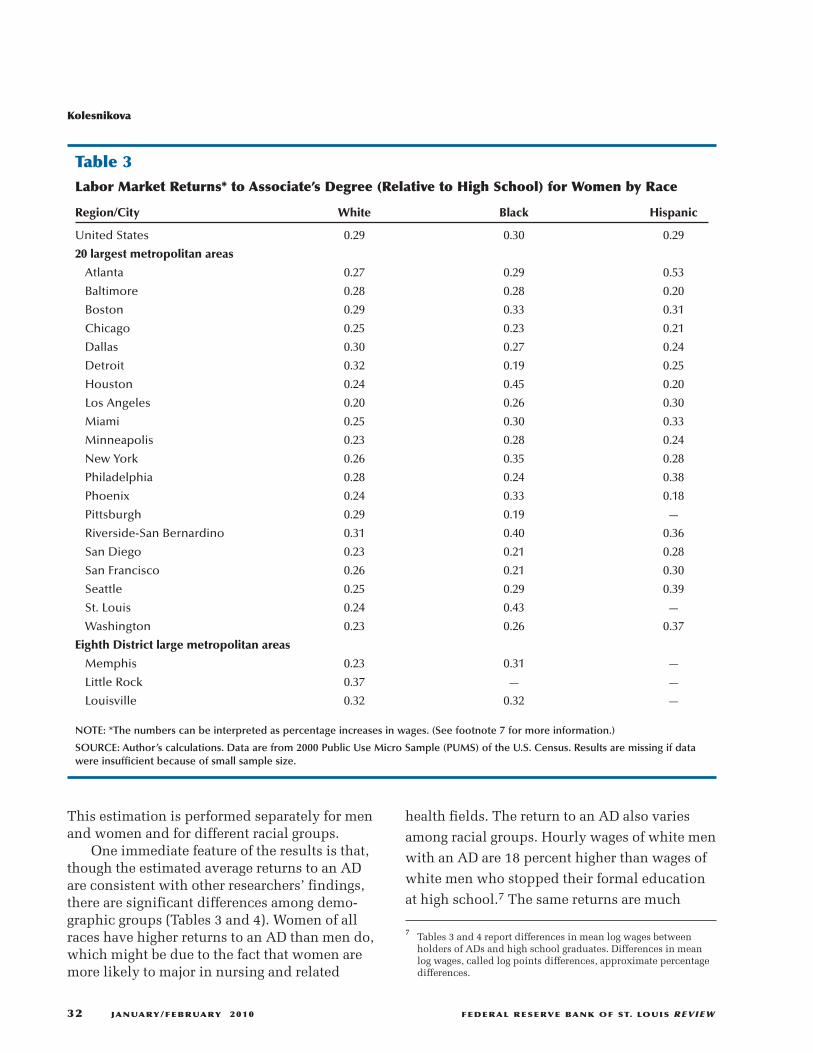
One immediate feature of the results is that,though the estimated average returns to an ADare consistent with other researchers’ findings,there are significant differences among demo-graphic groups (Tables 3 and 4). Women of allraces have higher returns to an AD than men do,which might be due to the fact that women aremore likely to major in nursing and related
health fields. The return to an AD also varies
among racial groups. Hourly wages of white men
with an AD are 18 percent higher than wages of
white men who stopped their formal education
at high school.7 The same returns are much
Kolesnikova
32 JANUARY/FEBRUARY 2010 FEDERAL RESERVE BANK OF ST. LOUIS REVIEW
Table 3Labor Market Returns* to Associate’s Degree (Relative to High School) for Women by Race
Region/City White Black Hispanic
United States 0.29 0.30 0.29
20 largest metropolitan areas
Atlanta 0.27 0.29 0.53
Baltimore 0.28 0.28 0.20
Boston 0.29 0.33 0.31
Chicago 0.25 0.23 0.21
Dallas 0.30 0.27 0.24
Detroit 0.32 0.19 0.25
Houston 0.24 0.45 0.20
Los Angeles 0.20 0.26 0.30
Miami 0.25 0.30 0.33
Minneapolis 0.23 0.28 0.24
New York 0.26 0.35 0.28
Philadelphia 0.28 0.24 0.38
Phoenix 0.24 0.33 0.18
Pittsburgh 0.29 0.19 —
Riverside-San Bernardino 0.31 0.40 0.36
San Diego 0.23 0.21 0.28
San Francisco 0.26 0.21 0.30
Seattle 0.25 0.29 0.39
St. Louis 0.24 0.43 —
Washington 0.23 0.26 0.37
Eighth District large metropolitan areas
Memphis 0.23 0.31 —
Little Rock 0.37 — —
Louisville 0.32 0.32 —
NOTE: *The numbers can be interpreted as percentage increases in wages. (See footnote 7 for more information.)
SOURCE: Author’s calculations. Data are from 2000 Public Use Micro Sample (PUMS) of the U.S. Census. Results are missing if datawere insufficient because of small sample size.
7 Tables 3 and 4 report differences in mean log wages betweenholders of ADs and high school graduates. Differences in meanlog wages, called log points differences, approximate percentagedifferences.

higher for black and Hispanic men—25 and 27percent higher, respectively.
Furthermore, the return to an AD is not thesame across different cities in the United States.For example, white men with ADs are paid only4 percent more than white high school graduates inSeattle but as much as 30 percent more in Miami.For Hispanic men, the return to an AD is 16 per-cent in Washington, D.C., but it is more than twiceas much—39 percent—in Atlanta. Cross-city dif-
ferentials for white women are not as large, butthey are significant for minority women.
Tables 3 and 4 also present estimated returnsto an AD in four large metropolitan areas of theEighth District. White men with an AD earn onaverage 11 percent more in St. Louis, 16 percentmore in Memphis, 22 percent more in Little Rock,and 18 percent more in Louisville than similarmen with only a high school diploma. For blackmen, returns to an AD are 13 percent in St. Louis,
Kolesnikova
FEDERAL RESERVE BANK OF ST. LOUIS REVIEW JANUARY/FEBRUARY 2010 33
Table 4Labor Market Returns* to Associate’s Degree (Relative to High School) for Men by Race
Region/City White Black Hispanic
United States 0.18 0.25 0.27
20 largest metropolitan areas
Atlanta 0.21 0.26 0.39
Baltimore 0.15 0.26 0.19
Boston 0.17 0.06 0.25
Chicago 0.10 0.21 0.19
Dallas 0.24 0.28 0.29
Detroit 0.21 0.22 0.34
Houston 0.19 0.21 0.27
Los Angeles 0.16 0.35 0.30
Miami 0.30 0.25 0.30
Minneapolis 0.17 0.27 0.32
New York 0.11 0.24 0.21
Philadelphia 0.15 0.17 0.32
Phoenix 0.18 0.42 0.24
Pittsburgh 0.16 0.17 —
Riverside-San Bernardino 0.20 0.15 0.24
San Diego 0.15 0.36 0.24
San Francisco 0.12 0.48 0.23
Seattle 0.04 0.22 0.17
St. Louis 0.11 0.13 —
Washington 0.18 0.22 0.16
Eighth District large metropolitan areas
Memphis 0.16 0.22 —
Little Rock 0.22 — —
Louisville 0.18 0.17 —
NOTE: *The numbers can be interpreted as percentage increases in wages. (See footnote 7 for more information.)
SOURCE: Author’s calculations. Data are from 2000 Public Use Micro Sample (PUMS) of the U.S. Census. Results are missing if datawere insufficient because of small sample size.

22 percent in Memphis, and 17 percent inLouisville. Consistent with the rest of the country,women’s returns are higher than men’s. For exam-ple, black women in St. Louis with an AD earn43 percent more than black women with only ahigh school education.
Why is there such a large variation in returns toan AD across cities? Although no formal researchhas been done on this topic, possible explanationsmight be locational differences in labor marketconditions and industrial composition.
DIFFERENT EDUCATIONAL PATHSCommunity college students have various
educational goals and intentions when they entercollege. Although many plan to obtain an AD,some students enroll to take just a few classes toimprove their skills or to become certified in acertain field. Some intend to transfer to a four-year institution without any formal communitycollege credentials.
This ability of community colleges to offerstudents many options provides a unique oppor-tunity to obtain postsecondary education for manystudents who would not have it otherwise. Onthe other hand, because the educational objectivesof students—and, thus, their paths—are so differ-ent, it is difficult to track their progress throughcollege and to assess the effect of communitycollege education on their educational attainmentand labor market outcomes. The fact that moststudents attend community colleges part-timeand take longer to complete their program makesthe task even more complicated.
Critics of the community college system oftenpoint out that a significant proportion of commu-nity college students earn relatively few collegecredits. Kane and Rouse (1999) calculated thatthe majority of community college students com-plete one year or less and 35 percent completeonly one semester of study or less. The studyalso showed that fewer than half of communitycollege students complete any degrees. In partic-ular, about 15 percent receive a certificate, 16percent complete an AD, and another 16 percenteventually receive a bachelor’s degree or higher.Kane and Rouse (1999) point out that, unlike their
community college counterparts, almost 60 per-cent of four-year college entrants receive at leasta bachelor’s degree.
Does this mean that enrolling in a two-yearcollege somehow reduces an individual’s educa-tional attainment? One view is that easy accessto community college sidetracks students from afour-year college, where they are more likely toobtain a bachelor’s degree. On the other hand,many nontraditional students who attend com-munity college would not attend four-year col-leges. For them, community colleges provide achance for a postsecondary education they wouldnot have had otherwise. Therefore, researchersargue, even if attending a community collegeinstead of a four-year college might lower educa-tional attainment for some students, more studentshave access to higher education, which raisesoverall educational attainment in society.
To better answer questions about the effect ofcommunity colleges on educational attainment,it is necessary to consider students’ intentionstoward their educational objectives together withtheir outcomes. The problem is a lack of reliabledata that measure students’ goals and preparation.
The U.S. Department of Education hasattempted to study educational outcomes ofcommunity college students. Its report used datafrom several sources, including those trackingstudents over time (Hoachlande et al., 2003). Thestudy found that about 90 percent of studentsentering community college intended to obtain aformal credential or to transfer to a four-year col-lege. One could argue that it is more reasonableto consider completion rates only for those whointended to obtain a degree in the first place. Thereport estimated that, depending on the data used,between 51 percent and 63 percent of these stu-dents had fulfilled their expectations within sixto eight years after initial enrollment. In particular,about 11 percent had earned a certificate, 17 per-cent to 18 percent had earned an AD, 11 percentto 28 percent (depending on the data used) hadattained a bachelor’s degree or higher, and 12 per-cent to 13 percent had transferred to a four-yearcollege without attaining a formal degree.
Keeping in mind that a primary goal of two-year colleges is to prepare students to continue
Kolesnikova
34 JANUARY/FEBRUARY 2010 FEDERAL RESERVE BANK OF ST. LOUIS REVIEW

their studies at four-year institutions, it is partic-ularly important to evaluate their transfer rates.The U.S. Department of Education (Hoachlandeet al., 2003) report indicated that, overall, about29 percent of community college students hadtransferred to four-year colleges. Interestingly, 51percent of those who intended to complete abachelor’s degree when they first started hadtransferred. At the time data were collected, 80percent of those who transferred either obtaineda bachelor’s degree or were still working toward it.
What about the students who left communitycollege without any formal credential? Thisamounts to more than half of those who startedclasses. According to the report, about one-thirdof this group said that postsecondary educationimproved their salary. For 47 percent, attendingcommunity college led to increased job opportu-nities. About 43 percent reported improvementin job performance, and 47 percent said they hadmore job responsibilities.
Students who did receive a certificate or adegree were more likely to be satisfied with theiroutcomes. About 80 percent of them said theirsalaries had increased. Almost 85 percent reportedhaving a better job or more responsibilities.
FROM A COMMUNITY COLLEGETO A BACHELOR’S DEGREE
As discussed previously, even though com-munity colleges initially were introduced to helpprepare students for four-year colleges, fewer thana third of community college students transfer tofour-year colleges. Still, it is important to com-pare the outcomes of students who transfer to afour-year institution with the outcomes of theircounterparts who began at a four-year institution.
A recent study by Long and Kurlaender (2008)evaluates whether there is what the authors terma “community college penalty.” The study uses aunique longitudinal dataset that includes every-one who entered Ohio public institutions of highereducation in the fall of 1998 with follow-up overthe next nine years. It provides information onstudents’ high school preparation, entrance exam-inations, degree intentions, family background,
college performance and, finally, degree comple-tion. As long as students transfer between Ohio’spublic colleges and universities, they remain inthe dataset. This makes it possible to track moststudents’ progress from starting postsecondaryeducation at a community college to receiving abachelor’s degree from a four-year college.
The study finds that there is indeed a “penalty”resulting from beginning postsecondary educationat a community college. The rates of droppingout or “stopping out” without a degree are muchhigher for those who start at community collegesthan for those who start at four-year institutions.For example, community college students were36 percent less likely to obtain a bachelor’s degreethan similar students who started at four-yearcolleges.
One possible explanation for this result is thatfour-year college students start with an intentionto graduate while community college studentshave different educational objectives. The studyfinds, however, that even community collegestudents who expressed an intention to obtain afour-year bachelor’s degree are significantly lesslikely to do so within nine years of starting theirpostsecondary studies. Only 26 percent of thisgroup have a bachelor’s degree nine years afterstarting their postsecondary education. To put itin perspective, 50 percent and 73 percent of thosewho start at nonselective and selective four-yearinstitutions, respectively, obtain a bachelor’sdegree. In addition, students who start at com-munity colleges have fewer total earned creditsthan students who start at four-year colleges.
The observed differences in educational out-comes may occur because of the differencesbetween the students at two-year and four-yearinstitutions. Demographic, family, and othercharacteristics of students who begin at commu-nity colleges differ from those of students whobegin at four-year institutions. Such differencesmight lead to a selection bias of the estimates.However, the negative effect of starting postsec-ondary education at a community college remainseven after adjusting for selection bias by control-ling for students’ race, gender, age, ability (mea-sured by ACT scores), and family income. Theauthors find “a persistent community college
Kolesnikova
FEDERAL RESERVE BANK OF ST. LOUIS REVIEW JANUARY/FEBRUARY 2010 35

penalty,” but they suggest that “it is worth com-paring the size of the penalty to the difference incosts at two-year versus four-year institutions.”
LONG-TERM EDUCATIONALOUTCOMES
Few community college students go on toreceive a bachelor’s degree. Still, some success-fully transfer to four-year colleges and obtain abachelor’s degree or higher. This section comparesthese individuals with those who start postsec-ondary education at traditional four-year collegesand analyzes their long-term educational outcomes.
The NSCG is a joint project of the U.S CensusBureau and the National Science Foundation.The 2003 survey included a sample of respondentsto the 2000 Decennial Census long form who indi-cated they have a bachelor’s degree or higher inany field of study. The survey collected detailedinformation about their education, current andpast employment, current salary, and demographiccharacteristics. In particular, the dataset reportseducational background characteristics, such astype of college attended, major field of study, num-ber of degrees, and the highest degree received.Most importantly, for my purposes, it identifiesrespondents who have an AD or attended a com-
munity college. One shortcoming of these data,however, is a lack of family background informa-tion and ability measures.
Among people who have at least a bachelor’sdegree, 17 percent report having received an AD.(I assume here that they started their postsec-ondary education at a community college and,after receiving an AD, continued their educationat a four-year college.) The rest of this sectioncompares this group with the rest of the respon-dents with at least a bachelor’s degree.8 I startthe comparison of the two groups by presentingsome descriptive statistics.
Table 5 reports the proportion of respondentswith a bachelor’s degree who either attended acommunity college or have an AD; this group isclassified according to region of residence.9
Between 14 and 20 percent of four-year collegegraduates have an AD, depending on the region.Bachelor’s degree holders in the Pacific and SouthAtlantic regions are most likely to have an AD
Kolesnikova
36 JANUARY/FEBRUARY 2010 FEDERAL RESERVE BANK OF ST. LOUIS REVIEW
Table 5Proportion of Bachelor’s Degree Holders with Associate’s Degrees by Region of Residence
Proportion of bachelor’s degree holders
Region With AD (%) Who attended community college (%)
New England 14 31
Middle Atlantic 15 34
East North Central 15 42
West North Central 15 44
South Atlantic 18 45
East South Central 17 43
West South Central 15 48
Mountain 15 50
Pacific 20 58
SOURCE: Author’s calculations. Data are from NSCG (2003).
8 The dataset also identifies individuals who attended a communitycollege but does not identify what they were studying. It is impossi-ble to know whether a person took classes for credit in preparationfor college or not. Because of this limitation, I ignore these indi-viduals’ community college experience.
9 The definition of the region in this context is provided inAppendix A. “Region” is the smallest geographic unit of analysisavailable in the NSCG dataset.

(20 percent and 18 percent, respectively), whileNew England residents with a bachelor’s degreeare least likely to have an AD (14 percent). Asmany as 58 percent of bachelor’s degree holdersattended a community college at some point inthe Pacific region, but only 31 percent did inNew England.
Table 6 reports similar statistics by region ofbirth. People with a bachelor’s degree who wereborn in the Pacific region are significantly morelikely to attend community college (60 percent)or have an AD (24 percent) than people who wereborn in other regions. This is not surprising giventhat the Pacific region includes California, the statewith the highest community college enrollment.
Figure 1 presents a distribution of parentaleducation. Consistent with other studies, I findthat AD holders are much more likely to be first-generation college students than those who donot have an AD. They are also more likely to haveparents with a level of education less than a col-lege degree.
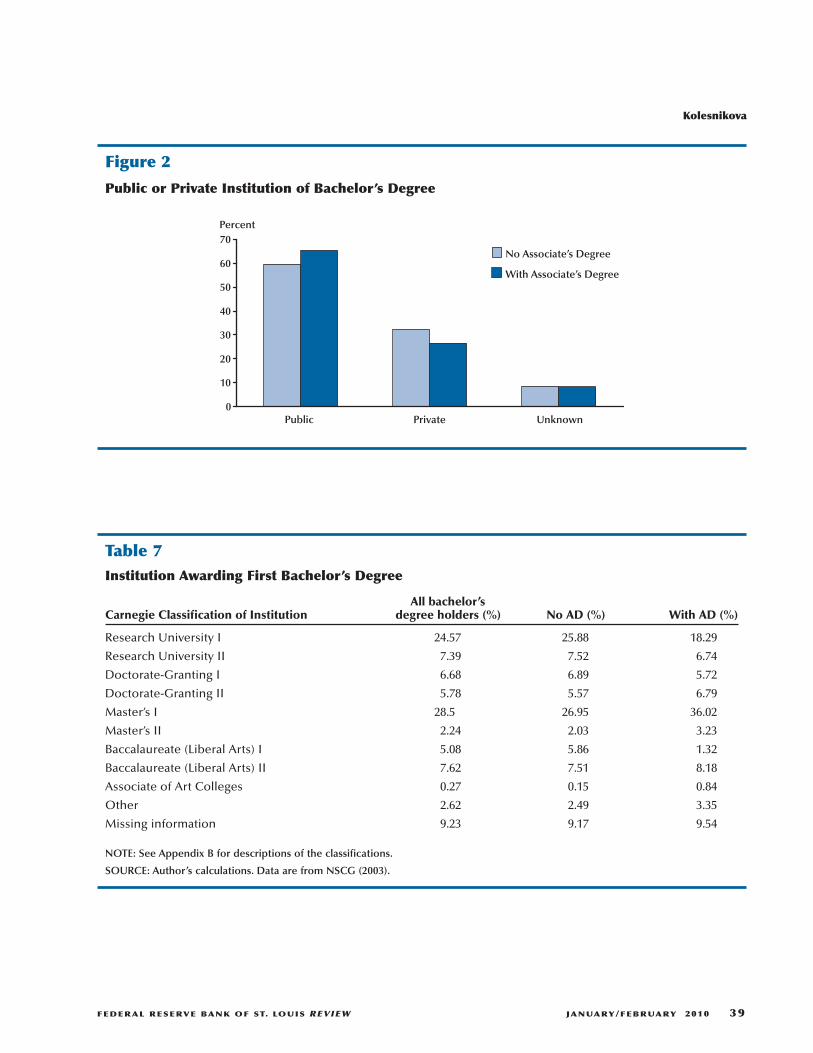
Next, I examine whether there are differencesin educational choices between those who obtainedan AD before enrolling in a four-year college andthose who did not. Table 7 summarizes the typesof four-year institutions that respondents attended.The Carnegie Foundation Classification of Insti -
tutions of Higher Education is used to categorizeuniversities as Research Universities (I and II),Doctorate Granting (I and II), Master’s Granting (Iand II), Liberal Arts (I and II), and Associates ofArt Colleges that include community colleges.10
While direct comparison of the quality ofeducation provided by different universities isdifficult, traditionally research and doctorate-granting universities are perceived as being moreselective and having better resources than master’s-granting and liberal arts colleges.
Table 7 shows that people with a prior ADwere significantly less likely to attend Research Iuniversities (18 percent vs. 26 percent) and slightlyless likely to attend Doctorate-Granting universi-ties (6 percent vs. 7 percent). On the other hand,a much higher proportion attended Master’s-Granting universities (36 percent vs. 27 percent).It also seems that people with a prior AD weremuch less likely to attend more selective LiberalArts I colleges than their counterparts (1 percentvs. 6 percent). To sum up, it appears that ADrecipients attended less-selective (and perhapsless-expensive) institutions for their bachelor’sstudies. Figure 2 shows that students with anAD are also more likely to be enrolled in public
Kolesnikova
FEDERAL RESERVE BANK OF ST. LOUIS REVIEW JANUARY/FEBRUARY 2010 37
Table 6Proportion of Bachelor’s Degree Holders with Associate’s Degree by Region of Birth
Proportion of bachelor’s degree holders
Region With AD (%) Who attended community college (%)
New England 15 34
Middle Atlantic 16 38
East North Central 15 44
West North Central 16 44
South Atlantic 18 47
East South Central 16 42
West South Central 15 48
Mountain 18 48
Pacific 24 60
SOURCE: Author’s calculations. Data are from NSCG (2003).
10 See Appendix B for definitions of the Carnegie FoundationClassification of Institutions of Higher Education categories.

Kolesnikova
38 JANUARY/FEBRUARY 2010 FEDERAL RESERVE BANK OF ST. LOUIS REVIEW
Father’s Education
0
5
10
15
20
25
30
35
Less
than
High
School
High Sc
hool
Som
e Colle
ge
Bachelo
r’s D
egre
e
Mas
ter’s
Deg
ree
Profe
ssional
Degre
e
Doctora
te
Percent
Mother’s Education
0
5
10
15
20
25
30
35
40
45
Percent
No Associate’s Degree
With Associate’s Degree
Less
than
High
School
High Sc
hool
Som
e Colle
ge
Bachelo
r’s D
egre
e
Mas
ter’s
Deg
ree
Profe
ssional
Degre
e
Doctora
te
Figure 1
Parents’ Education
Kolesnikova
FEDERAL RESERVE BANK OF ST. LOUIS REVIEW JANUARY/FEBRUARY 2010 39
Table 7Institution Awarding First Bachelor’s Degree
All bachelor’s Carnegie Classification of Institution degree holders (%) No AD (%) With AD (%)
Research University I 24.57 25.88 18.29
Research University II 7.39 7.52 6.74
Doctorate-Granting I 6.68 6.89 5.72
Doctorate-Granting II 5.78 5.57 6.79
Master’s I 28.5 26.95 36.02
Master’s II 2.24 2.03 3.23
Baccalaureate (Liberal Arts) I 5.08 5.86 1.32
Baccalaureate (Liberal Arts) II 7.62 7.51 8.18
Associate of Art Colleges 0.27 0.15 0.84
Other 2.62 2.49 3.35
Missing information 9.23 9.17 9.54
NOTE: See Appendix B for descriptions of the classifications.
SOURCE: Author’s calculations. Data are from NSCG (2003).
0
10
20
30
40
50
60
70
Public Private Unknown
Percent
No Associate’s Degree
With Associate’s Degree
Figure 2
Public or Private Institution of Bachelor’s Degree

Kolesnikova
40 JANUARY/FEBRUARY 2010 FEDERAL RESERVE BANK OF ST. LOUIS REVIEW
Table 8Distribution of Major Fields of Study of First Bachelor’s Degree
All bachelor’s Major field of study degree holders (%) No AD (%) With AD (%)
Computer and math sciences 3.86 3.87 3.82
Computer and information sciences 1.99 1.86 2.66
Mathematics and statistics 1.87 2.01 1.16
Biological, agricultural, environmental 6.2 6.48 4.87
Agricultural and food sciences 0.8 0.83 0.69
Biological sciences 4.97 5.27 3.54
Environmental life sciences 0.43 0.38 0.64
Physical and related sciences 2.9 3.14 1.71
Chemistry, except biochemistry 1.51 1.67 0.73
Earth, atmospheric, and ocean sciences 0.57 0.59 0.46
Physics and astronomy 0.62 0.68 0.32
Other physical sciences 0.2 0.2 0.2
Social and related sciences 14 14.27 12.69
Economics 2.16 2.4 1.04
Political and related sciences 3.11 3.34 2.01
Psychology 4.61 4.55 4.9
Sociology and anthropology 2.76 2.64 3.32
Other social sciences 1.36 1.34 1.42
Engineering 7.7 7.99 6.35
Aerospace, aeronautical, and astronautical 0.29 0.31 0.22
Chemical engineering 0.6 0.68 0.22
Civil and architectural engineering 1.16 1.19 1.02
Electrical and computer engineering 2.39 2.43 2.2
Industrial engineering 0.48 0.5 0.41
Mechanical engineering 1.76 1.81 1.48
Other engineering 1.02 1.07 0.8
Health, science education, technology 9.57 9.46 10.21
Health 6.6 6.51 7.08
Science and mathematics teacher education 1.15 1.19 0.97
Technology and technical fields 1 0.88 1.62
Other science- and education-related fields 0.82 0.88 0.54
Business, management, art 55.75 54.79 60.32
Management and administration fields 17.61 16.6 22.45
Education, except science and math teacher education 13.51 13.39 14.08
Social service and related fields 2.28 2.19 2.71
Sales and marketing fields 2.61 2.56 2.86
Art and humanities fields 12.69 13.22 10.15
Other non-science and education fields 7.05 6.83 8.07
SOURCE: Author’s calculations. Data are from NSCG (2003).

Kolesnikova
FEDERAL RESERVE BANK OF ST. LOUIS REVIEW JANUARY/FEBRUARY 2010 41
Table 9Proportion of Males by Major Field of Study
All bachelor’s Major field of study degree holders (%) No AD (%) With AD (%)
Computer and math sciences 64 64 64
Computer and information sciences 67 69 61
Mathematics and statistics 60 59 71
Biological, agricultural, environmental 57 57 59
Agricultural and food sciences 68 66 76
Biological sciences 54 54 53
Environmental life sciences 71 70 75
Physical and related sciences 74 74 73
Chemistry, except biochemistry 68 68 64
Earth, atmospheric, and ocean sciences 81 80 86
Physics and astronomy 84 84 81
Other physical sciences 64 64 65
Social and related sciences 48 49 46
Economics 72 73 67
Political and related sciences 63 63 62
Psychology 33 33 32
Sociology and anthropology 37 34 46
Other social sciences 52 53 51
Engineering 89 89 89
Aerospace, aeronautical, and astronautical 92 93 83
Chemical engineering 80 80 67
Civil and architectural engineering 89 88 91
Electrical and computer engineering 90 89 91
Industrial engineering 85 84 91
Mechanical engineering 93 93 92
Other engineering 88 89 83
Health, science education, technology 37 37 37
Health 22 23 21
Science and mathematics teacher education 51 51 51
Technology and technical fields 86 86 87
Other science- and education-related fields 75 74 76
Business, management, art 45 45 47
Management and administration fields 63 64 61
Education, except science and math teacher education 22 22 25
Social service and related fields 48 49 45
Sales and marketing fields 57 59 51
Art and humanities fields 42 42 41
Other non-science and education fields 44 42 51
SOURCE: Author’s calculations. Data are from NSCG (2003).
colleges than students who do not have an ADand less likely to attend private colleges.
Are there differences in major fields of studybetween the two groups? One of the main objec-tives of community colleges is to prepare studentsfor four-year college studies. Do students whohave taken classes at a community college choosedifferent fields of study than students who didnot go to community college before attending afour-year institution?
Fortunately, NSCG data provide detailedinformation on respondents’ degree majors. Asshown in Table 8, fewer people with an AD majorin sciences and engineering than people with noAD. Instead, people with an AD are more likelyto major in health, technology, and managementthan their counterparts. Preference for the health
Kolesnikova
42 JANUARY/FEBRUARY 2010 FEDERAL RESERVE BANK OF ST. LOUIS REVIEW
and technology fields is expected, given that com-munity colleges often focus more on these disci-plines. It is somewhat surprising that so many moreAD holders choose to major in management thanpeople without an AD (22 percent vs. 17 percent).
Interestingly, there is little difference in genderdistribution across major fields of study betweenthe two groups (Table 9). There are some excep-tions, however. More women with ADs chooseto major in computer and information sciences,economics, aerospace engineering, chemicalengineering, and marketing than women withoutan AD; and more men with ADs choose to majorin mathematics and statistics, agriculture, envi-ronmental and earth sciences, sociology, andindustrial engineering than men without an AD.It is hard to know whether this is a result of stu-
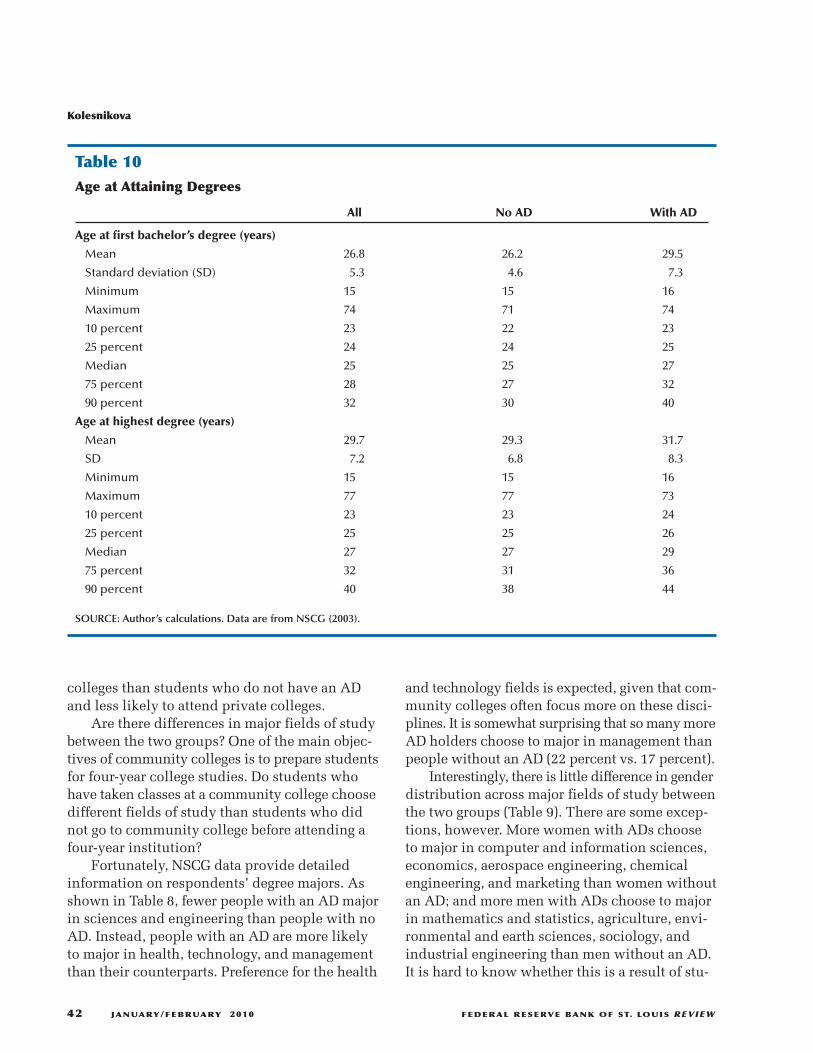
Table 10Age at Attaining Degrees
All No AD With AD
Age at first bachelor’s degree (years)
Mean 26.8 26.2 29.5
Standard deviation (SD) 5.3 4.6 7.3
Minimum 15 15 16
Maximum 74 71 74
10 percent 23 22 23
25 percent 24 24 25
Median 25 25 27
75 percent 28 27 32
90 percent 32 30 40
Age at highest degree (years)
Mean 29.7 29.3 31.7
SD 7.2 6.8 8.3
Minimum 15 15 16
Maximum 77 77 73
10 percent 23 23 24
25 percent 25 25 26
Median 27 27 29
75 percent 32 31 36
90 percent 40 38 44
SOURCE: Author’s calculations. Data are from NSCG (2003).
Kolesnikova
FEDERAL RESERVE BANK OF ST. LOUIS REVIEW JANUARY/FEBRUARY 2010 43
0
10
20
30
40
50
60
70
80
1 2 3 4 or More
Percent
No Associate’s Degree
With Associate’s Degree
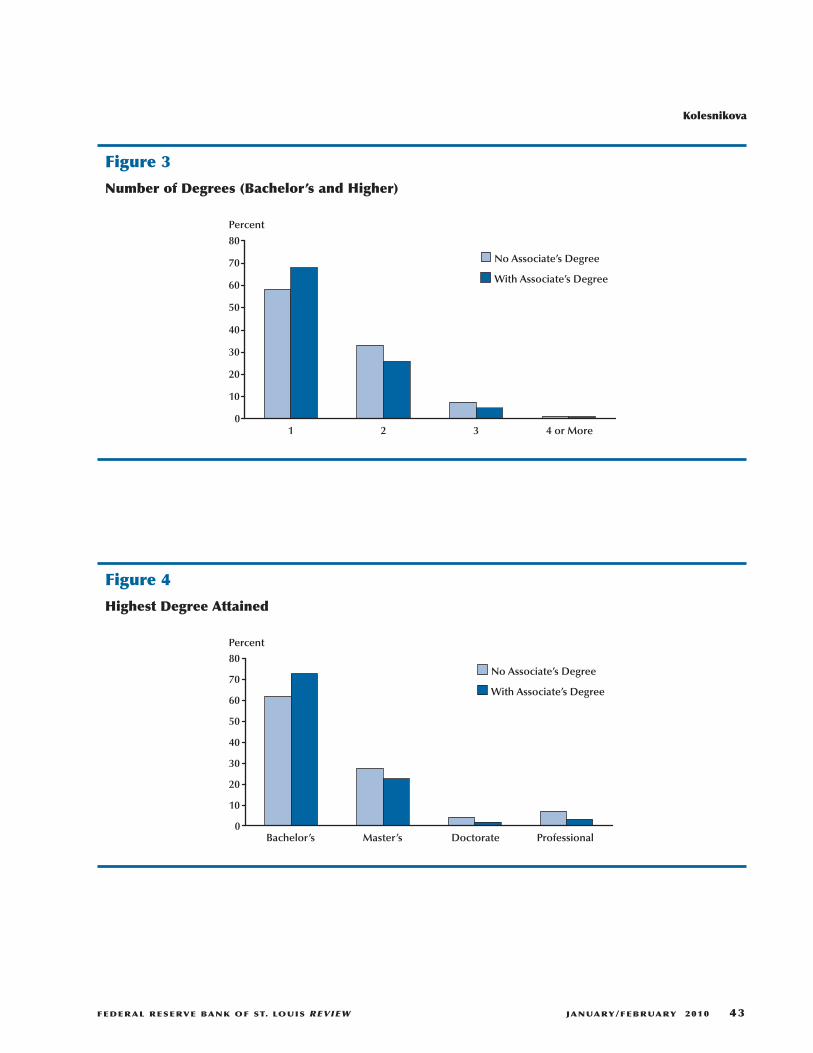
Figure 3
Number of Degrees (Bachelor’s and Higher)
0
10
20
30
40
50
60
70
80
Bachelor’s Master’s Doctorate Professional
Percent
No Associate’s Degree
With Associate’s Degree
Figure 4
Highest Degree Attained
dents’ exposure to some subjects before enteringa four-year institution or other effects on somestudents’ choice of a major field of study.
Not surprisingly, AD holders are older onaverage when they obtain a bachelor’s degree.Their mean age is 29.5 years, compared with themean age of 26.2 years of those who obtain abachelor’s degree without an AD (Table 10).
Almost 70 percent of bachelor’s degree holderswith an AD do not continue their educationbeyond their first bachelor’s degree. This contrastswith the fewer than 60 percent of their counter-parts without an AD (Figure 3). A higher propor-tion of people with no AD go on to receive amaster’s degree, a doctorate, or a professionaldegree (e.g., J.D. or M.D.) (Figure 4). Table 11
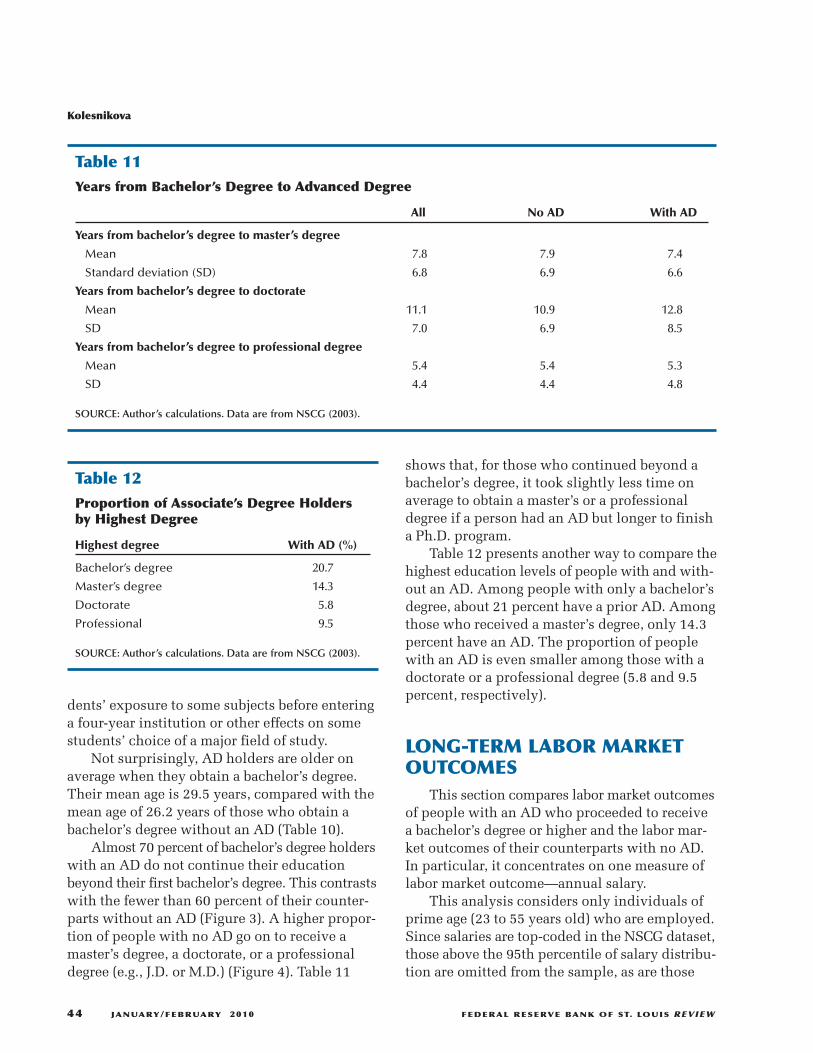
shows that, for those who continued beyond abachelor’s degree, it took slightly less time onaverage to obtain a master’s or a professionaldegree if a person had an AD but longer to finisha Ph.D. program.
Table 12 presents another way to compare thehighest education levels of people with and with-out an AD. Among people with only a bachelor’sdegree, about 21 percent have a prior AD. Amongthose who received a master’s degree, only 14.3percent have an AD. The proportion of peoplewith an AD is even smaller among those with adoctorate or a professional degree (5.8 and 9.5percent, respectively).
LONG-TERM LABOR MARKETOUTCOMES
This section compares labor market outcomesof people with an AD who proceeded to receivea bachelor’s degree or higher and the labor mar-ket outcomes of their counterparts with no AD.In particular, it concentrates on one measure oflabor market outcome—annual salary.
This analysis considers only individuals ofprime age (23 to 55 years old) who are employed.Since salaries are top-coded in the NSCG dataset,those above the 95th percentile of salary distribu-tion are omitted from the sample, as are those
Kolesnikova
44 JANUARY/FEBRUARY 2010 FEDERAL RESERVE BANK OF ST. LOUIS REVIEW
Table 11Years from Bachelor’s Degree to Advanced Degree
All No AD With AD
Years from bachelor’s degree to master’s degree
Mean 7.8 7.9 7.4
Standard deviation (SD) 6.8 6.9 6.6
Years from bachelor’s degree to doctorate
Mean 11.1 10.9 12.8
SD 7.0 6.9 8.5
Years from bachelor’s degree to professional degree
Mean 5.4 5.4 5.3
SD 4.4 4.4 4.8
SOURCE: Author’s calculations. Data are from NSCG (2003).
Table 12Proportion of Associate’s Degree Holdersby Highest Degree
Highest degree With AD (%)
Bachelor’s degree 20.7
Master’s degree 14.3
Doctorate 5.8
Professional 9.5
SOURCE: Author’s calculations. Data are from NSCG (2003).

below the 5th percentile, to maintain distributionsymmetry. Thus, individuals who earn less than$10,000 or more than $150,000 per year are notincluded.
Table 13 shows the average annual salary byeducation level for the full sample and then sep-arately for individuals with and without an AD.As expected and well documented in many otherstudies, people with a higher level of educationhave, on average, higher earnings. Bachelor’sdegree holders earn $54,126 per year; people withmaster’s degrees earn $60,676 per year; peoplewith a doctorate earn $70,711 per year, and peoplewith professional degrees earn $78,705 per year,on average. Remarkably, annual salaries for indi-viduals with an AD differ from those without anAD for all education levels. Regardless of the high-est degree, people who started their postsecondaryeducation with an AD earn less on average thanthose who started at a four-year college. The differ-ence is particularly large for those with a doctor-ate or a professional degree.
A regression analysis can be used to betterunderstand this phenomenon. In particular, Iestimate the following equation:
where S is an individual’s annual salary in dollars,X is a vector of various characteristics that willbe defined shortly, and IAD is an indicator ofwhether a person has an AD, in which case it isequal to 1; otherwise, it is 0. The goal is to com-pare individuals with the same characteristics Xbut different values of an indicator IAD, 0 or 1.The question is how an AD affects one’s salary.Relevant characteristics include age, gender, race,major field of study, and highest degree attained.
The estimation results of the above equationare reported in Table 14, panel A. The dependentvariable is salary S. The results indicate that anannual salary increases by about $542 per yearas people age and accumulate more work experi-ence. Women, on average, earn $12,137 per yearless than men with similar characteristics. Minor -ity groups earn less compared with whites. The
S X IAD= + ∗ + ∗ +β β β ε0 1 1 ,
Kolesnikova
FEDERAL RESERVE BANK OF ST. LOUIS REVIEW JANUARY/FEBRUARY 2010 45
Table 13Salaries (in US$) by Education Level
All No AD With AD
A. All
Mean 57,686 58,559 53,696
Standard deviation (SD) 29,660 30,218 26,597
B. Bachelor’s degree
Mean 54,126 54,667 52,022
SD 28,319 28,855 26,029
C. Master’s degree
Mean 60,676 61,323 56,997
SD 28,663 29,030 26,185
D. Doctorate
Mean 70,711 71,246 62,906
SD 29,837 29,832 28,851
E. Professional degree
Mean 78,705 79,491 70,349
SD 36,711 36,793 34,799
SOURCE: Author’s calculations. Data are from NSCG (2003).

Kolesnikova
46 JANUARY/FEBRUARY 2010 FEDERAL RESERVE BANK OF ST. LOUIS REVIEW
Table 14Regression Analysis: Effects of Various Factors on Salary
Coefficient Standard error t-Statistic
A. All
Age 541.9 13.7 39.6
Woman –12136.5 233.5 –52.0
Black –4943.0 410.5 –12.0
Hispanic –5768.8 460.1 –12.5
Asian –2558.6 416.9 –6.1
Associate’s degree –3854.1 283.1 –13.6
Controls
Major field of study Yes
Highest degree Yes
Number of observations 59,346
Adjusted R2 0.22
B. Bachelor’s degree
Age 487.6 17.6 27.73
Woman –12724.9 300.1 –42.4
Black –6017.6 522.7 –11.5
Hispanic –6807.9 577.8 –11.8
Asian –3267.3 565.7 –5.78
Associate’s degree –3620.8 346.0 –10.46
Controls: Major field of study Yes
Number of observations 34,067
Adjusted R2 0.19
C. Master’s degree
Age 574.1 24.3 23.6
Woman –11460.2 421.3 –27.2
Black –2198.1 716.5 –3.1
Hispanic –3549.5 865.6 –4.1
Asian –980.5 707.4 –1.4
Associate’s degree –3379.1 536.7 –6.3
Controls: Major field of study Yes
Number of observations 17,803
Adjusted R2 0.23

annual salary of blacks is $4,943 lower on averagethan that of comparable whites. The correspond -ing difference for Hispanics is $5,769, and it is$2,559 for Asians. These facts are well documentedin the economics literature. The most strikingfinding, however, is that even when other factorsare controlled, people with an AD earn $3,854less per year than their counterparts with no AD.All coefficients are statistically significant at a 5percent level or better.
The same equation is also estimated separatelyfor each education-level group: bachelor’s degree,master’s degree, doctoral degree, and professionaldegree. Panels B through E of Table 14 show theresults of the estimations. The same pattern isobserved for each education-level group: Olderworkers earn more; women and minorities earnless. More importantly, those who earn an AD andthen a more-advanced degree have lower earningsthan those who earn a bachelor’s degree or higher
but no AD. For example, bachelor’s degree holdersearn $3,621 less per year when they have a priorAD. Strikingly, earning gaps are observed evenfor those community college students who receivea doctorate or a professional degree. Their salariesare $9,565 and $9,423 lower, respectively, thansalaries of their counterparts who started at a tra-ditional four-year college.
One possible explanation for the salary dis-parity is that the quality of education differs forthe two groups. For example, labor markets mightassign an additional premium for a degree froman elite college. Controls were included for thetype of institution awarding a bachelor’s degreeto test this possibility. Results remain virtuallyunchanged, which allows rejection of this explanation.11
Kolesnikova
FEDERAL RESERVE BANK OF ST. LOUIS REVIEW JANUARY/FEBRUARY 2010 47
Table 14, cont’dRegression Analysis: Effects of Various Factors on Salary
Coefficient Standard error t-Statistic
D. Doctorate
Age 1078.1 58.4 18.5
Woman –8176.1 884.1 –9.3
Black –7725.4 1839.1 –4.2
Hispanic –3055.8 1937.8 –1.6
Asian –3544.6 1116.6 –3.17
Associate’s degree –9565.3 1679.5 –5.7
Controls: Major field of study Yes
Number of observations 4,521
Adjusted R2 0.21
E. Professional degree
Age 984.4 81.7 12.1
Woman –7949.2 1349.9 –5.9
Black –2325.0 2921.2 –0.8
Hispanic –3006.2 2775.5 –1.1
Asian –2473.6 2393.2 –1.0
Associate’s degree –9423.2 2416.5 –3.9
Controls: Major field of study Yes
Number of observations 2,955
Adjusted R2 0.08
11 These results are not reported here but are available from theauthor upon request.
Kolesnikova
48 JANUARY/FEBRUARY 2010 FEDERAL RESERVE BANK OF ST. LOUIS REVIEW
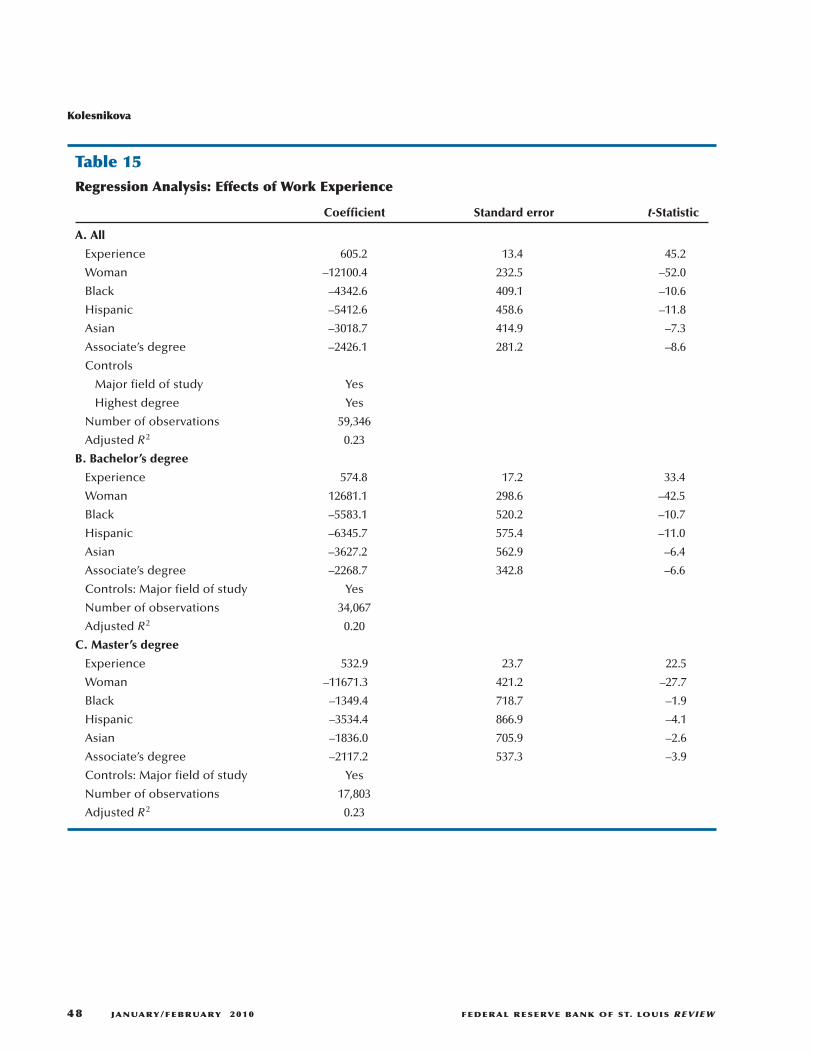
Table 15Regression Analysis: Effects of Work Experience
Coefficient Standard error t-Statistic
A. All
Experience 605.2 13.4 45.2
Woman –12100.4 232.5 –52.0
Black –4342.6 409.1 –10.6
Hispanic –5412.6 458.6 –11.8
Asian –3018.7 414.9 –7.3
Associate’s degree –2426.1 281.2 –8.6
Controls
Major field of study Yes
Highest degree Yes
Number of observations 59,346
Adjusted R2 0.23
B. Bachelor’s degree
Experience 574.8 17.2 33.4
Woman 12681.1 298.6 –42.5
Black –5583.1 520.2 –10.7
Hispanic –6345.7 575.4 –11.0
Asian –3627.2 562.9 –6.4
Associate’s degree –2268.7 342.8 –6.6
Controls: Major field of study Yes
Number of observations 34,067
Adjusted R2 0.20
C. Master’s degree
Experience 532.9 23.7 22.5
Woman –11671.3 421.2 –27.7
Black –1349.4 718.7 –1.9
Hispanic –3534.4 866.9 –4.1
Asian –1836.0 705.9 –2.6
Associate’s degree –2117.2 537.3 –3.9
Controls: Major field of study Yes
Number of observations 17,803
Adjusted R2 0.23
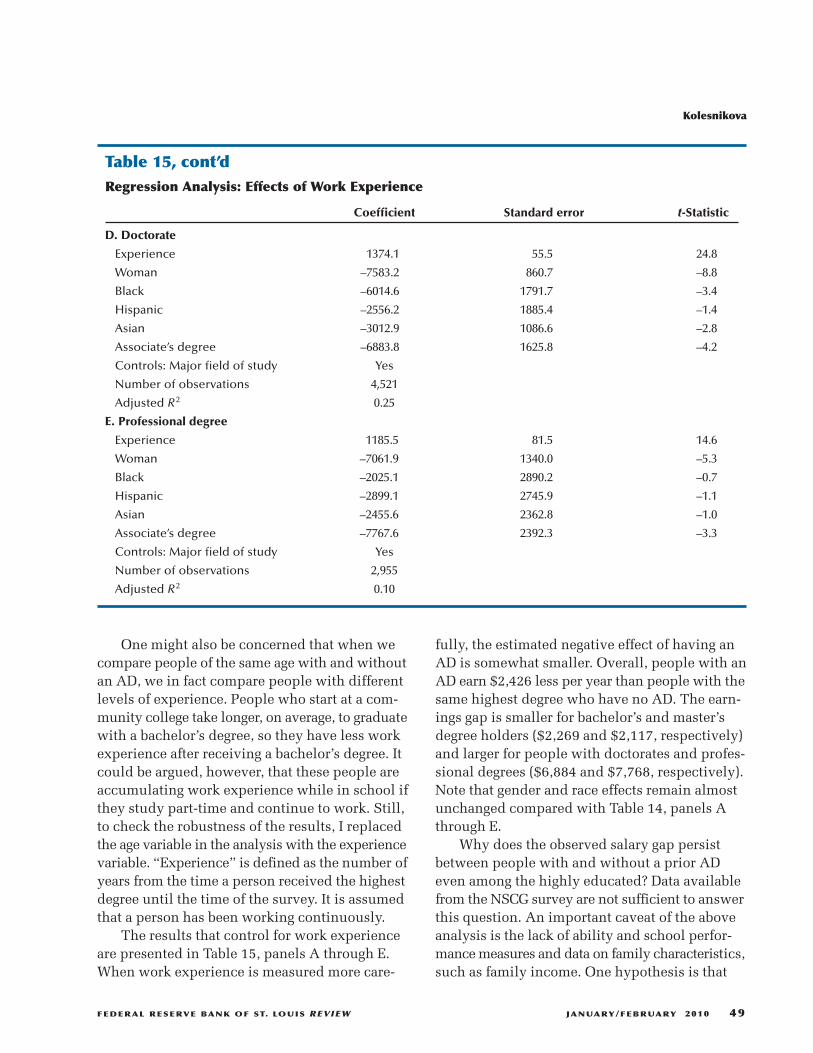
One might also be concerned that when wecompare people of the same age with and withoutan AD, we in fact compare people with differentlevels of experience. People who start at a com-munity college take longer, on average, to graduatewith a bachelor’s degree, so they have less workexperience after receiving a bachelor’s degree. Itcould be argued, however, that these people areaccumulating work experience while in school ifthey study part-time and continue to work. Still,to check the robustness of the results, I replacedthe age variable in the analysis with the experiencevariable. “Experience” is defined as the number ofyears from the time a person received the highestdegree until the time of the survey. It is assumedthat a person has been working continuously.
The results that control for work experienceare presented in Table 15, panels A through E.When work experience is measured more care-
fully, the estimated negative effect of having anAD is somewhat smaller. Overall, people with anAD earn $2,426 less per year than people with thesame highest degree who have no AD. The earn-ings gap is smaller for bachelor’s and master’sdegree holders ($2,269 and $2,117, respectively)and larger for people with doctorates and profes-sional degrees ($6,884 and $7,768, respectively).Note that gender and race effects remain almostunchanged compared with Table 14, panels Athrough E.
Why does the observed salary gap persistbetween people with and without a prior ADeven among the highly educated? Data availablefrom the NSCG survey are not sufficient to answerthis question. An important caveat of the aboveanalysis is the lack of ability and school perfor -mance measures and data on family characteristics,such as family income. One hypothesis is that
Kolesnikova
FEDERAL RESERVE BANK OF ST. LOUIS REVIEW JANUARY/FEBRUARY 2010 49
Table 15, cont’dRegression Analysis: Effects of Work Experience
Coefficient Standard error t-Statistic
D. Doctorate
Experience 1374.1 55.5 24.8
Woman –7583.2 860.7 –8.8
Black –6014.6 1791.7 –3.4
Hispanic –2556.2 1885.4 –1.4
Asian –3012.9 1086.6 –2.8
Associate’s degree –6883.8 1625.8 –4.2
Controls: Major field of study Yes
Number of observations 4,521
Adjusted R2 0.25
E. Professional degree
Experience 1185.5 81.5 14.6
Woman –7061.9 1340.0 –5.3
Black –2025.1 2890.2 –0.7
Hispanic –2899.1 2745.9 –1.1
Asian –2455.6 2362.8 –1.0
Associate’s degree –7767.6 2392.3 –3.3
Controls: Major field of study Yes
Number of observations 2,955
Adjusted R2 0.10

because community college students are morelikely to come from families with lower incomesand education, they are also more likely to attendlower-performing elementary and secondaryschools. It is possible that they fall far behindeven before entering the postsecondary educationsystem. The results seem to suggest that this dis-advantage affects educational and labor marketoutcomes throughout their lives—as a group theynever catch up with their peers.
CONCLUSIONCommunity colleges play a significant role
in U.S. higher education, enrolling 46 percent ofcurrent U.S. undergraduates. They offer the oppor-tunity to receive a postsecondary education tomany students who would not attend collegeotherwise: first-generation college students, stu-dents from low-income families, and older stu-dents who continue to work as they attend classespart-time. Attending a community college evenwithout completing a degree results in economicpayoffs—in particular, annual earnings increaseby 5 to 8 percent for each year of community col-lege education—and better job opportunities.Today, the number of U.S. undergraduates is atan all-time high as more people understand thenecessity of higher education in our technology-intensive world. In addition, historically, collegeenrollments in general increase during economicdownturns. Community colleges are importantin helping to absorb this increasing number ofstudents. Currently, community colleges haveadditional appeal because tuition and fees at four-
year colleges continue to increase while financialaid and student loans are harder to obtain.
Despite all the benefits of community colleges,there are downsides as well. The original goal ofcommunity colleges was to prepare students totransfer to four-year colleges. Associate’s degreeprograms were intended to accomplish that goal.However, only about 29 percent of communitycollege students transfer to four-year institutions,and only about 16 percent eventually receive abachelor’s degree or higher. Even among those whostart their postsecondary education intending toreceive a bachelor’s degree, only 26 percent accom-plish it. They are also much less likely to pursuepostgraduate studies.
In addition, the salary gap persists betweenthose with a bachelor’s degree or higher and aprior AD and similar individuals without an AD,even among the highly educated. This gap remainseven for people of the same gender, race, educa-tion, experience level, field of study, and type ofcollege they attended.
Still, for many students, community collegesoffer the best chance to obtain a college education.It is important, however, for individuals to knowboth the benefits and the disadvantages of attend-ing a community college when making decisionsabout higher education.
This paper attempts to present a comprehen-sive overview of how community colleges improvethe economic mobility of a significant subset ofthe U.S. population. A better understanding ofall aspects of this complicated subject shouldbe an important priority for researchers and policymakers.
Kolesnikova
50 JANUARY/FEBRUARY 2010 FEDERAL RESERVE BANK OF ST. LOUIS REVIEW
REFERENCESBlack, Dan; Kolesnikova, Natalia and Taylor, Lowell. “Earnings Functions When Wages and Prices Vary by
Location.” Journal of Labor Economics, January 2009, 27(1), pp. 21-47.
Hoachlande, Gary; Sikora, Anna C.; Horn, Laura and Carroll, C. Dennis. “Community College Students: Goals,Academic Preparation, and Outcomes.” NCES Report 2003-164, National Center for Education Statistics,June 2003; http://nces.ed.gov/pubs2003/2003164.pdf.
Horn, Laura and Nevill, Stephanie. “Profile of Undergraduates in U.S. Postsecondary Education Institutions:2003-04, With a Special Analysis of Community College Students.” NCES Report 2006-184, National Centerfor Education Statistics, June 2006; http://nces.ed.gov/pubs2006/2006184_rev.pdf.
Jacobson, Louis S.; LaLonde, Robert J. and Sullivan, Daniel G. “Estimating the Returns to Community CollegeSchooling for Displaced Workers.” Journal of Econometrics, March/April 2005, 125(1-2), pp. 271-304.
Kane, Thomas J. and Rouse, Cecilia Elena. “Labor Market Returns to Two- and Four-Year College.” AmericanEconomic Review, June 1995, 85(3), pp. 600-14.
Kane, Thomas J. and Rouse, Cecilia E. “The Community College: Educating Students at the Margin BetweenCollege and Work.” Journal of Economic Perspectives, Winter 1999, 13(1), pp. 63-84.
Kolesnikova, Natalia A. and Shimek, Luke. “Community Colleges: Not So Junior Anymore.” Federal ReserveBank of St. Louis The Regional Economist, October 2008, pp. 6-11;http://stlouisfed.org/publications/pub_assets/pdf/re/2008/d/colleges.pdf.
Kolesnikova, Natalia A. “From Community College to a Bachelor’s Degree and Beyond: How Smooth Is the Road?”Federal Reserve Bank of St. Louis The Regional Economist, July 2009a, pp. 10-11; http://stlouisfed.org/publications/pub_assets/pdf/re/2009/c/community_college.pdf.
Kolesnikova, Natalia A. “Community Colleges: A Route of Upward Mobility.” Federal Reserve Bank of St. LouisCommunity Development Research Report, March 2009b, pp. 1-28; http://stlouisfed.org/community_development/assets/pdf/CommunityColleges.pdf.
Leigh, Duane E. and Gill, Andrew M. “Labor Market Returns to Community Colleges: Evidence for ReturningAdults.” Journal of Human Resources, Spring 1997, 32(2), pp. 334-53.
Long, Bridget Terry and Kurlaender, Michal. “Do Community Colleges Provide a Viable Pathway to a BaccalaureateDegree?” NBER Working Paper No. 14367, National Bureau of Economic Research, September 2008;http://papers.nber.org/papers/w14367.pdf.
Rouse, Cecilia E. “Do Two-Year Colleges Increase Overall Educational Attainment? Evidence from the States.”Journal of Policy Analysis and Management, Fall 1998, 17(4), pp. 595-620.
Ruggles, Steven; Sobek, Matthew; Alexander, Trent; Fitch, Catherine; Goeken, Ronald; Hall, Patricia; King, Miriamand Ronnander, Chad. “2000 Public Use Micro Sample of the U.S. Census,” in Integrated Public Use MicrodataSeries. Minneapolis, MN: Minnesota Population Center [producer and distributor], 2004;http://usa.ipums.org/usa/.
Kolesnikova
FEDERAL RESERVE BANK OF ST. LOUIS REVIEW JANUARY/FEBRUARY 2010 51

Kolesnikova
52 JANUARY/FEBRUARY 2010 FEDERAL RESERVE BANK OF ST. LOUIS REVIEW
AP
PEN
DIX
A
Tab
le A
1C
ensu
s B
ure
au–D
esig
nat
ed R
egio
ns
Wes
tM
idw
est
No
rth
east
Sou
th
East
W
est
East
W
est
Mo
unta
inPa
cific
No
rth
Cen
tral
No
rth
Cen
tral
New
Eng
land
Mid
-Atl
anti
cSo
uth
Atl
anti
cSo
uth
Cen
tral
Sout
h C
entr
al
Idah
oA
lask
aW
isco
nsi
nN
ort
h D
ako
taM
ain
eN
ew Y
ork
Del
awar
eK
entu
cky
Okl
aho
ma
Mo
nta
na
Was
hin
gto
nM
ich
igan
Sou
th D
ako
taN
ew H
amp
shir
ePe
nn
sylv
ania
Mar
ylan
dTe
nn
esse
eTe
xas
Wyo
min
gO
rego
nIl
lino
isN
ebra
ska
Ver
mo
nt
New
Jer
sey
Dis
tric
t o
f C
olu
mb
iaM
issi
ssip
pi
Ark
ansa
s
Nev
ada
Cal
ifo
rnia
Ind
ian
aK
ansa
sM
assa
chu
sett
sV
irgi
nia
Ala
bam
aLo
uis
ian
a
Uta
hH
awai
iO
hio
Min
nes
ota
Rh
od
e Is
lan
dW
est
Vir
gin
ia
Co
lora
do
Iow
aC
on
nec
ticu
tN
ort
h C
aro
lina
Ari
zon
aM
isso
uri
Sou
th C
aro
lina
New
Mex
ico
Geo
rgia
Flo
rid
a

APPENDIX BCategory Definitions of Carnegie Foundation Classification of Institutions ofHigher Education
The 1994 Carnegie Classification includes all colleges and universities in the United States thatare degree-granting and accredited by an agency recognized by the U.S. Secretary of Education.
Research Universities I: These institutions offer a full range of baccalaureate programs, are committed to graduateeducation through the doctorate, and give high priority to research. They award 50 or more doctoral degrees1
each year. In addition, they receive annually $40 million or more in federal support.2
Research Universities II: These institutions offer a full range of baccalaureate programs, are committed to graduateeducation through the doctorate, and give high priority to research. They award 50 or more doctoral degrees1
each year. In addition, they receive annually between $15.5 million and $40 million in federal support.2
Doctoral Universities I: These institutions offer a full range of baccalaureate programs and are committed to graduateeducation through the doctorate. They award at least 40 doctoral degrees1 annually in five or more disciplines.3
Doctoral Universities II: These institutions offer a full range of baccalaureate programs and are committed tograduate education through the doctorate. They award annually at least 10 doctoral degrees—in three or moredisciplines—or 20 or more doctoral degrees in one or more disciplines.3
Master’s (Comprehensive) Universities and Colleges I: These institutions offer a full range of baccalaureateprograms and are committed to graduate education through the master’s degree. They award 40 or more master’sdegrees annually in three or more disciplines.3
Master’s (Comprehensive) Universities and Colleges II: These institutions offer a full range of baccalaureateprograms and are committed to graduate education through the master’s degree. They award 20 or more master’sdegrees annually in one or more disciplines.3
Baccalaureate (Liberal Arts) Colleges I: These institutions are primarily undergraduate colleges with majoremphasis on baccalaureate degree programs. They award 40 percent or more of their baccalaureate degreesin liberal arts fields4 and are restrictive in admissions.
Baccalaureate Colleges II: These institutions are primarily undergraduate colleges with major emphasis onbaccalaureate degree programs. They award less than 40 percent of their baccalaureate degrees in liberal artsfields4 or are less restrictive in admissions.
Associate of Arts Colleges: These institutions offer associate of arts certificate or degree programs and, with fewexceptions, offer no baccalaureate degrees.5
Kolesnikova
FEDERAL RESERVE BANK OF ST. LOUIS REVIEW JANUARY/FEBRUARY 2010 53
1 Doctoral degrees include Doctor of Education, Doctor of Juridical Science, Doctor of Public Health, and the Ph.D. in any field. 2 Total federal obligation figures are available from the National Science Foundation’s annual report, called Federal Support to Universities,
Colleges, and Nonprofit Institutions. The years used in averaging total federal obligations are 1989, 1990, and 1991.3 Distinct disciplines are determined by the U.S. Department of Education’s Classification of Instructional Programs 4-digit series.4 The liberal arts disciplines include English language and literature, foreign languages, letters, liberal and general studies, life sciences,
mathematics, philosophy and religion, physical sciences, psychology, social sciences, the visual and performing arts, area and ethnic studies,and multi- and interdisciplinary studies. The occupational and technical disciplines include agriculture, allied health, architecture, businessand management, communications, conservation and natural resources, education, engineering, health sciences, home economics, law andlegal studies, library and archival sciences, marketing and distribution, military sciences, protective services, public administration andservices, and theology.
5 This group includes community, junior, and technical colleges.
SOURCE: This information is from A Classification of Institutions of Higher Education. Princeton, NJ: The Carnegie Foundation for theAdvancement of Teaching Carnegie Foundation, 1994, pp. xix-xxi. Used with permission.

54 JANUARY/FEBRUARY 2010 FEDERAL RESERVE BANK OF ST. LOUIS REVIEW