community college brand awareness study
TRANSCRIPT

Branding Effectiveness Survey
Results, Trends and Recommendations
Prepared June 2013 for Community College

June 2013 pg. 2
TableofContents
ContentsEXECUTIVE SUMMARY .......................................................................................................... 3
RECOMMENDATIONS .............................................................................................................. 4
RESEARCH OBJECTIVES AND METHODOLOGY ............................................................ 5
DEMOGRAPHIC ANALYSIS .................................................................................................... 6
BRAND AWARENESS AND REACH ANALYSIS .................................................................. 7
IMAGE ANALYSIS ................................................................................................................... 11
ENGAGEMENT AND NEEDS ANALYSIS ............................................................................ 17
Statistical Note For this survey, sample size was not a direct function of population size; since the size of the county’s
potential undecided student population is unknown. A confidence level of 95% with an unknown population was used to determine the targeted sample size of 250 people.
June 2013 pg. 3
ExecutiveSummary The following report presents the results of a survey designed to help assess the effectiveness of Community College’s (CC’s) recent branding effort. AIM employees carried out in-person survey interviews with 251 prospective college students throughout the county, primarily but not exclusively in the 18-24 age range. The survey asked questions about CC’s tagline, respondents’ perception of CC, and their own preferences on the college experience and ways to receive information from colleges. Several insights have emerged from this process.
The majority of survey respondents (66%) were unfamiliar with CC’s tagline, with only about 14% connecting it with CC. This result is not unexpected for a foundational branding study conducted after only 18 months of exposure to the new tagline.
When asked where they remembered seeing or hearing advertisements for CC, over 50% of respondents cited Pandora Internet radio and television. About a quarter of respondents cited Facebook and Twitter, billboards, mailers, and school flyers and posters.
Respondents across all age groups prefer to be contacted by email and postal mail. Online/website contact was also preferred by those over 24 years old. The 16-17 year olds we surveyed also indicated they preferred to receive college information through high school advisors.
The variation between respondents’ preferred modes of communication and where they recalled hearing CC messaging underscores the need for a “funnel approach” in marketing, where Pandora and television are used at the “top of the funnel” to create awareness among potential students, and email and postal mail are used further “down the funnel” to engage those students in dialogue about CC.
Respondents perceived CC as having advantages over its competitors in cost and value, ease of
transfer and process. They viewed it as a good “launching pad” for future endeavors. However, some respondents felt CC had the “community college” stigma, questioning its academic rigor and the upkeep of its facilities.
Among CC’s competitors, Community College 2 was widely perceived as “kind” to students, and
some students considered it to be more academically rigorous, while Community College 3’s reputation was hurt by its location.
Respondents cited cost as the primary driver of their college choice, followed by quantity and
relevance of programs and classes. A convenient location and a reputation for quality were also important factors.
When asked about the CC Promise, respondents overwhelmingly believed it was credible, but
only about 50% were able to equate it to an experience that made them trust the Promise. Since many did not explain their reasoning, however, this division could be due to their unfamiliarity with CC.
June 2013 pg. 4
Recommendations Based on the survey work detailed above, AIM offers the following recommendations as CC moves forward with its branding and student engagement efforts. Continue the branding initiative. Respondents widely praised what they perceived to be CC’s
flexibility and the ways it helps people from all walks of life to discover their interests and plan for their futures. This ties back to one of the components of CC’s tagline; continued implementation of this branding effort with emphasis on discovery is recommended.
Emphasize program selection and rigor. Respondents indicated cost, program selection and convenient location as their three most important factors in choosing a college, but they more strongly tied CC to value for money and convenience than they did to the depth and breadth of classes. Some respondents shared their perception of a lack of academic rigor in classes, while others felt classes were more rigorous than they’d been led to believe. Focusing clearly on the variety of program selection and the intensity (but achievable nature) of classes could allay both those issues.
Emphasize the partnership with the local University Center. Several respondents believed CC had no connection to four-year degree programs. Emphasizing the path to four-year degrees through the University Center will help people understand the depth of academic rigor available through CC.
Mention opportunities unique to CC, especially among competitors. This will help with the “program selection” emphasis noted above, and will further help potential students understand that CC represents an advance on their prior education (avoiding the “high school” stigma).
Segment communications by their intent. Respondents indicated they recall CC advertising most readily from Pandora (Internet radio) advertising and television, yet they prefer communication through email and postal mail. In marketing to potential students, we recommend continuing to segment communications according to two student groups: those at the top of the “marketing funnel” who are not yet familiar with CC’s message (using Pandora and television to create awareness), and those “in the funnel” who are already engaged with CC and want more information (using email and postal communications to best meet their expressed communication preferences).
Continue and strengthen engagement with high school advisors. Of the age groups interviewed for this survey, the 16-17 year old group is the least familiar with the CC tagline by a significant amount, and – not surprisingly – they rely on their high school advisors for college information more than any other group. These advisors represent a good opportunity to get in “on the ground floor” with this group and make them more aware of CC in advance of their college decision.
Take simple measures to improve perceptions of safety. A small number of respondents perceived issues with the safety of CC’s campus (parking lots, lighting, etc.). Emphasizing current security measures in marketing materials, as well as infrastructure improvements that enhance safety, could help allay this perception without calling undue attention to it.
Emphasize the importance of support staff. With “cost” cited as the largest single factor in college choice, as well as a significant factor in respondents’ current perceptions of CC, the role of financial aid staff and counselors is an important marketing tool for the college. Respondents vividly remembered both positive and negative experiences with these staff members.
Follow up to gain further insight. With this current study as a foundational base for measurement, AIM recommends CC conduct a follow-up study within 12-18 months to again measure brand awareness and reach. The two studies can then be compared to reveal statistically valid changes in brand awareness and perceptions among your target audiences.

June 2013 pg. 5
ResearchObjectivesandMethodology
Objective This study is intended to help Community College (CC) assess the effectiveness of its recent marketing and branding campaign by collecting, measuring and analyzing feedback from prospective college students within the county. The study will provide CC with a better understanding of and recommendations for a) its brand awareness and reach, b) current perceptions, and c) prospective students’ engagement preferences and needs.
Methodologies Following a joint CC-AIM meeting in mid-May to determine CC’s values, goals and desired outcomes,
AIM worked closely with CC to develop concise and informative interview questions to provide CC’s staff and leadership with reliable intelligence on the institution’s current and future needs.
From May 24 to June 24, AIM utilized human-source information collection via in-person intercept interviews at various “watering holes” within the county. In total, 251 interviews were conducted with people currently enrolled in a local competitive institution or considering higher education, primarily but not exclusively in the 18-24 age range. This approach allowed us to understand and relate emerging trends with the values and needs of a young adult audience seeking a community college experience and education. AIM supplemented this primary research with public (open source) research to identify survey locations and to supplement demographic data.
After completion of the collection process, AIM’s research
analysts analyzed the collected data to identify key opportunities and vulnerabilities that will give CC a competitive advantage with brand effectiveness and ultimately with attracting and retaining new students.
CC and AIM jointly participated in interim progress report calls to ensure a collaborative process and
provide the most optimum and actionable results. AIM deliverables include this detailed report of findings as well as a summary PowerPoint
presentation for an internal CC audience.
For this survey, sample size was not a direct function of population size, since the size of the county’s potential undecided student population is unknown. Instead, a confidence level of 95% was used to determine the targeted sample size of 250 people.
Code of Conduct AIM’s research and resulting reports were completed in accordance with U.S. and international laws. AIM followed the competitive intelligence ethics guidelines of the Strategic and Competitive Intelligence Professionals (SCIP) association, as well as all directives and guidelines provided by CC.
Top Survey Reponses by College Enrollment Status
(Responses with 2 or more students enrolled were included)
Undecided 155 CC 29 University 1 16 College 1 14 CC 2 10 University 2 6 CC 4 3 College 2 3 College 3 2 CC 4 2 College 4 2
June 2013 pg. 6
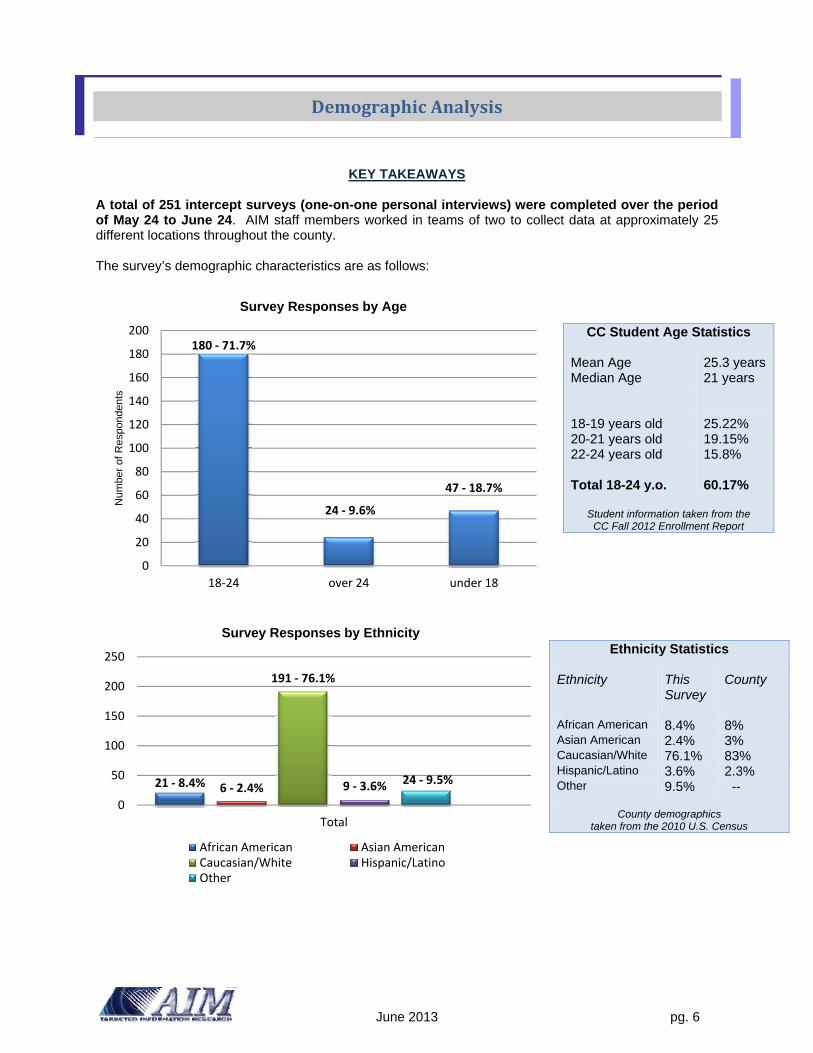
DemographicAnalysis
KEY TAKEAWAYS
A total of 251 intercept surveys (one-on-one personal interviews) were completed over the period of May 24 to June 24. AIM staff members worked in teams of two to collect data at approximately 25 different locations throughout the county. The survey’s demographic characteristics are as follows:
180 ‐ 71.7%
24 ‐ 9.6%
47 ‐ 18.7%
0
20
40
60
80
100
120
140
160
180
200
18‐24 over 24 under 18
Num
ber
of R
espo
nden
ts
Survey Responses by Age
21 ‐ 8.4% 6 ‐ 2.4%
191 ‐ 76.1%
9 ‐ 3.6% 24 ‐ 9.5%
0
50
100
150
200
250
Total
Survey Responses by Ethnicity
African American Asian AmericanCaucasian/White Hispanic/LatinoOther
CC Student Age Statistics
Mean Age 25.3 years Median Age 21 years
18-19 years old 25.22% 20-21 years old 19.15% 22-24 years old
15.8%
Total 18-24 y.o. 60.17%
Student information taken from the CC Fall 2012 Enrollment Report
Ethnicity Statistics
Ethnicity This Survey
County
African American 8.4% 8% Asian American 2.4% 3% Caucasian/White 76.1% 83% Hispanic/Latino 3.6% 2.3% Other 9.5% --
County demographics
taken from the 2010 U.S. Census

June 2013 pg. 7
BrandAwarenessandReachAnalysis
Summary and Key Takeaways After answering basic demographic questions, survey respondents were asked two preliminary questions about Community College (CC) and its marketing efforts to set the stage for more detailed questions about the CC brand:
1) WhatcollegecomestomindwhenyouseeorhearCC’stagline?2) WherehaveyouseenorheardadvertisementsforCommunityCollege?
Out of 250 respondents, 165 (66% of the total) said the tagline was unfamiliar to them. Thirty-eight
people (15.2%) said the tagline was “familiar” but could not ascribe it to a specific college, while 36 respondents (14.4%) correctly identified Community College from the tagline. Eleven people (4.4%) incorrectly identified the tagline as belonging to another college.
These results make sense for a baseline/foundational survey after a new branding initiative, and are actually significantly better than many other published branding efforts. A 2004 survey by Atlanta-based Emergence (shown below) gives representative slogan recognition for many national brands that were at or well below CC’s tagline recognition level despite having significantly larger budgets and longer lead time.
McDonald’s “I’m Lovin’ It” slogan had been in use for 18 months in late 2004, similar to the CC tagline today; they only scored 33% recognition.
GE’s “Imagination at Work” only scored 5% recognition despite an advertising budget of $70 million.
The results indicate that CC is making efficient and targeted use of its marketing and promotional budget.
Unfamiliar, 66.0%
Familiar, 15.2%
CC, 14.4%
Other College, 4.4%
WhatcollegecomestomindwhenyouseeorhearCC’stagline?
Selected responses “I knew it right away…” “It looks familiar, but I can’t place
it.” “It’s something college-related; I
can’t tell. It sounds generic.” “I don’t know that tagline, but I
recognize the logo on the survey form.”
CC + Familiar: 29.6%
Emergence Study via Businessweek Magazine, Oct 2004
A key learning from the Emergence study is, “give your slogan time to develop.” State Farm's "Like a good neighbor" had 70% recognition; the slogan has had time to be seeded into the consciousness of the marketplace. “Companies that change their slogans too often never give them a chance to take root. You have to be patient.”
National Brand Slogan Recognition(CC data from 2013 AIM survey for reference)

June 2013 pg. 8
The chart below shows responses broken out by respondents’ age. Increasing age correlates with familiarity with the CC tagline:
o The 16-17 year old respondents were significantly more unfamiliar with the CC tagline than those 18 or older. This makes sense given that the new branding started 18 months ago, when today’s 16-17 year olds were likely not yet thinking about college.
o The combined percentage of people who were either familiar with the tagline in general or could ascribe it specifically to CC (the “CC + Familiar” column) increases directly with respondent age.
WherehaveyouseenorheardadvertisementsforCommunityCollege? (Respondentscouldselectmultipleresponses.)
Because respondents could choose multiple responses, percentages do not add to 100%.
Responses by Age Group
Age Group Other College
CC Familiar CC + Familiar Unfamiliar
16-17
0.00% 17.02% 8.51% 25.53% 74.47%
18-24
5.59% 13.41% 16.76% 30.17% 64.25%
Over 24
4.17% 16.67% 16.67% 33.34% 62.5%
0%
10%
20%
30%
40%
50%
60%
Pandora TV Facebook/Twitter Billboards Mailers School flyers/posters
Online banner ads
Busboards
Since CC has reported not engaging actively in television or Facebook/Twitter advertising, we believe these results speak to both the “staying power” of these forms of advertising (an advertisement or news clip seen once might be recalled
months or years later) as well as respondents’ varying perceptions of where their information comes from: people who often watch TV might recall information as having come from a TV ad, even if they actually received it from another source.
People % of group
Pandora 149 59.36%
TV 128 51.00%
Facebook/Twitter 72 28.69%
Billboards 61 24.30%
Mailers 58 23.11%
School flyers/posters 51 20.32%
Online banner ads 38 15.14%
Busboards 16 6.37%

June 2013 pg. 9
18-24 year olds (179 respondents)
Over 24 years old (24 respondents)
16-17 years old (47 respondents)
People % of group
Pandora 112 62.57%
TV 88 49.16%
Facebook/Twitter 47 26.26%
Billboards 40 22.35%
Mailers 40 22.35%
School flyers/posters 35 19.55%
Online banner ads 24 13.41%
Busboards 10 5.59%
People % of group
TV 13 54.17%
Pandora 11 45.83%
Mailers 10 41.67%
Billboards 8 33.33%
Online banner ads 8 33.33%
Facebook/Twitter 6 25.00%
School flyers/posters 4 16.67%
Busboards 3 12.50%
People % of group
TV 27 57.45%
Pandora 26 55.32%
Facebook/Twitter 19 40.43%
Billboards 13 27.66%
School flyers/posters 12 25.53%
Mailers 8 17.02%
Online banner ads 6 12.77%
Busboards 3 6.38%
Because respondents could choose multiple
responses, percentages do not add to 100%.

June 2013 pg. 10
Respondents were surveyed about how they recalled receiving CC messaging, and were free to pick all applicable answers.
With all age groups aggregated, respondents cited Pandora ads the most, with 59.36% of all respondents claiming to have seen CC advertising there. Television closely followed with 51% of respondents.
Among the aggregate group, the next four advertising
venues – Facebook/Twitter, billboards, mailers, and school flyers/posters – had an awareness level of about half as much as the top two cited. Respondents claimed to see online banner ads on websites less at 15.14%, and recalled bus boards the least, with only 6.37% of respondents mentioning them.
When breaking out individual age groups, the 18-24 year old respondents saw Pandora ads the most, with 62.6% saying they’d seen CC ads there, slightly more than the aggregate. Television was second at 49.2%, slightly less than the aggregate. Facebook and Twitter ads, while still third place, were also slightly less than the aggregate figure.
Both the over-24 and the 16-17 groups of respondents recalled television more than any other advertising vehicle, ahead of Pandora ads, which were second place for both groups. However, while television was cited similarly by both groups at 54 and 57% respectively, Pandora ads were cited more by the 16-17 group (55.3%) than by the over-24 group (45.8%). The over-24 group also cited mailers, billboards and online banner ads as the advertising sources they recalled the most, while Facebook and Twitter were the next most recalled option for the 16-17 group, with billboards and school flyers/posters recalled somewhat less.
Ranking of survey choices for advertising awareness
Pandora Internet radio
High awareness Television
Facebook/Twitter ads
Medium awareness
Billboard ads
Postcards and mailers
School flyers and posters
Online (banner advertisements on websites)
Low awareness
Bus boards

June 2013 pg. 11
ImageAnalysis
Key Takeaways
How CC is perceived in the targeted demographics was measured using three questions:
1) WhatcomestomindwhenyouthinkofCommunityCollege2,CommunityCollege3,andCommunityCollege?
2) WhatdoyoufeelCC’sgreateststrengthandgreatestweaknessis?3) WhichbestrelatestoyourunderstandingofCC:Qualityeducation,cost/value,
employmentoradvancementopportunities,discovermypotential/interests,funenvironment/sociallife,easeoftransfer,facultyhelpfulness,meetpeople/network.(Chooseasmanyresponsesasnecessary.)
Questions one and two were open ended, while question three focused on specific attributes. Results indicated CC is well known for its cost, value, and ease of transfer (both to and from CC). A few isolated respondents did note a perception of somewhat lesser academic rigor.
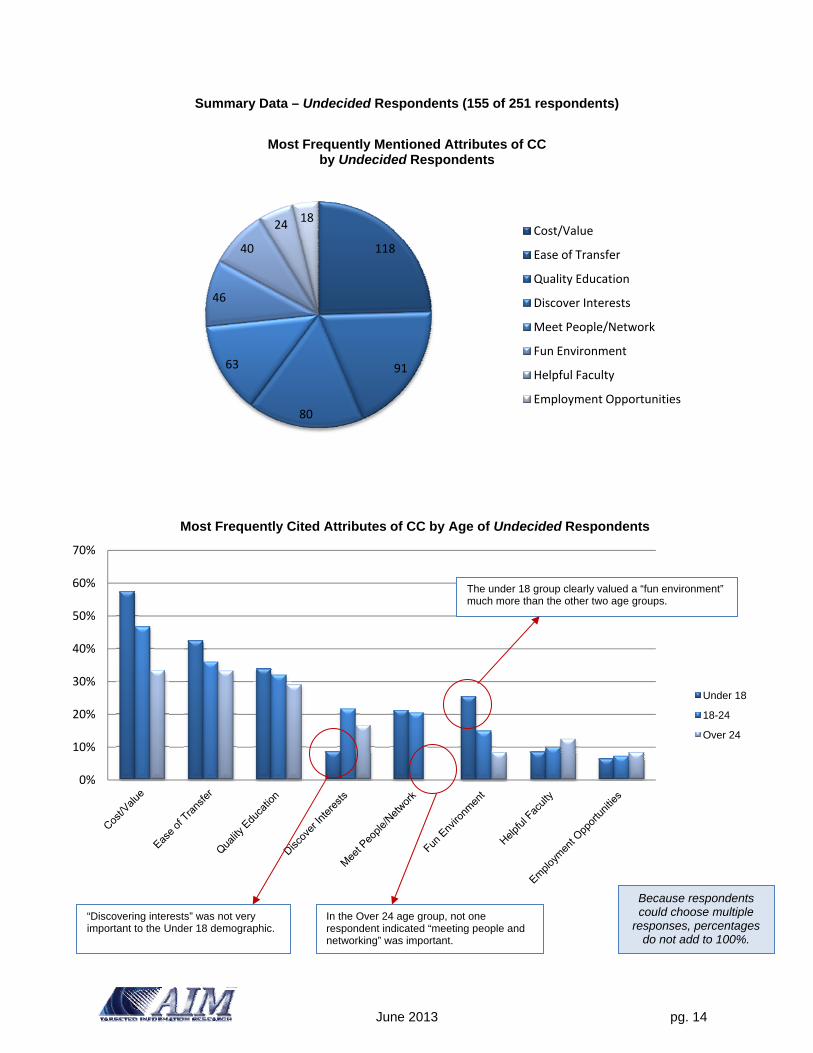
These trends are consistent among age groups as well as, and arguably most importantly, the large number of undecided respondents in the survey.
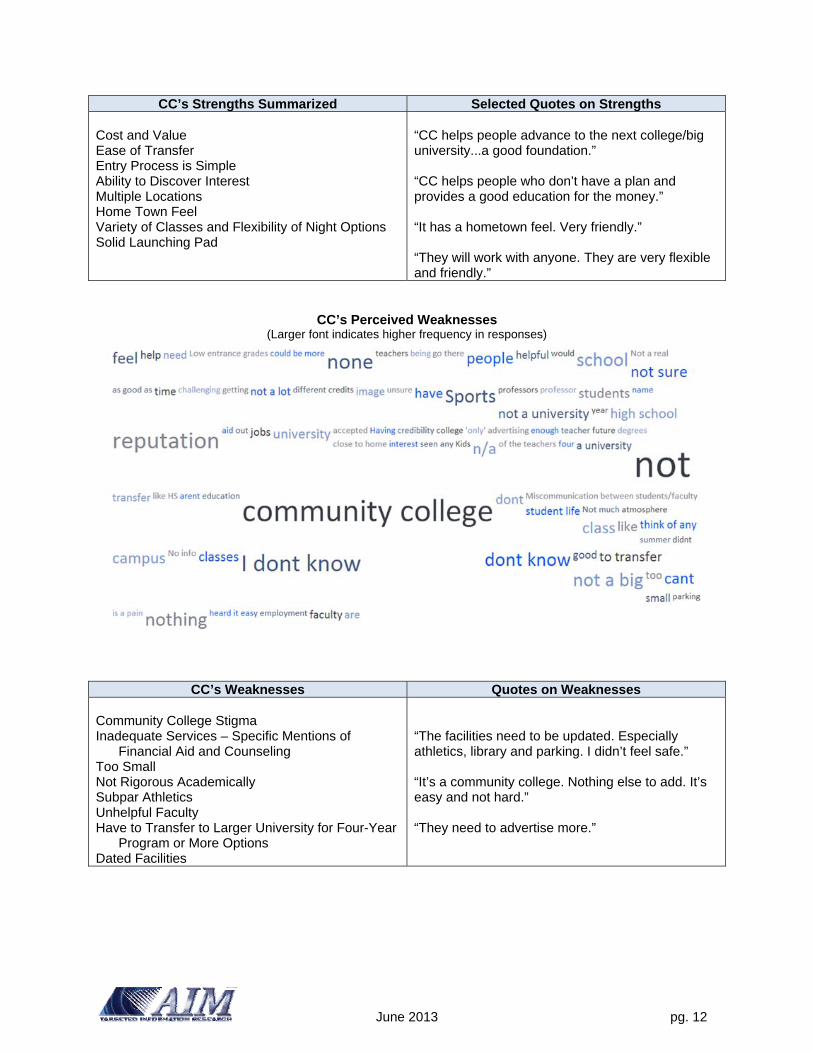
CC seems to fare better when compared to Community College 3 than Community College 2, mainly because of CC 3’s location being perceived as undesirable. CC 2 has a strong association with being “nice” and potentially having a slightly more rigorous academic program. CC’sStrengths&WeaknessesRespondents’ perceptions of CC’s strengths and weaknesses covered a wide spectrum. The below table and word cloud highlight major trends in the responses, followed by specific quotes of interest.
CC’s Perceived Strengths (Larger font indicates higher frequency in responses)
Top Survey Reponses by College Enrollment Status
(Responses with 2 or more students enrolled were included)
Undecided 155 CC 29 CC 3 16 College 1 14 CC 2 10 University 2 6 CC 4 3 College 2 3 College 3 2 CC 4 2 College 4 2
June 2013 pg. 12
CC’s Strengths Summarized Selected Quotes on Strengths Cost and Value Ease of Transfer Entry Process is Simple Ability to Discover Interest Multiple Locations Home Town Feel Variety of Classes and Flexibility of Night Options Solid Launching Pad
“CC helps people advance to the next college/big university...a good foundation.” “CC helps people who don’t have a plan and provides a good education for the money.” “It has a hometown feel. Very friendly.” “They will work with anyone. They are very flexible and friendly.”
CC’s Perceived Weaknesses (Larger font indicates higher frequency in responses)
CC’s Weaknesses Quotes on Weaknesses Community College Stigma Inadequate Services – Specific Mentions of
Financial Aid and Counseling Too Small Not Rigorous Academically Subpar Athletics Unhelpful Faculty Have to Transfer to Larger University for Four-Year
Program or More Options Dated Facilities
“The facilities need to be updated. Especially athletics, library and parking. I didn’t feel safe.” “It’s a community college. Nothing else to add. It’s easy and not hard.” “They need to advertise more.”

June 2013 pg. 13
Attributes/CharacteristicsMostAssociatedwithCC
Respondents were asked which of the following words best relates to their understanding of CC. Multiple responses were allowed.
Attributes/Characteristics Most Associated with CC (Larger font indicates higher frequency in responses)
Summary Data – All Respondents
Attribute/Characteristic
Responses
Cost/Value 200 Ease of Transfer 161 Quality Education 132 Discover Potential Interests 97 Meet People/Network 81 Fun Environment/Social Life 76 Helpful Faculty 56 Employment Opportunities 40 Because respondents could choose multiple responses, the number of responses is greater than the number of people surveyed.
Cost and Ease of Transfer were the most cited responses, with Employment Opportunities and Helpful Faculty the least cited. These responses were consistent across all age groups as well.
June 2013 pg. 14
0%
10%
20%
30%
40%
50%
60%
70%
Most Frequently Cited Attributes of CC by Age of Undecided Respondents
Under 18
18-24
Over 24
Summary Data – Undecided Respondents (155 of 251 respondents)
118
91
80
63
46
40
2418
Most Frequently Mentioned Attributes of CC by Undecided Respondents
Cost/Value
Ease of Transfer
Quality Education
Discover Interests
Meet People/Network
Fun Environment
Helpful Faculty
Employment Opportunities
“Discovering interests” was not very important to the Under 18 demographic.
In the Over 24 age group, not one respondent indicated “meeting people and networking” was important.
The under 18 group clearly valued a “fun environment” much more than the other two age groups.
Because respondents could choose multiple
responses, percentages do not add to 100%.
June 2013 pg. 15
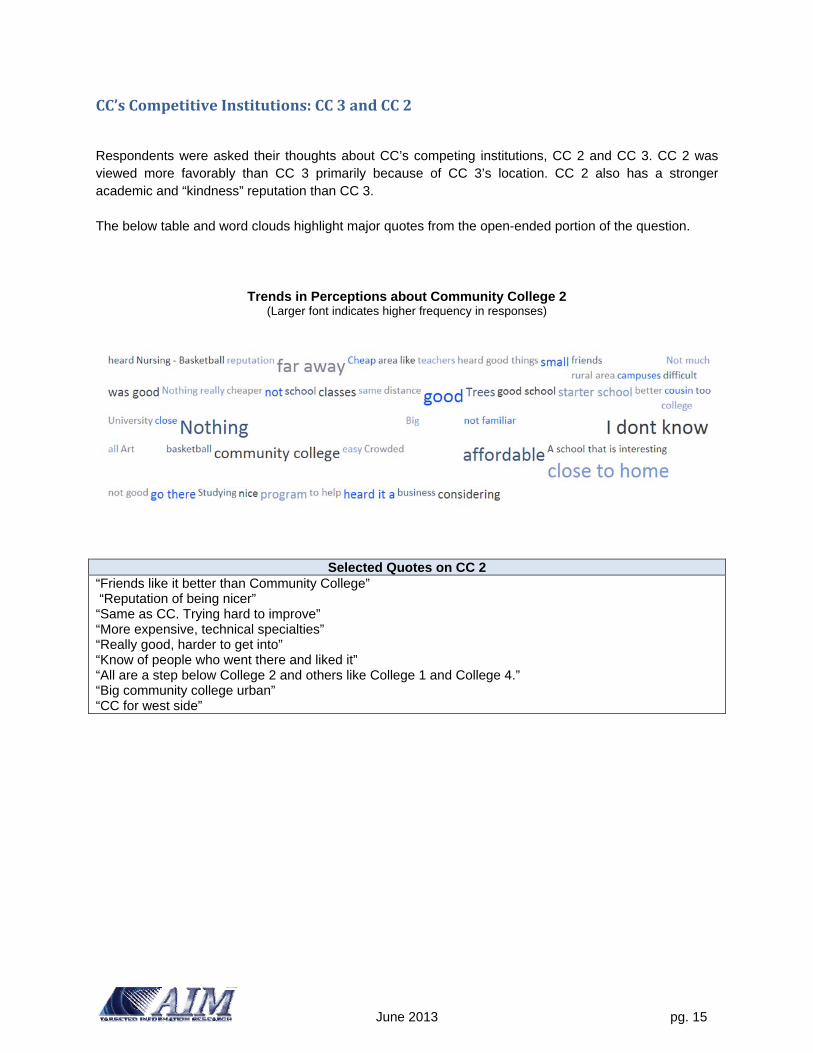
CC’sCompetitiveInstitutions:CC3andCC2
Respondents were asked their thoughts about CC’s competing institutions, CC 2 and CC 3. CC 2 was viewed more favorably than CC 3 primarily because of CC 3’s location. CC 2 also has a stronger academic and “kindness” reputation than CC 3. The below table and word clouds highlight major quotes from the open-ended portion of the question.
Trends in Perceptions about Community College 2 (Larger font indicates higher frequency in responses)
Selected Quotes on CC 2 “Friends like it better than Community College” “Reputation of being nicer” “Same as CC. Trying hard to improve” “More expensive, technical specialties” “Really good, harder to get into” “Know of people who went there and liked it” “All are a step below College 2 and others like College 1 and College 4.” “Big community college urban” “CC for west side”

June 2013 pg. 16
Trends in Perception about Community College 3 (Larger font indicates higher frequency in responses)
Selected Quotes on CC 3 “In the ghetto.” Downtown and not good Not a nice place Good place to get credits to transfer to University 1 Inner city; a lot of kids go here Did dual enrollment during high school here... not very challenging

June 2013 pg. 17
EngagementandNeedsAnalysis
Summary and Key Takeaways
This section of the survey explored current and potential students’ desires for their college education and whether CC, in their estimation, was poised to deliver on its promise. It also assessed how students preferred to receive information from colleges. Questions included the following:
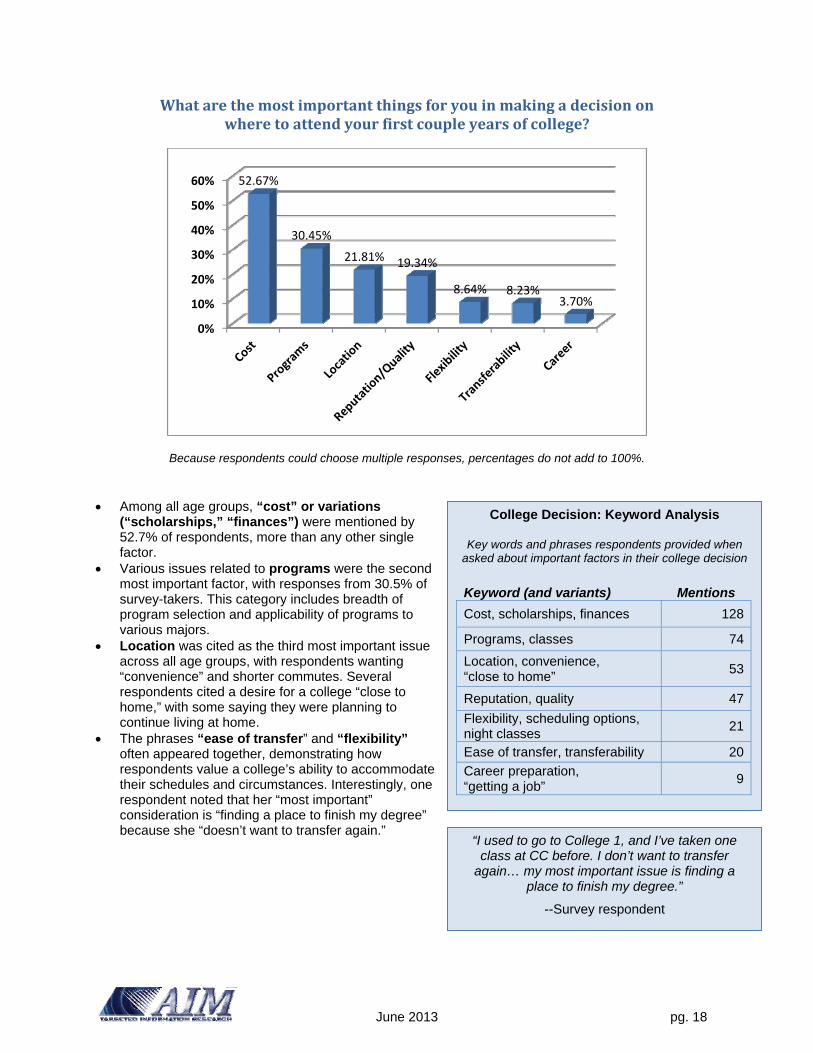
1) Whatarethemostimportantthingsforyouinmakingadecisiononwheretoattendyourfirstcoupleyearsofcollege?
Cost, location and programs were the most important factors in respondents’ college
selection.
2) Howdoyouprefertoreceiveinformation?(Checkallthatapply.)
Respondents greatly prefer email and postal mail as communication vehicles, with the over-24 age group preferring online communication (through websites) as well.
3) CommunityCollegewantstobethecollegethatoffersthepromiseof
discoveringyourinterestsorpotentialcareerpathandconnectingyouwithotherpeoplethatwillhelpyouadvancetothenextstageofyourpersonalandprofessionalachievement.Doyoubelieveinthispromiseorfeelit’scredible? There was widespread belief among respondents in the credibility of the CC Promise.
4) Doyouorsomeoneyouknowhaveexperiencesthatwouldmakeyoutrustin
thispromiseornot?Pleaseexplainreasoning.
Respondents were evenly split on whether they’d had experiences that made them trust the CC Promise, but this could be due to varying factors.
June 2013 pg. 18
Whatarethemostimportantthingsforyouinmakingadecisiononwheretoattendyourfirstcoupleyearsofcollege?
Because respondents could choose multiple responses, percentages do not add to 100%.
Among all age groups, “cost” or variations
(“scholarships,” “finances”) were mentioned by 52.7% of respondents, more than any other single factor.
Various issues related to programs were the second most important factor, with responses from 30.5% of survey-takers. This category includes breadth of program selection and applicability of programs to various majors.
Location was cited as the third most important issue across all age groups, with respondents wanting “convenience” and shorter commutes. Several respondents cited a desire for a college “close to home,” with some saying they were planning to continue living at home.
The phrases “ease of transfer” and “flexibility” often appeared together, demonstrating how respondents value a college’s ability to accommodate their schedules and circumstances. Interestingly, one respondent noted that her “most important” consideration is “finding a place to finish my degree” because she “doesn’t want to transfer again.”
0%
10%
20%
30%
40%
50%
60% 52.67%
30.45%
21.81% 19.34%
8.64% 8.23%3.70%
College Decision: Keyword Analysis
Key words and phrases respondents provided when asked about important factors in their college decision
Keyword (and variants) Mentions
Cost, scholarships, finances 128
Programs, classes 74
Location, convenience, “close to home”
53
Reputation, quality 47
Flexibility, scheduling options, night classes
21
Ease of transfer, transferability 20
Career preparation, “getting a job”
9
“I used to go to College 1, and I’ve taken one class at CC before. I don’t want to transfer
again… my most important issue is finding a place to finish my degree.”
--Survey respondent
June 2013 pg. 19
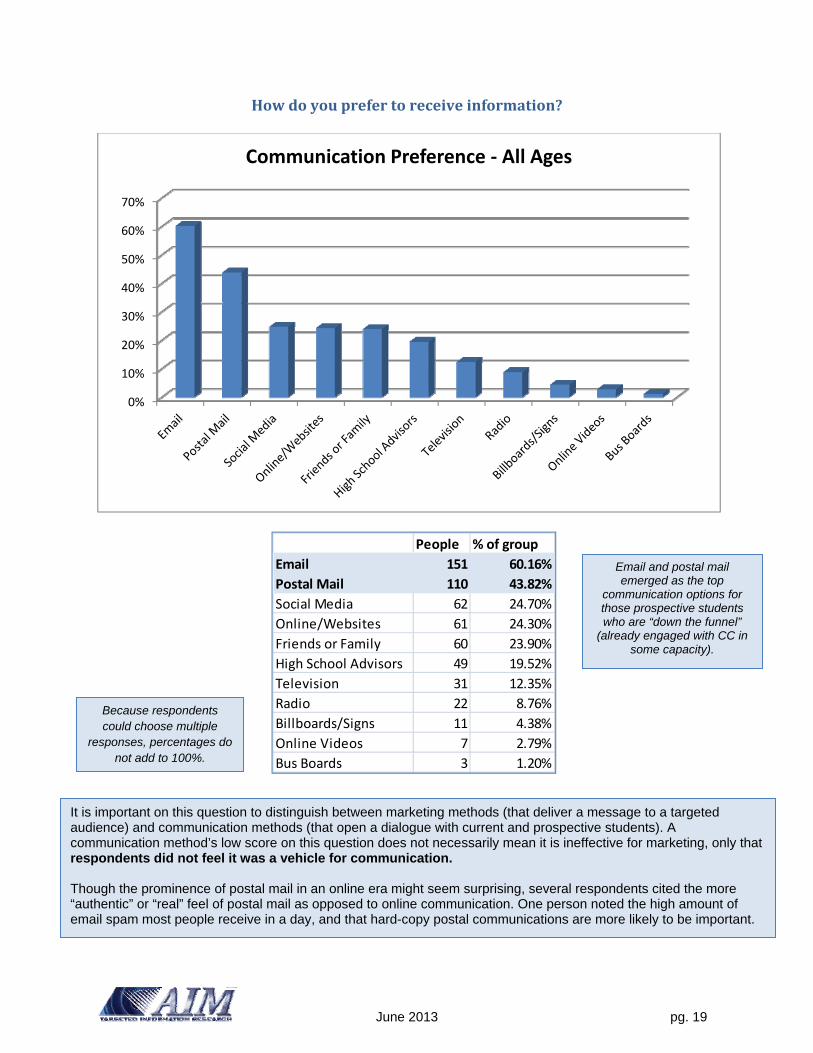
Howdoyouprefertoreceiveinformation?
0%
10%
20%
30%
40%
50%
60%
70%
Communication Preference ‐ All Ages
People % of group
Email 151 60.16%
Postal Mail 110 43.82%
Social Media 62 24.70%
Online/Websites 61 24.30%
Friends or Family 60 23.90%
High School Advisors 49 19.52%
Television 31 12.35%
Radio 22 8.76%
Billboards/Signs 11 4.38%
Online Videos 7 2.79%
Bus Boards 3 1.20%
It is important on this question to distinguish between marketing methods (that deliver a message to a targeted audience) and communication methods (that open a dialogue with current and prospective students). A communication method’s low score on this question does not necessarily mean it is ineffective for marketing, only that respondents did not feel it was a vehicle for communication. Though the prominence of postal mail in an online era might seem surprising, several respondents cited the more “authentic” or “real” feel of postal mail as opposed to online communication. One person noted the high amount of email spam most people receive in a day, and that hard-copy postal communications are more likely to be important.
Email and postal mail emerged as the top
communication options for those prospective students who are “down the funnel”
(already engaged with CC in some capacity).
Because respondents could choose multiple
responses, percentages do not add to 100%.

June 2013 pg. 20
0%
10%
20%
30%
40%
50%
60%
70%
Communication Preference ‐ Response by Age Group
16‐17 18‐24 Over 24
18-24 years old (180 respondents)
Over 24 years old (24 respondents)
16-17 years old (47 respondents)
People % of group
Email 25 53.19%
Postal Mail 19 40.43%
High School Advisors 13 27.66%
Social Media 11 23.40%
Friends or Family 11 23.40%
Online/Websites 7 14.89%
Television 3 6.38%
Online Videos 2 4.26%
Radio 1 2.13%
Bus Boards 0 0.00%
Billboards/Signs 0 0.00%
People % of group
Email 110 61.11%
Postal Mail 81 45.00%
Social Media 47 26.11%
Online/Websites 43 23.89%
Friends or Family 42 23.33%
High School Advisors 32 17.78%
Television 25 13.89%
Radio 17 9.44%
Billboards/Signs 9 5.00%
Online Videos 5 2.78%
Bus Boards 3 1.67%
People % of group
Email 16 66.67%
Online/Websites 11 45.83%
Postal Mail 10 41.67%
Friends or Family 7 29.17%
Social Media 4 16.67%
High School Advisors 4 16.67%
Radio 4 16.67%
Television 3 12.50%
Billboards/Signs 2 8.33%
Bus Boards 0 0.00%
Online Videos 0 0.00%
Because respondents could choose multiple
responses, percentages do not add to 100%.

June 2013 pg. 21
Respondents were surveyed as to their preferred method for receiving information, and were free to pick all answers that applied.
The aggregate of all age groups revealed email to be the clear choice for receiving communications, with over 60% of respondents citing it as a preferred information source. Postal mail was cited next, with almost 44% of respondents using it.
The next three options, though only preferred about
half as much as the top two options, were grouped closely together. Out of the aggregate of all respondents, 24.7% cited social media, 24.3% cited online communications or websites, and 23.9% named friends and family. High school advisors also showed up near this grouping, with 19.5% of respondents citing them, but this response was skewed by data from the 16-17 year old group (see below).
Television and radio were each cited by only about 10% of respondents as a preferred way to receive information (12.4% for television, 8.8% for radio), while billboards, online videos and bus boards were all cited by less than 5% of respondents.
The 16-17 year old group cited email (53.2%) and postal mail (40.4%) as their top two communication vehicles, and also emphasized high school advisors (27.7%) as a key information source. Social media and friends and family tied for fourth on their list at 23.4%. Interestingly, while the percentage of this group citing postal mail was roughly the same as the other two groups, they cited email about 10% less than those groups.
After email (61.1%) and postal mail (45%), the 18-24 year old group cited social media (26.1%) as their third-highest preferred communication method, with online/websites (23.9%) and friends and family (23.3%) tying for fourth place. High school advisors were considerably less important for this group at 17.8%.
The Over 24 year old group also cited email as their top communication choice at 66% of respondents – more than either of the other two groups. Unlike the other two groups, this group placed online/websites as their second most important communication method, at a significant 45.9% of respondents. Postal mail moved down to third for this group at 41.7%.
Each age group had a sharp dropoff in preference after their top two or three communication choices, indicating that each group prefers its top communication methods significantly more than other communication means.
Ranking of survey choices for communication methods
Most preferred Postal mail
Social media
Somewhat preferred
Online/websites
Friends and family
High school advisors
Television
Less preferred
Radio
Billboards/signs
Online videos
Bus boards
June 2013 pg. 22
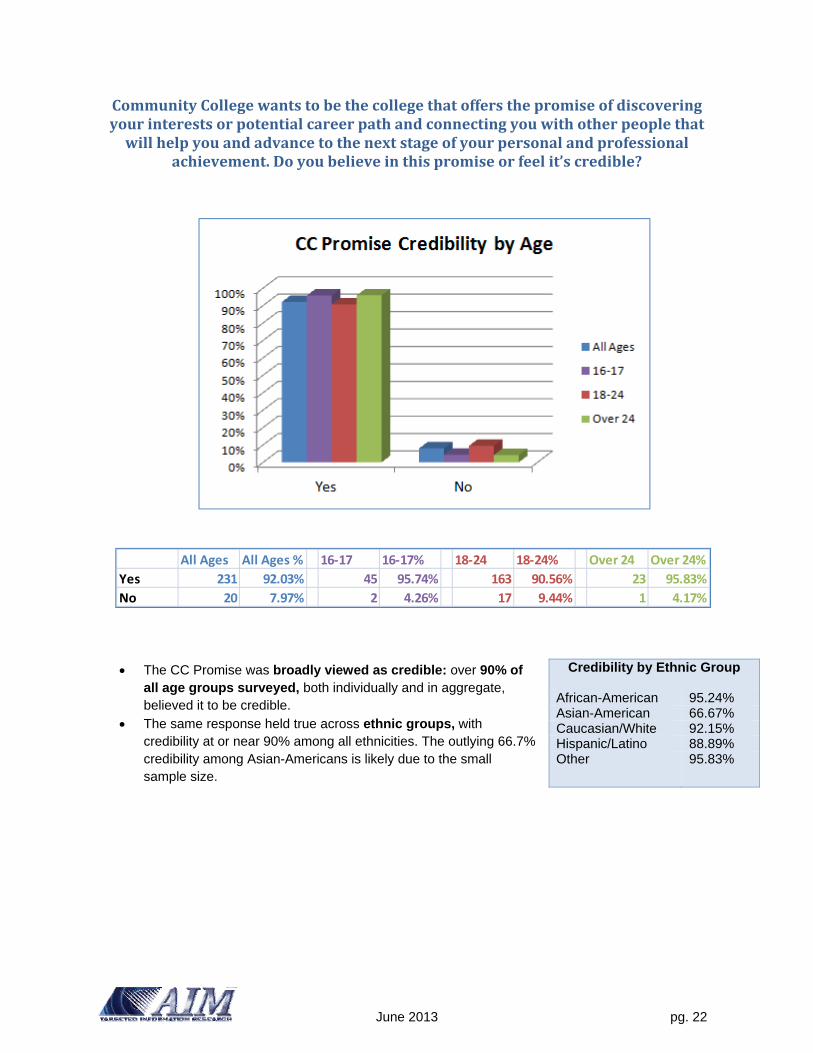
CommunityCollegewantstobethecollegethatoffersthepromiseofdiscoveringyourinterestsorpotentialcareerpathandconnectingyouwithotherpeoplethatwillhelpyouandadvancetothenextstageofyourpersonalandprofessional
achievement.Doyoubelieveinthispromiseorfeelit’scredible?
The CC Promise was broadly viewed as credible: over 90% of
all age groups surveyed, both individually and in aggregate, believed it to be credible.
The same response held true across ethnic groups, with credibility at or near 90% among all ethnicities. The outlying 66.7% credibility among Asian-Americans is likely due to the small sample size.
Credibility by Ethnic Group African-American 95.24% Asian-American 66.67% Caucasian/White 92.15% Hispanic/Latino 88.89% Other
95.83%
All Ages All Ages % 16‐17 16‐17% 18‐24 18‐24% Over 24 Over 24%
Yes 231 92.03% 45 95.74% 163 90.56% 23 95.83%
No 20 7.97% 2 4.26% 17 9.44% 1 4.17%

June 2013 pg. 23
Doyouorsomeoneyouknowhaveexperiencesthatwouldmakeyoutrustinthispromiseornot?Pleaseexplainreasoning.
As shown on the first bar graph and percentage chart above, responses were divided almost evenly as to whether respondents had experiences that led them to trust the CC Promise. A high number of respondents felt the promise was credible, but did not give reasoning to support their claim. As shown in the chart at right, over half the respondents in each age group and in aggregate did not elaborate on their answers. However, these results are difficult to interpret: while a positive response likely equates to a positive experience with the CC Promise, a negative response could potentially indicate either a negative experience or no experience at all. The feedback that was provided gives some insight into respondents’ answers. The top box on the next page provides selected feedback from respondents who answered that they trusted the CC Promise or knew someone who did.
About 30 comments (not reproduced here) indicated respondents believed the CC Promise due to the positive experiences of friends and family.
Among students who do attend CC, the quality of the professor-student relationship and the atmosphere were cited as positives in favor of the CC Promise.
Several comments were given with qualifications regarding specific improvements the respondents felt should be made.
All Ages All Ages % 16‐17 16‐17% 18‐24 18‐24% Over 24 Over 24%
Yes 126 50.20% 19 40.43% 88 48.89% 19 79.17%
No 125 49.80% 28 59.57% 92 51.11% 5 20.83%
All Ages All Ages %
No reason given 147 58.57%
Reason given 104 41.43%
Respondents Giving Reasons for Trust

June 2013 pg. 24
The box below provides selected feedback from respondents who answered that they did not trust the CC Promise or knew someone who did not.
Some respondents had specific complaints indicative of a one-time problem rather than a larger structural issue.
Other comments such as “I’ve never heard anything bad”’ and “no one I know goes there” seem to indicate people who have no experience with the CC Promise and therefore can’t answer whether they trust it or not.
Several other comments seem positive and incongruous with an indication of distrust.
Selected feedback from respondents who answered “yes”
“A friend of mine is considering going back to CC after leaving because they liked it.” “I left CC after taking two years of classes there, but it did help me decide what major to choose.” “It looked like one of my teachers was homeless and could have just rolled out from under the bridge.” “My boyfriend goes to CC. He has ADD and dyslexia and all the professors help him. It’s a good school. It’s
better than CC 5.” “My friends went there and said it’s easy to get along with the professors.” “CC professors were good, but the other students and the atmosphere they created wasn't good.” “I think your success is a personal goal and decision… it’s not something a college can promise, although
it’s not that they can’t help.” “It's a great school. I'd recommend it. It's a good place to start if you don't know what you want to do.” “I know people who went to CC and liked it, but then they had to transfer.” “CC and CC 2 are pretty much the same. My friend went to CC and got a good job.” “I’ve never heard anything bad about CC.” “It’s not a bad school other than parking and crowded classes.” “The CC Promise is why I’m thinking about going there, so I hope it’s credible!” Many other responses focusing on the respondents’ friends and their enthusiastic feedback about CC.
Selected feedback from respondents who answered “no”
“CC is a good starting point, but I don't necessarily believe this whole promise.” “CC is a good foundation, but I’d like to transfer to a larger university to finish my degree.” “It sounds like a good place.” “The counselors in financial aid are awful.” “There needs to be more emphasis on where you go after CC.” “The CC Promise means everyone can go there. It’s a welcoming and friendly school.” “I’ve never heard anything bad.” “No one I know goes there.” “People say it’s good.” “The professors are really helpful, and the advisors are always helpful.” Several “maybe” answers.