community attitudes towards emerging technology … · community attitudes towards emerging...
TRANSCRIPT

COMMUNITY ATTITUDES TOWARDS EMERGING TECHNOLOGY ISSUES - BIOTECHNOLOGY
REPORT OF FINDINGS
PREPARED FOR THE DEPARTMENT OF INDUSTRY, INNOVATION, SCIENCE,
RESEARCH AND TERTIARY EDUCATION
ISRI PROJECT 12-025766-01 DATE: JANUARY 2013

Acknowledgements
The Ipsos Social Research Institute would like to thank the Department for their help and assistance in the development of the project. We would also like to thank the members
of the public and the stakeholders who took part in this study without whose input, the research would not have not been possible.

Contents
Acknowledgements ............................................................................................ 2
Section 1 Executive Summary ............................................................................ 5 Background .......................................................................................... 5 Methodology .......................................................................................... 6 Key findings .......................................................................................... 6 Implications ........................................................................................ 11
Section 2 Research Context .............................................................................. 11 2.1 Background to project ......................................................................... 11 2.2 Research objectives ............................................................................ 12
Section 3 Research Design ............................................................................... 13 Overview of study ...................................................................................... 13 Questionnaire design phase – consultations and cognitive testing ...................... 13 Quantitative data collection .......................................................................... 13 Weighting ........................................................................................ 14 Reporting of statistical testing ...................................................................... 15 Conduct of the segmentation........................................................................ 15
Section 4 Respondent Profile ........................................................................... 16
Section 5 Segmentation of Attitudes ................................................................ 17 5.1 Segmentation overview ....................................................................... 17 5.2 Segmentation profiles.......................................................................... 19 5.3 Segmentation overview – key definers of each segment ........................... 27 5.4 Segmentation in detail ......................................................................... 28
Section 6 ‘Predictors’ of Attitudes .................................................................... 35
Section 7 Attitudes towards science & technology ........................................... 36
Section 8 Attitudes to the world around us ...................................................... 39
Section 9 Awareness and understanding of biotechnology ............................... 41 9.1 Awareness and understanding of biotechnology ....................................... 42 9.2 Awareness of specific biotechnology applications ..................................... 44
Section 10 Attitudes towards biotechnology .............................................. 60 10.1 General attitudes towards biotechnology ................................................ 60 10.2 Attitudes towards biotechnology issues .................................................. 65 10.3 Attitudes towards genetically modifying plants to produce food ................. 66 10.4 Attitudes towards growing GM crops in state ........................................... 70 10.5 Attitudes towards GM foods .................................................................. 74 10.6 Attitudes towards biotechnology applications in medicine and medical research ........................................................................................ 81 10.7 Attitudes towards using genetic modification in animals ............................ 86
Section 11 Attitudes towards regulatory bodies and key players ............... 87 11.1 Perceptions of rigorousness and compliance of GM regulation .................... 88 11.2 Organisations responsible for regulation of biotechnologies ....................... 92 11.3 Trust in organisations involved in biotechnologies .................................... 95
Section 12 Implications of the research ..................................................... 98

Appendices ................................................................................................. 99 Demographics ........................................................................................ 99 Questionnaires ...................................................................................... 105

Section 1 Executive Summary
Background
The Department and NETS PACE
The Department of Industry, Innovation, Science, Research and Tertiary Education
(DIISRTE) is a federal government department responsible for managing the National Enabling Technology Strategy (NETS). The NETS plays a key role in Public Awareness
and Community Engagement (PACE) with relation to enabling technologies such as biotechnology in Australia.
What is biotechnology?
‘Biotechnology’ is a term used to describe the use of biology in a range of fields from agriculture and pharmaceutical development to the production of genetically modified
organisms. Much of the more recent activity in biotechnology involves modifying the
genetic material of living things, or genetic engineering.
The need for research
Community attitudes are crucial to the development of the Australian biotechnology
sector. If Australians are not in favour of a particular technological application, research and development in this area will be constrained. In addition, public
attitudes help shape both industry uptake of emerging technologies and the underlying regulatory framework for them.
It is clear then that if community attitudes are assumed, not measured, a host of
potential benefits in fields ranging from medicine to textiles are likely to be missed, resulting in a lost opportunity for individuals, industry and the nation as a whole.
Over recent years, the Department has conducted a number of surveys canvassing community attitudes towards biotechnology. These studies have helped gauge the
state of Australian public awareness, identify knowledge gaps and track changes in awareness and attitudes over time. This study is the latest of these investigations.
Specifically, the objectives of this study were to:
Explore current attitudes towards general science and technology;
Explore the public’s awareness and understanding of specific biotechnology
issues;
Examine public attitudes towards biotechnology including specific applications
and controllers of the technology; and
Explore differences in awareness, perceptions and attitudes according to key
demographic variables such as age, gender, location, education, etc.)

Methodology
Questionnaire design phase – consultations and cognitive
testing
Stakeholder consultations were carried out to gather feedback from people involved in
different aspects of biotechnology including representatives from industry, government, peak bodies, scientists and social science practitioners to ensure that the
terms used throughout the questionnaire were still relevant and that the survey covered any new and emerging issues.
Cognitive testing of the survey instrument was then undertaken with four members of the public to test the logic and understanding of the terms used throughout the
survey. Feedback from both fed into the development of the final survey instrument.
Quantitative data collection
Two sets of quantitative data were collected – via computer aided telephone interviews (CATI) and via an online survey (both n=1000 each). Both samples were
independent and, with the exception of a series of ‘core’ questions asked of both, the surveys covered different topic areas.
The reason for utilising a mixed methodology approach was to ensure the study covered a sufficient breadth of topic areas within budget and without being overly
burdensome for survey participants. The final telephone questionnaire averaged 19 minutes in duration while the online survey was 15 minutes in length.
A stratified sampling approach was applied to produce samples that were broadly
representative of the population by age, gender, and geographic location. Post weighting was then applied to smooth the few remaining differences between the
sample and the age and gender profile of the 16-75 year old Australian population.
All fieldwork was undertaken between 15 October and 7 November inclusive.
Key findings
Segmentation
In order to investigate attitudinal groupings with regard to emerging technologies, a
segmentation was created. A cluster analysis of ratings to a series of statements
produced four distinct attitudinal groups. Two of the segments (Segments 1 and 2) were less positive toward science and technology, while two segments were more
positive. Each segment is profiled in more detail below.
Segment 1
Segment 1 was the least enthusiastic about the benefits science and technology. They had the highest agreement that ‘the pace of technological change is too fast to keep
up with’ and were the most likely to agree that ‘science and technology creates more problems than it solves’, that ‘scientific advances tend to benefit the rich more than
the poor’, and that ‘we rely too much on science and not enough on faith’.

Compared to the other segments, Segment 1 had the lowest opinion of GM and
biotechnologies in general, but also had the lowest reported awareness of the term biotechnology. This segment had the highest agreement that ‘people shouldn’t tamper
with nature’, that ‘everything in the world is connected’, and ‘we should use more
natural ways of farming’.
Those in Segment 1 were more likely to be female, aged 51-75 and to speak
languages other than English at home.
Segment 2
This segment tended to be less positive towards the benefits of science and technology generally, and biotechnology specifically. They were also more concerned
with related risks. However, in contrast to Segment 1, they had relatively high awareness of the term ‘biotechnology’ and various biotechnological applications. It
should be noted that even among this segment the majority felt that the benefits of
various applications of biotechnology outweighed the risks; however the ratio toward the positive was markedly smaller than that seen for Segments 3 and 4.
Segment 2 was the least likely to agree that ‘human activities have a significant impact on the planet’ (although agreement was relatively high for all segments).
Notably, this segment was least likely to agree that ‘not vaccinating children put others at risk’ – although they were also less likely to have children aged 10 and
under at home.
Segment 3
Segment 3 was defined by relatively high (although not the highest) interest in
science and agreement that ‘the benefits of science are greater than any harmful effects’. In relation to biotechnology, this segment was the second most positive.
While awareness of biotechnology was relatively high for Segment 3 they, like Segment 1, had relatively low levels of self-reported knowledge.
Another factor making Segment 3 distinct was the highest agreement that ‘children should be protected from all risks’. This group also had a greater proportion of
children under 10 at home.
Segment 4
This group was the most positive towards science and technology. They expressed
greater agreement that ‘everyone should all take an interest in science’, that ‘new technologies excite me more than they concern me’ and that ‘the benefits of science
are greater than any harmful effects’. Equally, there was disagreement that ‘science and technology creates more problems than it solves’ and that ‘we depend too much
on science and not enough on faith’.
Segment 4 were the most likely to think that the benefits outweighed the risks for all
the specific applications of biotechnology and were the most supportive of GM and other biotechnologies. Notably, Segment 4 that had the highest proportion of
respondents who believed they knew enough about biotechnology to explain it to a
friend.

Overall attitudes towards science & technology
Generally, there was a strong agreement that ‘science is such a big part of our lives
that everyone should take an interest’. There was also a high level of agreement that
‘new technologies excite me more than they concern me’, and that the ‘benefits of science are greater than any harmful effects’.
Agreement was mixed towards the idea that ‘scientific advances benefit the rich more than they do the poor’, that ‘technological change is happening is too fast to keep up
with’ and that we ‘depend too much on science and not enough on faith’. On average, females were more cautious in their attitudes towards advances in science and
technology as were older participants.
Attitudes to the world around us
The vast majority agreed strongly that ‘human activities have a significant impact on
the planet’, and that ‘not vaccinating children puts others at risk’. There was also
relatively strong agreement that ‘everything in the world is connected’ and ‘we should use more natural ways of farming’. Survey participants were more divided about
whether ‘people should not tamper with nature’ and that we ‘have the right to modify the environment to suit our needs’.
Again, females gave higher ratings, on average, to statements relating to the protection of nature and others. Older participants had higher average agreement
that ‘not vaccinating children puts others at risk’.
Awareness and understanding of biotechnology
Awareness of the term ‘biotechnology’ was high (more than eight in ten had heard the term) – a significant increase compared to the 2010 survey. Awareness was higher
still for specific biotechnology applications. More than nine in ten were aware of stem cell research and cloning of animals and just fewer than nine in ten were aware of
applications related to cloning of human embryos or GM. Awareness of all applications increased significantly compared to 2010.
While awareness of the term ‘biotechnology’ has increased compared to 2010, the majority of Australians (three in five) had low levels of knowledge, saying they had
‘heard of it but know very little or nothing about it’. Just under a quarter of
Australians (23%) believed they ‘know enough about [biotechnology] to explain it to a friend’. Almost twice as many males (30% compared to 16% for females) believed
they could explain biotechnology to a friend.
Australians in Segment 4 were more likely to believe they could explain biotechnology
to a friend. Those in Segment 2 had the lowest awareness of biotechnology and specific applications.
Awareness of GM and biotechnology in plants to produce food
Almost nine in ten Australians (87%) had heard of modifying genes in plants to produce food – a significant increase from when the survey was first conducted in
2007. Awareness was lower for specific types of genetic manipulation. Almost seven
in ten Australians said they had heard of modifying the genes of a plant by introducing genes from a different species of plant, and introducing genes from the

same species of plant (68% and 67% respectively). Just fewer than half (46%) were
aware of modifying the genes of plants by introducing the genes of a bacterium to a plant while a quarter (25%) said they were aware of modifying the genes of plants by
introducing the genes of an animal.
Compared to the 2010 survey, awareness of introducing the genes of a plant into a different species of plant had increased, while awareness of introducing the genes of
an animal into a plant had decreased. Again, self rated awareness of different types of genetic modification tended to be higher for males and those in Segment 4.
Just fewer than half (44%) of Australians thought that GM crops were allowed be grown in their state – a significant decrease compared to 2010 (54%). WA residents
were significantly more likely to think GM crops were allowed in their state. The GM crops most commonly mentioned were canola (41%) and wheat (22%).
There was a high degree of uncertainty with regard to the prevalence of GM foods and
crops in Australia. More than half (55%) of Australians said that did not know whether ‘most of the cotton grown in Australia is genetically modified’ and just greater than
one third (36%) said they did not know whether ‘most of the fruit and vegetables grown in Australia were genetically modified’.
However, almost three in ten (29%) believed that ‘most of the processed foods in Australian supermarkets contain GM ingredients’. Segment 4 respondents were most
likely to think that GM foods and crops were not prevalent in Australia.
Awareness of biotechnology in medicine and medical research
Awareness of the use of genetic information and stem cells for medical purposes were very high (89% and 95% had heard of these uses respectively). Awareness of the use
of genetic information in medical research in general has increased from 81% in 2010.
Younger respondents were less likely to have heard of the use of stem cells for medical purposes both in the general sense and specifically related to embryonic and
non-embryonic stem cells. Awareness of the use of genetic information and stem cells for medical research and to treat disease also tended to be lower for Segment 2
respondents who had a lower level of awareness compared to others.
Awareness of use of genetic modification in animals
Awareness of the two methods of using GM in animals that were covered in the survey has changed significantly compared to previous surveys. Awareness of using
genetic modification to grow human tissue or organs in animals for human transplants increased from 54% in 2010 to 80% in 2012. Awareness of using GM in introduced
pests to decrease their numbers has decreased compared to 2007 (73% vs. 83% in 2007).
NSW and Queensland participants were more likely to have heard of the latter use of GM (77% and 79% respectively), while Victorians and South Australians were less
likely to have done so (64% and 58%).

General attitudes towards biotechnology
Overall, support for GM and other biotechnologies was moderate (mean 6.1 out of ten
on average). Not surprisingly in the context of the results outlined above, males and
those in Segments 3 and 4 were more likely to be supportive of GM and other biotechnologies. Younger respondents and those who lived in capital cities were also
more likely to indicate a higher level of support.
There was an overwhelming belief that stem cell research would improve our way of
life in the future (90% reported they thought so). Respondents generally thought that ‘biotechnology’ would also improve our way of life in the future (64%). While a
relatively large minority (32%) said they ‘did not know’ what impact biotechnology would have on our future, a small proportion (3%) said that biotechnology would
make things worse in the future. Sentiments towards cloning, especially of human
embryos, was negatively skewed with a greater proportion indicating that it would make things worse rather than improve things in the future.
There were high levels of agreement that ‘commercial use of genetic modification and its products should only be allowed after regulatory approval’ (average of 7.3 out of
10); ‘the Australian government should enable the community to participate more in decisions on biotechnology issues including regulation’ (an average of 7.2), and
‘privacy laws should prevent governments and other organisations from accessing information on people’s genetic make-up’ (an average of 7.1).
Attitudes towards GM foods
Respondents were asked to rate the how much they valued a number of common
objectives of genetically modifying food. The objective that were most likely to be valued was making food was healthier. Females, younger respondents, and Segment
4 were all significantly more likely to value making food healthier, cheaper, last longer and taste better. Segment 1 was the segment least likely to value any of the
objectives of genetically modifying food.
While there was a high willingness to eat organic food, the willingness to eat food that
had some form of scientific intervention was significantly lower. Willingness to eat was lowest for meat and other products that came from genetically modified or cloned
animals (or their offspring).
Females were much more cautious about what they would ingest. Those with higher levels of support for biotechnology or who believed biotechnology would ‘improve our
way of life in the future’ were more willing to eat all food types covered in the survey.
Attitudes towards biotechnology applications in medicine and
medical research
Survey participants tended to be more accepting that benefits outweighed risks when
considering medical applications of biotechnology when compared to their views on GM and biotechnology use in food production. Applications with the most positive
ratings (in terms of benefits outweighing risks were in the ‘study of human disease in
the laboratory’ and ‘in medical research to design vaccines against new or existing diseases’.

Attitudes towards using genetic modification in animals
Attitudes towards the two uses of GM in animals was lower compared to the medical
applications of using genetic information and stem cells, however a greater proportion
saw the benefits outweighing the risks.
Attitudes toward regulatory bodies and key players
There was moderate agreement (mean 6.1 out of ten) that ‘regulations on the use of
GM in agriculture and food production are sufficiently rigorous’. Similar levels of agreement were seen in terms of compliance with regulations. Males were more
confident that regulations in agriculture and food production were sufficiently rigorous, though no gender differences were found in terms of compliance. Segment 4
was significantly more confident in both the rigorousness of regulation and the degree of compliance, while Segment 1 was significantly less confident.
There was greater confidence in terms of regulation and compliance of GM in medical
research (mean 7.0 and 7.5 out of 10 respectively). Again, Segment 4 was more confident, while Segment’s 1 and 2 were less confident.
Unprompted, respondents were mostly unable to name who regulated GM and other biotechnologies in Australia. When prompted, awareness was highest for Food
Standards Australia New Zealand (FSANZ) (61% aware), followed by the Therapeutic Goods Administrator (TGA) (56%).
Levels of trust in what organisations had to say about the risks and benefits of biotechnology tended to be slightly lower than levels of trust in the organisations
more generally. Among those who were aware of the organisations, trust was highest
among those who were aware of National Health and Medical Research Council (NH&MRC).
Implications
As segmentation analysis clearly shows, distinct attitudinal groupings exist
within the community each with differing appetites for information about science and technology, and biotechnology in particular. .
As Segment 1 typifies, there appears to be a link between low levels of awareness of biotechnology and rejection (or at least relatively weak
acceptance) of specific biotechnological applications.
Males are consistently more positive with regard to biotechnology and specific applications.
Section 2 Research Context
2.1 Background to project
The Department of Innovation, Industry, Science and Research
The Department of Industry, Innovation, Science, Research and Tertiary Education
(DIISRTE) is a federal government department which is responsible for managing the

National Enabling Technology Strategy (NETS). Among other areas, the NETS has a
key role to play in Public Awareness and Community Engagement related to enabling technologies such as biotechnology and nanotechnology in Australia.
The growth of biotechnology
Biotechnology is generally used to describe the use of biology in agriculture,
managing environmental concerns, and pharmaceutical development. It also refers to the production of GMOs and the manufacture of products from them. Much of the
newer activity in biotechnology involves directly modifying the genetic material of living things, referred to as recombinant DNA technology or genetic engineering.
Other types of biotechnology include using enzymes and bacteria in applications such as waste management, industrial and food production, and remediation of
contaminated land. The largest sub-sector of biotechnology companies in Australia
(48% of the sector) are involved in human therapeutics, including both pharmaceutical development and medical procedures. Other major sub-sectors are
agricultural applications (16% of Australian biotech companies) and diagnostics (13%)1.
Importance of community attitudes
Community attitudes are crucial to the development of the Australian biotechnology sector. If Australians are not in favour of certain technological applications, efforts by
scientists on R&D will be constricted. In addition, public attitudes help shape the regulatory framework and the degree of industry uptake. If community attitudes are
assumed not measured, a host of potential benefits in fields ranging from medicine to
food to textiles are likely to be lost, representing a lost opportunity for individuals, industry and the nation in general.
The need for research
Over recent years, the Department has conducted a number of surveys of community attitudes towards biotechnology. These studies have helped gauge the state of
Australian public awareness, identify knowledge gaps and track changes in awareness and attitudes over time. This research commissioned by the Department sought to
revisit community attitudes towards emerging technology in particular biotechnology
and its applications to monitor any changes in attitudes and awareness. The research findings will be used to help the Department to develop strategies to engage with the
community on these issues including increasing public awareness related to developments in emerging technologies.
2.2 Research objectives
Specifically, the research objectives will be to:
Explore current attitudes towards general science and technology;
Explore the public’s awareness and understanding of specific biotechnology
issues;
1 Biotech Business Indicators, May 2009 issue. Accessed 13 October 2009.

Examine public attitudes towards biotechnology including specific applications
and controllers of the technology; and
Explore differences in awareness, perceptions and attitudes according to key
demographic variables such as age, gender, location, education, etc.).
Section 3 Research Design
Overview of study
To meet these objectives, a multi-stage quantitative-qualitative methodology was
undertaken, as illustrated in the following table:
Questionnaire design
and testing
4 industry/stakeholder
consultation sessions (13 participants in total)
Ensure factual accuracy
Cognitive testing with members
of the public (4 interviews)
Test survey constructs and
terminology
Quantitative survey 1000 - 19min CATI interviews Measure awareness, perceptions
and attitudes
1000 – 15min online surveys
(covering biotechnology and nanotechnology issues)
Develop segmentation of
community on attitudes towards emerging technologies
Questionnaire design phase – consultations and
cognitive testing
Stakeholder consultations were carried out to gather feedback from people involved in
different aspects of biotechnology including representatives from industry, government, peak bodies, scientists and social science practitioners to ensure that the
terms used throughout the questionnaire were still relevant and that the survey covered any new and emerging issues.
Cognitive testing of the survey instrument was also undertaken with 4 members of
the public to test the logic and understanding of the terms used throughout the survey. Feedback from both fed towards the development of the final survey
instrument.
The cognitive testing found it was important to provide respondents a ‘don’t know’
option - particularly if they were not highly informed about technology issues. Interviewers were briefed to let respondents know that ‘don’t know’ was a valid
answer. The cognitive testing also resulted in using more consistent scales within the survey and simplification of the definitions used.
Quantitative data collection
Two sets of quantitative data were collected – via telephone (CATI) and via online (both n=1000 each). While in the past, the telephone and online surveys contained
the same questionnaire in parallel, the purpose of the online survey was to supplement the main telephone survey with additional questions that budget and time
constraints meant could not be covered over the phone. Both samples were

independent. The telephone questionnaire averaged 19 minutes in duration; the
online survey was 15 minutes in length.
The telephone sample was recruited from randomly selected telephone numbers from
Sample Pages. In this iteration of the survey, with only 82% of Australian households
reporting they had a landline at home2, 20% of this survey’s sample was drawn from mobile numbers to capture some of the views of mobile only households. The mobile
sample was stratified by location at the metropolitan and regional level.
The landline sample was stratified by location (nationally by state/territory and, within
these, by rural/regional/metropolitan areas) in such a way that the sample was in proportion to the population. In addition, within each location stratum, broad age and
gender quotas were applied, again proportional to the population.
For the online survey, samples were sourced from an online panel, that is, individuals
who have opted to receive email invitations to participate in surveys from our
fieldwork subsidiary. Stratification and quota sampling of invitations to participate occurred as per the telephone methodology.
The fieldwork was undertaken between 15 October and 7 November inclusive.
Weighting
A weighting scheme was created and applied to the entire sample to ensure the data was representative of Australians aged 16-75. While at the overall level, the sample
was stratified for location; those aged under 30 were slightly underrepresented in the sample. Age and gender quotas were not set for the mobile sample. The following
table compares the unweighted sample to the weighted sample to the overall
population.
Table 1: Unweighted vs. weighted populations
Unweighted Weighted to the Australian
population aged 16-75
CATI Online CATI Online
Gender
Male 51 49 50 50
Female 49 51 50 50
Age
16-30 years 23 23 28 28
31-50 years 40 40 38 38
51-75 years 37 37 34 34
2 Australian Communications and Media Authority, (2012), Convergence and Communications - Report 1: Australian household consumers’ take-up and use of
voice communications services

With the exception of the demographics in the appendix, the research results
presented in this report has been weighted to be representative of the Australians aged 16-75 rather than just those who completed the survey.
Reporting of statistical testing
Tests of significance were conducted between key population characteristic such as age, gender, employment status and capital vs. non-capital locations. These were
conducted at the 95% level of confidence and are reported where appropriate.
A sample of n=1000 enables us to be 95% confident that at the overall level, a
feature of the population aged 16-75 we are testing is within a range of ±3.1% of what the survey tells us. For example, this means that if we find that 50% of
respondents said they thought that GM crops were grown in their state, we can be 95% confident that between 53.1% and 46.9% of the population represented by the
sample actually did this.
A ‘significant difference’ means we can be 95% confident the difference observed between the two samples reflects a true difference in the population of interest, and is
not a result of chance. Such descriptions are not value judgements on the importance of the difference. The reader is encouraged to make a judgement as to whether the
differences are ‘meaningful’ or not.
Where significance testing has occurred between pairs such as male vs. female this
has been undertaken as an independent samples tests. However, where significance testing has occurred between more than two categories within a group e.g.
employment status, the significance testing used tests one category against the
average of the others that are not in that category combined. Such a test is ideal for multiple comparisons as it reduces the likelihood of displaying a significant difference
where one does not exist.
Statistically significant differences within tables are displayed by green (9) and red
figures/arrows (2). Green figures indicate the figure reported is statistically higher;
red indicate the figure is statistically lower.
Where the scale and question wording have allowed, comparisons have been
made to the equivalent survey conducted in 2010 with those from the landline sample aged 18-75.
Only significant differences have been reported throughout this document.
Conduct of the segmentation
A segmentation of CATI respondents was conducted using the bank of 14 statements
relating to values, beliefs and attitudes towards science and technology in general as well as the world around us.
The method used to categorise participants into segments was the non-hierarchical method called K-means (K-means works better on large sample and seeks clouds of
points/participants within the continuum of all attitudes measured). The segments were identified using standardized ratings rather than actual ratings to limit the effect
of how participants used the range of values on the scale on to the definition of segments.

The number of segments was selected on the basis of:
The change in sum of squares as the number of segments increases.
The internal consistency of the segments (no conflicting attitudes, at least one
specific attitude for each identified segment).
A linear discriminant analysis was then conducted to then categorise the online respondents into the four existing segments based on the pattern of their responses
to the same statements.
Section 4 Respondent Profile
The following table provides an overview of the key characteristics of the respondents
to the survey. After weighting the data to be representative of the Australian population aged 16-75 for age and gender, between the two methods there were still
some slight differences in terms of employment status with a lower proportion of
respondents who were employed in the online survey (55% vs. 62% for the telephone survey) and a higher proportion responsible for home duties among the online
respondents (5% vs. 11%). A higher proportion of students took part in the telephone survey than in the online survey (13% vs. 8%). The online survey also included a
higher proportion of those with an ATSI background (5% vs. 2%) and a lower proportion of those who spoke a language other than English at home (11% vs. 5%).
Both surveys were largely independent in terms of content so results for the online and telephone surveys have been reported separately.
Table 2. Key demographic characteristics by data collection mode
Column % Telephone
(n=1000)
Online
(n=1000)
Gender Male 50 50
Female 50 50
Age 16- 30 years 28 28
31- 50 years 38 38
51 – 75 years 34 34
Employment Employed (PT/FT/Self) 62 55
Retired or Pensioner 16 18
Home duties 5 11
Student 13 8
Unemployed 3 5
ATSI background Yes 2 5
Language other than English
spoken at home
Yes 16 11
Children under 10 at home Yes 27 28
Capital city vs. non-capital Capital city 67 67

Column % Telephone (n=1000)
Online (n=1000)
city Rest of state/territory 33 33
Filter: 2012 only; Weighted to population
Indicates statistically significant difference compared to those not in that category
Section 5 Segmentation of Attitudes
5.1 Segmentation overview
In the 2012 survey, a series of statements relating to science and technology and the
world around us were included to investigate whether groupings exist in the community regarding attitudes towards emerging technologies. An attitudinal
segmentation using a cluster analysis of these statements was conducted. The statements included in the segmentation were:
Technological change happens too fast for me to keep up with it
Science and technology creates more problems than it solves
We depend too much on science and not enough on faith
New technologies excite me more than they concern me
Science is such a big part of our lives that we should all take an interest
The benefits of science are greater than any harmful effect
Scientific advances tend to benefit the rich more than they benefit the poor
We should use more natural ways of farming
People have the right to modify the natural environment to suit their needs
Human activities have a significant impact on the planet
People shouldn’t tamper with nature
I believe that everything in the world is connected
Not vaccinating children puts others at risk
Children must be protected from all risks
The order of which the statements were presented to respondents was randomised and respondents were asked the degree to which they agreed or disagreed to each.
Further details of how the segmentation was conducted, has been included in Section 3 - Research Design.
The segmentation analysis resulted in four segments. The results from the CATI survey form the basis of the findings from the segmentation. However, there was a

difference in the distribution of the segments across the telephone and online data
collection modes. The distribution of the segments is shown in Figure 1.
Figure 1: Distribution of Segments
Weighted; Base
Note: Does not include n=12 that were not able to be classified in the statements due to a lack of
variability in their responses.
Figure 1 shows that the online sample had a lower proportion of respondents
categorised in Segment 4 (the segment that was found to be most positive about the benefits science and technology) and a slightly higher proportion of respondents in
Segment 2 (found to be more negative about science and technology with a lower level of awareness of biotechnology).
The following section outlines in brief, the characteristics that define each segment. This is followed by a detailed discussion of each segment including differences in
attitudes and demographic characteristics. It should be noted the following
results relating to the segmentation are based on the main survey – that is the telephone survey results.
Note on understanding segment variations.
It is important to note when looking at the following segmentation results that, while a particular segment may be more likely or less likely to have agreed or disagreed
with a particular statement, this would be compared to the average (mean) response for all the other segments combined - thus comparing for example Segment 1 to
those not in that segment. It should also be noted that this mean value may be quite
high overall. Therefore, even if a segment is the ‘least’ likely to agree with a particular statement, their response may still be quite high but lowest relative to the other
scores, as the example below shows:

Figure 2. Example of variation of attitudes among segments (ratings of ‘the
benefits of science are greater than any harmful effect)
Note: Not to scale
5.2 Segmentation profiles
Overall
The segmentation categorised participants into four distinct groups based on their
attitudes towards science and technology and the world around us. Two of the segments (Segment 3 and Segment 4) were found to be relatively more positive
towards science in general with Segment 4, the more ‘pro-science’ of the two. Segment 1 and 2 showed relatively lower support towards science and technology.
Table 3 and Table 4 show the variability of the ratings provided for each attitudinal statement that was included in the segmentation analysis. Table 5 shows the
demographic differences that were apparent between the segments.
Table 3 shows that the statements regarding science and technology where there was the greatest variance between segments were:
We depend too much on science and not enough on faith.
Science and technology creates more problems than it solves.
Technological change happens too fast for me to keep up with it.
Scientific advances tend to benefit the rich more than they benefit the poor.

Of the statements relating to the world around us the variance in ratings were
greatest for:
Children must be protected from all risks; and
People shouldn’t tamper with nature.
Table 3: Attitudes towards science and technology by segment
Average out of 10 (Disagree/agree
scale)
Segment
1
Segment
2
Segment
3
Segment
4
Total
n=214 n=225 n=250 n=168 n=957
Science is such a big part of our lives
that we should all take an interest 7.6 7.4 8.3 9.0 8.1
New technologies excite me more than they concern me
5.6 5.6 7.0 8.4 6.7
The benefits of science are greater than
any harmful effect 5.7 4.9 6.3 6.7 5.9
Technological change happens too fast
for me to keep up with it 7.9 5.7 5.5 3.1 5.5
Scientific advances tend to benefit the
rich more than they benefit the poor 7.1 5.3 4.3 2.8 4.8
We depend too much on science and not enough on faith
6.9 4.2 3.8 1.3 3.9
Science and technology creates more
problems than it solves 6.1 4.0 3.2 1.3 3.6
Q1c For the following statements, can you please tell me how much you disagree or agree on a scale of 0
to 10, where 0 is strongly disagree and 10 is strongly agree. If you can’t say or don’t know, just say so.
Note: Means exclude “don’t know” responses
Filter: 2012 ONLY AND CATI ONLY; Weighted to population; base n = from 957 to 996; Total n = 1000
Indicates statistically significant difference compared to those not in that category
Table 4: Attitudes towards the world around us by segment
Average out of 10 (Disagree/agree
scale)
Segment
1
Segment
2
Segment
3
Segment
4
Total
n=230 n=223 n=256 n=153 n=937
Human activities have a significant
impact on the planet 8.9 8.4 9.0 8.7 8.8
Not vaccinating children puts others at risk
8.7 7.6 8.5 9.0 8.4
I believe that everything in the world is
connected 8.0 7.6 8.0 6.8 7.6
We should use more natural ways of
farming 8.8 7.6 7.9 6.0 7.6
Children must be protected from all
risks 8.5 3.4 9.1 4.7 6.5
People shouldn’t tamper with nature 8.0 5.5 5.4 3.0 5.4

Average out of 10 (Disagree/agree scale)
Segment 1
Segment 2
Segment 3
Segment 4
Total
n=230 n=223 n=256 n=153 n=937
People have the right to modify the
natural environment to suit their needs 3.5 4.0 5.0 5.5 4.5
Q1c For the following statements, can you please tell me how much you disagree or agree on a scale of 0
to 10, where 0 is strongly disagree and 10 is strongly agree. If you can’t say or don’t know, just say so.
Note: Means exclude “don’t know” responses
Filter: 2012 ONLY AND CATI ONLY; Weighted to population; base n = from 937 to 997; Total n = 1000
Indicates statistically significant difference compared to those not in that category
Table 5. Segments’ key demographic characteristics
Column % Segment
1
Segment
2
Segment
3
Segment
4
Total
n=219 n=245 n=298 n=237 n=999
Gender Male 41 45 45 68 50
Female 59 55 55 32 50
Age 16- 30 years 24 29 26 33 28
31- 50 years 33 36 41 41 38
51 – 75 years 43 35 33 26 34
Employment Employed (PT/FT/Self) 54 62 65 68 62
Retired or Pensioner 23 16 16 8 16
Home duties 6 6 6 4 5
Student 12 12 10 18 13
Unemployed 3 3 2 2 3
ATSI background Yes 2 3 2 2 2
Language other than
English spoken at home
Yes 25 8 20 11 16
Children under 10 at
home
Yes 29 21 29 30 27
Capital city vs. non-capital city
Capital city 64 68 67 70 67
Rest of state/territory 36 32 33 30 33
Note: Excludes n=1 that were not able to be classified in the statements due to a lack of variability in their
responses.
Filter: 2012 only AND CATI only; Weighted to population
Indicates statistically significant difference compared to those not in that category
It is clear there were two segments that were less positive towards science (Segment
1 and 2) and two segments that were relatively more positive about science and
technology (Segment 3 and 4) and this is reflected in their attitudes towards the future implications of biotechnology specifically. Figure 2 shows the level of support
for the use of GM and other biotechnologies. However, in line with sentiments towards science and technology, on a scale of 0 to 10 where 0 was completely unsupportive
and 10 was completely supportive, Segment 3 and 4 provided the highest average

scores on how they felt about the use of GM and other biotechnologies (6.4 and 7.7
out of 10 respectively). Segment 1 provided the lowest average score (4.7 out of 10). Segment 2’s average rating was 5.4 out of 10.
Figure 2: Support for use of GM and other biotechnologies by segment
Q16bi How would you rate your level of support for the use of GM or genetic modification and other
biotechnologies?
Filter: 2012 ONLY AND CATI ONLY; Weighted to population; base n = 936; Total n = 1000
Note: Excludes don’t know responses
Indicates statistically significant difference compared to those not in that category
Further investigation showed that where the segments differed markedly was in terms of their awareness of biotechnology (See Figure 3 and Table 6), although this
measure was not included in the segmentation. It is the level of awareness that helps to further define the profile of each of the segments, particularly how the pairs of
segments that were more positive towards science and less positive towards science differed from each other.

Figure 3: Reported awareness of the term biotechnology by segment
Q1a Whether heard of Biotechnology by SEGMENT
Filter: 2012 ONLY AND CATI ONLY; Weighted to population; base n = 999; Total n = 1000
Indicates statistically significant difference compared to those not in that category
Table 6: Reported awareness of different categories of biotechnologies by
segment (% aware)
Column % Segment 1 Segment 2 Segment 3 Segment 4 Total
n=219 n=245 n=298 n=237 n=999
Stem cell research 92 95 94 98 95
Cloning of animals 88 94 94 99 94
Cloning human embryos 84 90 87 96 89
Genetic modification 78 89 88 97 88
Biotechnology 75 83 82 94 84
Q1a Whether heard of (Yes)
Filter: 2012 ONLY AND CATI ONLY; Weighted to population; base n = 999; Total n = 1000
Indicates statistically significant difference compared to those not in that category
The perceptions of risks vs. benefits for different applications of GM or biotechnology
also differed by segment. The following two tables show the proportion of those who felt the benefits outweighed the risk and those who felt the risks outweighed the
benefits for each segment. In addition, although not shown in the tables, Segment 2
tended to have a higher proportion who were not sure of the balance with significantly more respondents who were confident in their answer (i.e. fewer who responded
‘don’t know’) in Segment 4.

Table 7: Proportion reporting that benefits outweigh the risks for
biotechnology applications
Column % Segment 1
Segment 2
Segment 3
Segment 4
Total
Modifying the genes of plants to produce food
Modifying the genes of plants to produce food 28 39 54 73 49
Modifying the genes of plants to produce food by
introducing the genes of a plant of the same species
44 49 61 81 59
Modifying the genes of plants to produce food by
introducing the genes of a plant of a different species
25 29 37 59 38
Modifying the genes of plants to produce food by introducing the genes of an animal to a plant
3 9 10 28 12
Modifying the genes of plants to produce food by
introducing the genes of a bacterium to a plant 16 18 25 44 26
Using biotechnology in the production of food
from plants
Using biotechnology in the production of food from
plants 31 45 53 78 51
Using biotechnology in the production of food from
plants by changing the genes of a plant without introducing new DNA
22 40 40 66 42
Using biotechnology in the production of food from plants to assist in conventional breeding
24 42 46 68 45
Using genetic information in medical
research
Using genetic information in medical research 62 68 81 92 76
Using genetic information in medical research to
study a human disease in the laboratory 76 83 88 95 86
Using genetic information in medical research from plants to study a human disease in animals
51 57 68 86 66
Using genetic information in medical research to
design vaccines against new or existing diseases 76 80 87 94 85
Using genetic information in medical research from
plants to tailor a person’s healthcare based on their genetic make-up
57 54 62 72 61
Using stem cells to conduct medical research
and treat disease
Using stem cells to conduct medical research and treat disease
64 70 88 93 80
Using stem cells to conduct medical research and
treat disease using non-embryonic, cord or adult stem cells
47 63 69 84 66
Using stem cells to conduct medical research and
treat disease using embryonic stem cells 46 56 69 73 62

Column % Segment 1
Segment 2
Segment 3
Segment 4
Total
Using genetic modification to grow human
tissue or organs in animals for human transplants
Using genetic modification to grow human tissue
or organs in animals for human transplants 38 42 56 74 54
Using genetic modification of introduced
pests to reduce their numbers
Using genetic modification of introduced pests to reduce their numbers
36 43 51 65 50
Q2ci Benefits/Risks (Risks outweigh the benefits)
Filter: 2012 ONLY AND CATI ONLY; Weighted to population; base n = from 73 to 601; Total n = 1000
Indicates statistically significant difference compared to those not in that category
Table 8: Proportion showing risks outweigh the risks for applications of biotechnology
Column % Segment
1
Segment
2
Segment
3
Segment
4
Total
Modifying the genes of plants to produce food
modifying the genes of plants to produce food 31 21 13 5 17
modifying the genes of plants to produce food by
introducing the genes of a plant of the same species
14 12 5 2 8
modifying the genes of plants to produce food by
introducing the genes of a plant of a different species
32 22 16 4 19
modifying the genes of plants to produce food by
introducing the genes of an animal to a plant 65 47 46 19 44
modifying the genes of plants to produce food by
introducing the genes of a bacterium to a plant 49 33 22 6 27
Using biotechnology in the production of food from plants
using biotechnology in the production of food from
plants 21 13 6 5 11
using biotechnology in the production of food from
plants by changing the genes of a plant without introducing new DNA
27 15 11 5 14
using biotechnology in the production of food from
plants to assist in conventional breeding 28 16 10 2 14
Using genetic information in medical research
Using genetic information in medical research 8 6 2 0 4
Using genetic information in medical research to
study a human disease in the laboratory 6 5 2 1 3
Using genetic information in medical research from
plants to study a human disease in animals 16 12 8 3 9

Column % Segment 1
Segment 2
Segment 3
Segment 4
Total
Using genetic information in medical research to
design vaccines against new or existing diseases 4 5 3 1 3
Using genetic information in medical research from
plants to tailor a person’s healthcare based on their genetic make-up
9 16 11 8 11
Using stem cells to conduct medical research
and treat disease
Using stem cells to conduct medical research and treat disease
7 4 3 1 3
Using stem cells to conduct medical research and
treat disease using non-embryonic, cord or adult stem cells
11 4 2 1 4
Using stem cells to conduct medical research and
treat disease using embryonic stem cells 13 16 5 6 10
Using genetic modification to grow human
tissue or organs in animals for human transplants
Using genetic modification to grow human tissue
or organs in animals for human transplants 35 24 16 6 19
Using genetic modification of introduced pests to reduce their numbers
Using genetic modification of introduced pests to
reduce their numbers 29 24 18 7 19
Q2ci Benefits/Risks (Risks outweigh the benefits)
Filter: 2012 ONLY AND CATI ONLY; Weighted to population; base n = from 73 to 601; Total n = 1000
Indicates statistically significant difference compared to those not in that category
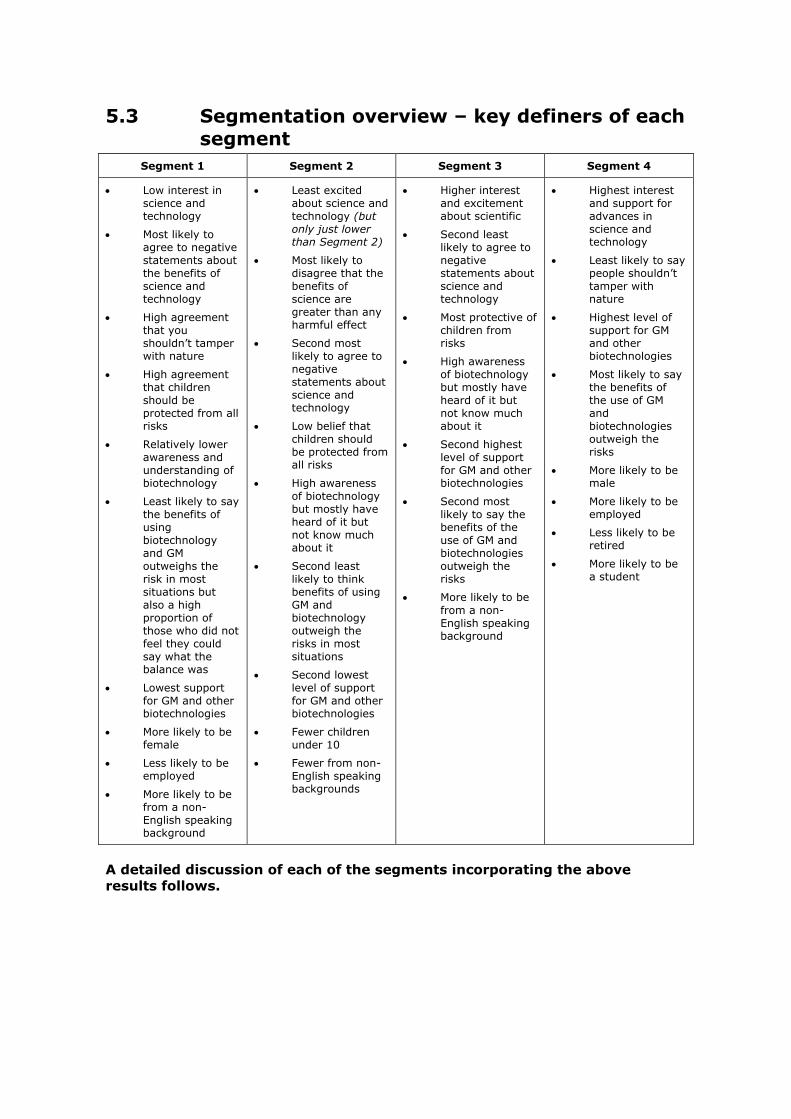
5.3 Segmentation overview – key definers of each
segment
Segment 1 Segment 2 Segment 3 Segment 4
Low interest in
science and technology
Most likely to
agree to negative
statements about
the benefits of
science and technology
High agreement
that you
shouldn’t tamper with nature
High agreement
that children
should be
protected from all risks
Relatively lower
awareness and
understanding of biotechnology
Least likely to say
the benefits of
using
biotechnology
and GM
outweighs the
risk in most
situations but
also a high
proportion of
those who did not
feel they could
say what the balance was
Lowest support
for GM and other biotechnologies
More likely to be female
Less likely to be employed
More likely to be
from a non-
English speaking background
Least excited
about science and
technology (but
only just lower than Segment 2)
Most likely to
disagree that the
benefits of
science are
greater than any harmful effect
Second most
likely to agree to
negative
statements about
science and technology
Low belief that
children should
be protected from all risks
High awareness
of biotechnology
but mostly have
heard of it but
not know much about it
Second least
likely to think
benefits of using
GM and
biotechnology
outweigh the
risks in most situations
Second lowest
level of support
for GM and other biotechnologies
Fewer children under 10
Fewer from non-
English speaking backgrounds
Higher interest
and excitement about scientific
Second least
likely to agree to
negative
statements about
science and technology
Most protective of
children from risks
High awareness
of biotechnology
but mostly have
heard of it but
not know much about it
Second highest
level of support
for GM and other biotechnologies
Second most
likely to say the
benefits of the
use of GM and
biotechnologies
outweigh the risks
More likely to be
from a non-
English speaking background
Highest interest
and support for
advances in
science and technology
Least likely to say
people shouldn’t
tamper with nature
Highest level of
support for GM
and other biotechnologies
Most likely to say
the benefits of
the use of GM
and
biotechnologies
outweigh the risks
More likely to be male
More likely to be employed
Less likely to be retired
More likely to be a student
A detailed discussion of each of the segments incorporating the above
results follows.
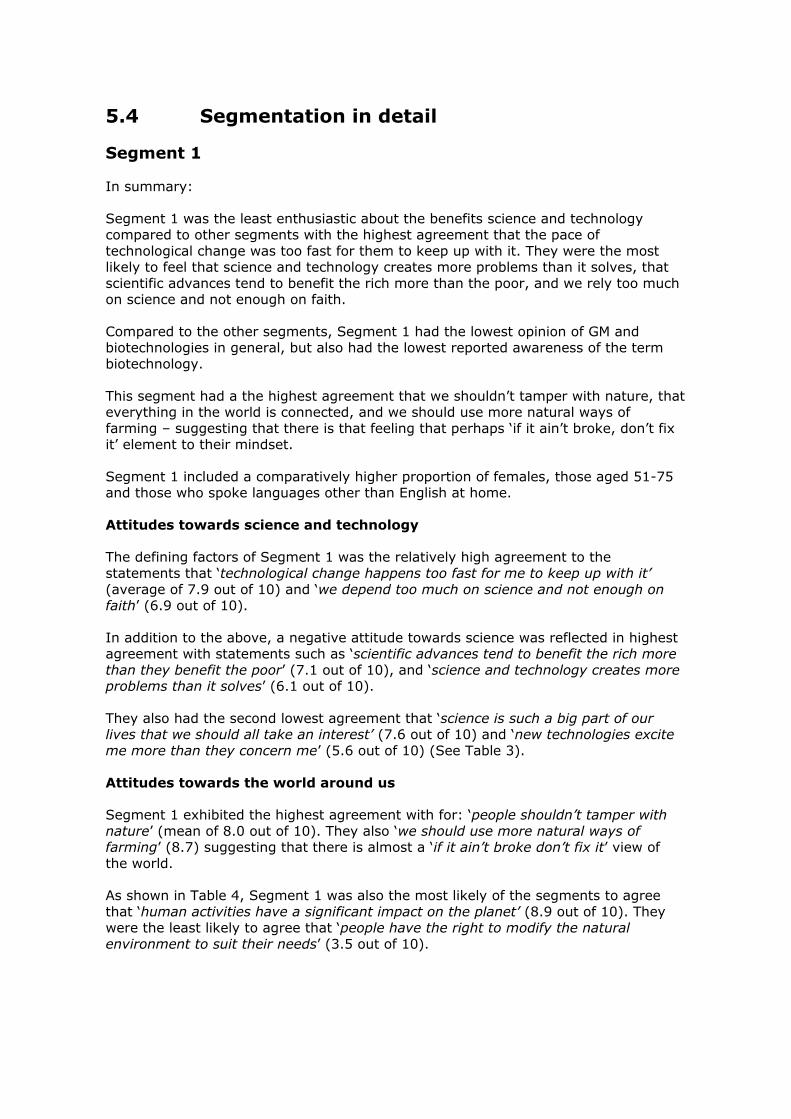
5.4 Segmentation in detail
Segment 1
In summary:
Segment 1 was the least enthusiastic about the benefits science and technology compared to other segments with the highest agreement that the pace of
technological change was too fast for them to keep up with it. They were the most likely to feel that science and technology creates more problems than it solves, that
scientific advances tend to benefit the rich more than the poor, and we rely too much on science and not enough on faith.
Compared to the other segments, Segment 1 had the lowest opinion of GM and biotechnologies in general, but also had the lowest reported awareness of the term
biotechnology.
This segment had a the highest agreement that we shouldn’t tamper with nature, that everything in the world is connected, and we should use more natural ways of
farming – suggesting that there is that feeling that perhaps ‘if it ain’t broke, don’t fix it’ element to their mindset.
Segment 1 included a comparatively higher proportion of females, those aged 51-75 and those who spoke languages other than English at home.
Attitudes towards science and technology
The defining factors of Segment 1 was the relatively high agreement to the
statements that ‘technological change happens too fast for me to keep up with it’
(average of 7.9 out of 10) and ‘we depend too much on science and not enough on faith’ (6.9 out of 10).
In addition to the above, a negative attitude towards science was reflected in highest agreement with statements such as ‘scientific advances tend to benefit the rich more
than they benefit the poor’ (7.1 out of 10), and ‘science and technology creates more problems than it solves’ (6.1 out of 10).
They also had the second lowest agreement that ‘science is such a big part of our lives that we should all take an interest’ (7.6 out of 10) and ‘new technologies excite
me more than they concern me’ (5.6 out of 10) (See Table 3).
Attitudes towards the world around us
Segment 1 exhibited the highest agreement with for: ‘people shouldn’t tamper with
nature’ (mean of 8.0 out of 10). They also ‘we should use more natural ways of farming’ (8.7) suggesting that there is almost a ‘if it ain’t broke don’t fix it’ view of
the world.
As shown in Table 4, Segment 1 was also the most likely of the segments to agree
that ‘human activities have a significant impact on the planet’ (8.9 out of 10). They were the least likely to agree that ‘people have the right to modify the natural
environment to suit their needs’ (3.5 out of 10).

Another defining characteristic showing their more conservative views is a relatively
high agreement that ‘children must be protected from all risks’ (8.5 out of 10 – second highest) and ‘not vaccinating children puts others at risk’ (8.7 out of 10 – also
second highest).
Perceptions and awareness of biotechnology
Segment 1 rated their support for GM and other biotechnologies 4.7 out of 10. This
was the lowest average score of the segments where scores ranged from 5.4-7.7 out of 10.
We find there was a significantly lower level of awareness of biotechnology among Segment 1 members - 75% reporting they had heard of the term. This includes only
12% who knew enough that they could explain it to a friend and one in five could not say how much they knew about it (22%) (See Figure 3). Reported awareness of the
different categories of biotechnology was also the lowest in Segment 1 (See Table 6).
This tells us that for Segment 1, the attitude towards science and technology may be more conservative due in part to a ‘fear of the unknown’ unlike Segment 1 where the
reported awareness was relatively higher.
Notably, Segment 1 also had, by far, the lowest proportion of respondents saying the
benefits outweighed the risks across the various applications of GM and biotechnology (See Table 7). However, it also had a significantly higher share of respondents who
could not say whether the risks outweighed the benefits or vice versa. This is consistent with other findings for Segment 1, where they are less apt to judge
because they feel they do not know enough about the topic to form a firm opinion.
Demographic characteristics
Compared to other segments, there was a skew towards female respondents (59%),
and those who were aged 51-75 (43%). As a result, the proportion of those employed tended to be lower (54%) with pensioners making up 23% of the sample. Segment 1
also comprised of a significantly higher proportion of those who spoke a language other than English at home compared to the other segments combined (25%).
Table 9. Segment 1 - key demographic characteristics
Column % Segment 1
n=219
Gender Male 41
Female 59
Age 16- 30 years 24
31- 50 years 33
51 – 75 years 43
Employment Employed (PT/FT/Self) 54
Retired or Pensioner 23
Home duties 6
Student 12

Column % Segment 1
n=219
Unemployed 3
ATSI background Yes 2
Language other than English spoken at home Yes 25
Children under 10 at home Yes 29
Capital city vs. non-capital city Capital city 64
Rest of state/territory 36
Filter: 2012 only AND CATI only; Weighted to population
Segment 2
Segment 2 tended to be less positive towards the benefits of science and technology
with the lowest agreement that the benefits of science are greater than any harmful
effect of the four segments. In turn, they were less positive than the other segments about biotechnology generally. Yet, they still had a relatively high level of awareness
of the term biotechnology and the various types of biotechnologies (contrasting with Segment 2) and while on balance more felt the benefits of various applications of
biotechnology outweighed the risk than vice versa the sway towards positive was not as noticeable as exhibited for Segments 3 and 4.
Segment 2 was the least likely to think that human activities have a significant impact on the planet (although agreement was relatively high for all segments). Notably,
they had the lowest agreement that children should be protected from all risks and
least likely to think that not vaccinating children put others at risk – although they were a segment that was less likely to have children aged 10 and under at home.
Attitudes towards science and technology
As seen in Table 3, on a scale of 0 to 10 where 0 was strongly disagree and 10 was
strongly agree, we found that Segment 2 was the least likely of the segments to agree that that ‘the benefits of science are greater than any harmful effect’ (4.9 out
of 10) and ‘science is such a big part of our lives that we should all take an interest’ (averaging 7.4 out of 10).
They were second lowest in terms of agreement that ‘new technologies excite me
more than they concern me’ (5.6 out of 10). Segment 2 was also significantly more likely to agree that ‘scientific advances tend to benefit the rich more than they benefit
the poor’ (second lowest with 5.3 out of 10).
Although they tended to disagree with the statement that ‘science and technology
creates more problems than it solves’ they were less likely to disagree than the other segments combined (4.0 out of 10 – second highest).
The above results together draw a picture that Segment 2 is more cynical about the benefits of science and technology – particularly when you look at profile of the other
segments.

Attitudes towards the world around us
While agreement across the board was high (an average of 8.8 out of 10), Segment 2 was the least likely to agree that ‘human activities have a significant impact on the
planet’ (8.4) (See Table 4). They were also less likely to agree that ‘people have the
right to modify the natural environment to suit their needs’ (4.0 out of 10).
The key difference to other segments was their significantly higher level of
disagreement with the statement that ‘children must be protected from all risks’ – one of the measures where there was the greatest variance across the four segments (3.4
out of 10 – lowest of the segments). They were also least the likely to agree that ‘not vaccinating children puts others at risk’ (7.6 out of 10).
Perceptions and awareness of biotechnology
Segment 2 provided the second lowest rating in terms of their level of support for GM
and other biotechnologies (5.4 out of 10). While across the board the vast majority
thought that biotechnology would improve our way of life in the future, the proportion for Segment 2 was second lowest of the four groups (93% compared to 81-99% for
the other segments). When looking at the risks vs. benefits of various applications of biotechnology, Segment 2 tended to be the second least likely to say the benefits
outweighed the risks of the segments (See Table 7).
However, for Segment 2, we find that there was a high level of reported awareness of
the term biotechnology (83%) – on par with that exhibited by Segment 3 (one of the more positive segments with an awareness of 82%). This compares to the awareness
shown among those in Segment 2 where the feelings towards science tended to be
the least positive but awareness was also low.
Demographic characteristics
Demographic differences between Segment 2 and other respondents include a comparatively lower number of those who spoke a language other than English at
home (8%) and a lower proportion of those who had children aged 10 and under at home (21% compared to 29% for the other three segments combined).
Table 10. Segment 2 - key demographic characteristics
Column % Segment 2
n=245
Gender Male 45
Female 55
Age 16- 30 years 29
31- 50 years 36
51 – 75 years 35
Employment Employed (PT/FT/Self) 62
Retired or Pensioner 16
Home duties 6
Student 12

Column % Segment 2
n=245
Unemployed 3
ATSI background Yes 3
Language other than English spoken at home Yes 8
Children under 10 at home Yes 21
Capital city vs. non-capital city Capital city 68
Rest of state/territory 32
Note: Excludes n=1 that were not able to be classified in the statements due to a lack of variability in their
responses.
Filter: 2012 only AND CATI only; Weighted to population
Segment 3
In summary:
Segment 3 was defined by a relatively high (although not the highest) agreement
with statements relating to an interest in science and that the benefits of science are greater than any harmful effect.
In terms of their views towards biotechnology, they provided the second most positive scores of the four segments. There was a high level of awareness, but like
Segment 2, this consisted mostly of those who were aware but did not know much about biotechnology.
What also stood Segment 3 apart was that they had the highest agreement that
children should be protected from all risks with a higher proportion with respondents with children under 10 at home.
Attitudes towards science and technology
Segment 3 exhibited a strong level of agreement that ‘science is such a big part of
our lives that we should all take an interest’ (8.3 out of 10) – this was the second highest rating of the four segments. Segment 3 was also second highest in terms of
agreement with the statements: ‘new technologies excite me more than they concern me’ (7.0 out of 10); and ‘the benefits of science are greater than any harmful effect’
(6.3).
As to the negative aspects of science and technology, they were apt to disagree that ‘science and technology creates more problems than it solves’ (3.2 out of 10), ‘we
depend too much on science and not enough on faith’ (3.8); and ‘scientific advances tend to benefit the rich more than they benefit the poor’ (4.3 out of 10) – all of which
were second to lowest out of the segments.
Attitudes towards the world around us
A differentiating factor of this segment was their strong belief that ‘children must be protected from all risks’ (9.1 out of 10 – highest of the four segments). Incidentally,
while there was little variation between segments on these two measures, Segment 3
was the most likely to agree that ‘human activities have a significant impact on the

planet’ (mean of 9.0 out of 10) and ‘I believe everything in the world is connected’
(8.0 out of 10).
Perceptions and awareness of biotechnology
On average, when asked their level of support for GM and other biotechnologies, the
average score for Segment 3 was 6.4 out of 10. While not a very high score, this was the second highest of the four segments.
There was a relatively high level of awareness overall (82%), with the majority of those who heard of the term biotechnology but like Segment 2, most had heard of it
but knew little or nothing about it (63% of Segment 3). This compares with Segment 4 (the most positive in their attitudes towards science) where a higher proportion
reported they had heard of biotechnology and knew enough to explain it to a friend.
Demographic characteristics
Of note, there was a higher proportion of those with children under 10 at home (20%)
in Segment 3.
Table 11. Segment 3 - key demographic characteristics
Column % Segment 3
Gender Male 45
Female 55
Age 16- 30 years 26
31- 50 years 41
51 – 75 years 33
Employment Employed (PT/FT/Self) 65
Retired or Pensioner 16
Home duties 6
Student 10
Unemployed 2
ATSI background Yes 2
Language other than English spoken at home Yes 20
Children under 10 at home Yes 29
Capital city vs. non-capital city Capital city 68
Rest of state/territory 32
Filter: 2012 only AND CATI only; Weighted to population
Segment 4
In summary:
The most positive towards science and technology was Segment 4 for whom there
was a greater belief that we should all take an interest in science, that new

technologies excited more than concerned and that the benefits of science are greater
than any harmful effects. Equally, there was disagreement that science and technology creates more problems than it solves and that we depend too much on
science and not enough on faith. They were most likely to think that the benefits
outweighed the risks for all the specific applications of biotechnology and were the most supportive of GM and other biotechnologies.
Notably, it was Segment 4 that had the highest proportion of respondents who said they knew enough about biotechnology to explain it to a friend.
Attitudes towards science and technology
Segment 4 was defined by strong agreement with ‘pro-science’ type statements –
with averages notably higher than that presented by Segment 3. They were the most likely to agree that ‘science is such a big part of our lives that we should all take an
interest’ (average of 9 out of 10); ‘new technologies excite me more than they
concern me’ (8.4 out of 10); and ‘the benefits of science are greater than any harmful effect’ (6.7).
This was coupled by strong disagreement with statements such as ‘we depend too much on science and not enough on faith’ (1.3 out of 10); and ‘science and
technology creates more problems than it solves’ (1.3) – both results were the lowest for these statements.
In addition, they were the least likely to agree that ‘scientific advances tend to benefit the rich more than they benefit the poor’ (2.8 out of 10); and ‘technological change
happens too fast for me to keep up with it’ (3.1 out of 10).
Attitudes towards the world around us
Segment 4 presented the lowest agreement that ‘people shouldn’t tamper with
nature’ (3.6 out of 10). Connected with this was the highest agreement (although this was low across the board) with the statement: ‘people have the right to modify the
natural environment to suit their needs’ (5.5 out of 10). Segment 4 was also the least likely to agree that they ‘believe that everything in the world is connected’ (6.8).
Compared to other segments, Segment 4 was the most likely to say that ‘not vaccinating children puts others at risk’ (an average of 9.0 out of 10) and least likely
to say we should use more natural ways of farming (6.0 out of 10).
Demographic characteristics
Compared to the other segments, there was a higher proportion of males in Segment
4 (68%). A smaller proportion of the Segment was aged 51-75 (26%) compared to those not in the segment.
This segment was more likely to be employed (68%) than the other segments combined and consistent with age, were less likely to be retired or pensioners (8%).
There was also a higher proportion of students in this group (18%).
Segment 4 also had a smaller share of people who spoke a language other than
English at home than other segments (11%).

Seven in ten respondents in Segment 4 resided in capital cities around Australia
(70%).
Table 12. Segment 4 by key demographic characteristics
Column % Segment 4
n=237
Gender Male 68
Female 32
Age 16- 30 years 33
31- 50 years 41
51 – 75 years 26
Employment Employed (PT/FT/Self) 68
Retired or Pensioner 8
Home duties 4
Student 18
Unemployed 2
ATSI background Yes 2
Language other than English spoken at home Yes 11
Children under 10 at home Yes 30
Capital city vs. non-capital city Capital city 70
Rest of state/territory 30
Filter: 2012 only AND CATI only; Weighted to population
Section 6 ‘Predictors’ of Attitudes
Throughout this report there were consistent trends where groups within the sample felt more positively or less positively about science and technology
as well as biotechnology and its applications specifically.
The table below shows some of the groups where this occurred.
More likely to be supportive of GM and other
biotechnologies
Less likely to be supportive of GM and other
biotechnologies
Gender:
Male Female
Age:
16-30 years 51-75 years
Had heard of biotechnology
Knew enough to explain it to a friend Had not heard of the term biotechnology
Employment status:

More likely to be supportive of GM and other biotechnologies
Less likely to be supportive of GM and other biotechnologies
Employed Home duties
Student Retired/Pensioner
Segments:
Segment 3 and Segment 4 Segment 1 and Segment 2
Attitudes:
Higher agreement with:
Science is such a big part of our lives that we should all take an interest
New technologies excite me more than they concern me
Not vaccinating children puts others at risk
Higher agreement with:
Scientific advances tend to benefit the rich more than they benefit the poor
Technological change happens too fast for me to keep up with it
We should use more natural ways of farming
People shouldn’t tamper with nature
Section 7 Attitudes towards science & technology
There was a strong agreement that science is such a big part of our lives that we should all take an interest. There was also a high level of agreement that new
technologies excite more than concern respondents, and that the benefits of science are greater than any harmful effects. Where there were more mixed views were to
statements relating to scientific advances benefitting the rich more than they benefit
the poor, technological change happening too fast to keep up with it, and depending too much on science and not enough on faith. In general, females were often more
cautious in their attitudes towards advances in science and technology than males. Age and location were also aspects where attitudes differed.
All survey respondents were provided with a list of statements about science and technology, and asked if they agreed or disagreed, on a scale where 0 was strongly
disagree and 10 was strongly agree. As outlined in Figure 4, attitudes to science and technology were generally positive. This provides context to the attitudes of each of
the segments where attitudes towards science were generally positive however, there
were differences in the degrees of support held by each of the four segments (See Section 5).

Figure 4. Attitudes towards science and technology
Q1c On a scale of 0-10, would you say do you disagree or agree that…
Filter: 2012 only AND CATI only; Weighted to population; Total n = 1000
Overall, there was high agreement with the statements ‘science is such a big part of
our lives that we should all take an interest’ (81% provided a rating of 7 or above out of 10 with an average rating of 8.1 out of 10) and ‘new technologies excite me more
than they concern me’ (56% provided a rating of 7 or above with a mean of 6.7 out of 10).
However, attitudes towards the following statements tended to be more mixed, with a broader distribution of responses across the scale:
‘Technological change happens too fast for me to keep up with it’ (29% with ratings of 0-3 out of 10, 26% with 4-6 and 44% with 7-10, making an average
of 5.5 out of 10 for this statement);
‘The benefits of science are greater than any harmful effect’ (13% with ratings of 0-3, 48% with ratings of 4-6 and 39% with 7-10 out of 10, equating with an
average of 5.9);
‘Scientific advances tend to benefit the rich more than they benefit the poor’
(35% with ratings of 0-3 out of 10, 34% for 4-6 out of 10 and 31% with 7-10 out of 10, an average of 4.9); and
‘We depend too much on science and not enough on faith’ (49% provided ratings of 0-3 out of 10, 29% 4-6 out of 10 and 23% 7-10 out of 10, with an
overall average of 3.9).
There was greater disagreement with the statement ‘science and technology creates more problems than it solves’ (54% providing a response of 0-3 out of 10 with an
overall average of 3.6).

A number of differences in attitudes to science and technology emerged by gender,
as detailed below in Table 13.
Females were significantly more likely than males to agree that:
‘Technological change happens too fast for me to keep up with it’ (5.9 compared
to 5.1);
‘We depend too much on science and not enough on faith’ (4.3 compared to
3.5); and
‘Science and technology creates more problems than it solves’ (4.0 compared to
3.1).
Males were significantly more likely than females to agree that ‘new technologies
excite me more than they concern me’ (7.2 compared to 6.2).
Table 13. Attitudes to science and technology by gender
Average (0-10 Strongly disagree/strongly agree scale) Male Female
Science is such a big part of our lives that we should all take an interest 8.2 7.9
New technologies excite me more than they concern me 7.2 6.2
The benefits of science are greater than any harmful effect 6.0 5.8
Technological change happens too fast for me to keep up with it 5.1 5.9
Scientific advances tend to benefit the rich more than they benefit the poor 4.7 4.9
We depend too much on science and not enough on faith 3.5 4.3
Science and technology creates more problems than it solves 3.1 4.0
Q1c On a scale of 0-10, would you say do you disagree or agree that…
Filter: 2012 only AND CATI only; Weighted to population; Total n = 1000
Indicates statistically significant difference compared to those not in that category
Findings also varied by age. As shown below in Table 14, those aged 51-75 were significantly more likely than others to agree with the following:
‘Science is such a big part of our lives that we should all take an interest’ (8.2 out of 10)
‘Technological change happens too fast for me to keep up with it’ (6.5 out of 10);
‘The benefits of science are greater than any harmful effect’ (6.2 out of 10);
‘Scientific advances tend to benefit the rich more than they benefit the poor’ (5.2 out of 10)’
‘We depend too much on science and not enough on faith’ (4.4); and
‘Science and technology creates more problems than it solves’ (4.0).

Those aged 16-30 were more likely than all others to agree that ‘new technologies
excite me more than they concern me’ (7.1 compared, for example to 6.4 among 51-75 year-olds).
Table 14. Attitudes to science and technology by age.
Average (0-10 Strongly disagree/strongly agree scale) 16- 30
years
31- 50
years
51 – 75
years
Science is such a big part of our lives that we should all take an interest 7.9 8.1 8.2
New technologies excite me more than they concern me 7.1 6.7 6.4
The benefits of science are greater than any harmful effect 5.8 5.7 6.2
Technological change happens too fast for me to keep up with it 4.5 5.3 6.5
Scientific advances tend to benefit the rich more than they benefit the
poor 4.8 4.7 5.0
We depend too much on science and not enough on faith 3.7 3.7 4.4
Science and technology creates more problems than it solves 3.4 3.2 4.0
Q1c On a scale of 0-10, would you say do you disagree or agree that…
Filter: 2012 only AND CATI only; Weighted to population; Total n = 1000
Indicates statistically significant difference compared to those not in that category
Fewer differences by location were observed. However, those living outside of capital cities were significantly more likely to agree that ‘technological change happens too
fast for me to keep up with it’ (5.9 compared to 5.3 out of 10) and ‘science and technology creates more problems than it solves’ (3.8 compared to 3.4) than those
living in capital cities.
As covered in Section 5, these statements in addition to statements about the world
around us were included in the segmentation analysis. Details on how each segment rated on these statements as well as their views on biotechnology
is covered in Section 5.
Section 8 Attitudes to the world around us
There was less variation in the statements about the world around us. The vast majority agreed strongly that ‘human activities have a significant impact on the
planet’, ‘not vaccinating children puts others at risk’, ‘I believe that everything in the world is connected’ and ‘we should use more natural ways of farming’. Respondents
tended to be more divided about tampering with nature and the right to modify the environment to suit their needs.
There was some variation in responses by gender with females placing more value on
protecting the earth than males.
Respondents were also asked whether they agreed or disagreed (on a scale of 0-10)
with a number of more general statements about the world around us.

Figure 5. Attitudes towards the world around us
Q1c On a scale of 0-10, would you say do you disagree or agree that…
Filter: 2012 only AND CATI only; Weighted to population; Total n = 1000
As shown in Figure 5, there were high levels of agreement with the majority providing
scores of 7-10 out of 10 for the following statements:
‘Human activities have a significant impact on the planet’ (90% with 7-10 out of
10 and an average agreement of 8.8);
‘Not vaccinating children puts others at risk’ (83% with ratings of 7-10 out of 10
and an overall average of 8.4);
‘I believe that everything in the world is connected’ (73% rated their agreement
7-10 out of 10, with an average of 7.6);
‘We should use more natural ways of farming’ (72% 7-10 out of 10 and an
average of 7.6); and
‘Children must be protected from all risks’ (52% with ratings of 7-10 out of 10 and an average of 6.5).
However, respondents were more divided when it came to the statement, ‘people shouldn’t tamper with nature’ (26% 0-3 out of 10, 40% 4-6 and 34% 7-10, with an
overall average of 5.4) and, conversely, ‘people have the right to modify the natural environment to suit their needs’ (34% with ratings of 0-3, 43% with rating of 4-6 and
23% 7-10 out of 10, and an average of 4.5).
Agreement with the statements tended to vary by gender, as shown in Table 15,
below. Females were more conservative and protective of the environment with
significantly higher agreement with every statement, with the exception of ‘people have the right to modify the natural environment to suit their needs’, with which
males were significantly more likely to agree (4.8 compared to 4.3).

Table 15. Attitudes to the world around us by gender
Average (0-10 Strongly disagree/strongly agree scale) Male Female
Human activities have a significant impact on the planet 8.6 9.0
Not vaccinating children puts others at risk 8.2 8.7
I believe that everything in the world is connected 7.3 7.9
We should use more natural ways of farming 7.2 7.9
Children must be protected from all risks 6.4 6.7
People shouldn’t tamper with nature 5.1 5.8
People have the right to modify the natural environment to suit their needs 4.8 4.3
Q1c On a scale of 0-10, would you say do you disagree or agree that…
Filter: 2012 only AND CATI only; Weighted to population; Total n = 1000
Indicates statistically significant difference compared to those not in that category
A number of differences by age were also observed. The older participants were, the more likely they were to agree that ‘not vaccinating children puts others at risk’ (7.7
among 16-30 year-olds, compared to 8.6 among 31-50 year-olds and 8.8 among 51-75 year-olds).
Those from an Aboriginal and/or Torres Strait Islander background were more
likely to agree that ‘I believe everything in the world is connected’ (8.8 compared to 7.6), as were those who spoke a language other than English at home (8.5
compared to 7.4). The latter group were also more likely to agree that ‘human activities have a significant impact on the planet’ (9.0 vs. 8.7 out of 10); ‘we should
use more natural ways of farming’ (8.1 compared to 7.5) and ‘children must be protected from all risks’ (7.7 compared to 6.3).
Those with children under 10 at home were also more likely to agree that ‘children must be protected from all risks’ (7.0 compared to 6.3).
As to location: those in Victoria were more likely to agree that ‘I believe everything
in the world is connected’ (8.1 compared to an average of 7.6 for those in other states).
The statements on attitudes about the world around us were also used in the segmentation. The relative differences in responses for each of the segments
is covered in Table 4 in Section 5.
Section 9 Awareness and understanding of biotechnology
This section covers respondents’ levels of awareness of the term biotechnology, different areas of biotechnology and their applications.
Attitudes towards these are covered in the subsequent section.

9.1 Awareness and understanding of
biotechnology
Awareness of the term biotechnology was high (84% had heard of the term).
However, respondents were more likely to have heard of other categories of
biotechnology such as stem cell research (95%), cloning of animals (94%) or human embryos (89%) or GM (8%) than the actual term biotechnology. While there has
been an increase in those who had heard of biotechnology compared to 2010 (74%), respondents were more likely to say they had heard of ‘biotechnology’ but knew little
or nothing about it (especially compared to the other categories of biotechnology covered in the survey).
Males were more likely to report a better understanding of biotechnology than females. Those in the 31-50 year band had the highest level of reported
understanding and awareness of the age groups. Capital city dwellers and Segment 4
respondents were more likely to say they could explain biotechnology to a friend whereas there was relatively lower awareness amongst those in Segment 2.
Respondents were asked whether they had heard of a number of different biotechnologies, including the term biotechnology itself. Awareness of the term
biotechnology was high (84% had heard of the term). However, respondents were more likely to have heard of other categories of biotechnology such as stem cell
research (95%), cloning of animals (94%) or human embryos (89%) or GM (88%) than the term biotechnology.
The proportion of those who felt they knew enough about the other forms of
technology to explain them to a friend was also higher than for biotechnology. Overall, the majority (61%) said they had heard of biotechnology but knew very little
or nothing about it. Less than a quarter (23%) said they knew enough that they could explain it to a friend (See Figure 6).
Figure 6. Awareness of categories of biotechnology and biotechnology in general
Q1a Have you heard of...biotechnology
Filter: CATI only; Weighted to population

Awareness of all five forms of biotechnology has increased significantly since the 2010
survey. Biotechnology saw the biggest increase, with only 74% having heard of it in 2010 compared to 84% in 2012, as Figure 7 illustrates.
Knowledge of stem cell research increased from 91% to 95%, cloning of animals from
91% to 94%, cloning human embryos from 84% to 89% and genetic modification from 80% to 89%.3
Figure 7. Awareness of categories of biotechnology and biotechnology in general – by wave
Q1a Have you heard of...
Filter: 18-75 years only AND CATI only AND Landline only; Weighted to population
indicates significant difference between 2010 and 2012 surveys
A number of demographic differences in terms of knowledge of biotechnology were observed.
In terms of gender, males were significantly more likely than females to say they knew enough about biotechnology that they could explain it to a friend (30%
compared to 16%) and were significantly more likely to say that they had heard of biotechnology overall (88% compared to 80%).
In terms of age, overall awareness tended to be higher among 31-50 year olds
(87%). In addition, those aged 31-50 were significantly more likely to say that they knew enough about biotechnology to explain it to a friend (30%), while those aged
51-75 were significantly less likely to say so (18%).
While for those who spoke a language other than English at home, the overall
awareness was not dissimilar to their English only speaking counterparts, they were significantly more likely to say they knew enough about biotechnology that they could
explain it to a friend (34% compared to 20% of those who only spoke English).
3 To allow comparison with previous waves, 2012 figures in this section include only those aged 18-75 and landline respondents, excluding all respondents aged under 18
or had completed the survey by mobile phone.

As to location, those who lived in capital cities were more likely to say that they
knew enough about biotechnology that they could explain it to a friend than those outside of capital cities (25% compared to 17%). Those in NSW were also more likely
than those in all other states to say the same (27%).
As previously mentioned, one of the key differentiators between the segments was their level of self reported awareness and knowledge of biotechnology. Segment 2
had the lowest level overall of awareness, with Segment 4 with the highest (See Figure 8). Therefore it is not surprising that Segment 2 had a significantly higher
proportion of those who tended to have lower awareness (females and those aged over 51) and Segment 4 was skewed towards male respondents.
Figure 8: Reported awareness of the term biotechnology by segment
Q1a Whether heard of Biotechnology by SEGMENT
Filter: 2012 ONLY AND CATI ONLY; Weighted to population; base n = 999; Total n = 1000
Indicates statistically significant difference compared to those not in that category
9.2 Awareness of specific biotechnology applications
9.2.1 Awareness of GM and biotechnology in plants to
produce food
While there was a high awareness of using GM (87%) and biotechnology in plants to produce food (76%), awareness of other methods that could be used to do this was
substantially lower. Awareness was noticeably lower than that for the use of genetic
information or stem cells for medical purposes.
There were some changes over time, particularly an increase in the awareness of
using GM by introducing the genes of another species to plants and a decrease in the awareness of introducing the genes of animals to plants to produce food.
Consistent with other findings awareness tended to be higher for males and those in Segment 4.

Fewer thought that GM crops were allowed be grown in state than in 2010 (44% vs.
54%). WA residents were significantly more likely to think GM crops were allowed in their state. The most common crops were canola (41%) and wheat (22%).
Respondents tended to be unsure of the prevalence of GM crops and the use of GM
foods in Australia. However, more than one in four believed that most of the processed foods in Australian supermarkets contained GM ingredients. Segment 4
respondents were most likely to think that GM foods and crops were not prevalent in Australia.
Awareness of modifying the genes in plants to produce food
In addition to covering the awareness of broad areas of biotechnology, respondents
were asked if they were aware of a range of more specific applications of biotechnology including biotechnology in plants and GM crops.
As shown in Figure 9, awareness was highest for the fairly general ‘modifying the
genes of plants to produce food’ (87%).4 Over two-thirds were aware of ‘modifying the genes of plants to produce food by introducing the genes of a plant of a different
species’ (68%), and ‘modifying the genes of plants to produce food by introducing the genes of a plant of the same species’ (67%). Reported awareness was lower for
‘modifying the genes of plants to produce food by introducing the genes of a bacterium to a plant’ (46%) and ‘modifying the genes of plants to produce food by
introducing the genes of an animal to a plant’ (25%).
Figure 9. Awareness of modifying the genes of plants to produce food
Q2a Have you heard of...
Filter: CATI only; Weighted to population; Total n (2012) = 600
4 To allow comparison with previous waves, 2012 figures in this section include only
those aged 18-75, excluding all respondents aged under 18.

As shown in Figure 10, while awareness of generally ‘modifying the genes of plants to
produce food’ has remained stable in recent years, it has increased significantly since the survey was first conducted in 2007, from 76% aware to 87%. Increases in
awareness compared the 2010 survey were also observed in relation to: ‘modifying
the genes of plants to produce food by introducing the genes of a plant of a different species’ (68% vs. 60% in 2010); and decreased for ‘modifying the genes of plants to
produce food by introducing the genes of an animal to a plant’ (27% from 39%).
Figure 10. Awareness of modifying the genes in plants to produce food – by
wave
Q2a Have you heard of...(modifying the genes of plants to produce food) (Yes) by WAVE
Filter: Landline only AND 18-75 years only AND CATI only; Weighted to population
As has been the pattern, males were more likely to report they were aware of
‘modifying the genes of plants to produce food’ (90% vs. 83%) as well as ‘modifying
the genes of plants to produce food by introducing the genes of a plant of a different species’ (73% vs. 62%) and ‘modifying the genes of plants to produce food by
introducing the genes of an animal to a plant’ (31% vs. 20%) than females.
In relation to age, younger respondents were less likely to have heard of the above
practices than older respondents.
As to the four segments, as with the broader categories of biotechnology, awareness
was significantly higher for Segment 4 and lower for Segment 2.
Table 16. Awareness of modifying the genes of plants…
Column % Yes, aware of modifying the
genes of plants…
Segment
1
Segment
2
Segment
3
Segment
4
To produce food 75 88 87 97

Column % Yes, aware of modifying the genes of plants…
Segment 1
Segment 2
Segment 3
Segment 4
To produce food by introducing the genes of a
plant of a different species
57 65 66 82
To produce food by introducing the genes of a
plant of the same species
59 63 66 82
To produce food by introducing the genes of a
bacterium to a plant
35 45 44 62
To produce food by introducing the genes of an animal to a plant
15 25 22 41
Q2a Have you heard of...
Filter: CATI only; Weighted to population; Total n (2012) = 600
Indicates statistically significant difference compared to those not in that category
9.2.2 Awareness of using biotechnology in the production
of food
Three quarters of respondents reported they had heard of broadly ‘using biotechnology in the production of food from plants’ (76%). There was relatively
lower awareness when more specific uses were covered such as ‘using biotechnology in the production of food from plants to assist n conventional breeding’ (50% had
heard of this) or ‘using biotechnology in the production of food from plants by changing the genes of a plant without introducing new DNA’ (43% had heard of this)
(See Figure 11).
Figure 11. Awareness of biotechnology in the production of food from plants
Q2a Have you heard of...
Filter: CATI only; Weighted to population; Total n (2012) = 600
Figure 12 shows that levels of awareness has remained stable in the last 5 years for
all three statements relating to the use of biotechnology in the production of food

from plants, there has been a decrease in reported awareness of ‘using biotechnology
in the production of food from plants to assist in conventional breeding’ when comparing 2007 to 2012’s results (from 59% to 49%). 5
Figure 12. Awareness of modifying the genes in plants to produce food – by
wave
Q2a Have you heard of... (modifying the genes of plants to produce food) (Yes) by WAVE
Filter: Landline only AND 18-75 years only AND CATI only; Weighted to population; Total n (2012) = 464
Whether respondents felt the benefits of each application outweighed the
risks is covered in Section 10 of this document.
9.2.3 Perceptions of GM crops grown in own state
As outlined in Figure 13, just under half (44%, down from 54% in 2010) thought that
GM crops were allowed to be grown in their state. Only 14% thought GM crops were not allowed to be grown. However, a substantial proportion of respondents, almost
two in five (38%), were unsure.
5 To allow comparison with previous waves, 2012 figures in this section include only
those aged 18-75, excluding all respondents aged under 18.

Figure 13. Awareness of GM crops in state
Q12. As far as you know, are commercial genetically modified crops allowed to be grown in your state?
** Note: Small samples size. Results indicative only
Females were significantly more likely to say they were unsure of whether GM crops
were allowed in their state than males (52% compared to 45%), as were younger
respondents (61% among 16-30 year-olds compared to 43% among 31-75 year-olds). Older people were significantly more likely to say that they thought GM crops
were allowed to be grown in their state (50%).
As to location, respondents in NSW, Victoria and Queensland did not deviate from
the average on this measure. However, those in South Australia were significantly more likely to say they did not think that GM crops were allowed to be grown there
(18%), while those in WA were significantly more likely to say they believed that they were (59%).
Awareness of biotechnology was correlated with the belief that GM crops were
permitted to be grown in respondents’ own state. Over half (59%) of those who knew enough about biotechnology to explain it to a friend said that GM crops were was
grown in their state, compared to only 29% of those who had not heard of it.
GM crops thought to be grown in their state
Those who thought GM crops were permitted to be grown in their state were asked, unprompted, if they could name any specific crops that were grown in their state.
As Figure 14 shows, the most commonly mentioned crops were ‘canola’ (41%) and ‘wheat’ (22%), with a large range of other crops also mentioned including corn,
cotton, tomatoes, soya and varieties of fruit. More than one in four (27%) said they
couldn’t name any crops.

Since 2010, there has been an increase in the proportion naming ‘wheat’ (22%
compared to 15%) and a decrease in those mentioning ‘cotton’ (9% compared to 16%).6
Figure 14. Unprompted awareness of specific GM crops
Q13. Can you name any genetically modified crops that are grown in your state?
Filter: 2012 only AND CATI only; Weighted to population; Total n = 1000
Males were significantly more likely to mention ‘wheat’ (27% compared to 16% of females) and ‘corn’ (11% compared to 5% for females).
Awareness of specific crops was lower among younger respondents. Those aged 16-30 were significantly more likely to say they could not name any GM crops (42%
compared to 22% and 25% of those aged 31-50 and 51-75 respectively). Younger respondents were also more likely to name non-GM crops including tomatoes (14%)
and fruit (11%). Those aged 31-50, however, were more likely to mention ‘wheat’
than all others (30%), while those aged 51-75 were more likely to say ‘canola’ (56%).
Those in capital cities were more likely than those living elsewhere to mention ‘tomatoes’ (9% compared to 2% of those living elsewhere).
6 To allow comparison with previous waves, 2012 figures in this section include only
those aged 18-75, excluding all respondents aged under 18.

Perceptions of the prevalence of GM foods and crops
The supplementary online survey covered respondents’ perceptions of the prevalence GM foods and crops in Australia.
As illustrated in Figure 15, respondents were most likely to say they were not sure
about the prevalence of GM crops. At least one in three were not sure about whether most processed foods contained GM ingredients, most cotton in Australia was GM,
most oils were made from GM crops, or most fresh fruit or vegetables in Australia was genetically modified. Respondents were particularly unsure about whether most of the
cotton grown in Australia was genetically modified (55% unsure).
Over one in four (29%) respondents believed that ‘most of the processed foods in
Australian supermarkets contain genetically modified ingredients’ although an equal proportion thought the statement to be ‘false’. Thirty three percent (33%) believed
this to be true in 2010.
A similar proportion (29%) thought ‘most of the cotton grown in Australia is genetically modified’ (a significant decrease from 35% in 2010).
Fewer respondents thought ‘most of the vegetable oils produced in Australia are made from genetically modified crops’ (23% ‘true’ compared to 28% ‘false’).
In contrast, half of respondents (50%) did not believe that ‘most of the fresh fruit and vegetables grown in Australia are genetically modified’ with only 15% thinking this
was true of Australian fruit and vegetables (a significant decrease from 19% in 2010).
Figure 15. Perceptions of the prevalence of GM foods/crops in Australia
Q9. Please say whether you think each of the following statements is true or false re: GM foods/crops
Filter: 2012 only AND Online only; Weighted to population
Several gender differences were apparent when it came to the perceptions of how
prevalent GM crops were in Australia. For the most part, females were significantly more likely to say they were not sure or that the statements were false than males.

Males, in particular, were significantly more likely to believe that most cotton grown
in Australia is genetically modified.
As to age, respondents aged 16-30 were significantly more likely to think it was true
that most processed foods in Australian supermarkets contain genetically modified
ingredients (35%), or that most fresh fruit and vegetables grown in Australia are genetically modified (20%), than older respondents (27% and 13% respectively).
Younger respondents were particularly unsure about fresh fruit and vegetables grown in Australia (43% were unsure if most were genetically modified).
There were no differences between those who lived in capital cities and those who lived in other parts of Australia. However, NSW respondents (18%) were significantly
more likely to think that most fresh fruit and vegetables grown in Australia are genetically modified than those who lived outside NSW.
There were several differences in perceptions according to the various segments
(See Table 17). Segment 2 with its stronger belief that ‘you shouldn’t tamper with nature’ were significantly more likely to believe it was true that most fresh fruit and
vegetables grown in Australia are genetically modified (18%). This segment was also significantly less likely to think most processed foods in Australian supermarkets did
not contain genetically modified ingredients (23%). On the other hand, Segment 3 were significantly less likely to think that it was true that most processed foods in
Australian supermarkets contain genetically modified ingredients or that most fresh fruit and vegetables grown in Australia are genetically modified, or most vegetable
oils produced in Australia are made from genetically modified crops (24%, 10% and
19% respectively). The most supportive of science and technology, Segment 4, were more likely to be confident in their responses with fewer saying they were not sure.
They were most likely to say that was true that most cotton grown in Australia is genetically modified (39%). They were also more likely than those in the other
segments to say that it was not true that most processed foods in Australian supermarkets contain genetically modified ingredients (42%), most fresh fruit and
vegetables grown in Australia are not genetically modified (58%) and that most vegetable oils produced are not made from genetically modified crops (35%).
Table 17. Perceptions of the prevalence of GM foods/crops in Australia by
segment
Segment
1
Segment
2
Segment
3
Segment
4
Total
% True
Most processed foods in Australian
supermarkets contain genetically modified ingredients
32 32 24 29 29
Most fresh fruit and vegetables grown in Australia are genetically modified
18 14 10 19 15
Most cotton grown in Australia is genetically
modified
29 26 26 39 29
Most vegetable oils produced in Australia
are made from genetically modified crops
25 25 19 27 24
% False

Segment 1
Segment 2
Segment 3
Segment 4
Total
Most processed foods in Australian
supermarkets contain genetically modified ingredients
23 24 31 42 29
Most fresh fruit and vegetables grown in
Australia are genetically modified
44 48 53 58 50
Most cotton grown in Australia is genetically
modified
18 17 15 14 16
Most vegetable oils produced in Australia are made from genetically modified crops
26 25 30 35 28
% Unsure
Most processed foods in Australian
supermarkets contain genetically modified ingredients
45 43 44 28 42
Most fresh fruit and vegetables grown in
Australia are genetically modified
38 39 37 24 36
Most cotton grown in Australia is genetically modified
52 57 58 47 55
Most vegetable oils produced in Australia are made from genetically modified crops
49 51 51 37 48
Q9 (Online) Do you think the statement is true or false:
Filter: 2012 ONLY AND Online only; Weighted to population; Total n = 1000
Indicates statistically significant difference compared to those not in that category
Whether respondents felt the benefits of each of the above outweighed the
risks is covered in Section 10 of this document.
9.2.4 Awareness of biotechnology in medicine and medical research
Awareness of the use of genetic information and stem cells for medical purposes were very high (89% and 95% had heard of these uses respectively). Awareness of the use
of genetic information in medical research in general has increased from 81% in 2010.
Younger respondents were less likely to have heard of the use of stem cells for medical purposes both in the general sense and specifically related to embryonic and
non-embryonic stem cells. Awareness of the use of genetic information and stem cells
for medical research and to treat disease also tended to be lower for Segment 2 respondents who had a lower level of awareness compared to others.
Respondents were asked if they were aware of a range of medical applications of biotechnology. Awareness of medical applications was high across the board, notably
higher than the level of awareness of GM and biotechnology in plants in the production of food (as seen in Figure 9 and Figure 11) with the large majority of
respondents familiar with the medical applications covered in the survey.

Using genetic information in medical research
Reported awareness of using genetic information in medical research was high (89%) but was also high in relation to using genetic information to study a human disease in
animals (91%), to study a human disease in the laboratory (89%) and to design
vaccines against new or existing diseases (88%).
Figure 16. Awareness of the use of genetic information in medical research
Q2a Have you heard of (Using genetic information in medical research) (Yes)
Filter: CATI only; Weighted to population; Total (2012) n = 601
Figure 17 shows that awareness of using genetic information in medical research in general has increased significantly from 81% in 2010. 7
7 To allow comparison with previous waves, 2012 figures in this section include only
those aged 18-75, excluding all respondents aged under 18.

Figure 17. Awareness of the use of genetic information in medical research
by wave
Q2a Have you heard of (Using genetic information in medical research) (Yes) by WAVE
Filter: Landline only AND 18-75 years only; Weighted to population; Total (2012) n = 450
Using stem cells in medical research and to treat disease
Awareness of the use of stem cells in medical research and to treat disease was also
high - 96% reported they had heard of the practice in general. Eight in ten (81%) had heard of specifically using embryonic stem cells in medical research and to treat
disease and seven in ten respondents (70%) had heard of using embryonic cord or adult stem cells in medical research and disease treatment (See Figure 18).

Figure 18. Awareness of the use of stem cells in medical research and
treatment of disease
Q2a Have you heard of (Using stem cells to conduct medical research and treat disease) (Yes) by WAVE
Filter: CATI only; Weighted to population; Total n = 601
Over time, awareness of the use of stem cells has remained stable with no significant change compared to previous surveys.
Figure 19. Awareness of the use of stem cells in medical research and treatment of disease by wave
Q2a Have you heard of (Using stem cells to conduct medical research and treat disease) (Yes) by WAVE
Filter: Landline only AND 18-75 years only AND CATI only; Weighted to population; Total n (2012) = 450

Females were significantly more likely than males to say they had heard of ‘using
genetic information in medical research’ (92% compared to 87%), but there were no other differences by gender.
In terms of age, those aged 16-30 were generally less likely to have heard using
stem cells in medical research and to treat disease in general and in relation to using embryonic or non-embryonic cells. For example, 99% of those aged 51-75 had heard
of ‘using stem cells to conduct medical research and treat disease’ compared to 92% of 16-30 year-olds.
Those who spoke a language other than English at home were significantly less likely to have heard of using stem cells to conduct medical research and treat disease
(87% compared to 97% among those who spoke English only), using stem cells to conduct medical research and treat disease using non-embryonic, cord or adult stem
cells (59% compared to 72%), or using stem cells to conduct medical research and
treat disease using embryonic stem cells (70% compared to 82%).
Awareness of the use of genetic information or stem cells differed according to the
segments but was in line with other results. Segment 2, generally less likely to be aware of the different medical or research uses of genetic information or stem cells
and Segment 4 more likely to report they had heard of the medical applications of biotechnology (See Table 18). Other notable differences included a lower awareness
of using genetic information in medical research to design vaccines against new or existing diseases among Segment 2 members (73%) and a lower awareness of using
stem cells to conduct medical research and treat disease using non-embryonic, cord
or adult stem cells amongst those in Segment 3 (See Table 19).
Table 18. Awareness of the use of genetic information by segment
% Yes Segment
1
Segment
2
Segment
3
Segment
4
Total
Using genetic information in medical research
83 89 89 96 89
Using genetic information in medical
research to study a human disease in the laboratory
83 94 92 94 91
Using genetic information in medical
research to study a human disease in animals
72 73 84 87 79
Using genetic information in medical
research to design vaccines against new or existing diseases
83 88 89 92 88
Using genetic information in medical
research to tailor a person’s healthcare based on their genetic make-up
53 67 68 75 66
Q2a Have you heard of (using genetic information in medical research) (Yes)
Filter: 2012 ONLY AND CATI ONLY; Weighted to population; Total n = 601
Indicates statistically significant difference compared to those not in that category

Table 19. Awareness of the use of stem cells in medical research and
treatment of disease by segment
% Yes Segment 1
Segment 2
Segment 3
Segment 4
Total
Use of stem cells in medical research and
treatment of disease to conduct medical research and treat disease
88 95 96 100 95
Use of stem cells in medical research and
treatment of disease using embryonic stem cells
69 84 78 92 81
Use of stem cells in medical research and
treatment of disease using non-embryonic, cord or adult stem cells
58 72 63 88 70
Q2a Have you heard of (using stem cells to conduct medical research and treat disease) (Yes) by SEGMENT
Filter: 2012 ONLY AND CATI ONLY; Weighted to population; Total n = 600
Indicates statistically significant difference compared to those not in that category
Whether respondents felt the benefits of each application outweighed the
risks is covered in Section 10 of this document.
9.2.5 Awareness of use of genetic modification in animals
Awareness of the two methods of using GM in animals that were covered in the
survey has changed significantly compared to previous surveys. Awareness of using genetic modification to grow human tissue or organs in animals for human transplants
increased from 54% in 2010 to 80% in 2012. Awareness of using GM in introduced pests to decrease their numbers has decreased compared to 2007 (73% vs. 83% in
2007).
NSW and Queensland respondents were both more likely to have heard of the latter use of GM (77% and 79% respectively), while Victorian and South Australian were
less likely to have done so (64% and 58%).
Respondents were also asked whether they had heard of the two ways in which GM in
animals can be used. As shown in Figure 20, awareness of the use in genetic modification to grow human tissue or organs in animals for human transplants and
introduced pests to reduce their numbers were both high but not as high as that for medical and research applications. Eight in ten (81%) had heard of using GM to grow
human tissue in animals for human transplants, with a similar proportion (75%)
reporting they had heard of using GM to reduce the number of introduced pests.

Figure 20. Awareness of genetic modification in animals
Q2a Have you heard of (using genetic modification) (Yes)
Filter: Landline only AND 18-75 years only; Weighted to population; Total (2012) n = 599
There has been some change in awareness of these two measures over the years with
a significant increase in those who said they had heard about using GM to grow human tissue or organs in animals for human use (from 54% in 2010 to 80% in
2012). In addition, while there was no change compared to 2010, awareness of using GM in introduced pests to reduce their numbers has decreased compared to 2007
figures (73% compared to 83% in 2007) which suggests this has dropped off the community’s radar somewhat. 8
As to demographic differences, both uses of GM were less likely to be heard of by those younger respondents, for example 72% of those aged 16-30 reported they
had heard of ‘using genetic modification to grow human tissue or organs in animals
for human transplants’ compared to 31-50 year-olds (84%).
There were some noticeable variances across the states in terms of using GM in
introduced pests. NSW and Queensland respondents were both more likely to have heard of this use of GM (77% and 79% respectively), while there was lower
awareness among Victorian and South Australian respondents (64% and 58%).
Awareness of the use of GM to grow human tissue or organs in animals for human use
and in introduced pests was similar across the segments with the exception of Segment 2 where there were fewer who had heard of growing human tissue in
animals for human transplants (72%) than in the other segments (84%).
Whether respondents felt the benefits of each of the above outweighed the risks is covered in Section 10 of this document.
8 To allow comparison with previous waves, 2012 figures in this section include only
those aged 18-75, excluding all respondents aged under 18.

Community attitudes towards emerging technology issues - Biotechnology
60
Section 10 Attitudes towards biotechnology
The following section covers general attitudes towards biotechnology followed by respondents’ views on the specific ways that biotechnology is used including in the
production of food from plants and in medical research and the treatment of disease.
10.1 General attitudes towards biotechnology
Overall, support for GM and other biotechnologies was moderate.
Not surprisingly, males were more likely to be supportive of GM and other biotechnologies than their female counterparts. Younger respondents and those who lived
in capital cities were also more likely to indicate a higher level of support.
There was an overwhelming belief that stem cell research would improve our way of life
in the future (90% reported they thought so). Respondents generally thought that ‘biotechnology’ would also improve our way of life in the future (64%). Sentiments
towards cloning, especially of human embryos was less positively skewed.
There were high levels of agreement that ‘commercial use of genetic modification and its
products should only be allowed after regulatory approval’ (average of 7.3 out of 10);
‘the Australian government should enable the community to participate more in decisions on biotechnology issues including regulation’ (an average of 7.2), and ‘privacy laws
should prevent governments and other organisations from accessing information on people’s genetic make-up’ (an average of 7.1).
10.1.1 Overall support for GM and other biotechnologies
Early in the survey, all respondents were asked to rate their level of support for the use of GM or genetic modification and other biotechnologies on a scale where 0 was
completely against it and 10 was completely supportive. As Figure 21 shows, almost half
of respondents provided high ratings of support (49% providing ratings of 7-10). Over a third provided responses around the middle of the scale (36% 4-6) and only 14%
provided a rating of 0-3. This resulted in a moderate average support rating of 6.1 out of 10.
Towards the end of the survey, respondents were asked the same question. There were no significant differences between the two. These results show that the impact of getting
people to think more about GM and biotechnology than they would usually was minimal.

Community attitudes towards emerging technology issues - Biotechnology
61
Figure 21. Support for GM and other biotechnologies
Q16bi How would you rate your level of support for the use of GM or genetic modification and other
biotechnologies?
Filter: 2012 only AND CATI only; Weighted to population; Total n = 1000
In previous waves of the survey the respondents were asked to rate their support for the
use of genetic modification and other biotechnologies in ‘human health and medical
applications’ and in ‘food and agriculture applications’ separately. In 2010, support for health and medical applications was higher than support for food and agriculture (6.5
compared to 5.4).
When results were analysed by gender, it is not surprising given other findings in this
report and previous research that in 2012, males were more supportive of GM and other biotechnologies than females (6.6 compared to 5.6).
By age, younger respondents were more supportive than older respondents. The response for those aged 16-30 was 6.8 compared to 5.8 among 31-50 year olds and 51-
75 year-olds.
Results by employment status generally reflected findings by age, although those who were doing ‘home duties’ were significantly less likely to be supportive (5.2 compared to
an average of 6.1).
Those who lived in capital cities of Australia were also more supportive of the concept
of biotechnology and GM (6.2 out of 10 compared to 5.9 for those who lived elsewhere).
Support for GM and other biotechnologies was significantly higher among those who
knew enough about biotechnology to explain it to a friend (6.9 compared to 5.7 among those who had not heard of it and 5.9 among those who had heard of it, but knew
little or nothing about it).
As mentioned in the discussion on the segmentation, the differences across the segments that reflect these differences observed in relation to levels of awareness. Segments 1 and
2 had significantly lower levels of support for biotechnologies and GM whereas, Segments 3 and 4 were significantly more positive towards it.

Community attitudes towards emerging technology issues - Biotechnology
62
Figure 22: Support for use of GM and other biotechnologies by segment
Q16bi How would you rate your level of support for the use of GM or genetic modification and other
biotechnologies?
Filter: 2012 ONLY AND CATI ONLY; Weighted to population; base n = 936; Total n = 1000
Note: Excludes don’t know responses
Indicates statistically significant difference compared to those not in that category
10.1.2 Perceptions of ‘biotechnology’s’ impact on way of life in the future
Respondents were asked if they thought a range of different technologies (including
biotechnology in general) would ‘improve, have no effect, or make things worse in the
future’, with results detailed in Figure 23.
Attitudes were most positive towards ‘stem cell research’; with almost all (90%) stating
this would ‘improve’ our way of life in the future. Stem cell research was the category that respondents seemed most sure of compared to the other categories of science
where there was a higher proportion of respondents who could not say whether it would improve the way of life in Australia or make it worse.
Attitudes towards ‘biotechnology’, were largely positive with 64% saying it would improve things in the future and only 3% thinking it would make things worse. However,
it should be noted that one in three (32%) were not sure whether biotechnology would
improve our way of life in the future or not.

Community attitudes towards emerging technology issues - Biotechnology
63
Figure 23. Perceptions of the impact of biotechnologies on the way of life in the future
Q1b Do you think these technologies will generally improve, have no effect, or make things worse in the future?
Filter: 2012 only AND CATI only; Weighted to population; Total n = 1000
For genetic modification, there was a similar story with a skew towards seeing that GM would improve our way of life in the future (50%) rather than make it worse (24%).
Although, again, a substantial proportion of respondents were not sure (22%).
As to cloning, opinions seemed to be more mixed. A slightly higher proportion of
respondents thought the cloning of animals would improve our way of life than make it worse (39% vs. 31%). However, as to the cloning of human embryos the skew was
towards the negative with 41% reporting it would make things worse in the future compared to 30% who thought it would make things better.
Views that stem cell research would improve our way of life in the future have increased
compared to 2010 (from 85% to 89%). For the other categories of science, there were significant decreases in those who thought there would be no effect with a shift to those
saying they could not say if they believed it would make things better or worse. For example in the case of biotechnology, in 2010, 11% thought that biotechnology would
have no effect, with the equivalent figure in 2012, 2%. Those who were not sure of the impact amounted to 24% in 2010 compared to 32% in 2012.9
With the exception of stem cell research, where there were no differences between genders, as we have seen in relation to the level of support for advances in technology
in general, we find males were more likely to think each of the technologies would
improve things in the future and females, significantly more likely to think they would make things worse in the future.
9 To allow comparison with previous waves, 2012 figures in this section include only those aged 18-75, excluding all respondents aged under 18.

Community attitudes towards emerging technology issues - Biotechnology
64
Younger respondents tended to be more optimistic about technology’s ability to change our way of life for the positive with those aged 16-30 more likely to say that they
thought that biotechnology (71%), genetic modification (56%), cloning of human embryos (45%) would improve our way of life in the future.
However, they were less likely to think this of stem cell research than older respondents (85% vs. 92% for those aged 51-75 years old)
In terms of GM, there was a definite city/country divide with those living outside of
capital cities were significantly more likely to say that genetic modification will make things worse in future than those living in state/territory capitals (28% compared to
22%).
Attitudes towards genetic modification also varied by employment status. Those
engaged in ‘home duties’ (25%) were significantly less likely to say it would improve things..
Analysis by segment showed that Segment 4 was the most optimistic about the technologies with the proportion who felt that things would improve outweighing the
proportion who said they would make things worse (See Table 20 and Table 21). Both
Segments 1 and 2 were significantly less likely to think the various biotechnologies would improve our way of life with the balance shifting towards making things worse for genetic
modification, cloning of animals and the cloning of human embryos.
Table 20. Perceive biotechnologies will Improve way of life in the future by
segment
% Improve our way of life Segment 1
Segment 2
Segment 3
Segment 4
Total
Stem cell research 80 87 95 96 90
Biotechnology 46 58 64 83 64
Genetic modification 28 40 51 75 50
Cloning of animals 23 27 42 58 39
Cloning human embryos 21 23 35 40 30
Q1b Do you think these technologies will generally improve, have no effect, or make things worse in the future
(Improve)
Filter: 2012 ONLY AND CATI ONLY; Weighted to population; Total n = 1000
Indicates statistically significant difference compared to those not in that category
Table 21. Perceive biotechnologies will make things worse in the future by segment
% make things worse Segment
1
Segment
2
Segment
3
Segment
4
Total
Stem cell research 5 3 0 0 2
Biotechnology 8 3 1 0 3
Genetic modification 42 30 20 9 24
Cloning of animals 54 38 25 13 31
Cloning human embryos 55 51 36 27 41

Community attitudes towards emerging technology issues - Biotechnology
65
Q1b Do you think these technologies will generally improve, have no effect, or make things worse in the future
(Make worse)
Filter: 2012 ONLY AND CATI ONLY; Weighted to population; Total n = 1000
Indicates statistically significant difference compared to those not in that category
10.2 Attitudes towards biotechnology issues
Respondents to the supplementary online survey were asked for their level of agreement
with a range of statements about biotechnology, on a scale where 0 was strongly
disagree and 10 was strongly agree.
Figure 24. Biotechnology attitudinal statements
Q8i. Can you please say how much you disagree or agree with each of the following statements using a scale
where 0 is strongly disagree and 10 is strongly agree.
Filter: 2012 only AND Online only; Weighted to population; Total n = 1000
As outlined in Figure 24, there were relatively high levels of agreement in relation to:
‘Commercial use of genetic modification and its products should only be allowed
after regulatory approval’ (average of 7.3 out of 10);
‘The Australian government should enable the community to participate more in
decisions on biotechnology issues including regulation’ (an average of 7.2);
‘Privacy laws should prevent governments and other organisations from accessing
information on people’s genetic make-up’ (an average of 7.1);
‘We should reject genetic modification if it reduces Australia’s economic
competitiveness’ (6.6); and
‘The characteristics of plants and animals should only be changed through
traditional breeding methods’ (6.4).

Community attitudes towards emerging technology issues - Biotechnology
66
However, respondents tended to be more divided in their opinions in relation to:
'Australian farms need to be free of genetically modified organisms to stay
financially viable’ (5.7 out of 10);
'We should accept some degree of risk from genetic modification if it enhances
Australia’s economic competitiveness’ (4.5)
‘Australian farms need genetically modified organisms to stay financially viable’
(4.3)
While a different scale was used in 2010, similar to 2012, 76% agreed that ‘the Australian government should enable the community to participate more in decisions on
biotechnology issues’. Similar to 2012, in 2010, there was also widespread agreement that ‘Privacy laws should prevent governments and other organisations from accessing
information on people’s genetic make-up’ (60% agreeing in 2010). In 2010, 45% agreed that ‘the characteristics of plants and animals should only be changed through traditional
breeding methods’.
Economic issues appear to have become more salient in 2012, when comparing to results
from 2010. Four in ten (41%) in 2010 agreed that ‘we should reject genetic modification
if it reduces Australia’s economic competitiveness’ and one in four (27%) agreed ‘Australian farms need to be free of genetically modified organisms to stay financially
viable’.
10.3 Attitudes towards genetically modifying plants
to produce food
Respondents were asked their opinion on the risks vs. benefits of genetically modifying or
using biotechnology in the production of food from plants. The methods where
respondents were most likely to say the benefits outweighed the risks were: ‘modifying the genes of plants to produce food by introducing the genes of a plant of the same
species’ (59%) and ‘using biotechnology in the production of food from plants’ in the general sense (51%). However, there were substantial proportions of the population for
whom it was unclear whether the benefits outweighed the risks, particularly when it came to introducing the genes of an animal or bacterium to a plant in the production of
food.
Again, age and gender were both factors in one’s opinion of the use of biotechnology in
food production. Segment 4 remained the least concerned about modifying the genes of
plants or using biotechnology in the production of food from plants.
The most likely action to allay misgivings of the GM of plants to produce food were long-
term tests of at least 10 years had shown no risks to human health or the environment, and the labelling on the food described what component had been genetically modified,
and why – although in principal these actions would only change the minds of approximately half of respondents who thought the risks outweighed the benefits.
In addition to asking whether respondents had heard of different ways to produce food using biotechnology and/or GM, respondents were also asked if they thought the benefits
outweighed the risks, if the risks outweighed the benefits or the risks equalled the
benefits (See Figure 25 and Figure 26).

Community attitudes towards emerging technology issues - Biotechnology
67
Figure 25. Attitudes towards genetically modifying plants to produce food
Q2ci. I’m going to read out the applications again and for each of them, would you say that: The risks outweigh
the benefits, The risks are equal to the benefits or The benefits outweigh the risks
Filter: 2012 only AND CATI only; Weighted to population; Total n = 600
Figure 26. Attitudes towards genetically modifying plants in the production of
food
Q2ci. I’m going to read out the applications again and for each of them, would you say that: The risks outweigh
the benefits, The risks are equal to the benefits or The benefits outweigh the risks
Filter: 2012 only AND CATI only; Weighted to population; Total n = 600

Community attitudes towards emerging technology issues - Biotechnology
68
As detailed in Figure 25 and Figure 26, for the most part, the balance between risks vs. benefits showed that respondents generally felt that the benefits outweighed the risks. It
is important, to note that with all the uses covered in the survey, there was a high proportion of respondents who said ‘don’t know/can’t say’ suggesting that knowledge of
the implications of genetically modifying plants is still quite low. This is particularly the case in relation to modifying the genes of plants by introducing the genes of an animal or
bacterium to a plant (34% and 33% don’t know respectively). Both uses of GM also had
low levels of awareness (See Figure 9 in Section 9.2.1).
The situations that were perceived to be ‘safer’ where the majority of respondents
thought the benefits outweighed the risks were ‘modifying the genes of plants to produce food by introducing the genes of a plant of the same species’ (59%) and ‘using
biotechnology in the production of food from plants’ in the general sense (51%).
In relation to ‘modifying the genes of plants to produce food by introducing the genes of
a plant of different species’, the most common response was that the benefits outweighed the risks, although only 37% provided this response.
Attitudes towards many of these applications seem to have improved since 2010,
although the question was asked in a slightly different way (‘do you think the following are likely to be risky for society’). Similarly to 2012, in 2010 the only application that the
majority of respondents thought was not likely to be risky for society was ‘modifying the genes of plants to produce food by introducing the genes of a plant of the same species’.
Females tended to be more risk averse when it came to modifying the genes of plants to produce food with fewer saying the benefits outweighed the risks (40% vs. 58%). The
pattern was the same for using biotechnology in the production of food from plants (43% of females felt the benefits outweighed the risks vs. 60% of males).
Queenslanders were less likely than other respondents to say the benefits of modifying
the genes of plants to produce food by introducing the genes of a bacterium to a plant were greater than the risks (35%), although there were no other differences by
location.
As covered in Section 5 outlining the segmentation, there were clear patterns in the
views of risks vs. benefits across the four segments. Segment 2 – the segment most likely to agree that you shouldn’t tamper with nature, tended to be the least likely to say
the benefits outweighed the risks, followed by Segment 1 – the least interested in science and technology (although only just lower than that of Segment 2). Segment 4,
the most supportive of scientific advances, not surprisingly was the most positive
towards the various applications of biotechnology in relation to food followed by Segment 3 which was positive towards science and technology but had a higher protective quality
with the highest agreement protecting children from all risks. Table 22 shows the proportion of those who felt the benefits outweighed the risks.
Table 22: Genetically modifying plants and using biotechnology in the production of food – Benefits outweigh the risk by segment
Column % Segment
1
Segment
2
Segment
3
Segment
4
Total
Modifying the genes of plants to produce
food
Modifying the genes of plants to produce food 28 39 54 73 49

Community attitudes towards emerging technology issues - Biotechnology
69
Column % Segment
1
Segment
2
Segment
3
Segment
4
Total
Modifying the genes of plants to produce food
by introducing the genes of a plant of the same species
44 49 61 81 59
Modifying the genes of plants to produce food
by introducing the genes of a plant of a different species
25 29 37 59 38
Modifying the genes of plants to produce food
by introducing the genes of an animal to a plant 3 9 10 28 12
Modifying the genes of plants to produce food
by introducing the genes of a bacterium to a plant
16 18 25 44 26
Using biotechnology in the production of
food from plants
Using biotechnology in the production of food from plants
31 45 53 78 51
Using biotechnology in the production of food
from plants by changing the genes of a plant without introducing new DNA
22 40 40 66 42
Using biotechnology in the production of food
from plants to assist in conventional breeding 24 42 46 68 45
Q2ci. I’m going to read out the applications again and for each of them, would you say that: The risks outweigh
the benefits, The risks are equal to the benefits or The benefits outweigh the risks
Filter: 2012 only AND CATI only; Weighted to population; Total n = 600
Indicates statistically significant difference compared to those not in that category
10.3.1 Conditions most likely to change opinions relating to genetically modifying plants to produce food
Those who thought the risks of modifying the genes of plants to produce food outweighed
the benefits were asked if they would be more likely to support genetically modifying plants to produce food under a range of different conditions. The results are illustrated in
Table 23.
Table 23. Conditions most likely to change opinions relating to genetically modifying plants to produce food for those who believed the risks outweighed
the benefits
Row % Yes, I would
be more accepting
No, I would
not be more accepting
Don't know
Long-term tests of at least 10 years had shown no risks to
human health or the environment
56 34 10
The labelling on the food described what component had
been genetically modified, and why
47 49 5
It was developed by an Australian company 35 59 6
The food was certified as safe by a government regulator 32 58 11
It was developed by a government funded research body 31 63 7
The food was less expensive 21 74 6

Community attitudes towards emerging technology issues - Biotechnology
70
Row % Yes, I would
be more accepting
No, I would
not be more accepting
Don't know
It was developed by a company based overseas 6 84 10
Q3i Would you be more accepting of modifying the genes of plants to produce food if:
Filter: Risks of modifying genes of plants to produce food outweigh risks; 2012 ONLY AND CATI ONLY;
Weighted to population; Total n = 105
Indicates statistically significant difference compared to those not in that category
Long term risks to human health and the environment seemed to be the greatest misgivings towards using GM in the production of food with 56% reporting they would be
more supportive if long term tests showing there were no risks were available. However, for one in three of this group – this would not change their mind (34%).
‘The labelling on the food described what component had been genetically modified, and
why’ would in principle change the mind of 47% of respondents who thought the risks outweighed the benefits but this was just outnumbered by the 49% who said this would
not change their minds.
Least likely to change the mind of those who felt the risks were greater than the benefits
were if it was developed by a company based overseas (only 6% reported this would change their opinion). Only one in five (21%) were swayed if food was less expensive.
Samples were too small to compare with previous waves of results.
There were no differences by gender as to what conditions would make respondents
more supportive of GM to produce food.
However there were some differences according to the age of respondents. Younger respondents (aged 16-30) were more likely than older respondents to be swayed by:
The labelling on the food described what component had been genetically modified, and why (68%);
It was developed by an Australian company (58%);
The food was certified as safe by a government regulator (58%); and
The food was less expensive (37%).
Those aged 51-75 were significantly less likely to be swayed by long-term tests of at
least 10 years had shown no risks to human health or the environment (41%).
10.4 Attitudes towards growing GM crops in state
Just over half (53%) of respondents reported they were in favour of growing genetically
modified crops in their state – no significant changes were observed in terms of those in favour of GM crops in their state.
Males were more likely to be in favour of GM crops in their state, as were those aged 16-30.
Factors most likely to change the minds of those not in favour of GM crops included: crops provided positive outcomes for the environment or climate change’ (63%), ‘crops

Community attitudes towards emerging technology issues - Biotechnology
71
provided benefits to health’ (62%), or if ‘crops passed stringent health and environment regulations’ (60%). That many farmers wanted to grow GM crops or that growing GM
crops would enhance Australia’s economic competitiveness were least likely to convince respondents to change their minds. Those in favour of GM crops in principal were most
likely to withdraw their support if ‘the health and environmental benefits of the crops could not be established’ or ‘long-term data was not available on the safety of the crops
to humans and to the environment’.
As detailed above in Figure 27, just over half (53%) said they were in favour of growing genetically modified crops in their state. Almost a third (31%) were not in favour, while
16% said they were not sure of their opinion.
Figure 27. In favour of growing GM crops in their state
Q14. Are you in favour of growing genetically modified crops in your state?
Filter: 2012 only AND CATI only; Weighted to population
Compared to previous years, while support in principal has remained stable, there was a significant decrease in the proportion that did not support growing GM crops in their state
(33% compared to 37% in 2007). However, this was matched by an increase in those
who were not sure (16% up from 6% in 2007) (See Figure 28).

Community attitudes towards emerging technology issues - Biotechnology
72
Figure 28. In favour of growing GM crops in state by wave
52
32
16
0
10
20
30
40
50
60
2007 (n=534)
2010 (n=501)
2012 (n=790)
%
Yes
No
Don't know
Q14. Are you in favour of growing genetically modified crops in your state? by Banner - WAVEFilter: CATI only AND Landline only; Weighted to population; Total (2012) n = 790Q14. Are you in favour of growing genetically modified crops in your state?
Filter: 2012 only AND CATI only; Weighted to population
indicates significant difference between 2010 and 2012 surveys
There were no significant differences by location – respondents in all states were relatively similar in their support for growing GM crops in their state. Neither were there
any differences between those who lived in capital cities compared to those who lived in other locations.
Consistent with previous findings in relation to gender, at the overall level, males were more likely to be supportive of growing GM crops in their state than females (64%
compared to 42%).
Findings by age were also consistent with other findings in this report, with those aged
16-30 significantly more likely than all others to say they were in support of GM crops
and those aged 51-75 significantly less likely to say the same (64% compared to 48%).
As would also be expected, those who thought biotechnology would make things
worse in future were significantly less likely to say ‘yes’ (33% compared to an average of 53%).
Those who believed GM crops were already allowed to be grown in their state were also more likely to support growing GM crops in their state (58% compared to 53%).
Segment differences showed that consistent with their general support for science and technology, Segment 1 was least likely to be in favour of growing GM crops in their state,
followed by Segment 2 (32% and 42%) respectively. Segment 3 was more moderate in
its support at 56% in favour. Eight in ten respondents in Segment 4 was in favour of growing GM crops in their state.

Community attitudes towards emerging technology issues - Biotechnology
73
Table 24. In favour of growing GM crops in their state
% Segment 1
Segment 2
Segment 3
Segment 4
Total
Yes 32 42 56 80 53
No 50 39 27 9 31
Don't know 18 19 16 11 16
Q14. Are you in favour of growing genetically modified crops in your state? by SEGMENT
Filter: 2012 ONLY AND CATI ONLY; Weighted to population; base n = 999; Total n = 1000
Indicates statistically significant difference compared to those not in that category
Respondents who were not in favour or were not sure of their opinion were asked
whether a series of factors would change their minds. The factors that were most likely to change the minds of not in favour of GM crops in their state included if ‘crops provided
positive outcomes for the environment or climate change’ (63%), ‘crops provided benefits to health’ (62%), or if ‘crops passed stringent health and environment
regulations’ (60%).
Factors that had the least influence included if ‘there was evidence that many farmers
wanted to plant GM crops’ (35%), or if ‘there was evidence that it would enhance Australia’s economic competitiveness’ (38%).
Figure 29. Whether factors would change the minds of those not in favour of GM
crops in their state
Q15. Would you be in favour of growing genetically modified crops in your state if...?
Filter: 2012 ONLY AND CATI ONLY; Weighted to population; Total n = 471
Among those who were already supportive, support was most likely to be removed when
‘the health and environmental benefits of the crops could not be established’ (77% would

Community attitudes towards emerging technology issues - Biotechnology
74
not be in favour of GM crops in their state) or ‘long-term data was not available on the safety of the crops to humans and to the environment’ (77%). More than half of
respondents who were in favour or were not sure of GM crops in principal, reported they would not be in favour of GM crops if ‘there was evidence that very few farmers wanted
to plant genetically modified crops’ (69%); or ‘there was evidence that it would diminish Australia’s economic competitiveness (53%) (See Figure 30).
Figure 30. Whether factors would change the minds of those in favour of GM
crops in their state
Q15. Would you be in favour of growing genetically modified crops in your state if...?
Filter: 2012 only AND CATI only; Weighted to population; Total n = 688
10.5 Attitudes towards GM foods
Respondents were asked to rate the how much they valued a number of common objectives of genetically modifying food. The objectives that were most likely to be
valued was making food was healthier.
Females and younger respondents, and Segment 4 were all significantly more likely to
value making food healthier, cheaper, last longer and taste better. Segment 2 was the
segment least likely to value any of the objectives of genetically modifying food.
While there was a high willingness to eat organic food, the willingness to eat food that
had some form of scientific intervention was significantly lower. Willingness was lowest for meat and other products that came from genetically modified animals, off-spring of
cloned animals or cloned animals themselves.
As would be expected, females were much more cautious about what they would ingest.
Those with higher levels of support for biotechnology or believed biotechnology would improve our way of life in the future were both more willing to eat all the food types
covered in the survey.

Community attitudes towards emerging technology issues - Biotechnology
75
10.5.1 Value placed on objectives of genetically modifying
plants to produce food
All respondents were asked to rate the degree to which a range objectives associated with genetically modifying plants to produce food, was valuable to individuals and society
using a scale where 0 was not valuable at all and 10 was extremely valuable. Results are
illustrated in Figure 31.
Modifying plants to produce food was perceived to be most valuable if it meant ‘the food
was healthier’ (an average support rating of 7.0), followed by if the food was ‘cheaper’ (6.3). The majority provided high ratings of 7-10 for both of these objectives (67% and
55%, respectively).
Half (50%) provided high ratings in relation to the value of making ‘the food last longer’
(an average score of 5.9), but respondents were more divided in relation to the value making ‘the food taste better’ with approximately a third saying 0-3 (32%), 4-6 (34%)
and 7-10 (34%), resulting in an average score of 5.0.
Figure 31. Value of objectives of genetically modifying plants to produce food
Q4i. Now I’m going to ask you about different objectives of genetically modifying plants to produce food. I’d like
you to tell me how valuable you feel these objectives are to individuals or society using the scale where 0 is not
valuable at all and 10 is extremely valuable. If you are not sure or can’t say, please just say so.
Filter: 2012 only AND CATI only; Weighted to population; Total n = 1000
In 2010, the question was asked with a different scale (five points from ‘not at all valuable’ to ‘very valuable’). While a direct comparison cannot be made with regards to
ratings of value, it is interesting to note that the order of objectives from most valuable to least valuable has changed in 2012. In 2010, making ‘the food healthier’ was also
seen to be the most valuable (82% rating it either very valuable or somewhat valuable), but this was followed by making ‘the food last longer’, then making it ‘cheaper’ and
lastly, ‘taste better’.

Community attitudes towards emerging technology issues - Biotechnology
76
In terms of gender, males rated the value of all four objectives significantly higher than females, as detailed below in Table 25.
Those aged 16-30 rated all objectives as more valuable than all other age groups, while those aged 31-50 rated all objectives as having less value. Those aged 51-75 did not
deviate from the average on these measures. See Table 25, below.
Table 25. Value of objectives genetically modifying food by gender and age
Average out of 10 (0-
10 scale Not valuable
at all/Extremely valuable)
Gender Age
Male Female 16- 30 years 31- 50 years 51 – 75
years
The food was healthier 7.3 6.7 7.7 6.6 7.0
The food cheaper 6.7 6.0 6.9 6.0 6.2
The food last longer 6.4 5.3 6.7 5.4 5.8
The food taste better 5.4 4.7 5.4 4.6 5.1
Q4i How valuable to individuals or society is genetically modifying plants to make (food) (average)
Filter: 2012 ONLY AND CATI ONLY; Weighted to population; Total n = 1000
Indicates statistically significant difference compared to those not in that category
Those who stated ‘home duties’ as their employment status were significantly less likely than all others to value making ‘the food last longer’, while students were
significantly more likely to value this (4.6 and 6.6, respectively).
Those with children under 10 at home also rated the value of genetically modifying
food to make the ‘food last longer’ or ‘taste better’ lower than those who did not have children under 10 at home (5.5 compared to 6.0 and 4.7 compared to 5.2, respectively).
Looking at the segmentation unlike other findings where Segment 1 typically had the
lowest ratings, it was Segment 2 that was least likely to value any of the objectives of genetically modifying plants to produce food. The objective most valuable to Segment 1
was making food healthier. However, the degree to which they thought this was valuable was still significantly lower compared those not in Segment 1. Both Segment 3 and 4
valued the objectives more than the other two segments (See Table 26).
Table 26. Value of objectives genetically modifying food by segment
Average out of 10 (0-10 scale Not
valuable at all/Extremely valuable)
Segment
1
Segment
2
Segment
3
Segment
4
Total
The food was healthier 6.6 6.2 7.5 7.7 7.0
The food cheaper 6.1 5.5 6.6 7.0 6.3
The food last longer 5.5 5.1 6.1 6.8 5.9
The food taste better 5.1 4.2 5.4 5.3 5.0
Q4i How valuable to individuals or society is genetically modifying plants to make (food) (average)
Filter: 2012 ONLY AND CATI ONLY; Weighted to population; Total n = 1000
Indicates statistically significant difference compared to those not in that category

Community attitudes towards emerging technology issues - Biotechnology
77
10.5.2 Willingness to eat different foods
Respondents to the supplementary online survey were asked the likelihood they would eat a range of foods involving different levels of genetic modification on a scale where 0
meant extremely unwilling and 10 meant extremely willing. As outlined in Figure 32, respondents were most likely to say that they would be willing to eat ‘organic food’
(average of 7.8).
Figure 32. Willingness to eat different foods
Q7 (Online) How unwilling or willing would you be to eat
Filter: 2012 ONLY AND Online only; Weighted to population; Total n = 1000
Willingness to eat all other forms of food was much lower. There was a very even split
along the scale in relation to the following uses of genetically modified foods resulting in moderate levels of willingness to eat:
‘Food containing preservatives’ (average ‘willingness to eat’ rating of 5.0)
‘Processed foods such as cakes or biscuits that contain only a small amount of
genetically modified ingredients’ (4.9)
'Processed foods such as bread or soy milk, that has been made from genetically modified crops’ (4.7)
‘Genetically modified fruit and vegetables’ (4.6)
'Meat and other products from animals that have been fed with genetically modified
stock feed’ (4.5)
'Food grown with the use of pesticides’ (4.3)
Support was lowest for food involving genetically modifying or cloning animals:

Community attitudes towards emerging technology issues - Biotechnology
78
'Meat and other products from genetically modified animals (45% providing low support ratings, an average of 4.0);
'Meat and other products from the offspring of cloned animals (49% providing low support ratings, an average of 3.8)
'Meat and other products from cloned animals’ (50% providing low support ratings, an average of 3.8).
When the results are analysed by gender, it appears that females are far more cautious,
at least in theory, about what they eat than males. Females were significantly less likely to say they were willing to eat all forms of foods, with the exclusion of ‘organic food’
which they were significantly more likely to say they would eat. These results are further detailed below in Table 27.
Table 27. Willingness to eat different foods by gender
Average out of 10 (0-10 scale Extremely unwilling /Extremely willing)
Male Female
Food containing preservatives 5.4 4.6
Processed foods such as cakes or biscuits that contain only a small amount
of genetically modified ingredients 5.5 4.4
Processed foods such as bread or soy milk, that has been made from
genetically modified crops 5.2 4.1
Genetically modified fruit and vegetables 5.2 3.9
Meat and other products from animals that have been fed with genetically modified stock feed
5.2 3.8
Food grown with the use of pesticides 4.9 3.7
Meat and other products from genetically modified animals 4.8 3.1
Meat and other products from the offspring of cloned animals 4.9 2.8
Meat and other products from cloned animals 4.8 2.7
Food containing preservatives 5.4 4.6
Q7 (Online) How unwilling or willing would you be to eat
Filter: 2012 ONLY AND Online only; Weighted to population; Total n = 1000
Indicates statistically significant difference compared to those not in that category
There were few variations by age, although those aged 16-30 were significantly more willing to eat food containing preservatives (5.3).
Employment status was strongly correlated with willingness to eat foods involving scientific intervention, with those who were employed rating their willingness to eat all
foods (with the exception of those containing preservatives or organic food) significantly
higher and those doing ‘home duties’ rating their willingness significantly lower. These results are detailed below in Table 28.

Community attitudes towards emerging technology issues - Biotechnology
79
Table 28. Willingness to eat different foods by employment status
Average out of 10 (0-10 scale
Extremely unwilling /Extremely willing)
Employed (PT/FT/Self)
Retired or Pensioner
Home duties
Student Unemployed
Organic food 7.9 7.6 7.7 7.9 7.7
Food containing preservatives 5.1 4.9 4.4 5.2 5.1
Processed foods such as cakes or biscuits
that contain only a small amount of genetically modified ingredients
5.2 5.1 4.0 5.2 4.1
Processed foods such as bread or soy
milk, that has been made from
genetically modified crops
4.9 4.9 3.5 4.9 4.3
Genetically modified fruit and vegetables 4.8 4.8 3.6 4.6 4.1
Meat and other products from animals
that have been fed with genetically modified stock feed
4.7 4.8 3.5 4.7 4.3
Food grown with the use of pesticides 4.6 4.4 3.4 4.5 3.6
Meat and other products from genetically
modified animals
4.2 4.3 2.8 4.0 4.0
Meat and other products from the offspring of cloned animals
4.1 4.0 2.6 3.8 3.9
Meat and other products from cloned animals
4.0 4.0 2.4 3.8 3.9
Q7 (Online) How unwilling or willing would you be to eat
Filter: 2012 ONLY AND Online only; Weighted to population; Total n = 1000
Indicates statistically significant difference compared to those not in that category
Further, those with children under 10 at home rated their willingness to eat ‘Meat and
other products from the offspring of cloned animals’ significantly lower than those
without (3.4 compared to 4.0).
As would be expected, those more supportive of biotechnology and those who thought it
would improve our way of life in the future were significantly more willing on average to eat all of the listed foods, while those with the lowest level of support and those who
thought biotechnology would make things worse were significantly less willing. See Table 29, below.
Table 29. Willingness to eat different foods by awareness and attitudes
Average out of 10 (0-10 scale
Extremely unwilling /Extremely
willing)
Impact of biotechnology on our future
Level of support for biotechnology
Improve
our way
of life in
the future
Have
no effect
Make
things
worse
in the future
0-3 out of 10
4-6 out of 10
7-10
out of 10
Organic food 8.2 6.6 6.9 7.7 7.7 8.1
Food containing preservatives 5.3 4.6 4.0 3.6 4.8 5.8
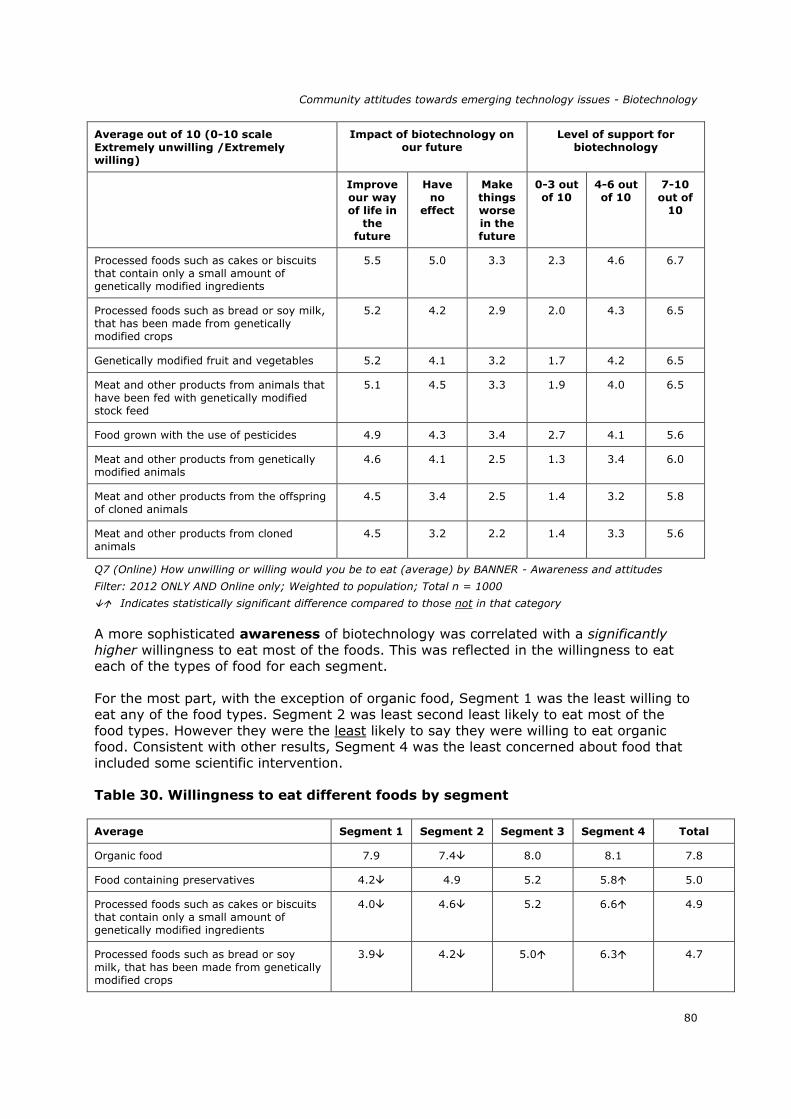
Community attitudes towards emerging technology issues - Biotechnology
80
Average out of 10 (0-10 scale
Extremely unwilling /Extremely willing)
Impact of biotechnology on
our future
Level of support for
biotechnology
Improve
our way
of life in
the future
Have
no effect
Make
things
worse
in the future
0-3 out
of 10
4-6 out
of 10
7-10
out of 10
Processed foods such as cakes or biscuits
that contain only a small amount of genetically modified ingredients
5.5 5.0 3.3 2.3 4.6 6.7
Processed foods such as bread or soy milk,
that has been made from genetically modified crops
5.2 4.2 2.9 2.0 4.3 6.5
Genetically modified fruit and vegetables 5.2 4.1 3.2 1.7 4.2 6.5
Meat and other products from animals that
have been fed with genetically modified stock feed
5.1 4.5 3.3 1.9 4.0 6.5
Food grown with the use of pesticides 4.9 4.3 3.4 2.7 4.1 5.6
Meat and other products from genetically modified animals
4.6 4.1 2.5 1.3 3.4 6.0
Meat and other products from the offspring
of cloned animals
4.5 3.4 2.5 1.4 3.2 5.8
Meat and other products from cloned
animals
4.5 3.2 2.2 1.4 3.3 5.6
Q7 (Online) How unwilling or willing would you be to eat (average) by BANNER - Awareness and attitudes
Filter: 2012 ONLY AND Online only; Weighted to population; Total n = 1000
Indicates statistically significant difference compared to those not in that category
A more sophisticated awareness of biotechnology was correlated with a significantly
higher willingness to eat most of the foods. This was reflected in the willingness to eat each of the types of food for each segment.
For the most part, with the exception of organic food, Segment 1 was the least willing to eat any of the food types. Segment 2 was least second least likely to eat most of the
food types. However they were the least likely to say they were willing to eat organic food. Consistent with other results, Segment 4 was the least concerned about food that
included some scientific intervention.
Table 30. Willingness to eat different foods by segment
Average Segment 1 Segment 2 Segment 3 Segment 4 Total
Organic food 7.9 7.4 8.0 8.1 7.8
Food containing preservatives 4.2 4.9 5.2 5.8 5.0
Processed foods such as cakes or biscuits
that contain only a small amount of genetically modified ingredients
4.0 4.6 5.2 6.6 4.9
Processed foods such as bread or soy
milk, that has been made from genetically modified crops
3.9 4.2 5.0 6.3 4.7

Community attitudes towards emerging technology issues - Biotechnology
81
Average Segment 1 Segment 2 Segment 3 Segment 4 Total
Genetically modified fruit and vegetables 3.5 4.2 4.9 6.3 4.6
Meat and other products from animals
that have been fed with genetically modified stock feed
3.4 4.2 4.8 6.4 4.5
Food grown with the use of pesticides 3.5 4.3 4.5 5.4 4.3
Meat and other products from genetically
modified animals
3.0 3.6 4.2 5.8 4.0
Meat and other products from the
offspring of cloned animals
2.8 3.4 3.9 6.0 3.8
Meat and other products from cloned animals
2.7 3.4 3.8 6.1 3.8
Q7 (Online) How unwilling or willing would you be to eat (average)
Filter: 2012 ONLY AND Online only; Weighted to population; Total n = 1000
Indicates statistically significant difference compared to those not in that category
10.6 Attitudes towards biotechnology applications in medicine and medical research
Respondents tended to be more accepting that the benefits of the applications of biotechnology in medical contexts were greater than the risks compared to their views on
GM and biotechnology use in food or agricultural applications.
Applications where respondents were more likely to see benefits outweighing the risks
included using genetic information in medical research to study human disease in the
laboratory or to design vaccines against new or existing diseases as well as using stem cells to conduct medical research and treat disease in general.
10.6.1 Attitudes towards using genetic information in medical research
Respondents were asked their views on the risks and benefits of using biotechnology in medical contexts including the use of genetic information in medical research and the use
of stem cells in research and to treat disease.
There was a relatively high recognition of the benefits of using genetic information in
medical research, as shown above in Figure 33. Compared to the views in relation to
modifying the genes of plants to produce food, and using biotechnology in the production of food (See Figure 26), it was clear that respondents saw the benefits of using
biotechnology in medical context outweighed the risks.
Respondents were most likely to say the benefits outweighed the risks in relation to
‘using genetic information in medical research to study a human disease in the laboratory’ (86%), closely followed by ‘using genetic information in medical research to
design vaccines against new or existing diseases’ (85%). Around two-thirds also thought the benefits of ‘using genetic information in medical research to study a human disease
in animals’ and ‘using genetic information in medical research to tailor a person’s
healthcare based on their genetic make-up’ outweighed the benefits (66% and 61%, respectively).

Community attitudes towards emerging technology issues - Biotechnology
82
Figure 33 Attitudes towards using genetic information in medical research
Q2ci Benefits/Risks of (Using genetic information in medical research)
Filter: 2012 only AND CATI only; Weighted to population; Total n = 601
In 2010, two in five (40%) thought the same in relation to ‘using genetic information in
medical research to study a human disease in animals’, 30% in relation to ‘using genetic information in medical research to design vaccines against new or existing diseases’ and
28% in relation to ‘using genetic information in medical research to tailor a person’s
healthcare based on their genetic make-up’ or ‘using genetic information in medical research to study a human disease in the laboratory’ was likely to be risky for society.
As to differences between genders, females were more cautious in relation to using genetic information in medical research to study a human disease in animals with fewer
feeling that the benefits outweighed the risks (60% vs. 72% for males).
While older respondents seemed to be more conservative in their views towards the
benefits of science and technology, when it came to perceptions of risks vs. benefits of using biotechnology in a medical context, older respondents were more likely to say they
felt the benefits outweighed the risks a number of the applications covered. Older
respondents were more likely to think the benefits of this outweighed the risks when using genetic information to study a human disease in animals (72% of those aged 51-75
believed this). This group was also more likely to think that the benefits of using genetic information in medical research to design vaccines against new or existing diseases
outweighed the risks (91%).
Views towards using genetic information for medical research and to treat disease for
each of the segments was in line with other findings for the segments. Segment 4 were most likely to say the benefits were greater than the risks across the board. Segment 1 –
the least positive towards science and technology was the most conservative in their
views with the exception of using genetic information in medical research to tailor a person’s healthcare based on their genetic make-up where Segment 2 was least likely to
say the risks outweighed the benefits (See Table 31). It should also be noted that

Community attitudes towards emerging technology issues - Biotechnology
83
Segment 1 was also the most likely to reserve their judgement providing don’t know responses to many of the applications listed.
Table 31. Using genetic information in medical research – benefits vs. risks by segment
Segment
1
Segment
2
Segment
3
Segment
4
Total
% Benefits outweigh risk
Using genetic information in medical research 62 68 81 92 76
Using genetic information in medical research to study a human disease in the laboratory
76 83 88 95 86
Using genetic information in medical research
to design vaccines against new or existing diseases
76 80 87 94 85
Using genetic information in medical research
to study a human disease in animals
51 57 68 86 66
Using genetic information in medical research
to tailor a person’s healthcare based on their genetic make-up
57 54 62 72 61
% Risks outweigh benefits
Using genetic information in medical research 8 6 2 0 4
Using genetic information in medical research
to study a human disease in the laboratory
6 5 2 1 3
Using genetic information in medical research
to study a human disease in animals
16 12 8 3 9
Using genetic information in medical research
to design vaccines against new or existing diseases
4 5 3 1 3
Using genetic information in medical research
to tailor a person’s healthcare based on their genetic make-up
9 16 11 8 11
% Don’t know/can’t say
Using genetic information in medical research 18 14 10 3 11
Using genetic information in medical research
to study a human disease in the laboratory
11 8 7 1 7
Using genetic information in medical research to study a human disease in animals
20 17 14 6 14
Using genetic information in medical research
to design vaccines against new or existing diseases
11 9 5 1 6
Using genetic information in medical research
to tailor a person’s healthcare based on their genetic make-up
25 19 15 10 17
Q2ci Benefits/Risks of (Using genetic information in medical research)
Filter: 2012 only AND CATI only; Weighted to population; Total n = 601
Note: above excludes % risks equal to benefits
Indicates statistically significant difference compared to those not in that category

Community attitudes towards emerging technology issues - Biotechnology
84
10.6.2 Attitudes towards using stem cell to conduct medical
research and treat disease
Respondents were also asked about the risks vs. benefits of using stem cells in medical research and to treat disease. Similar to the views of the use of genetic information for
medical purposes, the majority of respondents felt the benefits outweighed the risks.
Four in five (80%) thought that the benefits outweighed the risks in relation to ‘using stems cells to conduct medical research and treat disease’. Results were less positive
when the type of stem cells were elaborated, with 66% saying that the benefits of ‘using stem cells to conduct medical research and treat disease using non-embryonic cord or
adult stem cells’ outweighed the risks, while slightly fewer thought he same in relation to ‘using stem cells to conduct medical research and treat disease using embryonic stem
cells’ (62%) (See Figure 34).
Figure 34. Attitudes towards using stem cells to conduct medical research
Q2ci Benefits/Risks of (Using stem cells to conduct medical research and treat disease)
Filter: 2012 only AND CATI only; Weighted to population; Total n = 601
In previous waves respondents were asked whether they thought these applications
would be risky for society. In 2010, 29% thought that ‘using stems cells to conduct medical research and treat disease’ would be risky for society. Twenty-eight percent
thought the same in relation to using stem cells to conduct medical research and treat disease using non-embryonic, cord or adult stem cells’, while thirty-nine percent thought
that ‘using stem cells to conduct medical research and treat disease using embryonic
stem cells’ was likely to be risky for society.
As with using genetic information for medical uses, older respondents tended to view
using stem cells to conduct medical research and treat disease more favourably than younger respondents. For example, those aged 51-75 were also significantly more likely
to say the benefits outweighed the risks (86%).

Community attitudes towards emerging technology issues - Biotechnology
85
Employment status also had some impact on views on the use of biotechnology in medical contexts. In relation to using stem cells for medical research or to treat disease,
those who were employed in some form were more likely to say they thought the benefits were greater than the risks (84%). They were also more likely to say the
benefits of using non-embryonic stem cells for the same purpose outweighed the risks (69%).
Those who spoke a language other than English at home were also more likely to be
in support of using stem cells for medical research and to treat disease (82% vs. 66% of those who only spoke English thought the benefits outweighed the risks). The same could
be said with regards to using both embryonic (64%) and non-embryonic stem cells (70%) where those who spoke a language other than English were more likely to think
the benefits were greater than the risks.
The analysis by Segment shows that again, Segment 1 was the least likely to report the
benefits outweighed the risks when it came to stem cell research and Segment 4 the most supportive of the practice in general as well as with embryonic and non-embryonic
stem cells. Notably, Segment 1 – which was the segment least likely to have children
under 10 at home, was the segment that was most likely to report the risks of using embryonic stem cells to conduct medical research was greater than the benefits.
Table 32. Using stem cells in medical research – benefits vs. risks by segment
Segment 1
Segment 2
Segment 3
Segment 4
Total
% Benefits outweigh risks
Using stem cells to conduct medical research
and treat disease
64 70 88 93 80
Using stem cells to conduct medical research
and treat disease using non-embryonic, cord or adult stem cells
47 63 69 84 66
Using stem cells to conduct medical research and treat disease using embryonic stem cells
46 56 69 73 62
% Risks outweigh benefits
Using stem cells to conduct medical research
and treat disease
7 4 3 1 3
Using stem cells to conduct medical research
and treat disease using non-embryonic, cord or adult stem cells
11 4 2 1 4
Using stem cells to conduct medical research and treat disease using embryonic stem cells
13 16 5 6 10
Q2ci Benefits/Risks of (Using stem cells to conduct medical research and treat disease)
Filter: 2012 only AND CATI only; Weighted to population; Total n = 601
Note: above excludes % risks equal to benefits
Indicates statistically significant difference compared to those not in that category

Community attitudes towards emerging technology issues - Biotechnology
86
10.7 Attitudes towards using genetic modification in animals
Attitudes towards the two uses of GM in animals was lower compared to the medical applications of using genetic information and stem cells, however those who saw the
benefits outweighing the risks still outnumbered those who viewed the opposite.
Respondents were asked whether they thought the benefits outweigh the risks in relation to two ways of using genetic modification in animals.
As shown in Figure 32, although the number who felt the benefit outweighed the risk was lower than that for the uses of genetic information and stem cells for medical purposes,
approximately half thought that the benefits outweighed the risks in relation to ‘using genetic modification to grow human tissue or organs in animals for human transplants’
(54%) and ‘using genetic modification of introduced pests to reduce their numbers’. It was clear that there were a greater number of respondents who though the risks were
equal to the benefits, or outweighed the benefits than for the use of genetic information
and stem cells for medical purposes.
Figure 35. Attitudes towards using genetic modification in animals
Q2ci Benefits/Risks of (using genetic modification)
Filter: 2012 only AND CATI only; Weighted to population; Total n = 599
In previous waves respondents were asked whether they thought these applications would be risky for society. In 2010, over half (58%) thought that ‘using genetic
modification to grow human tissue or organs in animals for human transplants’ was likely to be risky for society. A similar proportion (60%) thought the same of ‘using genetic
modification in the control of introduced pest animals’.
There were some gender differences with females more likely to think the risks outweighed the benefits when using genetic modification to grow human tissue or organs
in animals for human transplants (24% vs. 14%). Females also felt the risk of using GM in pests to reduce their number was greater than the benefits (22% vs. 15%).

Community attitudes towards emerging technology issues - Biotechnology
87
Employment status was also a factor with those employed more likely to think the benefits of using GM for both purposes outweighed the risks (57% for growing human
tissue and organs in animals and 54% for using GM in introduced pests).
While there was differences between those who lived in capital cities vs. those who did
not, respondents from Victoria were significantly more likely than other respondents to say the benefits of using GM to grow human tissue and organs in animals was greater
than the risk (61%).
Segment differences are consistent with other findings with the segment most likely to agree that you shouldn’t tamper with nature, Segment 1, the least likely to state the
benefits outweighed the risk. As expected, Segment 4 was most likely to see the benefit in both uses of genetic modification.
Table 33. Attitudes towards using genetic modification in animals by segment
% Benefits outweigh risk Segment 1
Segment 2
Segment 3
Segment 4
Total
Using genetic modification to grow human
tissue or organs in animals for human transplants
38 42 56 74 54
Using genetic modification of introduced pests
to reduce their numbers
36 43 51 65 50
% Risks outweigh benefits
Using genetic modification to grow human
tissue or organs in animals for human transplants
35 24 16 6 19
Using genetic modification of introduced pests to reduce their numbers
29 24 18 7 19
% Don’t know/can’t say
Using genetic modification to grow human
tissue or organs in animals for human transplants
16 14 12 10 13
Using genetic modification of introduced pests
to reduce their numbers
15 18 18 11 16
Q2ci Benefits/Risks of (using genetic modification)
Filter: 2012 only AND CATI only; Weighted to population; Total n = 599
Note: above excludes % risks equal to benefits
Indicates statistically significant difference compared to those not in that category
Section 11 Attitudes towards regulatory bodies and key players
Perceptions of the rigorousness and compliance with GM regulation in relation to food and agriculture was moderate. In contrast, the views of the rigorousness and compliance
of regulation relating to genetic modification in medical research were significantly
higher.
Unprompted, respondents were mostly unable to name who regulated GM and other
biotechnologies in Australia. When prompted, awareness was highest for Food Standards

Community attitudes towards emerging technology issues - Biotechnology
88
Australia New Zealand (FSANZ) (61% aware), followed by the Therapeutic Goods Administrator (TGA) (56%).
Levels of trust in what all organisations say about the risks and benefits of biotechnology tended to be slightly lower than levels of trust in the organisations more generally.
Among those who were aware of the organisations, trust was highest among those who were aware of National Health and Medical Research Council (NH&MRC).
11.1 Perceptions of rigorousness and compliance of
GM regulation
11.1.1 Regulations on the use of genetic modification or GM in
agriculture and food production
Respondents were asked the degree to which they agreement with two statements about
the regulation of GM on a scale where 0 was strongly disagree and 10 was strongly agree.
As illustrated in Figure 36, agreement with both statements tended towards the positive
side of the scale, although respondents were more likely to agree that regulations on GM are complied with than that they are sufficiently rigorous. Agreement with the statement
‘regulations on the use of genetic modification or GM in agriculture and food production are complied with’ averaged 6.6 out of 10, while agreement that ‘regulations on the use
of genetic modification or GM in agriculture and food production are sufficiently rigorous’ averaged to 6.1 out of 10. However, it should be noted that more than a quarter of
respondents did not feel well informed enough to say whether regulation was sufficient.
Figure 36. Perceptions of GM regulation in agriculture and food production
Q10i. For your information, the government sets rules that regulate the use of GM or genetic modification and
other biotechnologies. I am going to read you some statements and for each one, please tell me whether you
disagree or agree with the statement using a scale where 0 is strongly disagree and 10 is strongly agree. If you
can’t say or don’t know, please just say so.

Community attitudes towards emerging technology issues - Biotechnology
89
Filter: 2012 only AND CATI only; Weighted to population; Total n = 1000
A different scale was used in the 2010 version of the survey (5 points from disagree strongly to agree strongly) so direct comparisons cannot be made. However, agreement
with both statements that regulations are sufficiently rigorous only 27% in 2010, and agreement that they are complied with 45%.
In 2012, as to gender differences, males were significantly more likely to agree that
‘regulations on the use of genetic modification or GM in agriculture and food production are sufficiently rigorous’ (6.4 compared to 5.9), although there were no differences by
gender in relation to compliance.
By age, 16-30 year olds were significantly more likely than all others to agree with both
statements (6.7 in relation to rigorousness and 7.1 in relation to compliance), while those aged 51-75 were significantly less likely to agree (5.8 and 6.3, respectively).
Further, those who lived in capital cities were significantly more likely to agree that ‘regulations on the use of genetic modification or GM in agriculture and food production
are sufficiently rigorous’ (6.3 compared to 5.8), but there was no difference in relation to
compliance.
Segment 4 was significantly more confident that in both the rigorousness of regulation
(6.9) and the degree of compliance (7.1), while Segment 2 was significantly less confident (5.7 and 6.1 for regulation and compliance respectively). Further, Segment 2
was less confident in regulations while Segment 3 was more confident in compliance.
Table 34. Agreement that GM regulations in food production are sufficiently
rigorous and complied with by attitudes
Average out of 10 (0-10 Strongly agree/Strongly disagree scale)
Segment 1
Segment 2
Segment 3
Segment 4
Total
Regulations on the use of genetic
modification or GM in agriculture and food production are sufficiently rigorous
5.7 5.7 6.3 6.9 6.1
Regulations on the use of genetic
modification or GM in agriculture and food production are complied with
6.2 6.1 6.9 7.1 6.6
Q10i. For your information, the government sets rules that regulate the use of GM or genetic modification and
other biotechnologies. I am going to read you some statements and for each one, please tell me whether you
disagree or agree with the statement using a scale where 0 is strongly disagree and 10 is strongly agree. If you
can’t say or don’t know, please just say so.
Filter: 2012 only AND CATI only; Weighted to population; Total n = 1000
Indicates statistically significant difference compared to those not in that category
There were no differences by awareness of biotechnology, but some differences by
support for biotechnology and GM. As outlined below in Table 35, those with the highest level of support for biotechnology were significantly more likely to agree that GM
regulations are sufficiently rigorous and complied with compared to all others. The same
was true of those who were in favour of growing genetically modified crops in their state.
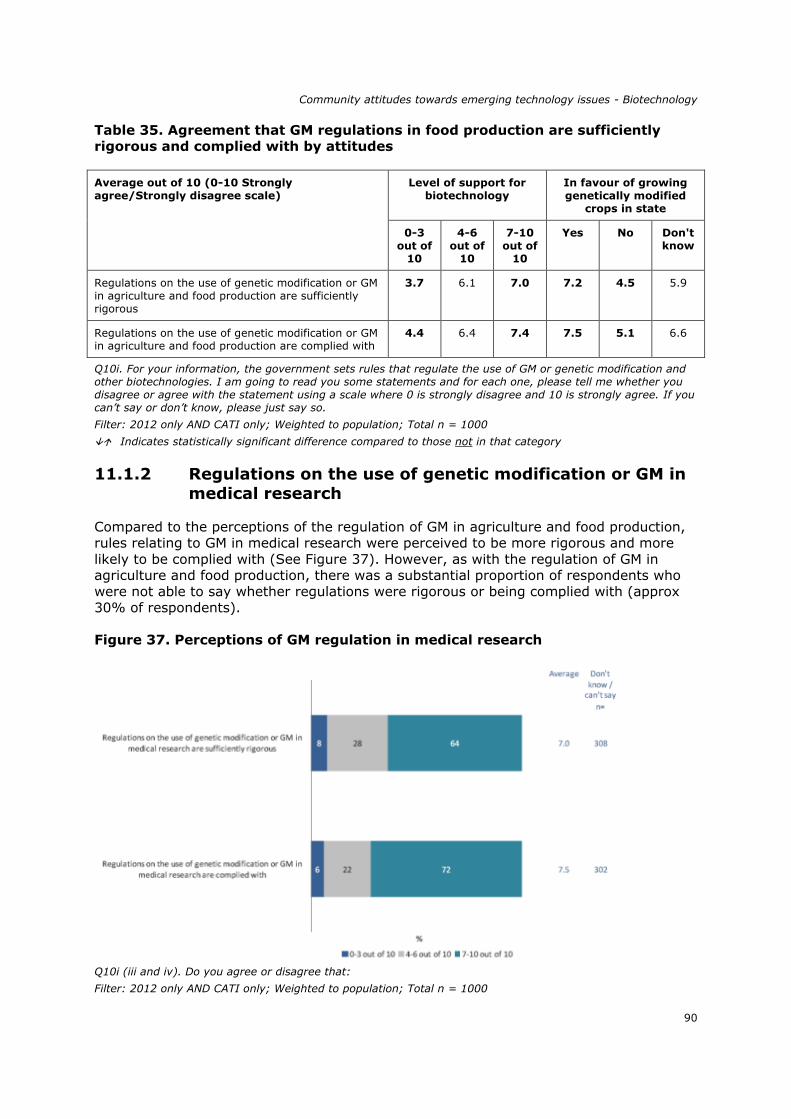
Community attitudes towards emerging technology issues - Biotechnology
90
Table 35. Agreement that GM regulations in food production are sufficiently rigorous and complied with by attitudes
Average out of 10 (0-10 Strongly
agree/Strongly disagree scale)
Level of support for
biotechnology
In favour of growing
genetically modified crops in state
0-3
out of 10
4-6
out of 10
7-10
out of 10
Yes No Don't
know
Regulations on the use of genetic modification or GM
in agriculture and food production are sufficiently
rigorous
3.7 6.1 7.0 7.2 4.5 5.9
Regulations on the use of genetic modification or GM in agriculture and food production are complied with
4.4 6.4 7.4 7.5 5.1 6.6
Q10i. For your information, the government sets rules that regulate the use of GM or genetic modification and
other biotechnologies. I am going to read you some statements and for each one, please tell me whether you
disagree or agree with the statement using a scale where 0 is strongly disagree and 10 is strongly agree. If you
can’t say or don’t know, please just say so.
Filter: 2012 only AND CATI only; Weighted to population; Total n = 1000
Indicates statistically significant difference compared to those not in that category
11.1.2 Regulations on the use of genetic modification or GM in medical research
Compared to the perceptions of the regulation of GM in agriculture and food production, rules relating to GM in medical research were perceived to be more rigorous and more
likely to be complied with (See Figure 37). However, as with the regulation of GM in agriculture and food production, there was a substantial proportion of respondents who
were not able to say whether regulations were rigorous or being complied with (approx 30% of respondents).
Figure 37. Perceptions of GM regulation in medical research
Q10i (iii and iv). Do you agree or disagree that:
Filter: 2012 only AND CATI only; Weighted to population; Total n = 1000

Community attitudes towards emerging technology issues - Biotechnology
91
While there were no differences by age and gender, those in capital cities were more likely to agree that the regulations on the use of genetic modification in medical research
are sufficiently rigorous compared to those who lived in other areas of Australia (7.2 vs. 6.7).
Segment 4 gave higher average ratings in terms of both sufficiently rigorous regulation and compliance, while Segment 3 gave higher ratings for compliance. Segments 1 and 2
gave lower ratings in terms of both sufficiently rigorous regulation and compliance.
Table 36. Agreement that GM regulations in medical research are sufficiently rigorous and complied with by segment
Average out of 10 (0-10 Strongly
agree/Strongly disagree scale)
Segment
1
Segment
2
Segment
3
Segment
4
Total
Regulations on the use of genetic
modification or GM in medical research are sufficiently rigorous
6.6 6.6 7.2 7.7 6.1
Regulations on the use of genetic
modification or GM in medical research are complied with
6.8 7.1 7.7 8.2 6.6
Q10i (iii and iv). Do you agree or disagree that:
Filter: 2012 only AND CATI only; Weighted to population; Total n = 1000
Indicates statistically significant difference compared to those not in that category
As with the regulation of GM in food and agriculture, those with the highest level of support for biotechnology were significantly more likely to agree that regulations are
sufficiently rigorous and complied with compared to all others. The same was true of those who were in favour of growing genetically modified crops in their state.
Table 37. Agreement that GM regulations in medical research are sufficiently rigorous and complied with by attitudes
Average out of 10 (0-10 Strongly
agree/Strongly disagree scale)
Impact of biotechnology on
our future
Level of support for
biotechnology
Improve
our way
of life in
the future
Have
no effect
Make
things
worse
in the future
0-3 out
of 10
4-6 out
of 10
7-10
out of 10
Regulations on the use of genetic
modification or GM in medical research are sufficiently rigorous
7.4 7.2 5.4 5.5 6.7 7.7
Regulations on the use of genetic
modification or GM in medical research are complied with
7.7 7.0 6.5 6.1 7.3 7.9
Q10i (iii and iv). Do you agree or disagree that:
Filter: 2012 only AND CATI only; Weighted to population; Total n = 1000
Indicates statistically significant difference compared to those not in that category

Community attitudes towards emerging technology issues - Biotechnology
92
11.2 Organisations responsible for regulation of biotechnologies
11.2.1 Unprompted awareness of regulators of biotechnology
and GM
In the supplementary online survey, respondents were asked, unprompted, which
organisation or organisations they thought were responsible for the regulation of GM and other biotechnologies in Australia (See Figure 38).
The vast majority (79%) said that they did not know who was responsible for regulation in Australia. Aside from this, the most common response was ‘CSIRO’ (12%).
Figure 38. Organisations responsible for regulation of biotechnologies – unprompted awareness
Q11a Which organisation or organisations do you believe are responsible for the regulation of genetic
modification and other biotechnologies in Australia?
Filter: 2012 ONLY AND 18-75 years only AND Online only; Weighted to population; Total n = 1000
Awareness of most organisations decreased significantly in 2012 when compared to
previous years. For example, mentions of the CSIRO were made by 22% in 2007, 24% in 2010 and only 12% in 2012. Mentions of other departments, agencies or bodies were
made by 25% in 2007, 23% in 2010 and only 4% in 2012. Further, respondents in 2012 were significantly more likely to say ‘don’t know’ (79% in 2012 compared to 48% in 2007
and 46% in 2010).
By segment, Segment 3 was more likely to mention the CSIRO (16% compared to
12%), while Segment 2 was less likely to mention this organisation (6% compared to 12%). Segment 4 was more likely to mention the TGA (5% compared to 1%).

Community attitudes towards emerging technology issues - Biotechnology
93
By gender, females were significantly more likely to say they did not know than males (86% compared to 73%), while males were significantly more likely to mention ‘CSIRO’
(16% compared to 8%) or ‘The Federal Government/The Government’ (6% compared to 3%).
Those aged 16-30 were also significantly more likely to say ‘don’t know’ (87%), while those aged 51-75 were significantly less likely to say the same (71%). The latter group
were significantly more likely to mention ‘CSIRO’ (19%) or ‘DAFF or the Department of
Primary Industries’ (4%).
Those who only spoke English at home were also significantly more likely to mention
‘CSIRO’ (13% compared to 5% among those who spoke another language at home).
Those with children under 10 at home were significantly more likely to say ‘don’t know’
and significantly less likely to say ‘CSIRO’ compared to those without (83% compared to 78% and 8% compared to 14%, respectively).
Those who lived in NSW were also significantly more likely to say ‘don’t know’ (84%).
Predictably, those with the most sophisticated awareness of biotechnology (who said
they knew enough they could explain it to a friend) were significantly less likely to say
‘don’t know’ (66%) and significantly more likely to mention a range of organisations including an ‘other department’, ‘DAFF’ and ‘FSANZ’. Both those with the highest and the
second highest (have heard of it but knew very little or nothing about it’ were equally likely to say ‘CSIRO’ (15%). Those who had not heard of biotechnology were significantly
more likely to say ‘don’t know’ (93%), and generally could not name any organisations.
Those with the highest level of support for biotechnology (7-10 out of 10) were also
significantly less likely to say ‘don’t know’ (69%), and more likely to say CSIRO (18%) or ‘other department’ (6%).
It is therefore not surprising that the Segment with the highest support and highest
awareness, Segment 4, was the most likely to provide an answer. Although 70% of this segment were still unable to name a regulator of GM or biotechnology.
11.2.2 Prompted awareness of regulators of biotechnology and
GM
The online survey also covered prompted awareness of a selection of organisations associated with the regulation of biotechnology and GM.
Awareness of all the organisations listed was moderate. Awareness was highest for Food
Standards Australia and New Zealand (FSANZ) (61%). This was followed closely by the National Health and Medical Research Council (NH&MRC) (56%). Four in ten respondents
in the online survey had heard of Therapeutic Goods Administrator (40%). Thirty-eight percent (38%) of respondents said they had heard of either DAFF Biosecurity (26%) or
its predecessor Biosecurity Australia (24%). Only 5% had heard of the Office of the Gene Technology Regulator or OTGR. In total, 20% of respondents had not heard of at least
one of the organisations.

Community attitudes towards emerging technology issues - Biotechnology
94
Figure 39. Organisations responsible for regulation of biotechnologies – Prompted awareness
Q11c (Online) And have you heard of
Filter: 2012 ONLY AND Online only; Weighted to population
There were some differences noted for gender including females more likely to have heard of FSANZ (65% vs. 56%). Although the proportion was small, there was a higher
level of awareness of the TGA among males (21% vs. 12% for females).
Age also played a factor in awareness of organisations with younger respondents general less aware of any of the organisations and those aged 51-75 more likely to have heard of
them (See Table 38).
Table 38. Organisations responsible for regulation of biotechnologies –
Prompted awareness by age
% aware Age
16- 30 years 31- 50 years 51 – 75 years
Food Standards Australia New Zealand or
FSANZ
44 64 71
Therapeutic Goods Administration (TGA) 32 57 76
National Health and Medical Research Council (NH&MRC)
27 36 55
DAFF Biosecurity (Department of Agriculture,
Fisheries and Forestry Biosecurity)
14 27 34
Biosecurity Australia 12 26 33

Community attitudes towards emerging technology issues - Biotechnology
95
% aware Age
16- 30 years 31- 50 years 51 – 75 years
The Office of The Gene Technology Regulator
(OGTR)
3 5 6
Subtotal - Heard of at least 1 62 81 93
Q11c (Online) And have you heard of
Filter: 2012 ONLY AND Online only; Weighted to population n=1000
Indicates statistically significant difference compared to those not in that category
As would be expected, the awareness of each of the organisations was significantly
higher for those in Segment 4. It should be noted that the segmentation found that there were fewer respondents who fit the Segment 4 profile of high awareness and higher
support science and technology in general and a higher proportion of those who were Segment 2 who were found to have a relatively lower affinity towards science and
technology which may help explain the lower levels of awareness of these organisations.
11.3 Trust in organisations involved in biotechnologies
11.3.1 Trust in the organisations
Among those who had heard of the organisations listed, the online survey also covered how much trust respondents had in a range of organisations on a scale where 0 meant
‘do not trust at all’ and ‘10 meant trust completely.’
Among those who were able to communicate their level of trust, the highest level of trust
was placed in the National Health and Medical Research Council (NH&MRC) (69%
providing a rating of 7-10 and an average rating of 7.2). Levels of trust were similar for all other organisations, although trust ratings were lowest for Food Standards Australia
and New Zealand (FSANZ) (56% providing a rating of 7-10, and an average of 6.4). However, as Figure 40 shows, the gap between the ‘top’ and ‘bottom’ organisations is
small.

Community attitudes towards emerging technology issues - Biotechnology
96
Figure 40. Overall trust in organisations (Among those aware)
Q11di How much trust do you place in the following organisations on a scale where 0 is do not trust at all and
10 is trust completely?
Filter: 2012 only AND Online only; Weighted to population; Total n = 1000
Both age and gender did not have a significant influence on respondents’ levels of trust
in organisations relating to biotechnology.
However, there were some significant differences by employment status. Those who were employed were significantly more likely to trust DAFF Biosecurity (7.0 out of 10),
while those who were retired or pensioners were significantly more likely to trust the Therapeutic Goods Administration (TGA) (6.9 out of 10). Those engaged in home duties
were significantly less likely than all others to trust the NH&MRC (6.5) than other demographic groups.
There were also some differences by location with those in New South Wales significantly more likely to trust FSANZ (6.8) than respondents from other states.
There were no differences in trust for organisations based on levels of awareness of
biotechnology.
However, as expected, those with the highest level of support for biotechnology
provided, on average, significantly higher trust ratings than all others in relation to all six organisations. Further, those who thought biotechnology would improve things in
future provided significantly higher average trust ratings for FSANZ, DAFF Biosecurity and NH&MRC. These findings are further detailed below in Table 39.

Community attitudes towards emerging technology issues - Biotechnology
97
Table 39. Trust in organisations by attitudes to biotechnology
Average out of 10 (0-10 do not trust at all – trust completely scale)
Impact of biotechnology on our future
Level of support for biotechnology
Improve
our way
of life in
the future
Have
no effect
Make
things
worse
in the future
0-3 out
of 10
4-6 out
of 10
7-10
out of 10
National Health and Medical Research
Council (NH&MRC)
7.5 6.0 5.9 6.1 7.1 7.8
DAFF Biosecurity or (Department of
Agriculture, Fisheries And Forestry (DAFF) Biosecurity )
6.9 4.1 6.5 5.9 6.6 7.1
The Office of The Gene Technology
Regulator (OGTR)
6.8 5.0 8.0 4.7 5.9 7.5
Biosecurity Australia 6.8 8.1 4.4 6.1 6.6 7.1
Therapeutic Goods Administration (TGA) 6.8 6.7 4.3 5.5 6.5 7.1
Food Standards Australia New Zealand or
FSANZ
6.6 5.4 4.9 5.4 6.3 7.1
Q11di How much trust do you place in the following organisations on a scale where 0 is do not trust at all and
10 is trust completely?
Filter: 2012 only AND Online only; Weighted to population; Total n = 1000
Indicates statistically significant difference compared to those not in that category
11.3.2 Trust in what organisations tell them about the risks and benefits
Supplementary online respondents were also asked how much they trust what the same
organisations told them about the risks and benefits of biotechnology on a scale where zero was ‘do not trust at all’ and 10 was ‘trust completely’. Results are detailed Figure
41.
Levels of trust in what all organisations say about the risks and benefits of biotechnology
were lower than levels of trust in the organisations more generally (Refer to Figure 40). Once again, trust was highest for the NH&MRC (an average rating of 6.7) and lowest for
FSANZ (6.1). However, as with trust in their organisations in general, there is only a small difference between the organisation with the highest and lowest levels of trust.

Community attitudes towards emerging technology issues - Biotechnology
98
Figure 41. Trust in what organisations say about the risks and benefits of biotechnology (Among those aware)
Q11dii And how much trust do you place on what these organisations tell you about the risks and benefits of
biotechnology on a scale where 0 is do not trust at all and 10 is trust completely?
Filter: 2012 only AND Online only; Weighted to population; Total n = 1000
Males were significantly more likely to trust what the NH&MRC say about the risks and
benefits of biotechnology than females (7.1 compared to 6.4).
There were no differences by age although those who were retired or pensioners were
significantly more likely to trust FSANZ and TGA in relation to biotechnology (6.5 and 6.7 compared to an average of 6.1 for both). Once again, those engaged in home duties
were significantly less likely to trust what NH&MRC say about the risks and benefits of biotechnology.
Further, those who spoke a language other than English at home were significantly more likely to trust FSANZ in relation to biotechnology than those who spoke English only
(6.7 compared to 6.0).
Once again, those living in New South Wales were more likely to trust FSANZ than all others (6.5) but there were no other significant differences by location.
Section 12 Implications of the research
As segmentation analysis clearly shows, distinct attitudinal groupings exist within the community each with differing appetites for information about science and
technology, and biotechnology in particular.
As Segment 1 typifies, there appears to be a link between low levels of awareness
of biotechnology and rejection (or at least relatively weak acceptance) of specific biotechnological applications.

Community attitudes towards emerging technology issues - Biotechnology
99
Males are consistently more positive with regard to biotechnology and specific applications.
Appendices
Demographics
Telephone survey respondents
SQ2 Gender
% n
Male 51 512
Female 49 488
Total 100 1000
n= 1000
SQ3 Age
% n
16-17 years old 4 40
18 – 20 years 5 49
21 – 30 years 14 144
31 – 40 years 20 203
41 – 50 years 20 198
51 – 60 years 15 153
61 – 70 years 17 165
71 – 75 years 5 48
Total 100 1000
n= 1000
SQ4 Do you have a landline phone at home that you use for phone calls (not just the internet)?
% n
Yes 95 950
No 5 50
Total 100 1000
n= 1000
Q23 What is the highest level of education you have ever attempted, whether or not you finished?
% n
No formal schooling 0 2

Community attitudes towards emerging technology issues - Biotechnology
100
% n
Primary school 0 3
Some high school 3 32
Year 10/4th Form 8 75
Year 11/5th Form 5 50
Year 12/6th Form 12 120
Technical school, commercial college or TAFE 14 144
University degree or diploma (undergraduate or postgraduate) 55 552
Something else 2 22
Total 100 1000
n= 1000
SQ1 Location
% n
Sydney 21 211
Other NSW 11 110
Melbourne 19 186
Other Vic 6 62
Brisbane 10 104
Other Qld 10 96
Adelaide 6 56
Other SA 2 18
Perth 8 82
Other WA 3 25
Hobart 1 11
Other Tas 1 12
Canberra/ACT 2 17
Darwin 0 4
Other NT 1 6
Total 100 1000
n= 1000
SQ1 Location (State)
% n
NSW 32 321
VIC 25 248
QLD 20 200

Community attitudes towards emerging technology issues - Biotechnology
101
% n
SA 7 74
WA 11 107
TAS 2 23
Canberra/ACT 2 17
NT 1 10
Total 100 1000
n= 1000
SQ1 Location (Capital city/Non-capital city)
% n
Capital city 67 671
Non-capital city 33 329
Total 100 1000
n= 1000
Q21i Are there children under 10 years of age living in your household?
% n
No 73 729
Yes 27 271
Total 100 1000
n= 1000
Q23i Which of the following best describes you…?
% n
Employed full time 44 444
Employed part time 17 166
Retired or Pensioner 17 167
Home duties 5 52
School or secondary student 4 42
TAFE or university student 7 70
Unemployed 3 27
Other 1 5
Refused 1 5
Self employed 2 22
Total 100 1000
n= 1000
Q24 Do you identify as Aboriginal or Torres Strait Islander?

Community attitudes towards emerging technology issues - Biotechnology
102
% n
No 98 978
Yes 2 22
Total 100 1000
n= 1000
Q25 Do you speak any language other than English in your home?
% n
Yes 16 156
No, English only 84 844
Total 100 1000
n= 1000
Online survey respondents
SQ2 Gender
% n
Male 49 492
Female 51 508
Total 100 1000
n= 1000
SQ3 Age
% n
16-17 years old 3 25
18 – 20 years 2 22
21 – 30 years 19 185
31 – 40 years 20 195
41 – 50 years 20 204
51 – 60 years 17 165
61 – 70 years 17 170
71 – 75 years 3 34
Total 100 1000
n= 1000
SQ4RC Do you have a landline phone at home that you use for phone calls (not just the
internet)?
% n
Yes 81 809
No 19 191

Community attitudes towards emerging technology issues - Biotechnology
103
% n
Total 100 1000
n= 1000
Q23 What is the highest level of education you have ever attempted, whether or not you
finished?
% n
No formal schooling 0 2
Primary school 1 6
Some high school 4 44
Year 10/4th Form 7 68
Year 11/5th Form 4 43
Year 12/6th Form 13 131
Technical school, commercial college or TAFE 30 299
University degree or diploma (undergraduate or postgraduate) 40 398
Something else [RECORD VERBATIM] 1 9
Total 100 1000
n= 1000
SQ1 Location
% n
Sydney 21 205
Other NSW 11 110
Melbourne 19 185
Other Vic 6 60
Brisbane 10 101
Other Qld 11 109
Adelaide 6 60
Other SA 2 18
Perth 8 79
Other WA 2 22
Hobart 1 10
Other Tas 1 11
Canberra/ACT 2 22
Darwin 1 6
Other NT 0 2
Total 100 1000
n= 1000
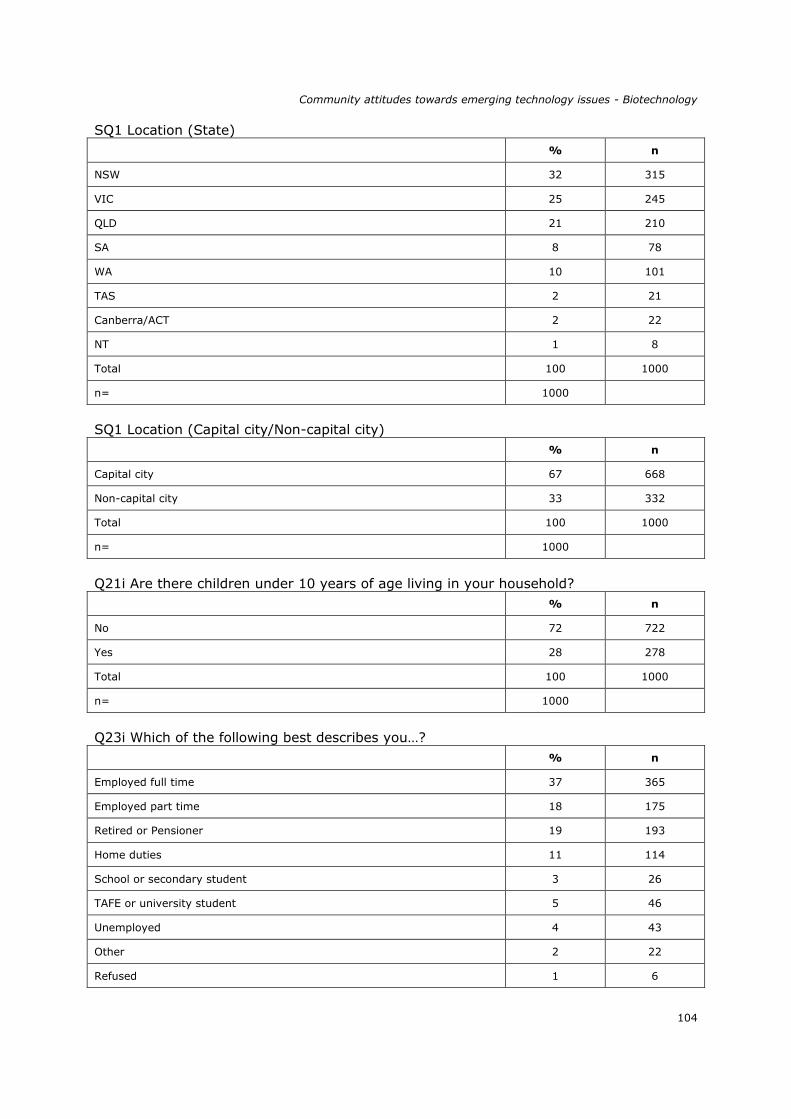
Community attitudes towards emerging technology issues - Biotechnology
104
SQ1 Location (State)
% n
NSW 32 315
VIC 25 245
QLD 21 210
SA 8 78
WA 10 101
TAS 2 21
Canberra/ACT 2 22
NT 1 8
Total 100 1000
n= 1000
SQ1 Location (Capital city/Non-capital city)
% n
Capital city 67 668
Non-capital city 33 332
Total 100 1000
n= 1000
Q21i Are there children under 10 years of age living in your household?
% n
No 72 722
Yes 28 278
Total 100 1000
n= 1000
Q23i Which of the following best describes you…?
% n
Employed full time 37 365
Employed part time 18 175
Retired or Pensioner 19 193
Home duties 11 114
School or secondary student 3 26
TAFE or university student 5 46
Unemployed 4 43
Other 2 22
Refused 1 6

Community attitudes towards emerging technology issues - Biotechnology
105
% n
Self employed 1 10
Total 100 1000
n= 1000
Q24 Do you identify as Aboriginal or Torres Strait Islander?
% n
No 95 950
Yes 5 50
Total 100 1000
n= 1000
Q25 Do you speak any language other than English in your home?
% n
Yes 11 108
No, English only 89 892
Total 100 1000
n= 1000
Questionnaires
Introduction
Hello, my name is [INTERVIEWER] and I’m calling from Iview.
We are conducting a short telephone survey on behalf the Australian Government about
public opinion towards science and technology. It will help governments in Australia make decisions about scientific research. We are not trying to sell you anything; and
there are no right or wrong answers. We’re just interested in your opinions. The survey will take around 19 minutes. If you participate, the information you provide will be used
only for research purposes.
[IF LANDLINE]
Can I please speak to the youngest male in the household aged over 16?
[IF NO MALES OVER 16] Can I please speak to the youngest female over the age of
16?
[IF MOBILE]
Will you be willing to take part?
YES 1 [CONTINUE]
NO 2 [ASK TO SPEAK TO SOMEONE ELSE 16 YEARS OR OLDER IN HOUSEHOLD WHO MAY BE INTERESTED, OTHERWISE TERMINATE WITH THANKS.]

Community attitudes towards emerging technology issues - Biotechnology
106
[IF TIME IS INCONVENIENT: ]
Arrange call back.
[IF CLIENT QUERIED:]
I’m sorry, I can’t tell you the client’s name until the end of the survey, because it might
affect the way you answer the questions, but I will be able to tell you at the end.
[IF QUERIED ABOUT BONA FIDES OF RESEARCH:]
I can provide the names of people who will verify the legitimate nature of this research
project. The first is the Australian Market and Social Research Society enquiry line on 1300 36 4830. The second is the Project Manager at Ipsos Social Research Institute, Julie
Young, on (03) 9946 0888.
[IF QUERIED ABOUT HOW NUMBER WAS SOURCED: ]
We are contacting people using numbers generated randomly by a computer.
[IF THE INTERVIEW WILL BE MONITORED: ]
My supervisor may be monitoring the interview for quality control purposes. If you do not wish this to occur, please let me know.
Screening
First let me check that you are one of the people who we need to talk to.
#SQ3i. Age# {SINGLE}
SQ3i. Approximately, how old are you?
[READ OUT APPROPRIATE AGE BRACKETS IF NECESSARY. OBSERVE QUOTAS.]
15 or under <DISCONTINUE GO TO TERMINATION SCRIPT>
1
16-17 years old 2
18 – 20 years 3
21 – 30 years 4
31 – 40 years 5
41 – 50 years 6
51 – 60 years 7
61 – 70 years 8
71 – 75 years 9
76 years or over
10
<DISCONTINUE GO TO TERMINATION
SCRIPT >

Community attitudes towards emerging technology issues - Biotechnology
107
[DNRO] Refused
11
<DISCONTINUE GO TO TERMINATION SCRIPT >
#SQ1. Location# {SINGLE}
SQ1. Can you please tell me in what state or territory you live in? [CLARIFY IF IN
CAPITAL CITY] – And is that in [CAPITAL CITY] or outside [CAPITAL CITY]?
[RECORD LOCATION. OBSERVE QUOTAS.]
Sydney 1
Other New South Wales 2
Melbourne 3
Other Victoria 4
Brisbane 5
Other Queensland 6
Adelaide 7
Other South Australia 8
Perth 9
Other WA 10
Hobart 11
Other Tasmania 12
Canberra/ACT 13
Darwin 14
Other Northern Territory 15
#SQ2. Gender# {SINGLE}
SQ2. Gender
[RECORD GENDER. OBSERVE QUOTAS.]
Male 1
Female 2
[TERMINATION SCRIPT IF DOES NOT QUALIFY OR QUOTA EXCEEDED:]
“Unfortunately you’re not one of the people who we need to talk to for this particular survey. Thanks for being willing to participate.”
<IF MOBILE SAMPLE:>
{SINGLE}
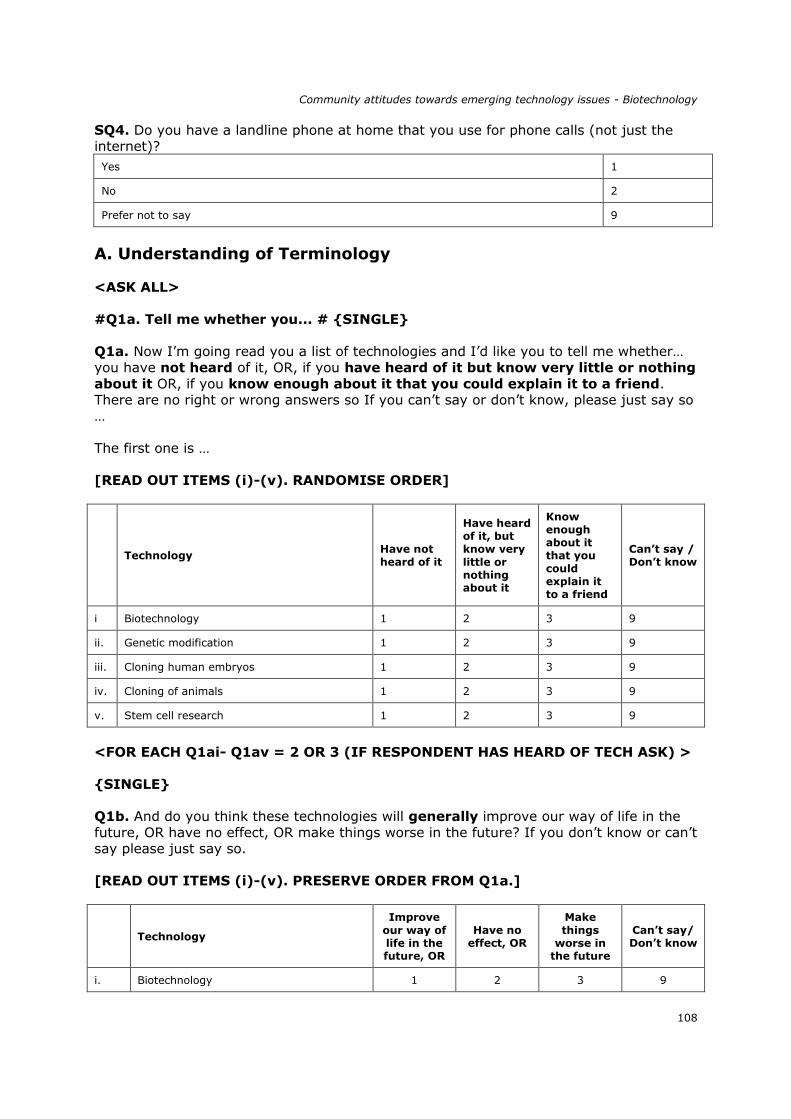
Community attitudes towards emerging technology issues - Biotechnology
108
SQ4. Do you have a landline phone at home that you use for phone calls (not just the internet)?
Yes 1
No 2
Prefer not to say 9
A. Understanding of Terminology
<ASK ALL>
#Q1a. Tell me whether you... # {SINGLE}
Q1a. Now I’m going read you a list of technologies and I’d like you to tell me whether…
you have not heard of it, OR, if you have heard of it but know very little or nothing
about it OR, if you know enough about it that you could explain it to a friend. There are no right or wrong answers so If you can’t say or don’t know, please just say so
…
The first one is …
[READ OUT ITEMS (i)-(v). RANDOMISE ORDER]
Technology Have not
heard of it
Have heard
of it, but
know very
little or
nothing about it
Know
enough
about it
that you
could
explain it to a friend
Can’t say /
Don’t know
i Biotechnology 1 2 3 9
ii. Genetic modification 1 2 3 9
iii. Cloning human embryos 1 2 3 9
iv. Cloning of animals 1 2 3 9
v. Stem cell research 1 2 3 9
<FOR EACH Q1ai- Q1av = 2 OR 3 (IF RESPONDENT HAS HEARD OF TECH ASK) >
{SINGLE}
Q1b. And do you think these technologies will generally improve our way of life in the
future, OR have no effect, OR make things worse in the future? If you don’t know or can’t say please just say so.
[READ OUT ITEMS (i)-(v). PRESERVE ORDER FROM Q1a.]
Technology
Improve
our way of
life in the future, OR
Have no
effect, OR
Make
things
worse in the future
Can’t say/
Don’t know
i. Biotechnology 1 2 3 9

Community attitudes towards emerging technology issues - Biotechnology
109
Technology
Improve
our way of
life in the future, OR
Have no
effect, OR
Make
things
worse in the future
Can’t say/
Don’t know
ii. Genetic modification 1 2 3 9
iii. Cloning human embryos 1 2 3 9
iv. Cloning of animals 1 2 3 9
v. Stem cell research 1 2 3 9
[SAY TO ALL]:
“Throughout this survey the terms ‘genetic modification’ or GM and ‘biotechnology’ will
be used. I will define these now so that you understand what I am referring to. You can ask me to repeat these definitions at any time.
Genetic modification or GM is using laboratory techniques to basically, “cut and
paste” a gene from one living thing to another, or modifying or removing a gene within an organism.
Biotechnology is using the science of living things and biological processes to develop or make products. It is broader than genetic modification or GM and
includes other processes that do not change genetic information. It is used in food production such as culturing yoghurt and brewing beer as well as in farming and
agriculture, and in medical treatments and research. “
<ASK ALL>
{SINGLE}
Q16bi. How would you rate your level of support for the use of GM or genetic modification and other biotechnologies? Please use a scale of 0 to 10, where 0 is
completely against it and where 10 is completely supportive. If you can’t say or don’t know, please just say so
[RECORD 0-10; 99 for Can’t say/Don’t know],
<ASK ALL>
{SINGLE}
Q1c. For the following statements, can you please tell me how much you disagree or
agree on a scale of 0 to 10, where 0 is strongly disagree and 10 is strongly agree. If
you can’t say or don’t know, just say so.
So, on a scale of 0-10, would you say do you disagree or agree that…
[RANDOMISE ORDER AND RECORD 0-10; 99 for Can’t say/Don’t know]
RECORD 0-10
99 = Can’t say/ Don’t know
1. Technological change happens too fast for me to keep up with it

Community attitudes towards emerging technology issues - Biotechnology
110
RECORD 0-10
99 = Can’t say/ Don’t know
2. Science and technology creates more problems than it solves
3. We depend too much on science and not enough on faith
4. New technologies excite me more than they concern me
5. Science is such a big part of our lives that we should all take an interest
6. The benefits of science are greater than any harmful effect
7. Scientific advances tend to benefit the rich more than they benefit the poor
8. We should use more natural ways of farming
9. People have the right to modify the natural environment to suit their needs
10. Human activities have a significant impact on the planet
11. People shouldn’t tamper with nature
12. I believe that everything in the world is connected
13. Not vaccinating children puts others at risk
14. Children must be protected from all risks
B. Applications
<SPLIT SAMPLING>
{SINGLE}
Q2a. Now I’m going to ask you about a number of different applications of biotechnology.
Firstly, I’d like you to tell me whether you’ve heard of them. If you are not sure if you
have heard of them or not, please just say so...
[READ OUT ITEMS]
[RANDOMLY SELECT 3 OUT OF BLOCKS A, C, E, F, G PER RESPONDENT]
Application No Yes
Don’t know
BLOCK A
i. Have you heard of modifying the genes of plants to produce food 0 1 9
And have you heard of modifying the genes of plants to produce food
[Repeat “And have you heard of where this is done…]
[ROTATE ORDER ii-v]
ii. by introducing the genes of a plant of the same species 0 1 9
iii. by introducing the genes of a plant of a different species 0 1 9
iv. by introducing the genes of an animal to a plant 0 1 9

Community attitudes towards emerging technology issues - Biotechnology
111
Application No Yes
Don’t
know
v. by introducing the genes of a bacterium to a plant 0 1 9
BLOCK C
i. Have you heard of using biotechnology in the production of food from
plants 0 1 9
And have you heard of using biotechnology in the production of
food from plants …
[Repeat “And have you heard of where this is done…]
[ROTATE ORDER ii-iii]
ii. by changing the genes of a plant without introducing new DNA 0 1 9
iii. to assist in conventional breeding 0 1 9
BLOCK E
i. Have you heard of using genetic information in medical research 0 1 9
And have you heard of using genetic information in medical
research [Repeat “And have you heard of where this is done…]
[ROTATE ORDER ii-v]
0 1 9
ii. to study a human disease in the laboratory 0 1 9
iii. to study a human disease in animals 0 1 9
iv. to design vaccines against new or existing diseases 0 1 9
v. to tailor a person’s healthcare based on their genetic make-up 0 1 9
Application No Yes
[DNRO]
Don’t
know
BLOCK F
i. Have you heard of using stem cells to conduct medical research and treat
disease 0 1 9
And have you heard of using stem cells to conduct medical
research and treat disease [Repeat “And have you heard of where this is done…]
[ROTATE ORDER ii-iii]
ii. using non-embryonic, cord or adult stem cells 0 1 9
iii. using embryonic stem cells 0 1 9
BLOCK G
[ROTATE ORDER i-iii]
i. Have you heard of using genetic modification to grow human tissue or
organs in animals for human transplants 0 1 9
iii. Have you heard of using genetic modification of introduced pests to
reduce their numbers 0 1 9
<SPLIT SAMPLING>

Community attitudes towards emerging technology issues - Biotechnology
112
{SINGLE}
Q2ci. I’m going to read out the applications again and for each of them, would you say
that:
[ROTATE BETWEEN READING OUT ORDER 1 and ORDER 2 AND RECORD ORDER:]
ORDER 1
The risks outweigh the benefits
The risks are equal to the benefits
The benefits outweigh the risks
ORDER 2
The benefits outweigh the risks
The risks are equal to the benefits
The risks outweigh the benefits
There are no right or wrong answers so if you can’t say or don’t know, please just say so.
<ASK SAME 3 BLOCKS (A, C, E, F, OR G) FOR Q2a:>
BENEFITS
OUTWEIGH the risks
Risks are
EQUAL to
the benefits
RISKS
OUTWEIGH the benefits
Can’t
say/don’t know
BLOCK A
i. Modifying the genes of plants to
produce food 1 2 3
4
And what about modifying the
genes of plants to produce food…
[Repeat “What about where this is done…]
[ROTATE ORDER ii-v]
ii. by introducing the genes of a plant of
the same species 1 2 3
4
iii. by introducing the genes of a plant of a
different species 1 2 3
4
iv. by introducing the genes of an animal
to a plant 1 2 3
4
v. by introducing the genes of a bacterium to a plant
1 2 3 4
BLOCK C
i. Using biotechnology in the production
of food from plants 1 2 3
4

Community attitudes towards emerging technology issues - Biotechnology
113
BENEFITS
OUTWEIGH the risks
Risks are
EQUAL to
the benefits
RISKS
OUTWEIGH the benefits
Can’t
say/don’t know
And what about using
biotechnology in the production of food from plants …
[Repeat “What about where this is done…]
[ROTATE ORDER ii-iii]
ii. by changing the genes of a plant
without introducing new DNA 1 2 3
4
iii. to assist in conventional breeding 1 2 3 4
BENEFITS
outweigh the risks
Risks are
EQUAL to
the benefits
RISKS
outweigh
the benefits
Don’t’know /not sure
BLOCK E
i. Using genetic information in medical
research 1 2 3 4
And what about using genetic
information in medical research
[Repeat “What about where this is done…]
[ROTATE ORDER ii-iii]
ii. to study a human disease in the
laboratory 1 2 3 4
iii. to study a human disease in animals 1 2 3 4
iv. to design vaccines against new or
existing diseases 1 2 3 4
v. to tailor a person’s healthcare based on their genetic make-up
1 2 3 4
BLOCK F
i. Using stem cells to conduct medical
research and treat disease 1 2 3 4
And what about using stem cells to
conduct medical research and treat disease…
[Repeat “What about where this is done…]
[ROTATE ORDER ii-iii]
ii. using non-embryonic, cord or adult stem
cells 1 2 3 4
iii. using embryonic stem cells 1 2 3 4
BLOCK G
What about…
[ROTATE ORDER i-iii]

Community attitudes towards emerging technology issues - Biotechnology
114
BENEFITS
outweigh the risks
Risks are
EQUAL to
the benefits
RISKS
outweigh
the benefits
Don’t’know
/not sure
i. Using genetic modification to grow
human tissue or organs in animals for human transplants
1 2 3 4
iii. Using genetic modification of introduced pests to reduce their numbers
1 2 3 4
<ASK IF Q2ci_Ai = 3, (IF RISKS OF MODIFYING THE GENES OF PLANTS TO
PRODUCE FOOD IS OUTWEIGH BENEFITS>
{SINGLE}
Q3i. You said in relation to modifying the genes of plants to produce food, the risks
outweigh the benefits.
Would you be more accepting of modifying the genes of plants to produce food if…?
[READ OUT ITEMS (i)-(vii). RANDOMISE ORDER]
Application
No, I would
not be
more accepting
Yes, I
would be
more accepting
Don’t
know
i. The food was certified as safe by a government regulator 0 1 9
ii. It was developed by a government funded research body 0 1 9
iii. It was developed by an Australian company 0 1 9
iv. It was developed by a company based overseas 0 1 9
v. The labelling on the food described what component had
been genetically modified, and why 0 1 9
vi. Long-term tests of at least 10 years had shown no risks to
human health or the environment 0 1 9
vii. The food was less expensive 0 1 9
<ASK ALL>
{SINGLE}
Q4i. Now I’m going to ask you about different objectives of genetically modifying plants to produce food.
I’d like you to tell me how valuable you feel these objectives are to individuals or society using the scale where 0 is not valuable at all and 10 is extremely valuable. If
you are not sure or can’t say, please just say so.
[RANDOMISE BETWEEN BLOCKS A AND B AND RANDOMISE STATEMENTS
WITHIN]

Community attitudes towards emerging technology issues - Biotechnology
115
BLOCK A
[Record 0-10
99 = Can’t say/Don’t know]
How valuable to individuals or society is genetically modifying plants…
i. to make the food healthier
ii. to make the food last longer
iii. to make the food taste better
x. to make the food cheaper
BLOCK B
[Record 0-10
99 = Can’t say/Don’t know]
How valuable to individuals or society is genetically modifying
plants…
iv. to make the plants herbicide tolerant
v. to make the plants pest resistant
vi. to make the plants frost resistant
viii. to make plants drought resistant
ix. to make plants that can grow in salty soils
G. Regulation
<ASK ALL>
{SINGLE}
Q10i. For your information, the government sets rules that regulate the use of GM or
genetic modification and other biotechnologies. I am going to read you some statements and for each one, please tell me whether you disagree or agree with the statement using
a scale where 0 is strongly disagree and 10 is strongly agree. If you can’t say or don’t know, please just say so. The first one is …
[RANDOMISE ORDER OF BLOCKS AND RANDOMISE STATEMENTS WITHIN BLOCKS]
BLOCK A
[RECORD 0-10
99 for Can’t say/ Don’t know]
RANDOMISE STATEMENTS
(i) Regulations on the use of genetic modification or GM in agriculture and
food production are sufficiently rigorous
(ii) Regulations on the use of genetic modification or GM in agriculture and
food production are complied with

Community attitudes towards emerging technology issues - Biotechnology
116
BLOCK B
[RECORD 0-10
99 for Can’t say/ Don’t know]
RANDOMISE STATEMENTS
(iii) Regulations on the use of genetic modification or GM in medical research
are sufficiently rigorous
(iv) Regulations on the use of genetic modification or GM in medical research
are complied with
<ASK ALL>
{SINGLE}
Q12. As far as you know, are commercial genetically modified crops allowed to be grown in your state?
Yes 1
No 2
Don’t know 99
<ASK IF Q12=1>
{MULTIPLE RESPONSE}
Q13. Can you name any genetically modified crops that are grown in your state?
[DO NOT READ OUT. DO NOT PROMPT]
Canola 1
Corn 2
Cotton 3
Soya 4
Strawberries 5
Tomatoes 6
Other [RECORD VERBATIM] 7
None/Can’t name any 8
Aware of crops but not sure what crops 9
Don’t know 99
<ASK ALL>
{SINGLE}
Q14. Are you in favour of growing genetically modified crops in your state?
Yes 1

Community attitudes towards emerging technology issues - Biotechnology
117
No 2
Don’t know 99
<ASK IF Q14=2 OR Q14=99>
{SINGLE}
Q15a. Would you be in favour of growing genetically modified crops in your state if…?
[READ OUT (i)-(v), RANDOMISE ORDER]
Application Yes No
Don’t
know
i. the crops passed stringent health and environment regulations? 1 2 9
ii. there was evidence that it would enhance Australia’s economic
competitiveness? 1 2 9
iii. the crops provided benefits to health? 1 2 9
iv. the crops provided positive outcomes for the environment or climate
change? 1 2 9
v. there was evidence that many farmers wanted to plant genetically modified crops?
1 2 9
<ASK IF Q14=1 OR Q14=99>
{SINGLE}
Q15b. Would you be in favour of growing genetically modified crops in your state if…
[READ OUT; RANDOMISE ORDER]
Application Yes No
Don’t
know
i. the health and environmental benefits of the crops could not be established?
1 2 9
ii. there was evidence that it would diminish Australia’s economic competitiveness?
1 2 9
iii. there was evidence that very few farmers wanted to plant genetically
modified crops? 1 2 9
iv. long-term data was not available on the safety of the crops to humans
and to the environment? 1 2 9
H. Overall Support, Expectations, Aspirations
We’re almost finished now.
<ASK ALL>
{SINGLE}

Community attitudes towards emerging technology issues - Biotechnology
118
Q16b. How would you rate your support for the use of genetic modification and other biotechnologies? Please use a scale of 0 to 10, where 0 is completely against it and
where 10 is completely supportive. If you don’t know, please just say so
[RECORD 0-10, 99 Don’t know/Can’t say]
Demographics
Finally, I’d like to ask you a few questions to ensure that we’ve included a good range of
people in our survey.
<ASK ALL>
{SINGLE} #Q21i. Are there children under 10 years of age living in your household?#
Q21i. Are there children under 10 years of age living in your household?
No 0
Yes 1
<ASK ALL>
{SINGLE}
Q23. What is the highest level of education you have ever attempted, whether or not
you finished?
[PROMPT IF NECESSARY]
No formal schooling 1
Primary school 2
Some high school 3
Year 10/4th Form 4
Year 11/5th Form 5
Year 12/6th Form 6
Technical school, commercial college or TAFE 7
University degree or diploma (undergraduate or postgraduate) 8
Something else [RECORD VERBATIM] 9
<ASK ALL>
{SINGLE}
Q23i. Which of the following best describes you…?
[READ OUT]
Employed full time 1
Employed part time 2

Community attitudes towards emerging technology issues - Biotechnology
119
Retired or Pensioner 3
Home duties 4
School or secondary student 5
TAFE or university student 6
Unemployed 7
Other (SPECIFY) 8
Refused (DO NOT READ) 9
<ASK ALL>
{SINGLE}
Q24. Do you identify as Aboriginal or Torres Strait Islander?
No 0
Yes 1
<ASK ALL>
{SINGLE}
Q25. Do you speak any language other than English in your home?
No, English only 0
Yes, [RECORD] 1
<ASK ALL>
{SINGLE}
Q26. What is your residential postcode? [RECORD]
<ASK ALL>
Q30a. As part of this study, we may be organising further research sessions with people
about emerging technologies. Would you happy for us to contact you about taking part in further research?
Yes 1
No 2
<ASK ALL>
{SINGLE}
Q30. At the completion of this research, the findings will be available online. Would you be interested us emailing you a link to the results?
[READ OUT:]

Community attitudes towards emerging technology issues - Biotechnology
120
If you say yes, your name and contact details will be passed onto the Department of Industry, Innovation, Science, Research and Tertiary Education and will be used only for
the purpose of sending you the results.
Please be assured that your personal details will be treated in strict confidence and will
remain separate to your responses to this survey.
No, I would not be interested 1
Yes, I would be interested in getting the research findings 2
<IF Q30a = 1 OR Q30 = 2>
Q31a. Could I please have your…
[RECORD]
Name:
Email address: [OPTIONAL]
Confirm email address: [OPTIONAL]
[IF Q30a = 1 ONLY ] Contact
phone number:
[READ OUT: ]
That’s the end of the interview. Thank you very much for your time. This research is being carried out on behalf of the federal Department of Industry, Innovation, Science
and Research and Tertiary Education. The answers you provided today will be combined with those of other participants to give the Department a better understanding of
Australians’ views on biotechnology. If you would like to know more about emerging technologies, further information is available on www.technyou.edu.au [PRONOUNCED
“TECH”,”N”,”YOU” - SPELL OUT WEBSITE ADDRESS]
Lastly, as part of quality control procedures, someone from our project team may wish to re-contact you to verify some of the information we just collected. Would that be okay?
[IF SO, COLLECT FIRST NAME]
Just to remind you, I’m calling from Iview. If you have any queries, you can call the
Australian Market and Social Research Society’s enquiry line on 1300 364 830.
Community Attitudes to emerging technology questionnaire -
ONLINE
SCREENING
#SQ2. Gender# {SINGLE}
SQ2. Are you…?
[NOTE QUOTAS]
Male 1
Female 2

Community attitudes towards emerging technology issues - Biotechnology
121
#SQ3i. Age# {SINGLE}
SQ3i. Approximately, how old are you?
[NOTE QUOTAS]
15 or under 1 <DISCONTINUE GO TO TERMINATION SCRIPT>
16 -17 years old 2
18 – 20 years 3
21 – 30 years 4
31 – 40 years 5
41 – 50 years 6
51 – 60 years 7
61 – 70 years 8
71 – 75 years 9
76 years or over 10 <DISCONTINUE GO TO TERMINATION
SCRIPT >
Prefer not to say 11 <DISCONTINUE GO TO TERMINATION
SCRIPT >
------------------------------------ [NEW SCREEN] --------------------------------------
#SQ1. Location# {SINGLE}
SQ1. Where do you live?
[NOTE QUOTAS]
Sydney 1
Other New South Wales 2
Melbourne 3
Other Victoria 4
Brisbane 5
Other Queensland 6
Adelaide 7
Other South Australia 8
Perth 9
Other WA 10
Hobart 11
Other Tasmania 12
Canberra/ACT 13
Darwin 14
Other Northern Territory 15

Community attitudes towards emerging technology issues - Biotechnology
122
------------------------------------ [NEW SCREEN] --------------------------------------
[TERMINATION SCRIPT IF DOES NOT QUALIFY OR QUOTA EXCEEDED:]
Unfortunately you’re not one of the people who we need to talk to for this particular survey. Thank you for being willing to participate.
[REDIRECT TO www.technyou.edu.au]
------------------------------------ [NEW SCREEN] --------------------------------------
<ASK ALL>
{SINGLE}
SQ4. Do you have a landline phone at home that you use for phone calls (not just the
internet)?
Yes 1
No 2
Prefer not to say 9
A. UNDERSTANDING OF TERMINOLOGY
<ASK ALL>
#Q1a. Tell me whether you... # {SINGLE}
Q1a. For the following list of technologies could you please say whether…
you have not heard of it, OR
you have heard of it but know very little or nothing about it OR,
you know enough about it that you could explain it to a friend.
There are no right or wrong answers so If you can’t say or don’t know, please select ‘don’t know’ …
[RANDOMISE ORDER]
Technology Have not
heard of it
Have
heard of it,
but know
very little
or nothing
about it
Know
enough
about it
that you
could
explain it to a friend
Can’t say /
Don’t know
vi. Biotechnology 1 2 3 9
vii. Genetic modification 1 2 3 9
viii. Cloning human embryos 1 2 3 9
ix. Cloning of animals 1 2 3 9
x. Stem cell research 1 2 3 9

Community attitudes towards emerging technology issues - Biotechnology
123
Technology Have not
heard of it
Have
heard of it,
but know
very little
or nothing about it
Know
enough
about it
that you
could
explain it to a friend
Can’t say /
Don’t know
viii. Nanotechnology 1 2 3 9
------------------------------------ [NEW SCREEN] --------------------------------------
<FOR EACH Q1ai- Q1aviii = 2 OR 3 (IF RESPONDENT HAS HEARD OF TECH ASK)
>
{SINGLE}
Q1b. And do you think these technologies will generally
improve our way of life in the future, OR
have no effect, OR
make things worse in the future?
If you don’t know or can’t say please just say so.
[READ OUT ITEMS (i)-(v). PRESERVE ORDER FROM Q1a.]
Technology
Improve our way
of life in the future
Have no effect
Make things
worse in the future
Can’t
say/
Don’t know
vi. Biotechnology 1 2 3 9
vii. Genetic modification 1 2 3 9
viii. Cloning human embryos 1 2 3 9
ix. Cloning of animals 1 2 3 9
x. Stem cell research 1 2 3 9
viii. Nanotechnology 1 2 3 9
------------------------------------ [NEW SCREEN] --------------------------------------
<ASK ALL>
{SINGLE}
Q1c. For the following statements, can you say how much you disagree or agree on a
scale of 0 to 10, where 0 is strongly disagree and 10 is strongly agree.
If you can’t say or don’t know, please select ‘don’t know’.
So, on a scale of 0-10, would you say do you disagree or agree that …

Community attitudes towards emerging technology issues - Biotechnology
124
[RANDOMISE ORDER – USE GRID WITH STATEMENT THEN 0-10 and Don’t know/Can’t say; LABEL 0 – Strongly disagree and 10 – Strongly agree]
1. Technological change happens too fast for me to keep up with it
2. Science and technology creates more problems than it solves
3. We depend too much on science and not enough on faith
4. New technologies excite me more than they concern me
5. Science is such a big part of our lives that we should all take an interest
6. The benefits of science are greater than any harmful effect
7. Scientific advances tend to benefit the rich more than they benefit the poor
8. We should use more natural ways of farming
9. People have the right to modify the natural environment to suit their needs
10. Human activities have a significant impact on the planet
11. People shouldn’t tamper with nature
12. I believe that everything in the world is connected
13. Not vaccinating children puts others at risk
14. Children must be protected from all risks
------------------------------------ [NEW SCREEN] --------------------------------------
[PRESENT TO ALL]:
Throughout this survey the terms ‘genetic modification’ or GM and ‘biotechnology’
will be used.
The definitions of these terms are below:
Genetic modification or GM is using laboratory techniques to basically, “cut and paste” a gene from one living thing to another, or modifying or removing a gene
within an organism.
Biotechnology is using the science of living things and biological processes to develop or make products. It is broader than genetic modification or GM and
includes other processes that do not change genetic information. It is used in food production such as culturing yoghurt and brewing beer as well as in farming and
agriculture, and in medical treatments and research.
If you need to remind yourself of the definitions, please hover over the link at
the bottom of each page of this survey.
[INCLUDE HOVER OVER/POP UP OF DEFINITION AT BOTTOM OF SCREEN
WHERE SPECIFIED -Label link as: Definitions: Biotechnology and GM
Genetic modification or GM is using laboratory techniques to basically, “cut and paste” a gene from one living thing to another, or modifying or removing a gene within an
organism.
Biotechnology is using the science of living things and biological processes to develop
or make products. It is broader than genetic modification or GM and includes other
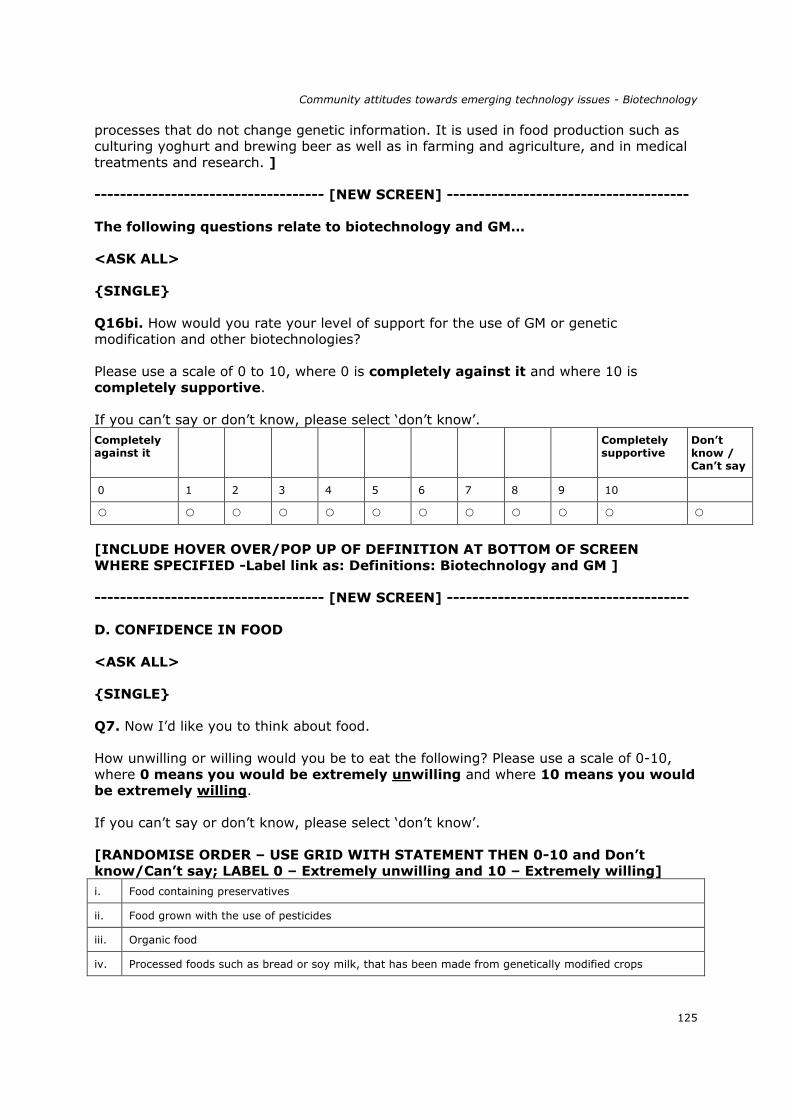
Community attitudes towards emerging technology issues - Biotechnology
125
processes that do not change genetic information. It is used in food production such as culturing yoghurt and brewing beer as well as in farming and agriculture, and in medical
treatments and research. ]
------------------------------------ [NEW SCREEN] --------------------------------------
The following questions relate to biotechnology and GM…
<ASK ALL>
{SINGLE}
Q16bi. How would you rate your level of support for the use of GM or genetic modification and other biotechnologies?
Please use a scale of 0 to 10, where 0 is completely against it and where 10 is completely supportive.
If you can’t say or don’t know, please select ‘don’t know’.
Completely against it
Completely supportive
Don’t
know / Can’t say
0 1 2 3 4 5 6 7 8 9 10
[INCLUDE HOVER OVER/POP UP OF DEFINITION AT BOTTOM OF SCREEN
WHERE SPECIFIED -Label link as: Definitions: Biotechnology and GM ]
------------------------------------ [NEW SCREEN] --------------------------------------
D. CONFIDENCE IN FOOD
<ASK ALL>
{SINGLE}
Q7. Now I’d like you to think about food.
How unwilling or willing would you be to eat the following? Please use a scale of 0-10,
where 0 means you would be extremely unwilling and where 10 means you would be extremely willing.
If you can’t say or don’t know, please select ‘don’t know’.
[RANDOMISE ORDER – USE GRID WITH STATEMENT THEN 0-10 and Don’t know/Can’t say; LABEL 0 – Extremely unwilling and 10 – Extremely willing]
i. Food containing preservatives
ii. Food grown with the use of pesticides
iii. Organic food
iv. Processed foods such as bread or soy milk, that has been made from genetically modified crops

Community attitudes towards emerging technology issues - Biotechnology
126
v. Processed foods such as cakes or biscuits that contain only a small amount of genetically modified
ingredients
vi. Genetically modified fruit and vegetables
vii. Meat and other products from animals that have been fed with genetically modified stock feed
viii. Meat and other products from genetically modified animals
ix. Meat and other products from cloned animals
x. Meat and other products from the offspring of cloned animals
[INCLUDE HOVER OVER/POP UP OF DEFINITION AT BOTTOM OF SCREEN
WHERE SPECIFIED -Label link as: Definitions: Biotechnology and GM ]
------------------------------------ [NEW SCREEN] --------------------------------------
E. ATTITUDES AND BELIEFS
<ASK ALL>
{SINGLE}
Q8i. Can you please say how much you disagree or agree with each of the following statements using a scale where 0 is strongly disagree and 10 is strongly agree.
If you don’t know or can’t say, please select ‘don’t know’.
[RANDOMISE ORDER – USE GRID WITH STATEMENT THEN WITH 0-10 and Don’t
know/Can’t say; LABEL 0 – Strongly disagree and 10 – Strongly agree]
Statement
i. The characteristics of plants and animals should only be changed through traditional breeding methods
ii. We should accept some degree of risk from genetic modification if it enhances Australia’s economic
competitiveness
iii. We should reject genetic modification if it reduces Australia’s economic competitiveness
v. Australian farms need genetically modified organisms to stay financially viable
vi. Australian farms need to be free of genetically modified organisms to stay financially viable
xi. Privacy laws should prevent governments and other organisations from accessing information on
people’s genetic make-up
xiii. The Australian government should enable the community to participate more in decisions on
biotechnology issues including regulation
xvii. Commercial use of genetic modification and its products should only be allowed after regulatory approval
[INCLUDE HOVER OVER/POP UP OF DEFINITION AT BOTTOM OF SCREEN
WHERE SPECIFIED -Label link as: Definitions: Biotechnology and GM ]
------------------------------------ [NEW SCREEN] --------------------------------------
<ASK ALL>

Community attitudes towards emerging technology issues - Biotechnology
127
{SINGLE}
Q9. Please say whether you think each of the following statements is true or false.
If you can’t say, or don’t know, please select ‘don’t know’.
[RANDOMISE ORDER]
Application True False
Don’t
know
i. Most of the processed foods in Australian supermarkets contain genetically
modified ingredients 1 2 9
ii. Most of the fresh fruit and vegetables grown in Australia are genetically modified
1 2 9
iii. Most of the cotton grown in Australia is genetically modified 1 2 9
iv. Most of the vegetable oils produced in Australia are made from genetically
modified crops 1 2 9
[INCLUDE HOVER OVER/POP UP OF DEFINITION AT BOTTOM OF SCREEN
WHERE SPECIFIED -Label link as: Definitions: Biotechnology and GM ]
------------------------------------ [NEW SCREEN] --------------------------------------
<ASK ALL>
{OPEN ENDED – NO CODING REQUIRED}
Q11a. Which organisation or organisations do you believe are responsible for the regulation of genetic modification and other biotechnologies in Australia?
If you don’t know or can’t say please tick the box below
[PLEASE INCLUDE DON’T KNOW/CAN’T SAY TICK BOX]
CODE FRAME TO USE:
Food Standards Australia New Zealand or FSANZ 1
The Office Of The Gene Technology Regulator (OGTR) 2
DAFF Biosecurity or (Department Of Agriculture, Fisheries And Forestry (Daff) Biosecurity ) [FULL
NAME] 3
Biosecurity Australia 4
The Australian Pesticides and Veterinary Medicines Authority (APVMA) 5
The Department of Industry, Innovation, Science, Research and Tertiary Education 6
National Health And Medical Research Council (NH&MRC) 7
Therapeutic Goods Administration (TGA) 8
Australian Health Ethics Committee (AHEC) 9

Community attitudes towards emerging technology issues - Biotechnology
128
Department of Health & Ageing/Department of Health 10
CSIRO 11
Federal Government/ ”The Government” – NFI 12
Local Government – NFI 13
State Government – NFI 14
Other Department/Agency/Body 15
Department Of Agriculture, Fisheries and Forestry (DAFF) 16
None 98
Don’t Know 99
[INCLUDE HOVER OVER/POP UP OF DEFINITION AT BOTTOM OF SCREEN
WHERE SPECIFIED -Label link as: Definitions: Biotechnology and GM ]
------------------------------------ [NEW SCREEN] --------------------------------------
<ASK ALL>
{SINGLE}
Q11c.Have you heard of the following organisations?
[RANDOMISE]
Yes No
Don’t know
i. Food Standards Australia New Zealand or FSANZ 1 0 99
ii. The Office of The Gene Technology Regulator (OGTR) 1 0 99
iii. DAFF Biosecurity or (Department of Agriculture, Fisheries And Forestry
Biosecurity )
1 0 99
iv. Biosecurity Australia 1 0 99
vii. National Health and Medical Research Council (NH&MRC) 1 0 99
viii. Therapeutic Goods Administration (TGA) 1 0 99
------------------------------------ [NEW SCREEN] --------------------------------------
<IF Q11c_ii, Q11c_iii, Q11c_iv, Q11c_vii OR Q11c_viii = 1 >
{SINGLE}
Q11di How much trust do you place in the following organisations on a scale
where 0 is do not trust at all and 10 is trust completely?
If you can’t say, or don’t know please select ‘don’t know’.
[PRESERVE ORDER FROM PREVIOUS QUESTION– USE GRID WITH STATEMENT
THEN WITH 0-10 and Don’t know/Can’t say; LABEL 0 – Do not trust at all and 10 – Trust completely]

Community attitudes towards emerging technology issues - Biotechnology
129
i. Food Standards Australia New Zealand or FSANZ
ii. The Office of The Gene Technology Regulator (OGTR)
iii. DAFF Biosecurity or (Department of Agriculture, Fisheries and Forestry Biosecurity )
iv. Biosecurity Australia
vii. National Health and Medical Research Council (NH&MRC)
viii. Therapeutic Goods Administration (TGA)
------------------------------------ [NEW SCREEN] --------------------------------------
<IF Q11c_ii, Q11c_iii, Q11c_iv, Q11c_vii OR Q11c_viii = 1 >
{SINGLE}
Q11dii And how much trust do you place on what these organisations tell you about the
risks and benefits of biotechnology on a scale where 0 is do not trust at all and 10 is trust completely?
If you can’t say, or don’t know please select ‘don’t know’.
[PRESERVE ORDER FROM PREVIOUS QUESTION– USE GRID WITH STATEMENT
THEN 0-10 and Don’t know/Can’t say; LABEL 0 – Do not trust at all and 10 – Trust completely]
i. Food Standards Australia New Zealand or FSANZ
ii. The Office of The Gene Technology Regulator (OGTR)
iii. DAFF Biosecurity or (Department of Agriculture, Fisheries and Forestry (DAFF) Biosecurity )
iv. Biosecurity Australia
vii. National Health and Medical Research Council (NH&MRC)
viii. Therapeutic Goods Administration (TGA)
------------------------------------ [NEW SCREEN] --------------------------------------
[PRESENT TO ALL]
Another area of science is nanotechnology.
Nanotechnology is science at a very small scale. It refers to new devices and materials
with key parts about 10,000 times smaller than the width of a human hair. Working at this scale allows researchers to create new materials and products such as making
sunscreens that are more transparent or drugs that can target individual cells
[INCLUDE HOVER OVER/POP UP OF DEFINITION AT BOTTOM OF SCREEN
WHERE SPECIFIED -Label link as: Definition: Nanotechnology
Nanotechnology is science at a very small scale. It refers to new devices and materials
with key parts about 10,000 times smaller than the width of a human hair. Working at
this scale allows researchers to create new materials and products such as making sunscreens that are more transparent or drugs that can target individual cells ]
------------------------------------ [NEW SCREEN] --------------------------------------

Community attitudes towards emerging technology issues - Biotechnology
130
<ASK ALL>
{SINGLE}
Q12a. How positive or negative, would you say you feel towards the potential implications of nanotechnology? Please use a 0 to 10 scale where 0 is extremely negative
and 10 is extremely positive? If you can’t say or don’t know, just say so.
Extremely
negative
Extremely
positive
Don’t
know/
Can’t say
0 1 2 3 4 5 6 7 8 9 10
[INCLUDE HOVER OVER/POP UP OF DEFINITION AT BOTTOM OF SCREEN -Label link as: Definition: Nanotechnology]
------------------------------------ [NEW SCREEN] --------------------------------------
<ASK ALL>
{SINGLE}
Q19i. How much trust do you place on what the following groups tell you about the risks
and benefits of nanotechnology on a scale where 0 is do not trust at all and 10 is trust completely?
If you can’t say or don’t know, just say so.
[RANDOMISE AND USE GRID WITH STATEMENT THEN 0-10 – Label: 0 – Do not trust at all; 10 Trust completely; Can’t say/don’t know]
0-10
99 = Can’t
say/Don’t
know
A Industry associations
B Government agencies or regulators
C Scientists
D Manufacturers and distributors of consumer products
E mass media
F non-government organisations or NGO’s and community advocacy groups
G Science Institutes and organisations such as CSIRO and universities
[INCLUDE HOVER OVER/POP UP OF DEFINITION AT BOTTOM OF SCREEN -Label link as: Definition: Nanotechnology]
------------------------------------ [NEW SCREEN] --------------------------------------
<ASK ALL>

Community attitudes towards emerging technology issues - Biotechnology
131
{SINGLE}
Q19ii. And to what extent would you say that the following groups have the expertise
to tell you about the risks and benefits of nanotechnology?
Please use a scale from 0 to 10 where 0 is strongly disagree that they have the
expertise and 10 is strongly agree that they have the expertise?
If you can’t say or don’t know, just say so.
[RANDOMISE AND USE GRID WITH STATEMENT THEN 0-10 – Label: 0 – Strongly
disagree have expertise; 10 Strongly agree have expertise; Can’t say/don’t know]
RECORD 0-
10
OR 99 =
Can’t
say/Don’t know
A Industry associations
B Government agencies or regulators
C Scientists
D Manufacturers and distributors of consumer products
E Mass media
F non-government organisations or NGO’s and community advocacy groups
G Science Institutes and organisations such as CSIRO and universities
[INCLUDE HOVER OVER/POP UP OF DEFINITION AT BOTTOM OF SCREEN -Label link as: Definition: Nanotechnology]
------------------------------------ [NEW SCREEN] --------------------------------------
<ASK ALL>
{SINGLE}
Q17i. How important do you believe it is that government agencies allocate budget
resources to the following…?
Please use a scale of 0-10 where 0 is not important at all and 10 is critical.
If you can’t say or don’t know, please just say so.
[RANDOMISE AND USE GRID WITH STATEMENT THEN 0-10 – Label: 0 – Not important at all; 10 - Critical; Can’t say/don’t know]
0-10
99= Can’t say/don’t know
A Monitor nanotechnology developments
B Monitor products for the presence of nanoparticles

Community attitudes towards emerging technology issues - Biotechnology
132
0-10
99= Can’t say/don’t know
C Provide funding to private enterprises to develop nanotechnology
D Provide funding to public institutions, like universities, to research nanotechnology
E Provide regular information to the general public about nanotechnology
F Regulate the development of nanotechnology
G Require testing of all products using nanotechnology
Hi Regulate labelling of products using nanotechnology
[INCLUDE HOVER OVER/POP UP OF DEFINITION AT BOTTOM OF SCREEN -Label link as: Definition: Nanotechnology]
------------------------------------ [NEW SCREEN] --------------------------------------
<ASK ALL>
{SINGLE}
Q22i. We are near the end of the survey now.
What is your level of support for the following science and technology developments? If
for any of the technologies, you are not sure, please just say so.
Using a scale of 0 to 10 where 0 is completely against it and 10 is completely
supportive, how would you say you feel towards:
[RANDMOISE AND USE GRID WITH STATEMENT THEN 0-10 – Label: 0 –
completely against it; 10 - completely supportive; Can’t say/don’t know]
[RECORD 0-10
99 = Can’t say don’t know]
A Stem cell research
B Genetically modified foods or GM foods
C Cloning (including therapeutic cloning)
D The role of science and technology in addressing climate change
E Synthetic Biology research
F Quantum Computing research
G Nanotechnology
------------------------------------ [NEW SCREEN] --------------------------------------
I. Demographics
Finally, just a few questions to ensure that we’ve included a good range of
people in our survey.

Community attitudes towards emerging technology issues - Biotechnology
133
<ASK ALL>
{SINGLE} #Q21i. Are there children under 10 years of age living in your
household?#
Q21i. Are there children under 10 years of age living in your household?
No 0
Yes 1
<ASK ALL>
{SINGLE}
Q23. What is the highest level of education you have ever attempted, whether or not you finished? Please select one only
No formal schooling 1
Primary school 2
Some high school 3
Year 10/4th Form 4
Year 11/5th Form 5
Year 12/6th Form 6
Technical school, commercial college or TAFE 7
University degree or diploma (undergraduate or postgraduate) 8
Something else [SPECIFY] 9
------------------------------------ [NEW SCREEN] --------------------------------------
<ASK ALL>
{SINGLE}
Q23i. Which of the following best describes you…? Please select one only
Employed full time 1
Employed part time 2
Retired or Pensioner 3
Home duties 4
School or secondary student 5
TAFE or university student 6
Unemployed 7
Other (SPECIFY) 8
Prefer not to say 9

Community attitudes towards emerging technology issues - Biotechnology
134
------------------------------------ [NEW SCREEN] --------------------------------------
<ASK ALL>
{SINGLE}
Q24. Do you identify as Aboriginal or Torres Strait Islander?
Yes 1
No 0
<ASK ALL>
{SINGLE}
Q25.Do you speak any language other than English in your home?
No, English only 0
Yes, [SPECIFY] 1
<ASK ALL>
{SINGLE}
Q26. What is your residential postcode? [RECORD]
[INCLUDE TICK BOX FOR DON’T KNOW/NOT SURE]
------------------------------------ [NEW SCREEN] --------------------------------------
<ASK ALL>
Q30a. As part of this study, we may be organising further research sessions with people about emerging technologies. Would you happy for us to contact you about taking part in
further research?
Yes 1
No 2
<ASK ALL>
{SINGLE}
Q30. At the completion of this research, the findings will also be available online. Would
you be interested us emailing you a link to the results?
If you select yes, your name and contact details will be passed onto the Department of
Industry, Innovation, Science, Research and Tertiary Education and will be used only for
the purpose of sending you the results.
Please be assured that your personal details will be treated in strict confidence and will
remain separate to your responses to this survey.
Yes, I would be interested in getting the research findings 2
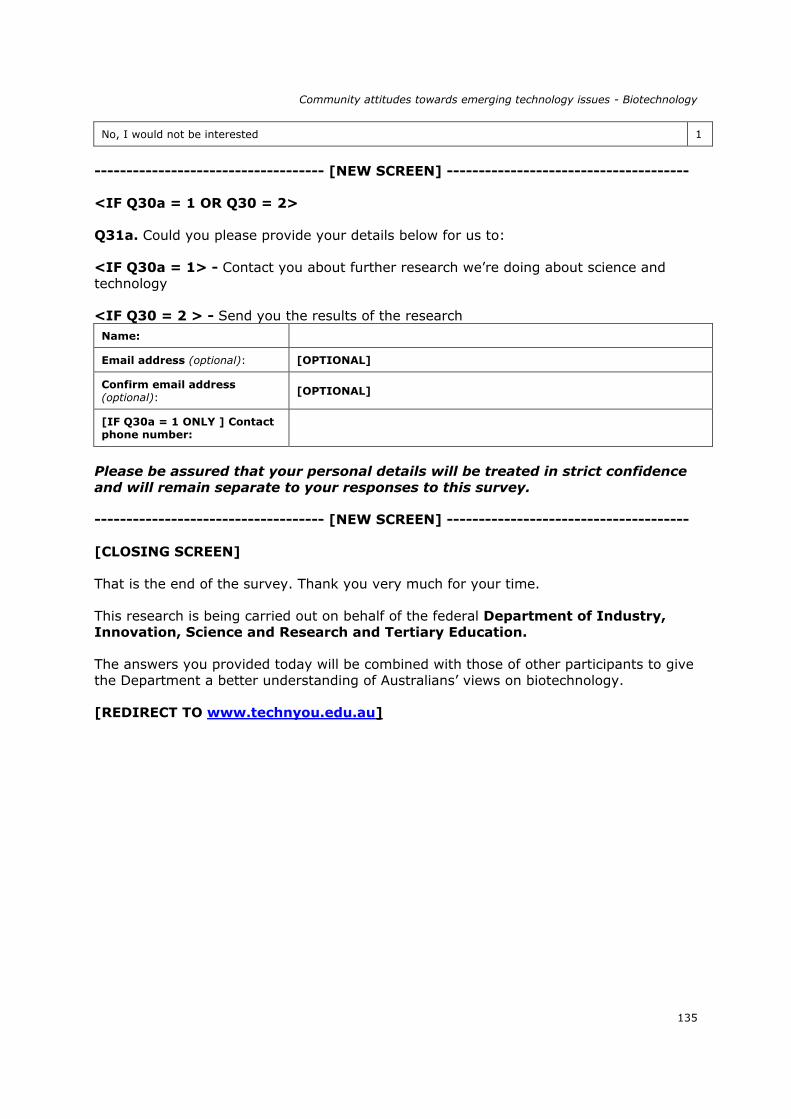
Community attitudes towards emerging technology issues - Biotechnology
135
No, I would not be interested 1
------------------------------------ [NEW SCREEN] --------------------------------------
<IF Q30a = 1 OR Q30 = 2>
Q31a. Could you please provide your details below for us to:
<IF Q30a = 1> - Contact you about further research we’re doing about science and
technology
<IF Q30 = 2 > - Send you the results of the research
Name:
Email address (optional): [OPTIONAL]
Confirm email address
(optional): [OPTIONAL]
[IF Q30a = 1 ONLY ] Contact phone number:
Please be assured that your personal details will be treated in strict confidence
and will remain separate to your responses to this survey.
------------------------------------ [NEW SCREEN] --------------------------------------
[CLOSING SCREEN]
That is the end of the survey. Thank you very much for your time.
This research is being carried out on behalf of the federal Department of Industry,
Innovation, Science and Research and Tertiary Education.
The answers you provided today will be combined with those of other participants to give
the Department a better understanding of Australians’ views on biotechnology.
[REDIRECT TO www.technyou.edu.au]