communications in soil science and plant analysis
TRANSCRIPT
This article was downloaded by:[Fontana, Ademir]On: 27 March 2008Access Details: [subscription number 791739054]Publisher: Taylor & FrancisInforma Ltd Registered in England and Wales Registered Number: 1072954Registered office: Mortimer House, 37-41 Mortimer Street, London W1T 3JH, UK
Communications in Soil Science andPlant AnalysisPublication details, including instructions for authors and subscription information:http://www.informaworld.com/smpp/title~content=t713597241
Distribution of Organic Carbon in the Humic Fractions ofDiagnostic Horizons from Brazilian SoilsAdemir Fontana a; Marcos Gervasio Pereira b; Lúcia Helena Cunha dos Anjos b;Vinicius de Melo Benites ca Graduate Course of Agronomy-Soil Science, Universidade Federal Rural do Rio deJaneiro (UFRRJ), Seropédica, Brazilb Soils Department, UFRRJ, Seropédica, Brazilc Embrapa Soils, Rio de Janeiro, Brazil
Online Publication Date: 01 April 2008To cite this Article: Fontana, Ademir, Pereira, Marcos Gervasio, Anjos, Lúcia
Helena Cunha dos and Benites, Vinicius de Melo (2008) 'Distribution of Organic Carbon in the Humic Fractions ofDiagnostic Horizons from Brazilian Soils', Communications in Soil Science and Plant Analysis, 39:7, 951 - 971To link to this article: DOI: 10.1080/00103620801925323URL: http://dx.doi.org/10.1080/00103620801925323
PLEASE SCROLL DOWN FOR ARTICLE
Full terms and conditions of use: http://www.informaworld.com/terms-and-conditions-of-access.pdf
This article maybe used for research, teaching and private study purposes. Any substantial or systematic reproduction,re-distribution, re-selling, loan or sub-licensing, systematic supply or distribution in any form to anyone is expresslyforbidden.
The publisher does not give any warranty express or implied or make any representation that the contents will becomplete or accurate or up to date. The accuracy of any instructions, formulae and drug doses should beindependently verified with primary sources. The publisher shall not be liable for any loss, actions, claims, proceedings,demand or costs or damages whatsoever or howsoever caused arising directly or indirectly in connection with orarising out of the use of this material.

Dow
nloa
ded
By:
[Fon
tana
, Ade
mir]
At:
18:0
5 27
Mar
ch 2
008
Distribution of Organic Carbon in theHumic Fractions of Diagnostic Horizons
from Brazilian Soils
Ademir Fontana,1 Marcos Gervasio Pereira,2 Lucia HelenaCunha dos Anjos,2 and Vinicius de Melo Benites3
1Graduate Course of Agronomy–Soil Science, Universidade Federal
Rural do Rio de Janeiro (UFRRJ), Seropedica, Brazil2Soils Department, UFRRJ, Seropedica, Brazil
3Embrapa Soils, Rio de Janeiro, Brazil
Abstract: This study was developed on 52 soil profiles, 61 surface diagnostic horizons,
and 26 subsurface diagnostic horizons classified according to the Soil Taxonomy and
Brazilian Soil Classification System (SiBCS) as Mollisols (Chernossolos), Spodosols
(Espodossolos), Entisols (Gleissolos), Oxisols (Latossolos), and Histosols (Organosso-
los). The objective was to quantify the carbon (C) in organic matter fractions and to
correlate it with soil chemical attributes. Soil organic matter was fractionated into
fulvic acids (C-FAF), humic acids (C-HAF), and humin (C-HUM), and the ratios
C-HAF/C-FAF and AE (alkaline extract)/C-HUM were calculated. Humin was the
predominant fraction in Mollisols and Oxisols, which showed values of AE/C-HUM
and C-HAF/C-FAF lower than 1.0. The humin fraction was also predominant in
surface horizons of Spodosols and Entisols, whereas a higher content of C-FAF and
C-FAH was observed in the subsurface horizons, with values higher than 1.5 for the
AE/C-HUM ratio. C-HAF was predominant in the Histosols, and C-HAF/C-FAF
ratio values were higher than 2.0. The highest correlation values with soil attributes
were observed for C-HAF, C-HUM, and total organic C with pH, sum of bases, and
cation exchange capacity. The differences in humic substances distribution was a
Received 31 October 2006, Accepted 5 May 2007
Address correspondence to Ademir Fontana, Graduate Course of Agronomy–Soil
Science, Universidade Federal Rural do Rio de Janeiro (UFRRJ), Seropedica, Brazil.
E-mail: [email protected]
Communications in Soil Science and Plant Analysis, 39: 951–971, 2008
Copyright # Taylor & Francis Group, LLC
ISSN 0010-3624 print/1532-2416 online
DOI: 10.1080/00103620801925323
951
Dow
nloa
ded
By:
[Fon
tana
, Ade
mir]
At:
18:0
5 27
Mar
ch 2
008
useful parameter to characterize soil orders in the Brazilian soil classification system
and to understand pedogenic processes.
Keywords: Chemical fractioning, humic substances, pedogenesis, soil organic matter
INTRODUCTION
Increasing attention has been given to soil organic matter in pedological studies
and characterization of tropical soils. Originally, the Brazilian soil classification
only used total organic carbon (C) content as a differential attribute to distinguish
mineral from organic soil materials and to identify diagnostic surface horizons
(Embrapa 1988). The Brazilian Soil Classification System (SiBCS) (Embrapa
2006) introduced new differential attributes associated with soil organic matter
(SOM) such as decomposition level and fiber content, among others. This way,
the SiBCS approximated soil taxonomy systems in which qualitative and quan-
titative variables related to SOM were used as diagnostic attributes, especially for
Spodosols, Mollisols, and Histosols classes (Soil Survey Staff 1999).
Soil organic matter, by means of humic substances, is involved in
important soil genesis processes such as (a) favoring weathering (Ehrlich
1990), (b) reducing iron oxides’ crystallinity (Pereira and Anjos 1999;
Cornell and Schwertmann 1996), (c) promoting modifications in hematite/goethite ratio (Kampf and Schwertmann 1983), and (d) having an effect
intensity of on various pedogenetic processes (Duchaufour 1977; Buol,
Hole, and McCracken 1980; Fanning and Fanning 1989).
Organic compounds are referred to as main agents influencing pedoge-
netic processes that originate in Mollic, Spodic, Histic, and Gley diagnostic
soil horizons (Anjos, Pereira, and Ramos 1999). Valladares et al. (2003),
studying Histosols from different Brazilian states, emphasized the usage of
attributes derived from SOM fractioning, such as the fulvic acid (C-FAF)
and humic acid (C-HAF) fractions, and the alkaline extract (AE)/humin
(C-HUM) ratio to separate Histosols in fifth and sixth (family and series)
categorical levels, demonstrating that these fractions could be used for
individualization of soil classes at a low taxonomic level.
The objective of this study was to quantify the C in organic-matter
fractions and to correlate it with soil chemical attributes of selected diagnostic
horizons from Brazilian soils.
MATERIAL AND METHODS
Fifty-two soil profiles from different Brazilian states were sampled, described,
and characterized according to routine soil survey procedures. Soil classes
were distributed as following: 13 Mollisols (Chernossolos), 5 Spodosols
(Espodossolos), 10 Entisols (Gleissolos), 16 Oxisols (Latossolos), and 8
A. Fontana et al.952

Dow
nloa
ded
By:
[Fon
tana
, Ade
mir]
At:
18:0
5 27
Mar
ch 2
008
Histosols (Organossolos). A total of 87 diagnostic horizons were selected,
including 61 surface horizons/epipedons and 26 subsurface horizons (Table 1).
Profile Descriptions and Characterizations
The soil profiles were described according to procedures in the Manual for
Soil Description and Collecting (Santos et al. 2005) and classified
according to Soil Taxonomy (Soil Survey Staff 1999) and Embrapa (2006).
Soil chemical and physical properties were analyzed according to Embrapa
(1997). They included soil pH; contents of calcium (Ca2þ), magnesium
(Mg2þ), sodium (Naþ), potassium (Kþ), aluminum (Al3þ), and H þ Al;
total organic C (TOC); sand, silt, and clay fractions; and sum of bases
(S value) and cation exchange capacity, CEC (T value).
Humic Substance Chemical Fractioning
The humic substances were separated using differential solubility techniques,
applying the humic fractions concept established by Humic Substances Inter-
national Society (Swift 1996) with modifications according to Benites,
Madari, and Machado (2003). Soil samples containing about 1.0 g of C for
mineral horizons or 0.5 g of C for histic horizons and 20 mL of 0.1 mol
L21 sodium hydroxide (NaOH) were used in the extraction of C-HAF and
C-FAF, with a contact time of 24 h. The separation between the alkaline
extract (AE ¼ C-FAF þ C-FAH) and the residue was performed by
Table 1. Surface and subsurface diagnostic horizons identified according to Soil
Taxonomy (USA) and equivalents in SiBCS (Brazil)
Soil Taxonomya SiBCSbSample
numbers
Surface horizons/epipedons
Anthropic A antropico 1
Mollic A chermozemico 13
Umbric A humico 5
Ochric A moderado 21
Ochric weak A fraco 1
Histic H hıstico 17
Subsurface horizons
Spodic B espodiso 5
Oxic B latossolico 16
Gley B and C glei 5
aSoil taxonomy (Soil Survey Staff 1999).bSiBCS (Embrapa 2006).
Organic Carbon in Humic Fractions 953

Dow
nloa
ded
By:
[Fon
tana
, Ade
mir]
At:
18:0
5 27
Mar
ch 2
008
centrifugation at 5000 g (gravity) for 30 min. Residue washings were carried
out with the same solution, and extracts previously obtained were added,
resulting in a final volume of approximately 40 mL. The residue was
collected, dried, and reserved for determination of C as humin compounds
(HUM). The alkaline extract (AE) had the pH lowered to 1.0 þ 0.1 with 20%
sulfuric acid (H2SO4) and was decanted for 18 h. The precipitate, HAF, was
separated from the soluble fraction (FAF) by means of filtering, and the
volumes of both fraction extracts were adjusted to 50 mL with distilled water.
The determination of organic C in FAF and HAF extracts was performed
according to the method of Yeomans and Bremner (1988) using 5 mL of
extract, 1 mL of 0.042 mol L21 potassium dichromate (K2Cr2O7), and 5 mL of
concentrated H2SO4; 0.012 mol L21 ferrous ammonium sulfate [Fe(NH4)2
(SO4)2. 6H2O] was used for titration. Organic C in the HUM fraction was
extracted by adding 5 mL of 0.167 mol L21 potassium dichromate (K2Cr2O7)
and 10 mL of concentrated H2SO4 and quantified by titration with
0.25 mol L21 ferrous ammonium sulfate [Fe(NH4)2(SO4)2. 6H2O], using
ferroin (0.025 mol L21) as indicator.
From the content of organic C in the fulvic acid fraction (C-FAF), humic
acid fraction (C-HAF), and humin fraction (C-HUM), the percentage of each
fraction in relation to TOC (% TOC), the C-HAF/C-FAF ratio, and the
AE/C-HUM ratio was calculated.
Statistical Analyses
Statistical techniques and the Pearson correlation method were used for the com-
parison of organic C contents in humic fractions and TOC in each soil class and
surface and subsurface horizons. To compare the soil classes as related to soil
organic C attributes, the principal components analysis (PCA) was performed
using the XL Stat program. All attributes were standardized, taking the
average as equal to 0 and variance equal to 1.0 (Morrison 1976). The
following attributes were selected by correlation analysis: TOC, %FAF,
%HAF, %HUM, C-HAF/C-FAF ratio, AE/C-HUM ratio, and total clay content.
RESULTS AND DISCUSSION
Principal Component Analysis Applied to Groups of Soils
PCA of diagnostic horizon variables were initially performed considering the
two first factors with accumulated variance of 74.20%, following another
evaluation for soil orders, resulting in an accumulated variance of 74.46%.
Because the diagnostic horizons’ data distribution showed some horizons
with a behavior distinct from the others, a study was conducted to establish
standards based on contribution of selected variables. The selected diagnostic
A. Fontana et al.954
Dow
nloa
ded
By:
[Fon
tana
, Ade
mir]
At:
18:0
5 27
Mar
ch 2
008
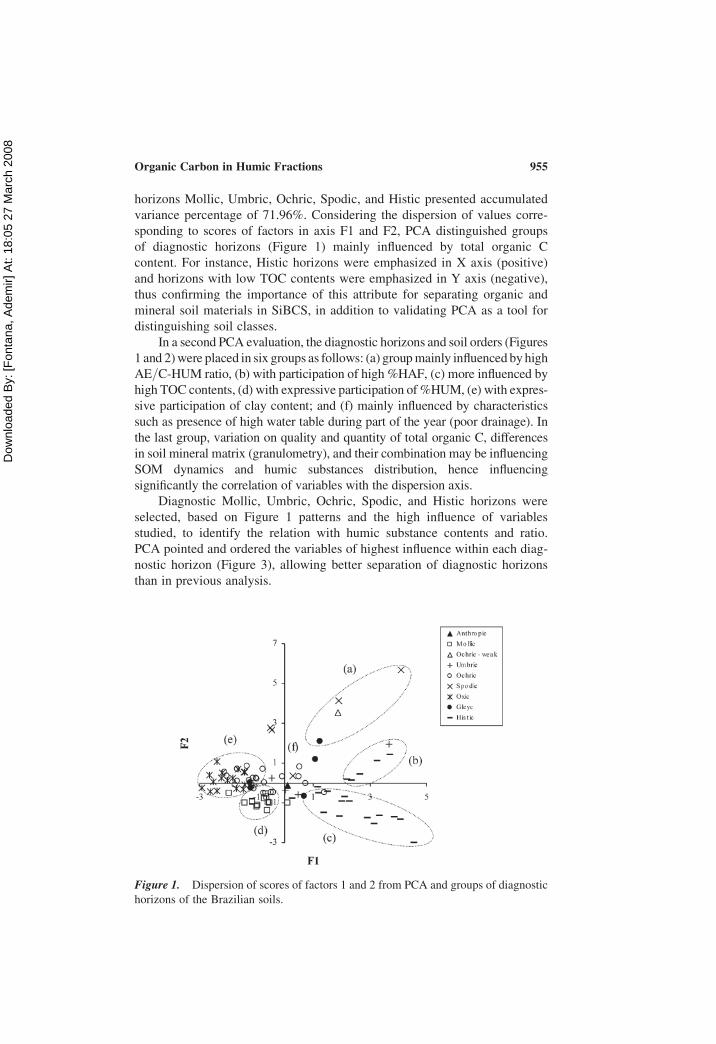
horizons Mollic, Umbric, Ochric, Spodic, and Histic presented accumulated
variance percentage of 71.96%. Considering the dispersion of values corre-
sponding to scores of factors in axis F1 and F2, PCA distinguished groups
of diagnostic horizons (Figure 1) mainly influenced by total organic C
content. For instance, Histic horizons were emphasized in X axis (positive)
and horizons with low TOC contents were emphasized in Y axis (negative),
thus confirming the importance of this attribute for separating organic and
mineral soil materials in SiBCS, in addition to validating PCA as a tool for
distinguishing soil classes.
In a second PCA evaluation, the diagnostic horizons and soil orders (Figures
1 and 2) were placed in six groups as follows: (a) group mainly influenced by high
AE/C-HUM ratio, (b) with participation of high %HAF, (c) more influenced by
high TOC contents, (d) with expressive participation of %HUM, (e) with expres-
sive participation of clay content; and (f) mainly influenced by characteristics
such as presence of high water table during part of the year (poor drainage). In
the last group, variation on quality and quantity of total organic C, differences
in soil mineral matrix (granulometry), and their combination may be influencing
SOM dynamics and humic substances distribution, hence influencing
significantly the correlation of variables with the dispersion axis.
Diagnostic Mollic, Umbric, Ochric, Spodic, and Histic horizons were
selected, based on Figure 1 patterns and the high influence of variables
studied, to identify the relation with humic substance contents and ratio.
PCA pointed and ordered the variables of highest influence within each diag-
nostic horizon (Figure 3), allowing better separation of diagnostic horizons
than in previous analysis.
Figure 1. Dispersion of scores of factors 1 and 2 from PCA and groups of diagnostic
horizons of the Brazilian soils.
Organic Carbon in Humic Fractions 955

Dow
nloa
ded
By:
[Fon
tana
, Ade
mir]
At:
18:0
5 27
Mar
ch 2
008
Organic Carbon Content and Humic Substances
Well-Drained Mineral Soils (Mollisols and Oxisols)
Total organic C values ranged from 4.4 to 44.8 g kg21 (average of 19.2 g
kg21), and the highest contents were observed in Mollisols, with most
horizons presenting values of more than 30 g kg21. This expresses the high
Figure 2. Dispersion of scores of factors 1 and 2 from PCA and groups of soil orders.
Figure 3. Dispersion of scores of factors 1 and 2 from PCA and groups of selected
diagnostic horizons of the Brazilian soils.
A. Fontana et al.956

Dow
nloa
ded
By:
[Fon
tana
, Ade
mir]
At:
18:0
5 27
Mar
ch 2
008
stability of organic matter of Mollisols, due to calcium ions that favor
formation of calcium humates (Kononova 1966; Theng 1979; Duchaufour,
1983). The lowest TOC contents were observed in oxic subsurface
horizons, with intermediate values in the surface horizons of Oxisols
(Table 2).
The organic C in the humic substances showed highest average contents
for C-HUM, and it was the predominant SOM fraction in all horizons. The
values ranged from 3.0 to 36.8 g kg21 (average of 11.8 g kg21), with an
average C-HUM contribution of 61.0% of total organic C (Table 2). The
C-HUM in well-drained mineral soils was the most relevant humic substances
fraction, possibly due to the high stability of this faction and strong interaction
with soil mineral matrix, thus delaying SOM mineralization and enabling its
accumulation.
The C-HAF/C-FAF ratio presented a large variation of values (Table 2),
ranging from 0.08 to 3.50 (average of 0.83), with 71.1% of values less than
1.0, demonstrating the predominance of C-FAF rather than C-HAF, especially
in the Oxisols. The dispersion of C-HAF/C-FAF ratio is also noted in
Figure 4, where a negative correlation of the C-HAF/C-FAF ratio with clay
content is verified.
Zhang, Thompson, and Sandor (1988), working with soils derived from
loess in Iowa State, observed in Mollisols a C-HAF/C-FAF ratio of 1.68
and 1.95 for uncultivated and cultivated soils respectively. A different
behavior was shown by Alfisols, where the values were 2.01 and 0.73 for
uncultivated and cultivated soils. Martin-Neto, Rosell, and Sposito (1998),
in uncultivated Mollisols from the Argentina Pampa region, found much
higher values of the C-HAF/C-FAF ratio, between 2.5 and 4.6. According
to Dabin (1980–1981), Ortega (1982), and Canellas et al. (2000), in
weathered soils, values less than 1.0 for this ratio are associated with
intense mineralization of organic residues. Possibly the climate and parent
materials also play an important rule in the C-HAF/C-FAF ratio, even for
the same soil orders, explaining the differences found for the Brazilian soils.
On the other hand, the AE/C-HUM ratio showed small variation, with
values ranging from 0.17 to 1.07 (average of 0.51), and 93.3% of values
were less than 1.0, demonstrating the predominance of C-HUM in well-
drained mineral soils. The lowest values (less than 0.35) were observed for
the Mollisols, which is in agreement with findings of Melo (2002) and
Benites, Ker, and Mendonca (2000). Studies on SOM fractioning from
Brazilian Oxisols (Benites 1998; Benites, Ker, and Mendonca 2000; Lima
2001; Melo 2002; Cunha et al. 2003) show a trend of values less than 1.0,
both for C-HAF/C-FAF and AE/C-HUM ratios.
On Mollisols, Pearson correlation for organic C in humic fractions and
TOC with soil chemical properties and clay content showed that only
C-HAF stood out, presenting significant and negative correlation with S
value (r ¼ 2 0.67��) and clay content (r ¼ 20.68��). This result is related
to formation in Mollisols of high-stability compounds of C-HAF with Ca2þ
Organic Carbon in Humic Fractions 957

Dow
nloa
ded
By:
[Fon
tana
, Ade
mir]
At:
18:0
5 27
Mar
ch 2
008
Table 2. Organic carbon in humic substancesa from Brazilian Mollisols and Oxisols
Profile Horizon
C-FAF
(g kg21)
C-HAF
(g kg21)
C-HUM
(g kg21)
C-SUM
(g kg21)
TOC
(g kg21)
FAF
(% TOC)
HAF
(% TOC)
HUM
(% TOC)
C-HAF/C-FAF
AE/C-
HUM
Mollisols (n ¼13)
CMS1b A 2.1 2.5 21.0 25.6 30.7 7 8 68 1.19 0.22
CMS2 A 2.9 3.9 19.6 26.4 30.1 10 13 65 1.34 0.35
CMS3 A 1.6 5.6 36.8 44.0 44.8 4 13 82 3.50 0.20
CMS4 A 3.9 1.5 31.9 37.3 44.8 9 3 71 0.38 0.17
CMS5 A 3.0 3.9 36.4 43.3 44.8 7 9 81 1.30 0.19
CMS6 A 2.6 4.1 31.9 38.6 43.5 6 9 73 1.58 0.21
CMS7 A 1.9 3.8 21.0 26.7 30.2 6 13 70 2.00 0.27
CMS8 A 2.3 2.6 19.9 24.8 30.7 7 8 65 1.13 0.25
CMS9 A 1.4 4.5 19.9 25.8 36.9 4 12 54 3.21 0.30
CMS10 A1 2.5 2.2 26.7 31.4 44.8 6 5 60 0.88 0.18
CPR Ap 1.5 0.4 7.1 9.0 23.2 6 2 31 0.27 0.27
CRJ Ap 0.8 0.9 9.4 11.1 22.4 4 4 42 1.13 0.18
CRN A1 2.5 1.6 12.3 16.4 15.6 16 10 79 0.64 0.33
Oxisols (n ¼ 16)
LAM1 A 5.1 15.0 26.6 46.7 44.8 11 33 59 2.94 0.76
LAM1 Bw1 1.1 0.3 4.4 5.8 4.8 23 6 92 0.27 0.32
LAM2 A 3.1 2.7 9.0 14.8 17.3 18 16 52 0.87 0.64
LAM2 Bw1 2.4 0.6 3.6 6.6 7.0 34 9 51 0.25 0.83
LBA A 6.0 2.5 9.5 18.0 18.8 32 13 51 0.42 0.89
LBA Bw2 1.5 0.4 3.5 5.4 5.2 29 8 67 0.27 0.54
LGO A 5.3 2.7 13.5 21.5 24.2 22 11 56 0.51 0.59
LGO Bw2 1.2 0.2 3.1 4.5 4.4 27 5 70 0.17 0.45
A.
Fo
nta
na
eta
l.9
58
Dow
nloa
ded
By:
[Fon
tana
, Ade
mir]
At:
18:0
5 27
Mar
ch 2
008
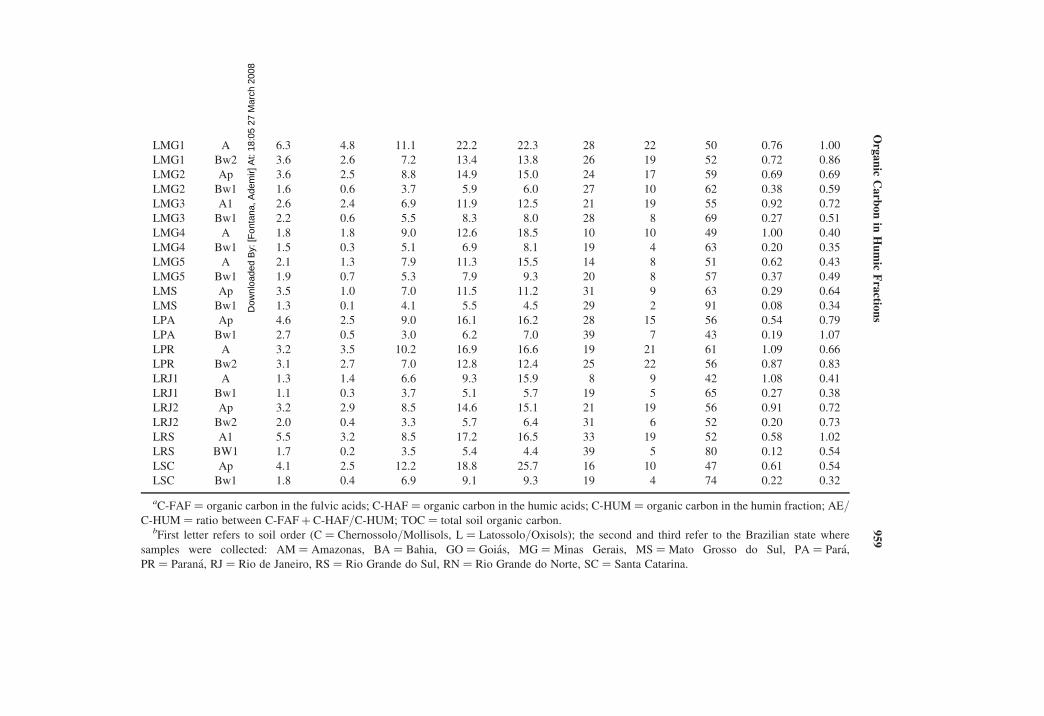
LMG1 A 6.3 4.8 11.1 22.2 22.3 28 22 50 0.76 1.00
LMG1 Bw2 3.6 2.6 7.2 13.4 13.8 26 19 52 0.72 0.86
LMG2 Ap 3.6 2.5 8.8 14.9 15.0 24 17 59 0.69 0.69
LMG2 Bw1 1.6 0.6 3.7 5.9 6.0 27 10 62 0.38 0.59
LMG3 A1 2.6 2.4 6.9 11.9 12.5 21 19 55 0.92 0.72
LMG3 Bw1 2.2 0.6 5.5 8.3 8.0 28 8 69 0.27 0.51
LMG4 A 1.8 1.8 9.0 12.6 18.5 10 10 49 1.00 0.40
LMG4 Bw1 1.5 0.3 5.1 6.9 8.1 19 4 63 0.20 0.35
LMG5 A 2.1 1.3 7.9 11.3 15.5 14 8 51 0.62 0.43
LMG5 Bw1 1.9 0.7 5.3 7.9 9.3 20 8 57 0.37 0.49
LMS Ap 3.5 1.0 7.0 11.5 11.2 31 9 63 0.29 0.64
LMS Bw1 1.3 0.1 4.1 5.5 4.5 29 2 91 0.08 0.34
LPA Ap 4.6 2.5 9.0 16.1 16.2 28 15 56 0.54 0.79
LPA Bw1 2.7 0.5 3.0 6.2 7.0 39 7 43 0.19 1.07
LPR A 3.2 3.5 10.2 16.9 16.6 19 21 61 1.09 0.66
LPR Bw2 3.1 2.7 7.0 12.8 12.4 25 22 56 0.87 0.83
LRJ1 A 1.3 1.4 6.6 9.3 15.9 8 9 42 1.08 0.41
LRJ1 Bw1 1.1 0.3 3.7 5.1 5.7 19 5 65 0.27 0.38
LRJ2 Ap 3.2 2.9 8.5 14.6 15.1 21 19 56 0.91 0.72
LRJ2 Bw2 2.0 0.4 3.3 5.7 6.4 31 6 52 0.20 0.73
LRS A1 5.5 3.2 8.5 17.2 16.5 33 19 52 0.58 1.02
LRS BW1 1.7 0.2 3.5 5.4 4.4 39 5 80 0.12 0.54
LSC Ap 4.1 2.5 12.2 18.8 25.7 16 10 47 0.61 0.54
LSC Bw1 1.8 0.4 6.9 9.1 9.3 19 4 74 0.22 0.32
aC-FAF ¼ organic carbon in the fulvic acids; C-HAF ¼ organic carbon in the humic acids; C-HUM ¼ organic carbon in the humin fraction; AE/C-HUM ¼ ratio between C-FAF þ C-HAF/C-HUM; TOC ¼ total soil organic carbon.
bFirst letter refers to soil order (C ¼ Chernossolo/Mollisols, L ¼ Latossolo/Oxisols); the second and third refer to the Brazilian state where
samples were collected: AM ¼ Amazonas, BA ¼ Bahia, GO ¼ Goias, MG ¼ Minas Gerais, MS ¼ Mato Grosso do Sul, PA ¼ Para,
PR ¼ Parana, RJ ¼ Rio de Janeiro, RS ¼ Rio Grande do Sul, RN ¼ Rio Grande do Norte, SC ¼ Santa Catarina.
Org
an
icC
arb
on
inH
um
icF
ractio
ns
95
9

Dow
nloa
ded
By:
[Fon
tana
, Ade
mir]
At:
18:0
5 27
Mar
ch 2
008
(calcium humates) (Theng 1979), making the complete extraction of this
fraction during SOM fractioning less efficient. In the Oxisols, significant
values of Pearson correlation of organic matter with soil chemical properties
were observed (Table 3). For surface horizons, C-FAF presented a significant
and positive correlation with Hþ (r ¼ 0.61��), CEC, and clay content.
However, the highest correlation values were observed between C-HAF and
the S value (r ¼ 0.78���) and CEC (r ¼ 0.82���); C-HUM with S value
(r ¼ 0.83���) and CEC (r ¼ 0.89���); and TOC with S value (r ¼ 0.84���)
and CEC (r ¼ 0.92���). For the Oxisols subsurface horizons, the highest
values were for correlation of C-HUM with Hþ and CEC (r ¼ 0.82��� and
r ¼ 0.81���, respectively), and the lowest were for correlation of C-FAF
with these properties.
Mendonca and Rowell (1996) studied Oxisols from Brazilian Cerrado
region with predominance of kaolinite and gibbsite minerals in the clay
fraction, and they observed a significant contribution from humic substances
in CEC. It was noted that even with clay content increasing with depth,
CEC remained basically unchanged.
Mineral and Poorly or Imperfectly Drained Soils (Spodosols and
Entisols)
Because of the occurrence of surface histic horizons in some Spodosols and
Entisols sampled, the TOC contents presented a wide variation, with values
ranging from 2.4 g kg21 to 317.0 g kg21, the highest values in the histic
horizons. For the mineral horizons, values of TOC were between 2.4 and
Figure 4. Dispersion diagram of the C-HAF/C-FAF ratio and clay content for the
soil orders in Mollisols (n ¼ 13) and Oxisols (n ¼ 32).
A. Fontana et al.960

Dow
nloa
ded
By:
[Fon
tana
, Ade
mir]
At:
18:0
5 27
Mar
ch 2
008
76.5 g kg21. The narrowest variation amplitude, with contents ranging from
7.1 to 19.2 g kg21, was observed for spodic B horizons (Table 4). Vejre
et al. (2003) observed in soils from Denmark that surface horizons of
Spodosols presented a large TOC variation, in opposition to the spodic
horizons. Such behavior was also verified by Benites (2002) in upland soils
under rupestrian vegetation in Serra do Espinhaco and Serra da Mantiqueira,
on Brazilian southeast region. Gomes et al. (1998) and Gomes (2005) found a
similar distribution in Spodosols from Sao Paulo and Rio de Janeiro sandy
coastal areas.
Fractioning of SOM in soil profiles classified as Spodosols and Entisols
showed highest average values for C-HUM (16.9 g kg21), especially in
surface horizons, with average values for HUM fraction of 35.5%. In the
spodic and gley horizons, C-FAF and C-HAF were predominant in relation
to C-HUM. Carbon content in fulvic acid and humic acid fractions varied in
dominance for the different Spodosols and Entisols soil profiles (Table 4).
According to Santos (1984), the alternating seasonal flooding and drying
that occurs on Spodosols and Entisols landscape allows for intense organic-
matter oxidation in the surface horizons. This favors formation of HUM
Table 3. Pearson correlation for organic carbon in humic fractions and TOC with
chemical properties and clay content in Oxisols and Histosols
Properties C-FAF C-HAF C-HUM C-SUM TOC
Oxisols—surface horizons (n ¼ 16)
pH — 0.59�� 0.60��� 0.56� 0.58��
S — 0.78��� 0.83��� 0.78��� 0.84���
Hþ 0.61�� — — — 0.42�
CEC 0.45� 0.82��� 0.89��� 0.87��� 0.92���
Clay 0.49� — — — —
Oxisols—subsurface horizons (n ¼ 16)
pH — — — — —
S — — — — —
Hþ 0.65�� 0.79��� 0.82��� 0.87��� 0.82���
CEC 0.43� 0.58�� 0.81��� 0.74��� 0.67���
Clay — — — — —
Histosols (n ¼17)
pH — 20.54� 20.54� 20.58�� 20.81���
S 0.50� — 0.41� — —
Hþ — 0.47� — — 0.46�
CEC — 0.54� — 0.46� 0.64��
���Significant at 0.1%; ��significant at 1%; �significant at 5%.
Notes. C-FAF ¼ organic carbon in fulvic acids; C-HAF ¼ organic carbon in humic
acids; C-HUM ¼ organic carbon in humin fraction; C-SUM ¼ sum of organic carbon
in all fractions; TOC ¼ total soil organic carbon; pH ¼ pH water (1:2.5); S ¼ sum of
base value; Hþ ¼ hydrogen; CEC ¼ cation exchange capacity.
Organic Carbon in Humic Fractions 961

Dow
nloa
ded
By:
[Fon
tana
, Ade
mir]
At:
18:0
5 27
Mar
ch 2
008
Table 4. Organic carbon distribution in humic substancesa from Brazilian Spodosols and Entisols
Profile Horizon
C-FAF
(g kg21)
C-HAF
(g kg21)
C-HUM
(g kg21)
C-SUM
(g kg21)
TOC
(g kg21)
FAF
(% TOC)
HAF
(% TOC)
HUM
(% TOC)
C-FAH/C-FAF
AE/C-
HUM
Spodosols (n ¼ 5)
EPR1b A 1.8 3.3 3.7 8.8 8.8 20 38 42 1.83 1.38
EPR1 Bh2 4.1 1.4 1.5 7.0 7.1 58 20 21 0.34 3.67
EPR2 A 0.8 1.5 0.3 2.6 2.4 33 63 13 1.88 7.67
EPR2 Bh2 4.3 5.9 0.7 10.9 15.3 28 39 5 1.37 14.57
ERJ Ho1 14.3 49.6 145.2 209.1 317.0 5 16 46 3.47 0.44
ERJ Bhj 6.9 0.4 1.4 8.7 12.6 55 3 11 0.06 5.21
ERO Ap 2.6 10.3 10.1 23.0 76.5 3 13 13 3.96 1.28
ERO Bhs1 2.9 2.0 3.3 8.2 19.2 15 10 17 0.69 1.48
ESP A 1.7 4.8 7.0 13.5 16.4 10 29 43 2.82 0.93
ESP Bhsj2 2.4 10.0 0.5 12.9 17.1 14 58 3 4.17 24.8
Entisols (n ¼ 10)
GBA A1 4.7 12.5 31.0 48.2 63.5 7 20 49 2.66 0.55
GBA Cg 1.5 3.3 1.7 6.5 5.4 28 61 31 2.20 2.82
GMS A 2.1 1.5 10.0 13.6 17.9 12 8 56 0.71 0.36
A.
Fo
nta
na
eta
l.9
62
Dow
nloa
ded
By:
[Fon
tana
, Ade
mir]
At:
18:0
5 27
Mar
ch 2
008
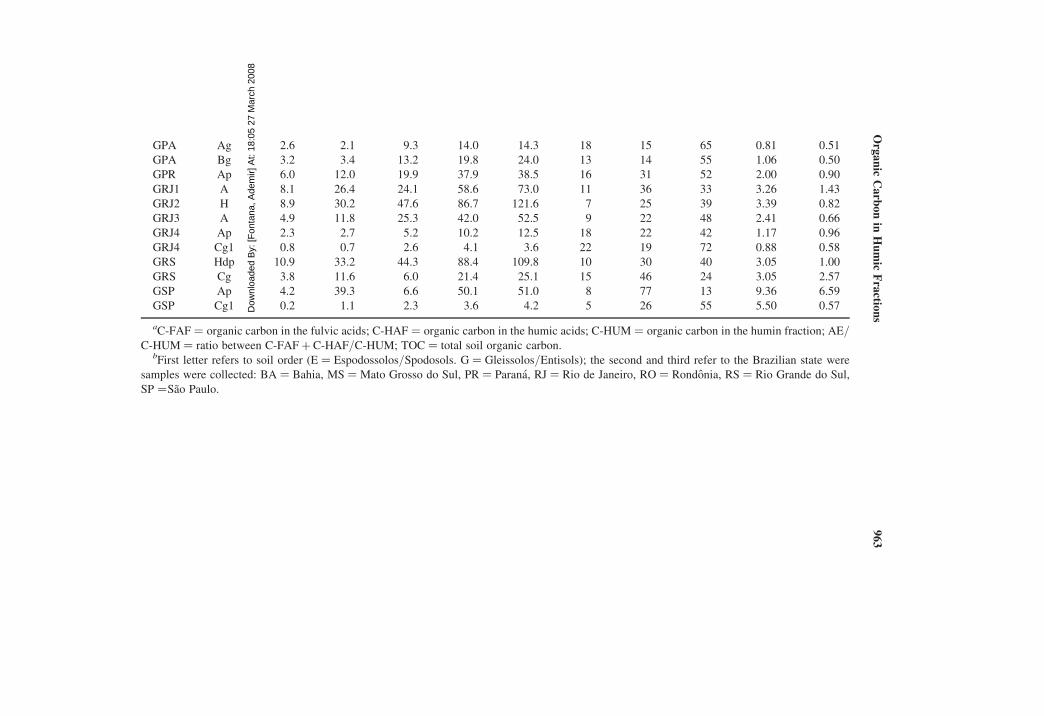
GPA Ag 2.6 2.1 9.3 14.0 14.3 18 15 65 0.81 0.51
GPA Bg 3.2 3.4 13.2 19.8 24.0 13 14 55 1.06 0.50
GPR Ap 6.0 12.0 19.9 37.9 38.5 16 31 52 2.00 0.90
GRJ1 A 8.1 26.4 24.1 58.6 73.0 11 36 33 3.26 1.43
GRJ2 H 8.9 30.2 47.6 86.7 121.6 7 25 39 3.39 0.82
GRJ3 A 4.9 11.8 25.3 42.0 52.5 9 22 48 2.41 0.66
GRJ4 Ap 2.3 2.7 5.2 10.2 12.5 18 22 42 1.17 0.96
GRJ4 Cg1 0.8 0.7 2.6 4.1 3.6 22 19 72 0.88 0.58
GRS Hdp 10.9 33.2 44.3 88.4 109.8 10 30 40 3.05 1.00
GRS Cg 3.8 11.6 6.0 21.4 25.1 15 46 24 3.05 2.57
GSP Ap 4.2 39.3 6.6 50.1 51.0 8 77 13 9.36 6.59
GSP Cg1 0.2 1.1 2.3 3.6 4.2 5 26 55 5.50 0.57
aC-FAF ¼ organic carbon in the fulvic acids; C-HAF ¼ organic carbon in the humic acids; C-HUM ¼ organic carbon in the humin fraction; AE/C-HUM ¼ ratio between C-FAF þ C-HAF/C-HUM; TOC ¼ total soil organic carbon.
bFirst letter refers to soil order (E ¼ Espodossolos/Spodosols. G ¼ Gleissolos/Entisols); the second and third refer to the Brazilian state were
samples were collected: BA ¼ Bahia, MS ¼ Mato Grosso do Sul, PR ¼ Parana, RJ ¼ Rio de Janeiro, RO ¼ Rondonia, RS ¼ Rio Grande do Sul,
SP ¼Sao Paulo.
Org
an
icC
arb
on
inH
um
icF
ractio
ns
96
3

Dow
nloa
ded
By:
[Fon
tana
, Ade
mir]
At:
18:0
5 27
Mar
ch 2
008
because of the slow transformation of organic matter into more stable
organic compounds through the loss of OCH3 groups from lignin. For
spodic horizons, the fulvic and humic acids, because of their higher reactivity
and molecular weight, form more soluble complexes, thus interfering more
intensely in the medium and facilitating lixiviation of ions and eluviation
of clay, favoring to the pedogenetic process of podzolization (Deb 1949;
Benites et al. 2001; Buol, Hole, and McCracken 1980; Anjos, Pereira, and
Ramos 1999).
The C-HAF/C-FAF ratio was higher than 1.0 for most soil horizons, and
a wide variation between values was observed (Table 4). For surface horizons
of Spodosols and Entisols, values ranged from 0.71 to 9.36, and for subsurface
horizons, from 0.06 to 5.50. Similar variation was observed by Gomes et al.
(1998), studying soils formed in sandy coastal areas, north of Rio de
Janeiro State. Bonifacio et al. (2006), studying genesis of Spodosols and
Histosols, found predominance of C-FAF over C-HAF, in agreement with
Benites’ (1998) results for Spodosols, though Benites (2002) reported dissim-
ilar behavior in upland soils under rupestrian vegetation in Serra do Espinhaco
and Serra da Mantiqueira, with predominance of C-HAF over C-FAF. The
differences might be related to intensity of soil-forming factors such as
climate, relief (altitude), and vegetation. According to Oliveira (1999), FAF
was the most active component in the podzolization pedogenetic process.
The same was reported by Benites et al. (2001), studying upland soils of
Serra do Brigadeiro State Park (State of Minas Gerais).
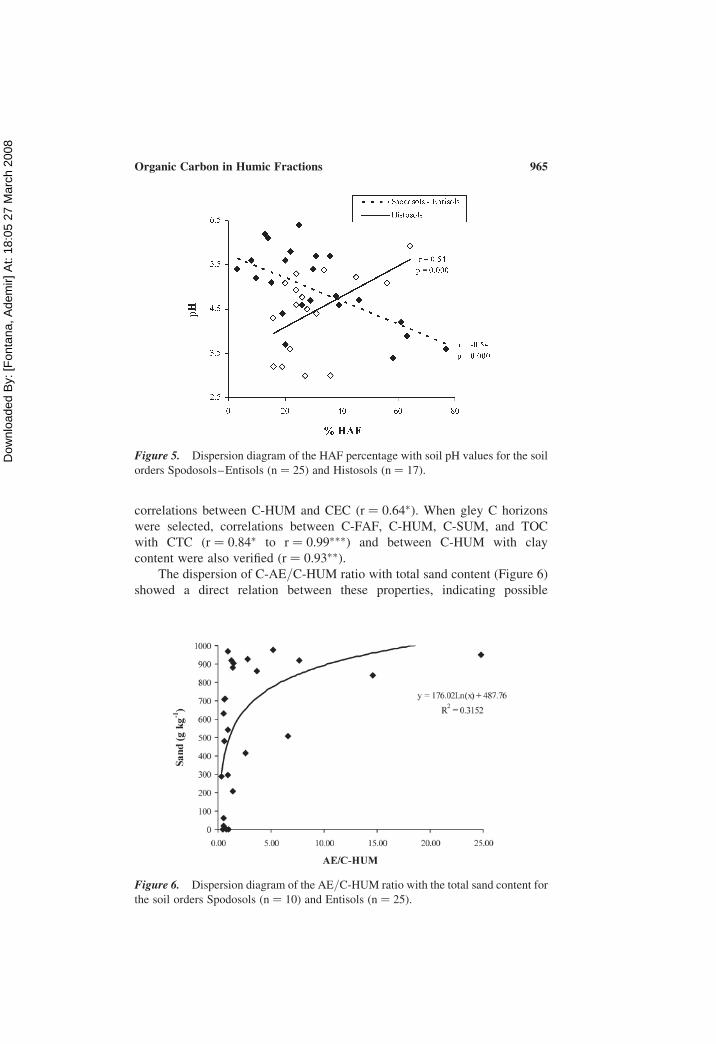
For Spodosols, the predominance of humic acids was inversely related to
soil pH, because an increase of HAF content occurred along with a pH
decrease. Also, at a lower pH, the humic acids tend to precipitate because
of their reduced solubility, as indicated by Figure 5. According to Schnitzer
(1986), humic acids form insoluble complexes in pH values less than 6.5
when associated to colloids, thus enabling immobilization and accumulation
of this fraction in acid soils.
The AE/C-HUM ratio also presented a wide variation. The values
ranged from 0.36 to 7.67 in surface horizons and from 0.58 to 24.8 for sub-
surface horizons (Table 4). Especially for spodic and gley horizons, the
values of AE/C-HUM ratio were generally higher than 1.5, indicating
movement of alkaline-soluble compounds with increasing soil depth.
Similar values of AE/C-HUM ratio were observed by Schaefer et al.
(2002) and Benites (1998; 2002), studying Spodosols, and by Melo (2002)
in Entisols, indicating that these relations might provide information about
the genesis of these soils, evidencing layers or horizons with depletion or
accumulation of soil organic C.
On Spodosols, Pearson correlation coefficients for organic C in humic
fractions and TOC with soil chemical properties and clay content showed
high significant and negative correlations between C-HAF and C-SUM with
pH (r ¼ 20.98�� and r ¼ 20.96��) and positive correlation with CEC
(r ¼ 0.80� and r ¼ 0.86�). The surface horizons of Entisols only presented
A. Fontana et al.964
Dow
nloa
ded
By:
[Fon
tana
, Ade
mir]
At:
18:0
5 27
Mar
ch 2
008
correlations between C-HUM and CEC (r ¼ 0.64�). When gley C horizons
were selected, correlations between C-FAF, C-HUM, C-SUM, and TOC
with CTC (r ¼ 0.84� to r ¼ 0.99���) and between C-HUM with clay
content were also verified (r ¼ 0.93��).
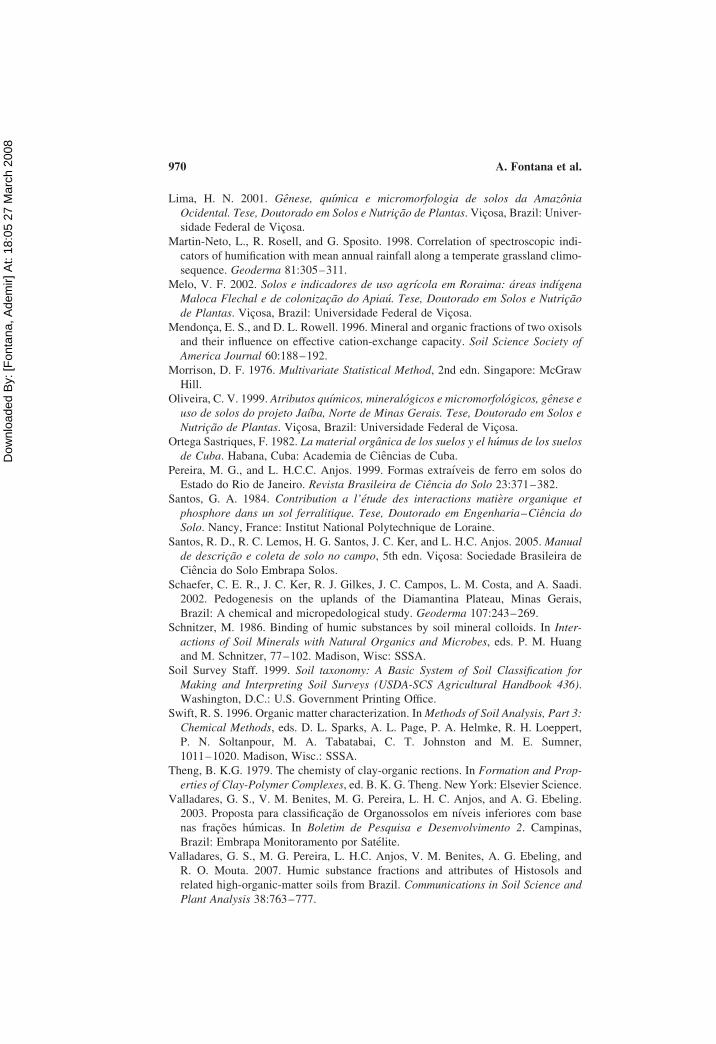
The dispersion of C-AE/C-HUM ratio with total sand content (Figure 6)
showed a direct relation between these properties, indicating possible
Figure 5. Dispersion diagram of the HAF percentage with soil pH values for the soil
orders Spodosols–Entisols (n ¼ 25) and Histosols (n ¼ 17).
Figure 6. Dispersion diagram of the AE/C-HUM ratio with the total sand content for
the soil orders Spodosols (n ¼ 10) and Entisols (n ¼ 25).
Organic Carbon in Humic Fractions 965

Dow
nloa
ded
By:
[Fon
tana
, Ade
mir]
At:
18:0
5 27
Mar
ch 2
008
influence of granulometry on distribution of humic substances in relation
to TOC.
Organic and Very Poorly Drained Soils (Histosols)
The Histosols profiles had a wide variation of TOC, ranging from 114.3 to
568.8 g kg21 (average of 351.3 g kg21). This variation may result from
the heterogeneity of organic deposits in different environments and
climatic conditions (Table 5). Couto and Resende (1985), studying SOM
of soils with gley and histic horizons, in the southeastern region of Bahia
State, found an average value of 369 g kg21 of TOC from a collection of
59 soil horizons.
The fractioning of soil organic matter of Histosols showed that C-HAF
presented the highest average values (94.5 g kg21), with a small dominance
in relation to C-HUM, which had an average of 90.3 g kg21 (Table 5). The
average percentage of HAF was 30.1%, and HUM was of 25.5%. Benites
(2002), studying upland soils under rupestrian vegetation in Serra do
Espinhaco and Serra da Mantiqueira, also observed predominance of humic
acids to the detriment of other SOM fractions. Valladares et al. (2007),
studying Histosols from different states of Brazil, and Conceicao et al.
(1999), in soils from coastal lowlands of Rio de Janeiro State, found dissimilar
behavior where C-HUM was predominant.
The C-HAF/C-FAF ratio in Histosols varied from 1.91 to 16.95, present-
ing the highest average values (6.14) among all soil orders studied (Table 5).
The humic acid fraction accumulation in the Histosols is associated with
humic substances synthetic route, dominant at constant water-lodging con-
ditions, instead of the solubility of HAF as occurs in mineral soils. As
showed in Figure 5, increase of pH resulted in no significant change of
HAF values. Similar behavior was observed by Benites (2002) and Valladares
et al. (2007) in Histosols. The AE/C-HUM ratio also presented wide variation,
with values ranging from 0.41 to 7.24 and an average of 1.64 (Table 5). Most
horizons (76%) had values less than 2.0, in agreement with Valladares et al.
(2007).
For Histosols, C-FAF and C-HUM presented significant and positive
correlation with S value. The C-HAF, C-HUM, and TOC showed corre-
lation with CEC, with emphasis for TOC (r ¼ 0.64�), evidencing the
importance of TOC for increasing soil CEC. The C-HAF, C-HUM,
C-SUM, and TOC had significant and negative correlation with pH
(r ¼ 20.54� to r ¼ 20.81���). C-HAF and TOC also presented significant
and positive correlation with Hþ (r ¼ 0.47� and 0.46�), demonstrating the
contribution of SOM fractions in soil acidity and pH values (Table 3).
These results are relevant to the management of Histosols, mainly consider-
ing that agricultural practices such as drainage and intensive liming result in
fast decrease of TOC.
A. Fontana et al.966

Dow
nloa
ded
By:
[Fon
tana
, Ade
mir]
At:
18:0
5 27
Mar
ch 2
008
Table 5. Organic carbon distribution in humic substancesa from Brazilian Histosols
Profile Horizon
C-FAF
(g kg21)
C-HAF
(g kg21)
C-HUM
(g kg21)
C-SUM
(g kg21)
TOC
(g kg21)
FAF
(% TOC)
HAF
(% TOC)
HUM
(% TOC) C-FAH/C-FAF AE/C-HUM
OALb Hdopj 17.6 101.3 112.7 231.6 522.3 3 19 22 5.76 1.06
OAL Hdopj1 16.8 189.5 151.1 357.4 529.3 3 36 29 11.28 1.37
ODF Hd1 14.4 92.8 26.6 133.8 145.8 10 64 18 6.44 4.03
ODF Hd2 12.1 57.2 25.3 94.6 167.6 7 34 15 4.73 2.74
OMG Hdo1 11.7 22.4 71.9 106.0 114.3 10 20 63 1.91 0.47
OMS Hdo1 14.8 57.2 26.0 98.0 182.4 8 31 14 3.86 2.77
OMS 2Hd 6.9 75.3 38.5 120.7 459.8 2 16 8 10.91 2.14
ORJ Hdp 21.8 90.1 88.8 200.7 349.5 6 26 25 4.13 1.26
ORJ Hdo1 29.2 91.5 106.2 226.9 375.0 8 24 28 3.13 1.14
ORJ Hdo2 36.1 92.8 81.1 210.0 391.3 9 24 21 2.57 1.59
ORS Hdpj 15.3 126.3 113.8 255.4 470.0 3 27 24 8.25 1.24
ORS Hdj 14.2 93.4 113.8 221.4 568.8 2 16 20 6.58 0.95
ORS Hdoj 7.2 122.0 201.8 331.0 556.4 1 22 36 16.94 0.64
OSC H1 32.7 78.0 95.1 205.8 277.2 12 28 34 2.39 1.16
OSC H2 26.0 108.5 224.5 359.0 445.7 6 24 50 4.17 0.60
OSP Hp1 23.3 104.6 40.6 168.5 231.0 10 45 18 4.49 3.15
OSP Hp2 15.1 104.4 16.5 136.0 186.2 8 56 9 6.91 7.24
aC-FAF ¼ organic carbon in the fulvic acids; C-HAF ¼ organic carbon in the humic acids; C-HUM ¼ organic carbon in the humin fraction; AE/C-HUM ¼ ratio between C-FAF þ C-HAF/C-HUM; TOC ¼ total soil organic carbon.
bFirst letter refers to soil order (O ¼ Organossolos/Histosols); the second and third refer to the Brazilian state where samples were collected:
AL ¼ Alagoas, DF ¼ Distrito Federal, MG ¼ Minas Gerais, MS ¼ Mato Grosso do Sul, RJ ¼ Rio de Janeiro, RS ¼ Rio Grande do Sul,
SC ¼ Santa Catarina, SP ¼ Sao Paulo.
Org
an
icC
arb
on
inH
um
icF
ractio
ns
96
7

Dow
nloa
ded
By:
[Fon
tana
, Ade
mir]
At:
18:0
5 27
Mar
ch 2
008
CONCLUSIONS
Mollisols and Oxisols presented HUM as dominant humic substance fraction,
with AE/C-HUM and C-HAF/C-FAF ratio values less than 1.0. In Spodosols
and Entisols, HUM was predominant in surface horizons, whereas in subsur-
face horizons, FAF and HAF fractions had highest participation and AE/C-
HUM ratio values were more than 1.5. For Histosols, C-HAF was predominant
and C-HAF/C-FAF ratio values were greater than 2.0.
Correlation coefficient values of humic substances and TOC with soil
chemical attributes and granulometry presented distinct patterns between
soil orders. The best correlations of C-HAF, C-HUM, and TOC were
observed with pH, S value, and CEC.
The differences in humic substance distribution of diagnostic horizons, by
means of chemical fractioning, was a useful parameter to characterize soil
orders in the Brazilian Soil Classification System. Variations in values of
SOM fractions and their ratios, between soil orders and within the soil
profiles, are also relevant to understand pedogenic processes.
ACKNOWLEDGMENTS
We are grateful to Conselho Nacional de Desenvol Vimento Cientıfico e
Tecnologico (CNPq), Graduate Course in Agronomy–Soil Science (CPGA-
CS/UFRRJ), and Embrapa Solos for the financial and technical support for
this project.
REFERENCES
Anjos, L. H. C., M. G. Pereira, and D. P. Ramos. 1999. Materia organica e pedogenese.In Fundamentos da materia organica do solo: Ecossistemas tropicais e subtropicaiseds. G. A. Santos and F. A. O. Camargo, 91–116. Genesis: Porto Alegre.
Benites, V. M. 1998. Caracterizacao quımica e espectroscopica da materia organica esuas relacoes com a genese de solos da Serra do Brigadeiro, Zona da Mata Mineira.Dissertacao, Mestrado em Solos e Nutricao de Plantas. Vicosa, Brazil: UniversidadeFederal de Vicosa.
Benites, V. M. 2002. Caracterizacao de solos e das substanicas humicas em ComplexoRupestre de Altitude. Tese, Doutorado em Solos e Nutricao de Plantas. Vicosa,Brazil: Universidade Federal de Vicosa.
Benites, V. M., J. C. Ker, and E. S. Mendonca. 2000. Fracionamento quantitativo desubstancias humicas como auxiliar na identificacao de diferentes solos da regiaoSul do Brasil—VI RCC. In Guia de excursao de estudos de solos nos estados doRio Grande do Sul, Santa Catarina e Parana, 184–192. Florestas, Colombo, PR:EMBRAPA.
Benites, V. M., B. Madari, and P. L. O. A. Machado. 2003. Extracao e fracionamentoquantitativo de substancias humicas do solo: um procedimento simplificado de baixocusto. In Comunicado Tecnico 16. Rio de Janeiro, Brazil: Embrapa Solos.
A. Fontana et al.968

Dow
nloa
ded
By:
[Fon
tana
, Ade
mir]
At:
18:0
5 27
Mar
ch 2
008
Benites, V. M., C. E. G. R. Schaefer, E. S. Mendonca, and L. Martin Neto. 2001. Car-
acterizacao da materia organica e micromorfologia de solos sob campos de altitude
no Parque Estadual da Serra do Brigadeiro (MG). Revista Brasileira de Ciencia do
Solo 25:661–674.
Bonifacio, E., S. Santoni, L. Celi, and E. Zanini. 2006. Spodosol—Histosol evolution
in the Krkonose National Park (CZ). Geoderma 131:237–250.
Buol, S. W., F. D. Hole, and R. J. McCracken. 1980. Soil Genesis and Classification.
Ames, Iowa: Iowa State University Press.
Canellas, L. P., P. G. Berner, S. G. Silva, M. B. Silva, and G. A. Santos. 2000. Fracoes
da materia organica em seis solos de uma topossequencia no Estado do Rio de
Janeiro. Pesquisa Agropecuaria Brasileira 35:133–143.
Conceicao, M., A. A. Freixo, W. S. Araujo, T. J. F. Cunha, L. Martin-Neto, and
S. C. Saab. 1999. Caracterizacao das substancias humicas em solos organicos do
estado do Rio de Janeiro, sob diversas atividades agrıcolas. Pesquisa em
andamento 5:1–6.
Cornell, R. M., and U. Schwertmann. 1996. The Iron Oxides: Structure, Properties,
Reactions, Occurrence and Uses. Weinheim, Germany: VCH Verlagsgesellschaft.
Couto, E. G., and M. Resende. 1985. Caracterizacao da materia organica de alguns
solos organicos e gleizados do sudoeste da Bahia. Revista Brasileira de Ciencia
do Solo 9:185–191.
Cunha, T. J. F., L. P. Ribeiro, F. Palmieri, E. F. Silva, and M. Conceicao. 2003. Car-
acterizacao e natureza do humus de Latossolos Amarelos Coesos de Tabuleiro na
Regiao do Reconcavo Baiano. Magistra 15:147–154.
Dabin, B. 1980–1981. Les matieres organiques dans les sols tropicaux normalement
draines. Cah. ORSTROM ser. Pedologic 16:197–215.
Deb, B. C. 1949. The movement and precipitation of iron oxides in Podzol soils.
Journal of Soil Science 1:112–122.
Duchaufour, P. 1977. Pedology. London: George Allen and Unwin.
Duchaufour, P. 1983. Pedologie 1: Pedogeneses et classification. Paris: Masson.
Ehrlich, H. L. 1990. Geomicrobiology. New York: Marcel Dekker.
Embrapa CNPS. 1997. Manual de metodos de analise de solos. Rio de Janeiro, Brazil:
Embrapa.
Embrapa CNPS. 2006. Sistema brasileiro de classificacao de solos, 2nd edn. Rio de
Janeiro, Brazil: EMBRAPA Solos.
Embrapa SNCLS. 1988. Definicao e notacao de horizontes e camadas de solo. In Doc-
umentos, no 3. Rio de Janeiro: Embrapa.
Fanning, D. S., and M. C. B. Fanning. 1989. Soil Morphology, Genesis, and Classifi-
cation. New York: John Wiley.
Gomes, F. H. 2005. Genese e classificacao de solos sob vegetacao de restinga na Ilha
do Cardoso-SP. Tese, Doutorado em Solos e Nutricao de Plantas. Sao Paulo, Brazil:
Universidade de Sao Paulo, Escola Superior de Agricultura Luiz de Queiroz,
Piracicaba.
Gomes, J. B. V., M. Resende, S. B. Rezende, and E. S. Mendonca. 1998. Solos de tres
areas de restinga, II: Dinamica de substancias humicas, ferro e alumınio. Pesquisa
Agropecuaria Brasileira 33:11.
Kampf, N., and U. Schwertmann. 1983. Goethite and hematite in a climosequence in
southern Brazil and their application in classification of kaolinite soils. Geoderma
29:27–39.
Kononova, M. M. 1966. Soil Organic Matter, 2nd edn. Oxford, UK: Pergamon Press.
Organic Carbon in Humic Fractions 969
Dow
nloa
ded
By:
[Fon
tana
, Ade
mir]
At:
18:0
5 27
Mar
ch 2
008
Lima, H. N. 2001. Genese, quımica e micromorfologia de solos da Amazonia
Ocidental. Tese, Doutorado em Solos e Nutricao de Plantas. Vicosa, Brazil: Univer-
sidade Federal de Vicosa.
Martin-Neto, L., R. Rosell, and G. Sposito. 1998. Correlation of spectroscopic indi-
cators of humification with mean annual rainfall along a temperate grassland climo-
sequence. Geoderma 81:305–311.
Melo, V. F. 2002. Solos e indicadores de uso agrıcola em Roraima: areas indıgena
Maloca Flechal e de colonizacao do Apiau. Tese, Doutorado em Solos e Nutricao
de Plantas. Vicosa, Brazil: Universidade Federal de Vicosa.
Mendonca, E. S., and D. L. Rowell. 1996. Mineral and organic fractions of two oxisols
and their influence on effective cation-exchange capacity. Soil Science Society of
America Journal 60:188–192.
Morrison, D. F. 1976. Multivariate Statistical Method, 2nd edn. Singapore: McGraw
Hill.
Oliveira, C. V. 1999. Atributos quımicos, mineralogicos e micromorfologicos, genese e
uso de solos do projeto Jaıba, Norte de Minas Gerais. Tese, Doutorado em Solos e
Nutricao de Plantas. Vicosa, Brazil: Universidade Federal de Vicosa.
Ortega Sastriques, F. 1982. La material organica de los suelos y el humus de los suelos
de Cuba. Habana, Cuba: Academia de Ciencias de Cuba.
Pereira, M. G., and L. H.C.C. Anjos. 1999. Formas extraıveis de ferro em solos do
Estado do Rio de Janeiro. Revista Brasileira de Ciencia do Solo 23:371–382.
Santos, G. A. 1984. Contribution a l’etude des interactions matiere organique et
phosphore dans un sol ferralitique. Tese, Doutorado em Engenharia–Ciencia do
Solo. Nancy, France: Institut National Polytechnique de Loraine.
Santos, R. D., R. C. Lemos, H. G. Santos, J. C. Ker, and L. H.C. Anjos. 2005. Manual
de descricao e coleta de solo no campo, 5th edn. Vicosa: Sociedade Brasileira de
Ciencia do Solo Embrapa Solos.
Schaefer, C. E. R., J. C. Ker, R. J. Gilkes, J. C. Campos, L. M. Costa, and A. Saadi.
2002. Pedogenesis on the uplands of the Diamantina Plateau, Minas Gerais,
Brazil: A chemical and micropedological study. Geoderma 107:243–269.
Schnitzer, M. 1986. Binding of humic substances by soil mineral colloids. In Inter-
actions of Soil Minerals with Natural Organics and Microbes, eds. P. M. Huang
and M. Schnitzer, 77–102. Madison, Wisc: SSSA.
Soil Survey Staff. 1999. Soil taxonomy: A Basic System of Soil Classification for
Making and Interpreting Soil Surveys (USDA-SCS Agricultural Handbook 436).
Washington, D.C.: U.S. Government Printing Office.
Swift, R. S. 1996. Organic matter characterization. In Methods of Soil Analysis, Part 3:
Chemical Methods, eds. D. L. Sparks, A. L. Page, P. A. Helmke, R. H. Loeppert,
P. N. Soltanpour, M. A. Tabatabai, C. T. Johnston and M. E. Sumner,
1011–1020. Madison, Wisc.: SSSA.
Theng, B. K.G. 1979. The chemisty of clay-organic rections. In Formation and Prop-
erties of Clay-Polymer Complexes, ed. B. K. G. Theng. New York: Elsevier Science.
Valladares, G. S., V. M. Benites, M. G. Pereira, L. H. C. Anjos, and A. G. Ebeling.
2003. Proposta para classificacao de Organossolos em nıveis inferiores com base
nas fracoes humicas. In Boletim de Pesquisa e Desenvolvimento 2. Campinas,
Brazil: Embrapa Monitoramento por Satelite.
Valladares, G. S., M. G. Pereira, L. H.C. Anjos, V. M. Benites, A. G. Ebeling, and
R. O. Mouta. 2007. Humic substance fractions and attributes of Histosols and
related high-organic-matter soils from Brazil. Communications in Soil Science and
Plant Analysis 38:763–777.
A. Fontana et al.970

Dow
nloa
ded
By:
[Fon
tana
, Ade
mir]
At:
18:0
5 27
Mar
ch 2
008
Vejre, H., I. Callessen, L. Vesterdal, and K. Raulund-Rasmussen. 2003. Carbon andnitrogen in Danish forest soils, contents and distribution determined by soil order.Soil Science Society of America Journal 67:335–343.
Yoemans, J. C., and J. M. Bremner. 1988. A rapid and precise method for routine deter-mination of organic carbon in soil. Soil Science and Plant Analysis 19:1467–1476.
Zhang, H., M. L. Thompson, and J. A. Sandor. 1988. Compositional differences inorganic matter among cultivated and uncultivated Argiudolls and Hapludalfsderived from loess. Soil Science Society of American Journal 52:216–222.
Organic Carbon in Humic Fractions 971