communications i introduction
TRANSCRIPT

Dr. Talal Skaik 2016 IUG
EELE 3370
Communications I
Introduction
Dr. Talal Skaik 2016
Islamic University of Gaza
Electrical Engineering Department
1
• Communications is the Process of Transmitting Information from a Source to a Destination
• Example of typical communication systems
– Wire-line telephone – Cellular phone
– TV broadcasting system.
– Wireless computer network
– Satellite Communications.
Communications
2 Dr. Talal Skaik 2016 IUG

3
Some examples of communications systems.
Dr. Talal Skaik 2016 IUG

4
Input Transducer
Transmitter Channel
Noise
Receiver
Output transducer
Input Signal
Input Message
Transmitted Signal
Received Signal
Output Signal
Output Message
Communication System Model
Dr. Talal Skaik 2016 IUG

• Source: originates a message (human voice, a television picture, an email, or data message, or data
• Input Transducer: Converts nonelectric (human voice, email text, TV video) into an electric waveform called a message or baseband signal using physical devices (microphone, a computer keyboard, or a camera)
• Transmitter: Modifies the baseband signal for efficient transmission and may consist of A/D converter, an encoder, and a modulator. [Receiver- Demodulator, decoder and D/A.]
• Channel: Medium that convey the electric signals at the transmitter output over a distance. Examples:
• Twisted copper wire – telephone and DSL,
• Coaxial Cable – television and internet,
• Optical fiber or radio link
Communication System Model (cntd)
Dr. Talal Skaik 2016 IUG 5

• Receiver: Reprocesses signals received from the channel by reversing signal modifications made at the transmitter. Removal of noise due to channel.
• Output Transducer: Converts electric signal to its original form (Message)
• Destination: Unit to which message is communicated.
Communication System Model (cntd)
Dr. Talal Skaik 2016 IUG 6
• The Signal is distorted by Channel and Noise, which are random and unpredictable .
• NOISE comes from external and internal sources
• External sources comes from : Interference signals transmitted on nearby channels, lightning, electrical equipment, cell phones emission, etc…
• Internal noise results from thermal motions of electrons in conductors.
• SNR: The signal to noise ratio is defined as the ratio of the signal power to the noise power. The channel distorts the signal and the noise accumulates along the path.
Communication System Model (cntd)
Dr. Talal Skaik 2016 IUG 7

• The signal strength decreases while the noise level remains steady with distance from the transmitter.
• Thus SNR is continuously decreasing along the channel.
• For good results, SNR is supposed to be high. In other words signal power should be high compared to noise power.
Communication System Model (cntd)
Dr. Talal Skaik 2016 IUG 8

Digital Communication System
9
Source Coder
Channel Coder
Modulation
+
Source decoder
Channel decoder
demodulation
Distortion and noise
transmitter
channel
receiver
Source input
Reconstructed Signal output
Dr. Talal Skaik 2016 IUG

Analog and Digital Signals
10
Analog signals values vary continuously. Digital signals value limited to a finite set.
Binary signals have 2 possible values used to represent bit values Bit time T needed to send 1 bit Data rate R = 1/T bits per second
Dr. Talal Skaik 2016 IUG

Analog and Digital Messages
11
Messages could be digital or Analog. Digital Message: Ordered combinations of finite symbols. Example: text document in English, morse code (dash and dot). Analog Messages: Characterized by data whose values vary over a continuous range of time e.g temperature, atmospheric Pressure, speech waveform. Why are digital technologies better and Why are they replacing the analog technologies? Enhanced Immunity to noise and interference. Message extraction from received signal is easier for digital signal since digital decision must belong to the finite-sized alphabet. Detail of received signal is not an issue. In contrast: The waveform shape in analog message carries the needed information, and even slight distortion or interference in the waveform will show up in the received signal.
Dr. Talal Skaik 2016 IUG

Analog and Digital Messages
12
(a) Transmitted signal. (b) Received distorted signal (without noise). (c) Received distorted signal (with noise). (d) Regenerated signal
Dr. Talal Skaik 2016 IUG

Analog to Digital conversion (A/D)
13
Two steps in A/D conversion – sampling and quantization Continuous time signal is sampled into discrete time signal (DTS). Continuous amplitude of the DTS is quantized into discrete level signal. Sampling Theorem: if the highest frequency in signal spectrum is B (in Hz), the signal can be reconstructed from its discrete samples taken uniformly at a rate not less than 2B samples per second.
Dr. Talal Skaik 2016 IUG

Analog to Digital conversion (A/D)
14
Quantization: Sample is approximated or “rounded off” to the nearest quantized level. Given signal m(t), whose amplitude range (–mp, mp), quantizer partitions the signal range into L intervals. Each sample amplitude ~ midpoint of interval. Each sample is represented by one of the L numbers (digitized). Quantized signal is an approximation of original signal. Accuracy improves with increase in L Voice signal L = 8 or 16 is sufficient. Commercial use, L = 32 is minimum, telephone L 128 or 256 commonly used.
Dr. Talal Skaik 2016 IUG

Analog to Digital conversion (A/D)
15
Analog-to-digital conversion of a signal.
Dr. Talal Skaik 2016 IUG

Pulse Coded Modulation
16
The task of Communication system is to transmit the quantized samples (done with the aid of PCM).
Pulse-code modulation (PCM) is a method used to digitally represent sampled analog signals. It is the standard form of digital audio in computers, Compact Discs, digital telephony and other digital audio applications.
In PCM, each quantized sample is represented by an ordered combination of pulses p1(t) and p2(t) where p1(t) represents 1 and p2(t) represents 0.
Each of the L possible samples can be written as a bit string of length log2L. Example: if L=16, each quantized level is described by 4 bits.
The binary case of great practical importance bacause of its simplicity and ease of detection.
Dr. Talal Skaik 2016 IUG

Pulse Coded Modulation
17 Dr. Talal Skaik 2016 IUG

Channel Error
18
If there is too much channel distortion or noise, receiver may make a mistake, and the regenerated signal will be incorrect. Channel coding is needed to detect and correct the message.
Dr. Talal Skaik 2016 IUG

Bandwidth and Power
19
• The fundamental parameters that control the rate and quality of information transmission are the channel bandwidth and the signal power S.
Channel Bandwidth
The bandwidth (BW) of a channel is the range of frequencies that it can transmit with reasonable fidelity .
OR: Difference between the highest and the lowest frequencies in the specific range of frequencies.
• Example: if channel can transmit with reasonable fidelity a signal whose frequency components vary from 0 Hz (dc) up to maximum 5000 Hz (5 KHz), the Channel bandwidth B is 5 KHz.
Dr. Talal Skaik 2016 IUG

Bandwidth and Power
20
• The signal power S plays an important role in information transmission.
• Increasing S reduces the effect of channel noise and thus accurate data is received.
• Signal to Noise Ratio (SNR) means, the higher (strength) the value of the signal compared to Noise, the quality of the signal would be better over a longer distance.
• However, a certain minimum SNR is necessary for communication.
Dr. Talal Skaik 2016 IUG

Channel Capacity, Shannon’s equation
21
• Shannon Theory It establishes that given a noisy channel with
information capacity C and information transmitted at a rate R, then:
– if R<C, there exists a coding technique which allows the probability of error at the receiver to be made arbitrarily small. This means that theoretically, it is possible to transmit information without error up to a limit, C.
– If R>C, the probability of error at the receiver increases as the rate is increased. So no useful information can be transmitted beyond the channel capacity
• Shannon Capacity (equation)
C = B log2(1+ SNR) Dr. Talal Skaik 2016 IUG

Channel Capacity, Shannon’s equation
22
• C – Channel Capacity and is the upper bound of the rate of information transmission per second or is the maximum number of bits that can be transmitted per second with probability of error arbitrarily close to zero.
• Not possible to transmit at a rate higher than this without incurring any error.
• Practical system operate at rates below the shannon rate.
• B and SNR demonstrate ultimate limitation on the rate of communication.
Dr. Talal Skaik 2016 IUG

Example
23
Find the Shannon channel capacity for a telephone channel with BT = 3400 Hz and SNR = 10000
C = 3400 log2 (1 + 10000)
= 3400 log10 (10001)/log102 = 45200 bps
Note that SNR = 10000 corresponds to
SNR (dB) = 10 log10(10001) = 40 dB
Dr. Talal Skaik 2016 IUG

•Message from source – baseband signal because they are
lowpass in nature.
•Baseband signals are not always suitable for direct
transmission over the channel.
•Messages will need to be moved to the right channel
frequency band.
•Modulation: baseband signal is used to modify (i.e modulate),
some parameter of RF carrier signal.
•Carrier: Sinusoid of high frequency.
Modulation and Detection
24 Dr. Talal Skaik 2016 IUG

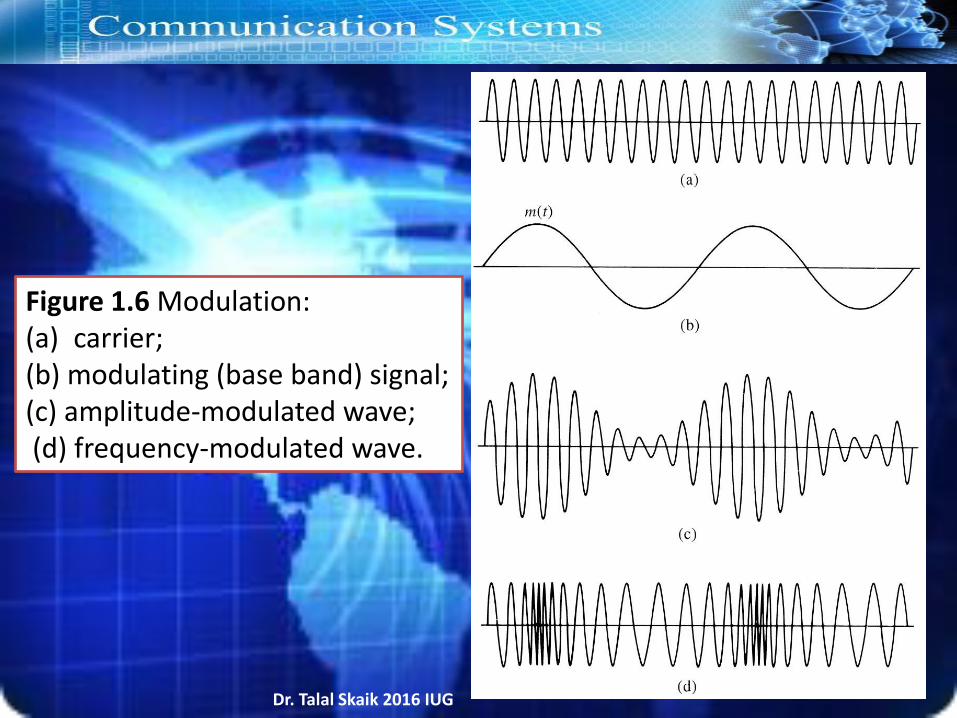
In modulation, one of carrier sinusoidal parameter such as
amplitude, frequency, or phase is varied in proportion to the
baseband signal m(t).
Fig. 1.6 shows a baseband m(t) and the corresponding
Amplitude modulation (AM) and Frequency Modulation (FM)
waveforms after modulation.
Demodulation – Reversal process of modulation to
reconstruct the baseband signal.
Modulation and Detection
25 Dr. Talal Skaik 2016 IUG
26
Figure 1.6 Modulation: (a) carrier; (b) modulating (base band) signal; (c) amplitude-modulated wave; (d) frequency-modulated wave.
Dr. Talal Skaik 2016 IUG

Reason for modulation Ease of radiation/Transmission: radiating antenna is an order of a fraction or more of the wavelength of the driving signal.
Wavelength are usually high for reasonable antenna dimension for baseband signal.
E.g) power in a speech signal is concentrated in the range of 100-3000 Hz, wavelength is 100 to 3000 km which will result in impractically large antenna.
By modulating a high frequency carrier, the signal spectrum is translated to the neighborhood of the carrier frequency that corresponds to a much smaller wavelength.
Modulation and Detection
27 Dr. Talal Skaik 2016 IUG

Reason for modulation Avoid Interference If several signals (for example, all radio stations), each occupying the same frequency band, are transmitted simultaneously over the same transmission medium, they will all interfere. Difficult to separate or retrieve them at a receiver. One solution is to use modulation whereby each radio station is assigned a distinct carrier frequency.
Modulation and Detection
28 Dr. Talal Skaik 2016 IUG
Reason for modulation Each station transmits a modulated signal, thus shifting the signal spectrum to its allocated band, which is not occupied by any other station. When you tune a radio or television set to a particular station, you are selecting one of the many signals being received at that time. Since each station has a different assigned carrier frequency, the desired signal can be separated from the others by filtering.
Modulation and Detection
29 Dr. Talal Skaik 2016 IUG

Demodulation
Requires bandpass filter at the receiver to select the modulated signal at a predetermined frequency band specified by the transmission station or channel.
The carrier variation of amplitude, frequency or phase is converted back into baseband signal voltage.
Demodulator can downconvert the modulated (RF) signals back into baseband signals that represent original source message.
Modulation and Detection
30 Dr. Talal Skaik 2016 IUG

Radio Frequency Bands
31
Classification Band Initials Frequency Range Characteristics
Extremely low ELF < 300 Hz
Ground wave
Infra low ILF 300 Hz - 3 kHz
Very low VLF 3 kHz - 30 kHz
Low LF 30 kHz - 300 kHz
Medium MF 300 kHz - 3 MHz Ground/Sky wave
High HF 3 MHz - 30 MHz Sky wave
Very high VHF 30 MHz - 300 MHz
Space wave
Ultra high UHF 300 MHz - 3 GHz
Super high SHF 3 GHz - 30 GHz
Extremely high EHF 30 GHz - 300 GHz
Tremendously high THF 300 GHz - 3000 GHz
Dr. Talal Skaik 2016 IUG
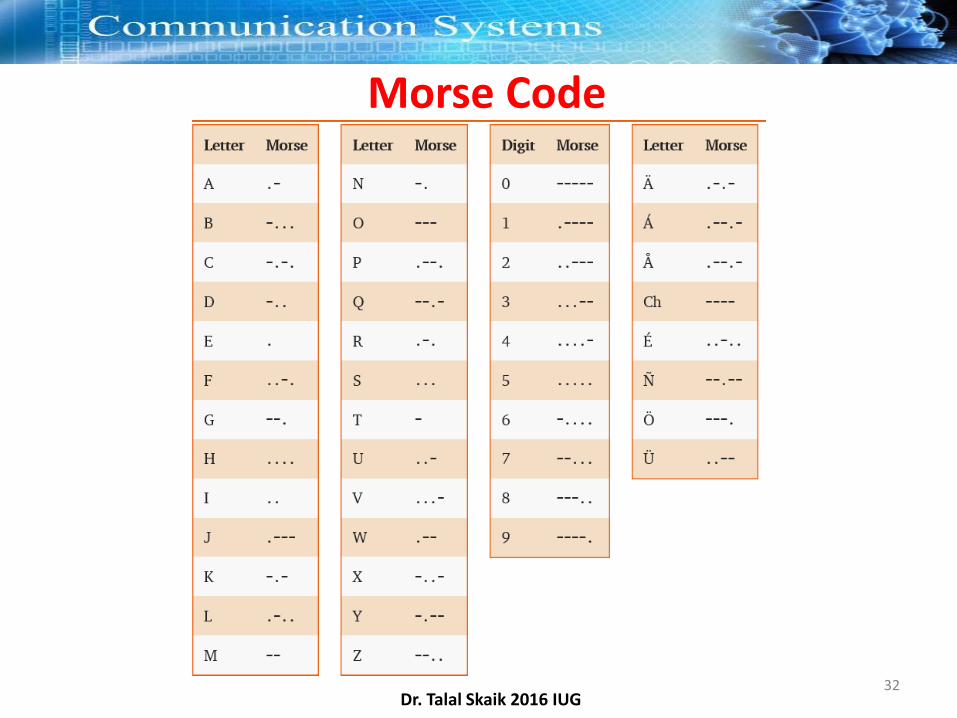
Morse Code
32 Dr. Talal Skaik 2016 IUG